life cycle assessment of the production of hydrogen and
TRANSCRIPT

LETTER • OPEN ACCESS
Life cycle assessment of the production ofhydrogen and transportation fuels from corn stovervia fast pyrolysisTo cite this article: Yanan Zhang et al 2013 Environ. Res. Lett. 8 025001
View the article online for updates and enhancements.
You may also likeBiomass Pyrolysis Liquefaction Technique:State of Research and DevelopmentTrendsJie Li, Nan Li, Yingyun Qiao et al.
-
Towards Sustainable Fuels from BiomassUsing Fast Pyrolysis and Electrocatalysisin Regional DepotsChristopher M. Saffron, Sabyasachi Das,Peyman Fasahati et al.
-
Biofuel Production from Jatropha Bio-OilDerived Fast Pyrolysis: Effect andMechanism of CoMoS Supported on Al2O3T Rodseanglung, T Ratana, MPhongaksorn et al.
-
Recent citationsEffect of pore characteristics on hydrogenreduction kinetics based on a novelanalysis approach combined model-fittingand iso-conversionZhenyang Wang et al
-
Computer-Aided EnvironmentalAssessment Applied for Estimation ofEcological Impacts Derived fromTopological Pathways Based onLignocellulosic Biomass TransformationSamir Isaac Meramo-Hurtado et al
-
Environmental, exergetic and economictradeoffs for catalytic- and fast pyrolysis-to-renewable dieselS. Spatari et al
-
This content was downloaded from IP address 65.21.228.167 on 12/10/2021 at 20:53

IOP PUBLISHING ENVIRONMENTAL RESEARCH LETTERS
Environ. Res. Lett. 8 (2013) 025001 (13pp) doi:10.1088/1748-9326/8/2/025001
Life cycle assessment of the production ofhydrogen and transportation fuels fromcorn stover via fast pyrolysis
Yanan Zhang1, Guiping Hu2,3 and Robert C Brown1,2
1 Department of Mechanical Engineering, Iowa State University, Ames, IA 50011, USA2 Bioeconomy Institute, Iowa State University, Ames, IA 50011, USA3 Industrial and Manufacturing Systems Engineering, Iowa State University, Ames, IA 50011, USA
E-mail: [email protected]
Received 5 November 2012Accepted for publication 11 March 2013Published 4 April 2013Online at stacks.iop.org/ERL/8/025001
AbstractThis life cycle assessment evaluates and quantifies the environmental impacts of theproduction of hydrogen and transportation fuels from the fast pyrolysis and upgrading of cornstover. Input data for this analysis come from Aspen Plus modeling, a GREET (GreenhouseGases, Regulated Emissions, and Energy Use in Transportation) model database and a US LifeCycle Inventory Database. SimaPro 7.3 software is employed to estimate the environmentalimpacts. The results indicate that the net fossil energy input is 0.25 MJ and 0.23 MJ per kmtraveled for a light-duty vehicle fueled by gasoline and diesel fuel, respectively. Bio-oilproduction requires the largest fossil energy input. The net global warming potential (GWP) is0.037 kg CO2eq and 0.015 kg CO2eq per km traveled for a vehicle fueled by gasoline anddiesel fuel, respectively. Vehicle operations contribute up to 33% of the total positive GWP,which is the largest greenhouse gas footprint of all the unit processes. The net GWPs in thisstudy are 88% and 94% lower than for petroleum-based gasoline and diesel fuel (2005baseline), respectively. Biomass transportation has the largest impact on ozone depletionamong all of the unit processes. Sensitivity analysis shows that fuel economy, transportationfuel yield, bio-oil yield, and electricity consumption are the key factors that influencegreenhouse gas emissions.
Keywords: life cycle assessment, fast pyrolysis, bio-oil upgrading, greenhouse gas emission,energy demand
1. Introduction
Growing concerns over greenhouse gas (GHG) emissionsfrom petroleum-based fuel consumption have promptedinterest in the production of alternative transportation fuelsfrom biorenewable sources. As required by the EnergyIndependence and Security Act of 2005, the US Environ-
Content from this work may be used under the terms ofthe Creative Commons Attribution 3.0 licence. Any further
distribution of this work must maintain attribution to the author(s) and thetitle of the work, journal citation and DOI.
mental Protection Agency (EPA) finalized the RenewableFuel Standard (RFS) and mandated petroleum refineriesand oil importers to increase the volume of renewablefuel that is blended into petroleum-based transportationfuels. Life cycle assessment (LCA), a standard evaluationmethod of environmental impact, is increasingly beingused to evaluate biofuel production systems. In previouslife cycle assessments, evaluations have emphasized theenvironmental impacts of ethanol-based transportation fuels(Bai et al 2010, Gonzalez-Garcıa et al 2010, Hsu et al2010, Kauffman et al 2011, Kemppainen and Shonnard 2005,Luo et al 2009a, Pawelzik and Zhang 2012, Singh et al
11748-9326/13/025001+13$33.00 c© 2013 IOP Publishing Ltd Printed in the UK

Environ. Res. Lett. 8 (2013) 025001 Y Zhang et al
2010, Spatari et al 2010, 2005). The majority of thesestudies found that bioethanol has fewer GHG emissions thanpetroleum-based gasoline and diesel, which can potentiallyimprove the environmental performance of the transportationand energy sectors. In these studies, both first generation(such as corn grain) and second generation feedstocks, (forexample, corn stover, forest residues, and switchgrass) wereanalyzed for bioethanol production using both biochemicaland thermochemical pathways.
The Energy Independence and Security Act of 2007amended RFS to RFS2, which expanded the mandate for theutilization of 36 billion gallons of biofuel annually in 2022,of which no more than 15 billion gallons can be ethanolfrom corn starch, and no less than 16 billion must be fromcellulosic biofuels (US Congress 2007). RFS2 also mandatesthe inclusion of other biofuels such as biodiesel into thepetroleum-based fuel supply and requires renewable fuelsother than corn-based ethanol with at least a 50% reductionof GHG emissions (60% for cellulosic biofuels) compared topetroleum-based gasoline and diesel (US Congress 2007). Theissue of RFS2 drives a growing interest in advanced biofuelsproduction such as renewable gasoline and diesel fuels fromsecond generation feedstocks.
Fast pyrolysis, which is carried out at a moderatetemperature (around 500 ◦C) and short reaction time (abouttwo seconds), has attracted considerable interest as a meansfor converting biomass fuels and residues into biofuels(Bridgwater 2012). Fast pyrolysis can generate up to 75 wt%of liquid bio-oil, which can then be used in variousapplications such as supplying energy for transportation,heating, and electricity generation (Czernik and Bridgwater2004). With the growing interest in fast pyrolysis ofbiomass and catalytic upgrading of the resulting bio-oil intohydrocarbon fuels, a number of LCA studies have beenrecently conducted to explore the environmental impacts ofthis pathway to biofuels (Fan et al 2011, Heracleous 2011,Hsu 2012, Iribarren et al 2012, Kauffman et al 2011, Zhonget al 2010). In these studies, different types of biomassfeedstocks (willow, poplar, wood logging residue, corn stoveretc) were investigated and various applications of the bio-oilwere examined, such as power generation from bio-oilcombustion and hydrogen production from steam reformingof bio-oil.
Catalytic upgrading methods can be employed to upgradebio-oil to a variety of gaseous and liquid fuels including dieselfuel, gasoline, kerosene, and methane (Bridgwater 2012).However, only a small number of LCAs have been conductedon the production of renewable gasoline and diesel fuel frombiomass fast pyrolysis and upgrading. Hsu (2012) conducteda well-to-wheel analysis of transportation fuel from the fastpyrolysis and upgrading of forest residues, based on data froma Pacific Northwest National Laboratory (PNNL) processdesign report (Jones et al 2009). An uncertainty analysis forGHG emissions was also conducted in this study and foundthat all scenarios considered had lower GHG emissions thanpetroleum-based gasoline. Iribarren et al (2012) performed anLCA for fast pyrolysis and upgrading of woody biomass usinga cradle-to-gate approach. Kauffman et al (2011) conducted
an LCA for combined ethanol and drop-in fuels productionfrom corn grain and corn stover cornstover, respectively,on the basis of an hectare farmland and found that a 52%reduction in GHG emissions was possible.
In all of these studies, hydrotreating is employed todeoxygenate bio-oil to hydrocarbons. Hydrotreating, doneeither in a single stage or two stages, is a commonpretreatment in the oil refinery process, but it requiresa large amount of hydrogen. Currently, the majority ofindustrial hydrogen is obtained from steam reforming ofnatural gas (Milbrandt and Mann 2009). However, hydrogencan be produced from other sources. The aqueous phase ofbio-oil contains carbohydrate-derived compounds that can becatalytically steam reformed to renewable hydrogen (Medranoet al 2011). Catalytic steam reforming of bio-oil compoundshas been investigated in previous studies (Basagiannis andVerykios 2007, Chen et al 2011, Czernik et al 2007,Domine et al 2008, Garcia et al 2000, Hou et al 2009,Liu et al 2011, Medrano et al 2011, Ortiz-Toral et al 2011,Seyedeyn-Azad et al 2011, Thaicharoensutcharittham et al2011, Vagia and Lemonidou 2008, Yan et al 2010, Zhang et al2011). In these studies, various metal-supported catalysts,bio-oil modeling components, pyrolysis reactor designs, andbiomass-feedstock selections have been tested and comparedfor their efficiency in biohydrogen production. Throughhydrogen production via a bio-oil reforming pathway, naturalgas consumption could be reduced. In this study, theenvironmental impacts of the production of hydrogen andtransportation fuels from corn stover fast pyrolysis andupgrading are evaluated.
The objective of this study is to perform a life cycleassessment of the environmental impacts of the productionof hydrogen and transportation fuels from the fast pyrolysisand upgrading of corn stover. An Aspen Plus model ofthe pyrolysis and upgrading processes in combination witha GREET model database and a US Life Cycle InventoryDatabase provide data to support the LCA using SimaPro 7.3.
2. Description for the biofuel production pathway
The plant capacity for the fast pyrolysis and bio-oil upgradingfacility is assumed to be 2000 metric tons per day of drybiomass feedstock and the bio-oil yield is assumed to be 65%of the dry biomass, based on a previous techno-economicanalysis we have performed (Zhang et al 2013b). Cornstover is selected as the feedstock for the production ofhydrogen and transportation fuels. Bio-oil production fromraw feedstock includes biomass preprocessing, biomassfast pyrolysis, bio-oil recovery, solids removal, and heatgeneration. All of the five steps are identical to those ofprevious techno-economic analyses (Brown et al 2011, 2012,Wright et al 2010a, Zhang et al 2013a). In the biomasspreprocessing step, biomass containing 25 wt% moisture ischopped to 10 mm particle diameter, dried to 7 wt% moisturecontent, and ground to 3 mm particle diameter. In the fastpyrolysis step, biomass is converted into non-condensablegases, bio-oil vapors, and solid char phases in a fluidized bedreactor operating at 500 ◦C and ambient pressure. The bio-oil
2
Environ. Res. Lett. 8 (2013) 025001 Y Zhang et al
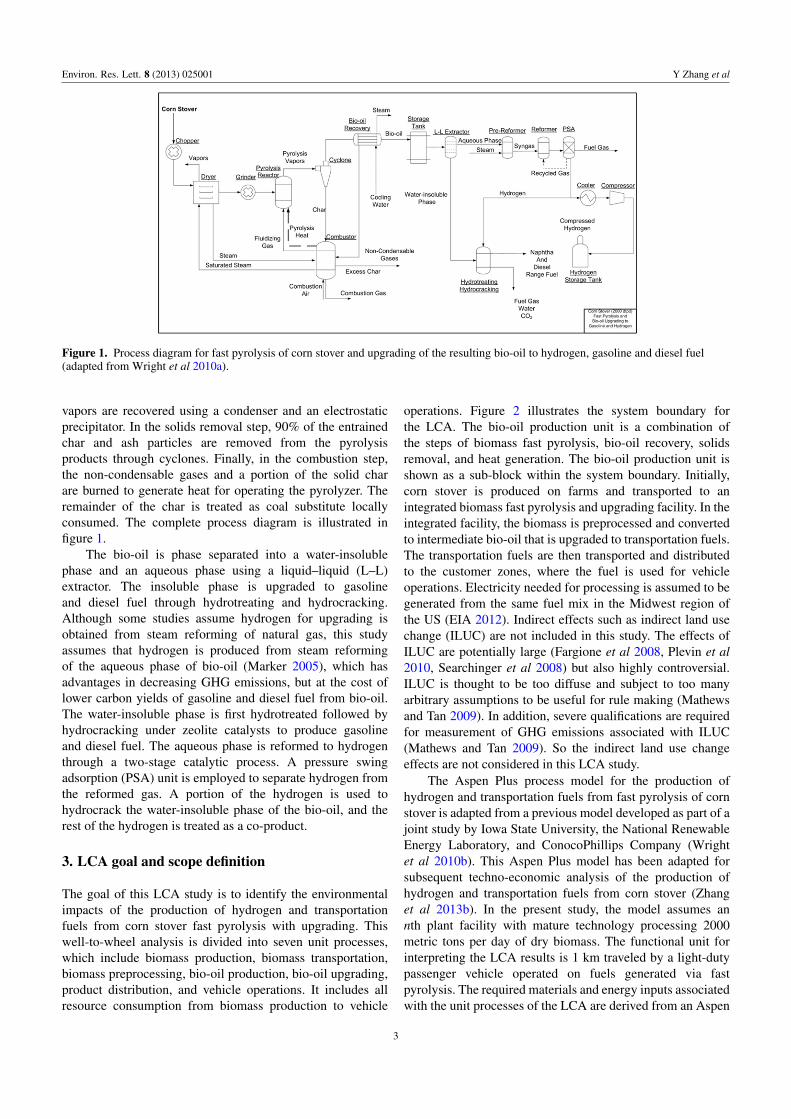
Figure 1. Process diagram for fast pyrolysis of corn stover and upgrading of the resulting bio-oil to hydrogen, gasoline and diesel fuel(adapted from Wright et al 2010a).
vapors are recovered using a condenser and an electrostaticprecipitator. In the solids removal step, 90% of the entrainedchar and ash particles are removed from the pyrolysisproducts through cyclones. Finally, in the combustion step,the non-condensable gases and a portion of the solid charare burned to generate heat for operating the pyrolyzer. Theremainder of the char is treated as coal substitute locallyconsumed. The complete process diagram is illustrated infigure 1.
The bio-oil is phase separated into a water-insolublephase and an aqueous phase using a liquid–liquid (L–L)extractor. The insoluble phase is upgraded to gasolineand diesel fuel through hydrotreating and hydrocracking.Although some studies assume hydrogen for upgrading isobtained from steam reforming of natural gas, this studyassumes that hydrogen is produced from steam reformingof the aqueous phase of bio-oil (Marker 2005), which hasadvantages in decreasing GHG emissions, but at the cost oflower carbon yields of gasoline and diesel fuel from bio-oil.The water-insoluble phase is first hydrotreated followed byhydrocracking under zeolite catalysts to produce gasolineand diesel fuel. The aqueous phase is reformed to hydrogenthrough a two-stage catalytic process. A pressure swingadsorption (PSA) unit is employed to separate hydrogen fromthe reformed gas. A portion of the hydrogen is used tohydrocrack the water-insoluble phase of the bio-oil, and therest of the hydrogen is treated as a co-product.
3. LCA goal and scope definition
The goal of this LCA study is to identify the environmentalimpacts of the production of hydrogen and transportationfuels from corn stover fast pyrolysis with upgrading. Thiswell-to-wheel analysis is divided into seven unit processes,which include biomass production, biomass transportation,biomass preprocessing, bio-oil production, bio-oil upgrading,product distribution, and vehicle operations. It includes allresource consumption from biomass production to vehicle
operations. Figure 2 illustrates the system boundary forthe LCA. The bio-oil production unit is a combination ofthe steps of biomass fast pyrolysis, bio-oil recovery, solidsremoval, and heat generation. The bio-oil production unit isshown as a sub-block within the system boundary. Initially,corn stover is produced on farms and transported to anintegrated biomass fast pyrolysis and upgrading facility. In theintegrated facility, the biomass is preprocessed and convertedto intermediate bio-oil that is upgraded to transportation fuels.The transportation fuels are then transported and distributedto the customer zones, where the fuel is used for vehicleoperations. Electricity needed for processing is assumed to begenerated from the same fuel mix in the Midwest region ofthe US (EIA 2012). Indirect effects such as indirect land usechange (ILUC) are not included in this study. The effects ofILUC are potentially large (Fargione et al 2008, Plevin et al2010, Searchinger et al 2008) but also highly controversial.ILUC is thought to be too diffuse and subject to too manyarbitrary assumptions to be useful for rule making (Mathewsand Tan 2009). In addition, severe qualifications are requiredfor measurement of GHG emissions associated with ILUC(Mathews and Tan 2009). So the indirect land use changeeffects are not considered in this LCA study.
The Aspen Plus process model for the production ofhydrogen and transportation fuels from fast pyrolysis of cornstover is adapted from a previous model developed as part of ajoint study by Iowa State University, the National RenewableEnergy Laboratory, and ConocoPhillips Company (Wrightet al 2010b). This Aspen Plus model has been adapted forsubsequent techno-economic analysis of the production ofhydrogen and transportation fuels from corn stover (Zhanget al 2013b). In the present study, the model assumes annth plant facility with mature technology processing 2000metric tons per day of dry biomass. The functional unit forinterpreting the LCA results is 1 km traveled by a light-dutypassenger vehicle operated on fuels generated via fastpyrolysis. The required materials and energy inputs associatedwith the unit processes of the LCA are derived from an Aspen
3

Environ. Res. Lett. 8 (2013) 025001 Y Zhang et al
Figure 2. Life cycle system boundary for the production ofhydrogen and transportation fuels from corn stover via fast pyrolysisand upgrading.
Plus model (Zhang et al 2013b) along with GREET model(Argonne National Laboratory 2011) and US Life CycleInventory Database (National Renewable Energy Laboratory2012). SimaPro 7.3 software with an Eco-invent 2.2 databaseis employed to estimate environmental aspects such as climatechange, fossil energy input, land use, and ozone layer impactsfor the primary unit processes. IPCC 2007 GWP 100a,Cumulative Energy Demand (CED), and TRACI 2 methodsdeveloped by the US Environmental Protection Agency (EPA)are used to calculate life cycle impacts. The IPCC 2007GWP 100a method is employed to evaluate life cycle GHGemissions for the production of hydrogen and transportationfuels from corn stover (IPCC 2007). The Cumulative EnergyDemand (CED) method (Goedkoop et al 2008) is used toestimate the energy demand for the production of hydrogenand transportation fuels. The TRACI 2 method (Bare et al2002) is employed to evaluate other potential environmentalimpacts (acidification, eutrophication, ecotoxicity, etc).
4. Inventory analysis
4.1. Biomass production
Biomass production is based on the cultivation and collectionof corn stover residue. The input energy and GHG emissionsassociated with corn stover cultivation and collection areincluded in the overall inventory analysis. Inventory data for
Table 1. Inventory data for biomass production.
Item Amount Unit
OutputsCollected corn stover 1 kgResourcesBiomass energy 15.4 MJMaterials and fuelsN fertilizer 8.5 gP2O5 2.2 gK2O 13.2 gDiesel fuel for corn stover loader 0.12 gDiesel fuel for corn stover collection 5.15 gEmission to airN2O 0.085 gNO 0.12 g
corn stover collection is compiled from a US Life CycleInventory Database (National Renewable Energy Laboratory2012) and a GREET model (Argonne National Laboratory2011). The low heating value (LHV) for corn stover isassumed to be 15.4 MJ kg−1 (National Renewable EnergyLaboratory 2012). The yield of corn stover is assumed to be2.1 dry tons acre−1 (Han et al 2011). The mass ratio andenergy content ratio of stover to corn produced in agricultureare roughly 1:1 (Kim and Dale 2004, Pordesimo et al 2005).We assume a corn stover removal rate of 62% from a previousLCA (Spatari et al 2005). The ratio of energy and emissionsallocation between corn and stover for partitioning is assumedto be 1:0.62 (Spatari et al 2005). Diesel fuel input data forthe corn stover production is adopted from the GREET model(Argonne National Laboratory 2011).
Traditionally, the bulk of corn stover has been left in thefield to replenish the soil with nitrogen (N), phosphorus (P),and potassium (K) (Han et al 2011). If the corn stover is usedfor biofuels production, it will require farmers to replenishlost nutrients through supplementary fertilization (Han et al2011). Based on the GREET model analysis, the replacementrates for N, P, and K fertilizer sources are 7700 g N, 2000 gP2O5 (873 g P) and 12 000 g K2O (9957 g K) for 1 ton ofremoved corn stover (Argonne National Laboratory 2011).Direct N2O and NO emissions from agricultural soil due toN fertilizer application are assumed to be 1.325% and 0.65%(Argonne National Laboratory 2011). Diesel fuel is consumedduring biomass production. All of the input data for biomassproduction are detailed in table 1.
4.2. Biomass transportation
For biomass transportation, it is assumed that the wetfeedstock, which contains 25 wt% moisture, is transportedby 40 ton trucks (one way). The transportation distance offeedstock is 60 miles one way for corn stover, based onanalysis of the GREET model (Argonne National Laboratory2011). The delivered wet biomass is 2670 metric tonswith 25 wt% moisture. Detailed input data for the biomasstransportation are summarized in table 2.
4

Environ. Res. Lett. 8 (2013) 025001 Y Zhang et al
Table 2. Inventory data for biomass transportation.
Item Amount Unit
OutputsDelivered corn stover 2 670 Metric tonInput from materialTruck 40 ton 284 000 ton kmCollected corn stover 2 670 Metric ton
Table 3. Inventory data for biomass preprocessing.
Item Amount Unit
OutputsPretreated corn stover 2 150 Metric tonMaterials and fuelsDelivered corn stover 2 670 Metric tonSteam 184 Metric tonElectricity for chopping 44 600 kWhElectricity for grinding 109 000 kWhElectricity for compressor 124 000 kWhEmission to airWater 519 Metric ton
4.3. Biomass preprocessing
In the drying step, steam is employed to remove waterfrom the biomass. For the inventory analysis of biomasspreprocessing, the electricity and steam usages are consideredas material inputs and the ejected water vapor from the dryingstep is considered an emission to the air (see table 3). Theelectricity requirement for reducing biomass particle size iscalculated from the correlation developed by Mani et al(2004).
4.4. Bio-oil production
The inventory analysis of bio-oil production includes theinventory for biomass fast pyrolysis, bio-oil recovery, solidsremoval, and heat generation (see table 4). In the biomass fastpyrolysis and recovery processes, a portion of the generatedchar is sent to a combustor to supply heat for pyrolysis. Theheating value of the char is assumed to be 27.5 MJ kg−1
(Wright et al 2010b). The non-condensable gases and part ofthe char generated during pyrolysis provide sufficient heat tooperate the pyrolyzer. The excess char is treated as a productthat displaces coal with an assumed heating value that is halfthat of the coal it displaces. Local consumption of excesschar is assumed, so char transport is not considered for localconsumption.
The electricity, air, and process water are consideredto be the inputs while the bio-oil is considered to be theoutput. The electricity inputs include electricity for biomasspyrolysis, bio-oil recovery, and char combustion, which arecollected from the Aspen Plus model (Zhang et al 2013b).The process water is mainly used in bio-oil recovery, and airprovides oxygen for combustion of non-condensable gasesand char. The emissions from the bio-oil production unitare gases and solids, including carbon oxides, hydrocarbons,nitrogen oxides, sulfide, PM10, and ash. Combustion accounts
Table 4. Inventory data for bio-oil production.
Item Amount Unit
OutputsCorn stover bio-oil 1300 Metric tonChar 216 Metric tonAvoided productsCoal 216 Metric tonResourcesAir 4300 Metric tonProcess water 8010 Metric tonMaterials and fuelsPretreated corn stover 2150 Metric tonElectricity for pyrolysis 543 000 kWhEmission to airN2 1330 Metric tonO2 20.0 Metric tonH2 1.5 Metric tonCO 113 Metric tonCO2 754 Metric tonWater 114 Metric tonNH3 0.000 024 Metric tonNO 2.4 Metric tonNO2 0.000 17 Metric tonSulfur 0.059 Metric tonSO2 0.16 Metric tonCOS 0.000 38 Metric tonH2S 0.000 84 Metric tonN2O 0.000 14 Metric tonHCN 0.000 048 Metric tonPM10 2.7 Metric tonWaste or emissions to treatmentAsh 84.9 Metric ton
for virtually all of the PM10 particulate emissions fromprocessing-related activities. Studies of the emission behaviorand characteristics of PM10 from combustion of biochar orcoal show that there is a correlation between the inherent ashcontent and the amount of PM10 emitted (Gao and Wu 2011,Zhang and Ninomiya 2006). For PM10 emission calculations,linear regression was used to identify the correlation betweenash content and the wt% of coal ash transferred into PM10,as reported in the literature (Gao and Wu 2011). The ashseparated in cyclones is disposed to sanitary landfills for wastetreatment.
4.5. Bio-oil upgrading
The final products are gasoline, diesel fuel and hydrogen frombio-oil upgrading. The total gasoline and diesel fuel yield is164.6 metric ton day−1 (50% share of gasoline and 50% shareof diesel), and the hydrogen yield is 63 metric ton day−1.Hydrogen is assumed to be a co-product with productdisplacement based on the displaced usage of natural gas.Based on a previous study, 3.53 kg of natural gas is requiredfor 1 kg of hydrogen production (Koroneos et al 2004).The environmental impacts allocation is based on the massallocation between gasoline and diesel, which is 50% of thetotal environmental burden. The inventory inputs include air,catalysts, process water, electricity, and bio-oil. The processwater includes water used for gas cooling and separation.
5

Environ. Res. Lett. 8 (2013) 025001 Y Zhang et al
Table 5. Inventory data for bio-oil upgrading.
Item Amount Unit
OutputsGasoline 82.3 Metric tonDiesel fuel 82.3Hydrogen 63.2 Metric tonAvoided productsNatural gas (in ground) 223 Metric tonResourcesAir 1500 Metric tonProcess water 12 300 Metric tonMaterials and fuelsCorn stover bio-oil 1250 Metric tonElectricity for upgrading 291 000 kWhZeolite powder 0.45 Metric tonNi-based catalyst 0.73 Metric tonEmission to airN2 1160 Metric tonO2 234 Metric tonCO 0.0015 Metric tonCO2 1070 Metric tonWater 906 Metric tonCH4 0.007 Metric tonC3H6 0.000 12 Metric tonCH2O2 0.000 14 Metric tonNO2 0.000 14 Metric tonWaste or emissions to treatmentWaste water 582 Metric ton
The waste water from bio-oil upgrading step is assumed to besent to a waste water treatment plant. The catalysts employedin bio-oil upgrading are zeolite powders (0.45 metric ton) forhydrocracking and Ni-based catalysts (0.73 metric ton) forhydrotreating, with consumption based on gas hourly spacevelocities (GHSV). Details of the inventory data are shown intable 5.
4.6. Product transportation and distribution
For gasoline transportation, we assume transportation bybarge, pipeline, and rail apportioned as 8%, 63%, and29%, respectively. The distances for the three modes are520 km, 400 km and 800 km, respectively. For diesel fueltransportation, we assume transportation by barge, rail andtruck apportioned as 8%, 29% and 63%, respectively. Thedistances for the three modes are 520 km, 800 km and 50 km,respectively. Gasoline and diesel fuel are locally distributedby truck with an average travel distance of 30 km. All theassumptions and data are based on the GREET model’sfast pyrolysis pathway (Argonne National Laboratory 2011).Details of the inventory analysis for gasoline and diesel fueltransportation and distribution are shown in tables 6 and 7.
4.7. Vehicle operations
Gasoline emissions are assumed for a vehicle operated using50% conventional and 50% reformulated gasoline. Gasolineemissions are based on combustion in a spark-ignition enginewhile diesel fuel emissions are based on combustion in adirect-injection compression ignition engine using low-sulfur
Table 6. Inventory data for gasoline transportation and distribution.
Item Amount Unit
OutputsDelivered gasoline 82.3 Metric tonInput from material/telescopeGasoline 82.3 Metric tonBarge 6070 ton kmPipeline 36 800 ton kmRail 33 900 ton kmTruck 40 ton (distribution) 4380 ton km
Table 7. Inventory data for diesel fuel transportation anddistribution.
Item Amount Unit
OutputsDelivered diesel fuel 82.3 Metric tonInput from material/telescopeGasoline 82.3 Metric tonBarge 6070 ton kmRail 33 900 ton kmTruck 40 ton (transportation) 4600 ton kmTruck 40 ton (distribution) 4380 ton km
Table 8. Inventory data for vehicle operations fueled bypyrolysis-derived gasoline.
Name Amount Unit
OutputsCar operation, by gasoline 1 mileMaterials and fuelsDelivered gasoline 0.121 kgEmission to airVOC 0.18 gCO 3.75 gNOx 0.141 gPM10 0.029 gPM2.5 0.015 gSulfur oxides 0.006 12 gCH4 0.0146 gN2O 0.012 gCO2 371 g
diesel. The mass density and heating value of low-sulfur dieselfuel is assumed. The fuel economy for gasoline and dieselfuel are 23.4 and 28.1 MPG (miles per gallon), respectively.All of the stated assumptions and required data for assumedvehicle operations are based on default values of the GREETmodel (Argonne National Laboratory 2011). The inventorydata of vehicle operations on gasoline and diesel fuel basesare described in tables 8 and 9.
5. Results and discussions
5.1. Fossil energy input
Figure 3 shows the breakdown of fossil energy input forvarious unit processes on the bases of gasoline and diesel fuel.The fossil energy input is separated into two parts: requiredfossil energy for various unit processes and co-products
6

Environ. Res. Lett. 8 (2013) 025001 Y Zhang et al
Figure 3. Fossil fuel energy inputs for various unit processes per km traveled. Note: biochar and hydrogen credits are treated as negativefossil energy inputs.
Table 9. Inventory data for vehicle operations fueled bypyrolysis-derived diesel fuel.
Name Amount Unit
OutputsCar operation, by diesel fuel 1 mileMaterials and fuelsDelivered diesel fuel 0.113 kgEmission to airVOC 0.088 gCO 0.539 gNOx 0.141 gPM10 0.030 gPM2.5 0.016 gSulfur oxides 0.002 gCH4 0.003 gN2O 0.012 gCO2 322 g
credits (shown as negative fossil energy input). As indicatedin the figure, bio-oil production has the largest fossil energyinput. It consumes 32% of the total required fossil energyamong all the unit processes. In the bio-oil production unit,char is treated as a coal substitute, which contributes to1.34 MJ km−1 and 1.25 MJ km−1 reductions to the totalfossil energy input. Biomass production has the secondlargest fossil fuel demand of approximately 22% of thetotal required fossil energy for both gasoline and diesel fuelbases. Biomass preprocessing also plays a significant role,which demands approximately 21% of the total required fossilenergy. Electricity consumption during biomass chopping,grinding, and drying is responsible for the largest fossil energyinput for biomass preprocessing. Bio-oil upgrading consumesapproximately 20% of the fossil energy input. Hydrogen as aco-product is produced from bio-oil steam reforming, whichresults in avoided use of natural gas in the bio-oil upgradingunit. Consequently, 5.1 MJ km−1 and 4.8 MJ km−1 aresubtracted from the total fossil energy input as hydrogencredits. Due to the hydrogen and char credits, the net fossil
energy input is 0.25 MJ km−1 and 0.23 MJ km−1 for gasolineand diesel fuel bases, respectively.
5.2. GHG emission
Figure 4 details the breakdown of the various contributions ofunit process to GWP for both gasoline and diesel fuel bases. Inthe biomass production step, GWP contributions are separatedinto two parts: CO2 absorption during biomass cultivationand CO2 emissions during biomass harvesting. For 1 kg cornproduction, the atmosphere can uptake 1.49 kg CO2 duringcultivation based on the US Life Cycle Inventory Database(National Renewable Energy Laboratory 2012). The amountof CO2 absorption allocated to corn stover is assumed ona basis of mass fraction. We assume corn stover occupies38% mass fraction of total participating corn and stover; thus,the CO2 absorption contributed by corn stover is 38% of thewhole CO2 absorption of 1 kg corn production. As a result,1 kg corn stover could uptake 0.57 kg CO2.
For a light-duty vehicle fueled by gasoline, the totalcorn stover CO2 absorption is 0.69 kg CO2 eq km−1, andthe total positive GWP (excluding feedstock absorption) is0.73 kg CO2 eq km−1. Vehicle operations exhibit the largestGHG footprint, contributing 33% of total positive GWP for agasoline basis. Bio-oil production has the second largest GHGemissions, contributing 25% of total positive GWP. This isbecause bio-oil production involves char and non-condensablegas combustion, which release direct GHG emissions to theenvironment. Biomass preprocessing has a 16% contributionto total GWP.
The large quantity of GHG emissions associated withelectricity usage in biomass preprocessing is the mainreason for this large GWP contribution. Bio-oil upgradingcontributes 9% of the total positive GWP because the reducedGWP from avoided natural gas is subtracted from the totalGWP as a hydrogen credit. This means that hydrogenproduction from bio-oil steam reforming as co-product makesconsiderable contribution to GWP reduction in this step.
7

Environ. Res. Lett. 8 (2013) 025001 Y Zhang et al
Figure 4. Contributions of unit process to global warming reported on a per km traveled basis. Note: biomass CO2 absorption is treated as anegative contribution to total GWP.
Table 10. Environmental profile of gasoline and diesel products (based on 1 km traveled by light-duty vehicle).
Impact category Unit Gasoline Diesel
Ozone depletion kg CFC-11 eq 6.93× 10⁻⁸ 6.07× 10⁻⁸
Smog kg O3 eq 0.076 0.071Acidification mol H+ eq 0.28 0.27Eutrophication kg N eq 0.17 0.16Carcinogenics CTUh 2.07× 10⁻⁸ 1.92× 10⁻⁸
Non-carcinogenics CTUh 7.29× 10⁻⁸ 6.82× 10⁻⁸
Respiratory effects kg PM10 eq 0.000 65 0.000 61Ecotoxicity CTUe 0.45 0.42
Biomass transportation and product distribution have thesmallest contributions among all of the steps, representing 3%and 0.5% of the total positive GWP for both gasoline anddiesel fuel bases.
For a light-duty vehicle using diesel fuel, the total cornstover CO2 absorption is 0.66 kg CO2 eq km−1, and the totalpositive GWP (excluding feedstock absorption) is 0.66 kgCO2 eq km−1. It has a similar breakdown of contributionsamong the various unit processes but smaller GWP comparedto travel in a light-duty vehicle using gasoline. This is becausediesel fuel has better fuel economy than gasoline, even afterconsidering the differences in energy content for gasoline anddiesel. The net GWP traveled using gasoline and diesel fuelare 0.037 and 0.015 kg CO2 eq km−1, respectively.
5.3. Other impact categories
Other potential environmental impacts such as acidification,eutrophication, and ecotoxicity are evaluated by TRACI2 method. Table 10 presents the potential environmentalimpacts of the gasoline and diesel fuel products.
Figure 5 shows the relative contributions of different unitprocess to the potential environmental impacts on a gasolinebasis. Biomass transportation has the largest contribution(55%) for ozone depletion among the unit processes. Forsmog, acidification, and eutrophication, bio-oil production has
the largest contribution, which is up to 53% contribution tothe total impact. Bio-oil upgrading has significant impacts oneutrophication, carcinogenics, non-carcinogenics, respiratoryeffects and ecotoxicity, with contributions ranging from28% to 46%. Vehicle operations have comparatively smallcontributions to smog, acidification, and respiratory effects,representing less than 5%.
5.4. Comparison to previous studies
Table 11 compares GHG emissions and fossil energy inputsdetermined in the present study to results from severalprevious LCAs of biomass-derived transportation fuels. Thefirst case is an analysis performed by the National RenewableEnergy Laboratory (NREL) (Hsu 2011) based on fastpyrolysis of forest residue with bio-oil hydroprocessing togasoline and diesel fuel (Case A in table 11) as proposed byPacific Northwest National Laboratory (PNNL) (Jones et al2009). Compared to this case, the net GHG emissions ongasoline and diesel fuel bases for the present study are lowerby 68% and 65%, respectively. This is mainly because thepresent study assumes hydrogen for hydrotreating comes fromsteam reforming of bio-oil whereas the NREL study assumeshydrogen comes from steam reforming of natural gas.
The next three cases are variations of an LCA for anintegrated biorefinery based on the GREET model (Cases
8

Environ. Res. Lett. 8 (2013) 025001 Y Zhang et al
Figure 5. Contribution of unit processes to potential environmental impacts (gasoline basis).
Table 11. Comparison results of environmental impacts for 1 km driven by car operated on gasoline or diesel fuel.
Gasoline basis GHG emissions (kg CO2 eq km−1) Fossil energy input (MJ km−1)
Pyrolysis gasoline for the current study 0.037 0.25Case A: pyrolysis gasoline from forestresiduea
0.117 1.7
Case B1: pyrolysis gasoline from cornstover (hydrogen from bio-oil reforming)b
0.0422 0.4
Case B2: pyrolysis gasoline from cornstover (hydrogen from natural gas steamreforming)b
0.0975 1.22
Case B3: pyrolysis gasoline from forestresidue (hydrogen from natural gas steamreforming)b
0.115 1.5
Case C: ethanol via gasificationc 0.15 1.2Case D: 2005 petroleum-based gasolined 0.3 4.5
Diesel fuel basis GHG emissions (kg CO2 eq km−1) Fossil energy input (MJ km−1)
Pyrolysis diesel fuel for the current study 0.015 0.23Case A: pyrolysis diesel fuel from forestresiduea
0.098 1.42
Case B1: pyrolysis diesel fuel from cornstover (hydrogen from bio-oil reforming)b
0.0354 0.325
Case B2: pyrolysis diesel fuel from cornstover (hydrogen from natural gas steamreforming)b
0.0814 1.02
Case B3: pyrolysis diesel fuel from forestresidue (hydrogen from natural gas steamreforming)b
0.0963 1.22
Case D: 2005 petroleum-based diesel fueld 0.258 3.1
a Data is from NREL report (Hsu 2011). b Data is from GREET model (Han et al 2011). c Data is from Hsu et al (2010).d Data is from GREET model (Han et al 2011).
B1, B2 and B3 in table 11). These cases are: transportationfuels from fast pyrolysis of forest residue with hydrogenfrom natural gas reforming (Case B1), transportation fuelsfrom fast pyrolysis of corn stover with hydrogen fromnatural gas reforming (Case B2) and transportation fuelsfrom fast pyrolysis of corn stover with hydrogen from bio-oilreforming (Case B3). Production of both hydrogen andtransportation fuels from corn stover has less GHG emissionsthan the other cases. For Case B1, the amount of internalhydrogen production from bio-oil reforming is only used for
hydrotreating so there is no excess hydrogen as co-product.The amount of GHG emissions for the present study on agasoline basis is 12% lower than for Case B1. The presentstudy showed 62% and 68% reductions in GHG emissionson a gasoline basis compared to Case B2 and Case B3,respectively.
The present study is also compared to ethanol productionvia indirect gasification of forest residue and mixed alcoholsynthesis process (Case C in table 11) (Hsu et al 2010),which has the largest GHG emissions and fossil energy
9

Environ. Res. Lett. 8 (2013) 025001 Y Zhang et al
Figure 6. Sensitivity of GHG emissions to operating conditions on a gasoline basis (changes in operating parameters are expressed as apercentage of the baseline case).
Figure 7. Sensitivity of GHG emissions to operating conditions on a diesel fuel basis (changes in operating parameters are expressed as apercentage of the baseline case).
input for biofuels among the previous studies examined(0.15 CO2 eq km−1 and 0.258 CO2 eq km−1 on a gasolinebasis and diesel fuel basis, respectively). Greenhouse gasemissions from petroleum-based gasoline and diesel fuel in2005 (Case D in table 11) are assumed to be 0.3 and 0.258 kgCO2 eq km−1 which are based on an well-to-wheel analysisusing the GREET model (Han et al 2011). Net GWP for thepresent study are 88% and 94% lower than petroleum-basedgasoline and diesel fuel GHG emissions in 2005, respectively,which meet the criteria of 50% GHG emissions reductionmandated by RFS2.
The co-production of hydrogen and transportation fuelsin the present study has the smallest GHG emissions andfossil energy input compared to the selected previous studieswhen transportation fuels are the only product. This indicatesthat the co-production of hydrogen, gasoline and diesel fuelvia fast pyrolysis and upgrading of corn stover, although
producing lower yields of gasoline and diesel, has lower GHGemissions and fewer fossil energy inputs than these otherstudies because of their use of natural gas as a source ofhydrogen for upgrading.
5.5. Sensitivity analysis
The sensitivity analysis of GHG emissions to variousoperational parameters in the production of hydrogen andtransportation fuels from corn stover is illustrated in figures 6and 7. The parameters investigated include fuel economy,bio-oil yield, products yield, electricity consumption, biomasstransportation distances and nitrogen fertilizer consumption.Sensitivity analysis is conducted by changing each operatingparameter by a prescribed amount around the baselineoperating conditions (expressed as a percentage of thebaseline case).
10

Environ. Res. Lett. 8 (2013) 025001 Y Zhang et al
As indicated in figure 6, overall net GWP rangesfrom −0.086 to 0.2 kg CO2 eq km−1 on gasoline basis.Gasoline fuel economy has the greatest impact on GHGemissions. A ±25% variation of fuel economy on thebaseline results in a −0.086 to 0.16 kg CO2 eq km−1 rangeof GWP. Yields of bio-oil and gasoline have significantimpacts on GHG emissions. Low yield of gasoline (75%of the baseline) generates the highest GWP of 0.2 kgCO2 eq km−1. Electricity consumption also has an importantimpact. If the electricity consumption for biomass fastpyrolysis varies ±25% from the baseline, GHG emissionsvary from −0.01 to 0.084 kg CO2 eq km−1. A variationof ±25% in bio-oil upgrading, electricity consumption, orelectricity consumption for biomass preprocessing would alsochange GWP in a range of 0.01–0.064 kg CO2 eq km−1
on gasoline basis. Nitrogen fertilizer has comparativelysmaller impact than the previous parameters. When nitrogenfertilizer is reduced to 75% of the baseline, a GWP of0.023 kg CO2 eq km−1 on a gasoline basis can be achievedwith 92% GHG emissions reduction compared to the 2005petroleum-based gasoline baseline.
The sensitivity analysis on a diesel fuel basis is illustratedin figure 7. Diesel fuel economy, diesel fuel yield and bio-oilyield are the most important parameters for GWP. The overallrange of GWP based on this sensitivity analysis ranges from−0.1 to 0.17 kg CO2 eq km−1 traveled by light-duty vehiclefueled by diesel fuel. If diesel fuel yield is only 75% ofthe baseline, GWP reaches its highest value of 0.17 kgCO2 eq km−1. GWP reaches its lowest value of −0.1 kgCO2 eq km−1 if diesel fuel economy increases to 125% of thebaseline. Generally, the trend of the sensitivity analysis for thediesel fuel basis is similar to the gasoline basis. But becausediesel fuel has a higher fuel economy than gasoline, the GWPfor biobased diesel fuel is smaller than for biobased gasolineunder the same operating conditions.
6. Conclusions
A life cycle assessment of the production of hydrogen andtransportation fuels from fast pyrolysis and upgrading ofcorn stover is examined in this study. The co-productionof hydrogen and transportation fuels have lower GHGemissions and fossil energy input than scenarios wheretransportation fuels are the only products from pyrolysisof biomass. The results indicate that bio-oil production,biomass preprocessing, and bio-oil upgrading are the keydrivers in determining overall environmental impacts ofthis biofuels pathway. Among the unit processes, bio-oilproduction has the largest energy demand and contributesthe largest GHG emissions. The co-products hydrogen andchar greatly reduce fossil fuel consumption in the productionof transportation fuels by this pathway. Fossil energy inputis 0.25 MJ and 0.23 MJ km−1 traveled by a light-dutyvehicle fueled by pyrolysis-derived gasoline and diesel fuel,respectively. The fossil energy input for this pathway is0.25 MJ km−1 and 0.23 MJ km−1 for the gasoline anddiesel fuel bases, respectively. Hydrogen for hydrotreatingis produced from reforming of bio-oil instead of reforming
of natural gas, so significant quantities of fossil energy aresaved compared to generating hydrogen from natural gas. Thenet GWP is 0.037 kg CO2 eq and 0.015 kg CO2 eq km−1
traveled by light-duty vehicle fueled by gasoline and dieselfuel, respectively. Compared to petroleum-based gasolineand diesel fuel, GHG emissions are reduced 88% and 94%,respectively, which exceeds the RFS2 requirements. Biomasstransportation has the largest impact on ozone depletionamong the unit processes. Bio-oil production makes thelargest contribution to smog, acidification, and eutrophication.Sensitivity analysis indicates that fuel economy is the mostsensitive parameter in determining GWP. Transportation fuelyield, bio-oil yield, and electricity consumption also playsignificant roles in determining the GHG footprint, so thereis potential to reduce GHG emissions with improvements toelectricity generation.
Acknowledgments
The authors would like to acknowledge useful discussionswith Tristan R Brown in preparing this paper and the financialsupport of the Bioeconomy Institute and the BiobasedIndustry Center of Iowa State University.
References
Argonne National Laboratory 2011 The Greenhouse Gases,Regulated Emissions, and Energy Use in Transportation(GREET) Model (available at: http://greet.es.anl.gov/)
Bai Y, Luo L and Voet E 2010 Life cycle assessment ofswitchgrass-derived ethanol as transport fuel Int. J. Life CycleAssess. 15 468–77
Bare J, Norris G, Pennington D and McKone T 2002 The tool forthe reduction and assessment of chemical and otherenvironmental impacts J. Indust. Ecol. 6 49–78
Basagiannis A C and Verykios X E 2007 Steam reforming of theaqueous fraction of bio-oil over structured Ru/MgO/Al2O3catalysts Catal. Today 127 256–64
Bridgwater A V 2012 Review of fast pyrolysis of biomass andproduct upgrading Biomass Bioenergy 38 68–94
Brown T R, Wright M M and Brown R C 2011 Estimatingprofitability of two biochar production scenarios: slowpyrolysis versus fast pyrolysis Biofuels, Bioprod. Biorefin.5 54–68
Brown T R, Zhang Y, Hu G and Brown R C 2012 Techno-economicanalysis of biobased chemicals production via integratedcatalytic processing Biofuels, Bioprod. Biorefin. 6 73–87
Chen T, Wu C and Liu R 2011 Steam reforming of bio-oil from ricehusks fast pyrolysis for hydrogen production Bioresour.Technol. 102 9236–40
Czernik S and Bridgwater A V 2004 Overview of applications ofbiomass fast pyrolysis oil Energy Fuels 18 590–8
Czernik S, Evans R and French R 2007 Hydrogen frombiomass-production by steam reforming of biomass pyrolysisoil Catal. Today 129 265–8
Domine M E, Iojoiu E E, Davidian T, Guilhaume N andMirodatos C 2008 Hydrogen production from biomass-derivedoil over monolithic Pt- and Rh-based catalysts using steamreforming and sequential cracking processes Catal. Today133–135 565–73
EIA 2012 Short Term Energy Outlook (available at: www.eia.gov/forecasts/steo/query/)
Fan J, Kalnes T N, Alward M, Klinger J, Sadehvandi A andShonnard D R 2011 Life cycle assessment of electricity
11

Environ. Res. Lett. 8 (2013) 025001 Y Zhang et al
generation using fast pyrolysis bio-oil Renew. Energy36 632–41
Fargione J, Hill J, Tilman D, Polasky S and Hawthorne P 2008 Landclearing and the biofuel carbon debt Science 319 1235–8
Gao X and Wu H 2011 Biochar as a fuel: 4. Emission behavior andcharacteristics of pm1 and pm10 from the combustion ofpulverized biochar in a drop-tube furnace Energy Fuels25 2702–10
Garcia L, French R, Czernik S and Chornet E 2000 Catalytic steamreforming of bio-oils for the production of hydrogen: effects ofcatalyst composition Appl. Catal. A 201 225–39
Goedkoop M, Oele M, de Schryver A and Vieira M 2008 SimaProDatabase Manual: Methods Library (Amersfoort: PReConsultants) (available at: www.pre-sustainability.com/manuals)
Gonzalez-Garcıa S, Moreira M T and Feijoo G 2010 Comparativeenvironmental performance of lignocellulosic ethanol fromdifferent feedstocks Renew. Sustain. Energy Rev. 14 2077–85
Han J, Elgowainy A, Palou-Rivera I, Dunn J B and Wang M 2011Well-to-Wheels Analysis of Fast Pyrolysis Pathways withGREET (Argonne, IL: Argonne National Laboratory)(available at: http://greet.es.anl.gov/publication-wtw fastpyrolysis)
Heracleous E 2011 Well-to-Wheels analysis of hydrogen productionfrom bio-oil reforming for use in internal combustion enginesInt. J. Hydrog. Energy 36 11501–11
Hou T, Yuan L, Ye T, Gong L, Tu J, Yamamoto M, Torimoto Y andLi Q 2009 Hydrogen production by low-temperature reformingof organic compounds in bio-oil over a CNT-promoting Nicatalyst Int. J. Hydrog. Energy 34 9095–107
Hsu D D 2011 Life Cycle Assessment of Gasoline and DieselProduced via Fast Pyrolysis and Hydroprocessing(NREL/TP-6A20-49341) (available at: www.nrel.gov/docs/fy11osti/49341.pdf)
Hsu D D 2012 Life cycle assessment of gasoline and dieselproduced via fast pyrolysis and hydroprocessing BiomassBioenergy 45 41–7
Hsu D D, Inman D, Heath G A, Wolfrum E J, Mann M K andAden A 2010 Life Cycle Environmental Impacts of SelectedUS Ethanol Production and Use Pathways in 2022 Environ.Sci. Technol. 44 5289–97
IPCC 2007 Climate Change 2007: The Physical Science Basis.Contribution of Working Group I to the Fourth AssessmentReport of the Intergovernmental Panel on Climate Change(Cambridge: Cambridge University Press) (available at: www.ipcc.ch/publications and data/ar4/wg1/en/contents.html)
Iribarren D, Peters J F and Dufour J 2012 Life cycle assessment oftransportation fuels from biomass pyrolysis Fuel 97 812–21
Jones S B, Walkenburg C, Walton C, Elliott D C, Holladay J E,Stevens D J, Kinchin C and Czernik S 2009 Production ofGasoline and Diesel from Biomass via Fast Pyrolysis,Hydrotreating and Hydrocracking: A Design Case(PNNL-18284) (Richland, WA: Pacific Northwest NationalLaboratory) (available at: www.pnl.gov/main/publications/external/technical reports/pnnl-18284.pdf)
Kauffman N, Hayes D and Brown R C 2011 A life cycle assessmentof advanced biofuel production from a hectare of corn Fuel90 3306–14
Kemppainen A J and Shonnard D R 2005 Comparative life-cycleassessments for biomass-to-ethanol production from differentregional feedstocks Biotechnol. Prog. 21 1075–84
Kim S and Dale B E 2004 Global potential bioethanol productionfrom wasted crops and crop residues Biomass Bioenergy26 361–75
Koroneos C, Dompros A, Roumbas G and Moussiopoulos N 2004Life cycle assessment of hydrogen fuel production processesInt. J. Hydrog. Energy 29 1443–50
Liu S-M, Chen M-Q, Wang J, Min F-F and Chen M-G 2011Hydrogen production by steam reforming for glycerol as a
model oxygenate from bio-oil 2011 Int. Conf. on Materials forRenewable Energy & Environment (ICMREE) (Shanghai, May2011) pp 303–7 (doi:10.1109/ICMREE.2011.5930818)
Luo L, van der Voet E and Huppes G 2009a An energy analysis ofethanol from cellulosic feedstock—corn stover Renew. Sustain.Energy Rev. 13 2003–11
Luo L, van der Voet E, Huppes G and Udo de Haes H 2009bAllocation issues in LCA methodology: a case study of cornstover-based fuel ethanol Int. J. Life Cycle Assess. 14 529–39
Mani S, Tabil L G and Sokhansanj S 2004 Grinding performanceand physical properties of wheat and barley straws, corn stoverand switchgrass Biomass Bioenergy 27 339–52
Marker T L 2005 Opportunities for Biorenewables in Oil Refineries(DOEGO15085) (available at: www.osti.gov/energycitations/product.biblio.jsp?osti id=861458)
Mathews J A and Tan H 2009 Biofuels and indirect land use changeeffects: the debate continues Biofuels, Bioprod. Biorefin.3 305–17
Medrano J A, Oliva M, Ruiz J, Garcıa L and Arauzo J 2011Hydrogen from aqueous fraction of biomass pyrolysis liquidsby catalytic steam reforming in fluidized bed Energy36 2215–24
Milbrandt A and Mann M 2009 Hydrogen Resource Assessment:Hydrogen Potential from Coal, Natural Gas, Nuclear, andHydro Power (NREL/TP-6A2-42773) (available at: www.nrel.gov/docs/fy09osti/42773.pdf)
National Renewable Energy Laboratory 2012 US Life-CycleInventory Database (available at: https://www.lcacommons.gov/nrel/process/show/a319d03a-5895-47f7-a64b-9b026df9e3b9)
Ortiz-Toral P J, Satrio J, Brown R C and Shanks B H 2011 Steamreforming of bio-oil fractions: effect of composition andstability Energy Fuels 25 3289–97
Pawelzik P F and Zhang Q 2012 Evaluation of environmentalimpacts of cellulosic ethanol using life cycle assessment withtechnological advances over time Biomass Bioenergy40 162–73
Plevin R J, O’Hare M, Jones A D, Torn M S and Gibbs H K 2010Greenhouse gas emissions from biofuels’ indirect land usechange are uncertain but may be much greater than previouslyestimated Environ. Sci. Technol. 44 8015–21
Pordesimo L O, Hames B R, Sokhansanj S and Edens W C 2005Variation in corn stover composition and energy content withcrop maturity Biomass Bioenergy 28 366–74
Ramana M V 2009 Nuclear power: economic, safety, health, andenvironmental issues of near-term technologies Annu. Rev.Environ. Resources 34 127–52
Searchinger T, Heimlich R, Houghton R A, Dong F, Elobeid A,Fabiosa J, Tokgoz S, Hayes D and Yu T-H 2008 Use of UScroplands for biofuels increases greenhouse gases throughemissions from land-use change Science 319 1238–40
Seyedeyn-Azad F, Salehi E, Abedi J and Harding T 2011 Biomassto hydrogen via catalytic steam reforming of bio-oil overNi-supported alumina catalysts Fuel Process. Technol.92 563–9
Singh A, Pant D, Korres N E, Nizami A-S, Prasad S andMurphy J D 2010 Key issues in life cycle assessment ofethanol production from lignocellulosic biomass: challengesand perspectives Bioresour. Technol. 101 5003–12
Spatari S, Bagley D M and MacLean H L 2010 Life cycleevaluation of emerging lignocellulosic ethanol conversiontechnologies Bioresour. Technol. 101 654–67
Spatari S, Zhang Y and MacLean H L 2005 Life cycle assessmentof switchgrass- and corn stover-derived ethanol-fueledautomobiles Environ. Sci. Technol. 39 9750–8
12

Environ. Res. Lett. 8 (2013) 025001 Y Zhang et al
Thaicharoensutcharittham S, Meeyoo V, Kitiyanan B,Rangsunvigit P and Rirksomboon T 2011 Hydrogenproduction by steam reforming of acetic acid over Ni-basedcatalysts Catal. Today 164 257–61
US Congress 2007 Energy Independence and Security Act of 2007(Public Law 110-40)
Vagia E C and Lemonidou A A 2008 Thermodynamic analysis ofhydrogen production via autothermal steam reforming ofselected components of aqueous bio-oil fraction Int. J. Hydrog.Energy 33 2489–500
Wright M M, Daugaard D E, Satrio J A and Brown R C 2010aTechno-economic analysis of biomass fast pyrolysis totransportation fuels Fuel 89 (Suppl. 1) S2–10
Wright M M, Satrio J A, Brown R C, Daugaard D E andHsu D D 2010b Techno-Economic Analysis of Biomass FastPyrolysis to Transportation Fuels (NREL/TP-6A20-46586)(available at: www.nrel.gov/docs/fy11osti/46586.pdf)
Yan C-F, Cheng F-F and Hu R-R 2010 Hydrogen production fromcatalytic steam reforming of bio-oil aqueous fraction overNi/CeO2–ZrO2 catalysts Int. J. Hydrog. Energy 35 11693–9
Zhang Y, Brown T R, Hu G and Brown R C 2013aTechno-economic analysis of monosaccharide production viafast pyrolysis of lignocellulose Bioresour. Technol. 127 358–65
Zhang Y, Brown T R, Hu G and Brown R C 2013bTechno-economic analysis of two bio-oil upgrading pathwaysChem. Eng. J. at press (doi:10.1016/j.cej.2013.01.030)
Zhang S-P, Li X-J, Li Q-Y, Xu Q-L and Yan Y-J 2011 Hydrogenproduction from the aqueous phase derived from fast pyrolysisof biomass J. Anal. Appl. Pyrolysis 92 158–63
Zhang L and Ninomiya Y 2006 Emission of suspended PM10 fromlaboratory-scale coal combustion and its correlation with coalmineral properties Fuel 85 194–203
Zhong Z W, Song B and Zaki M B M 2010 Life-cycle assessmentof flash pyrolysis of wood waste J. Cleaner Prod. 18 1177–83
13