life cycle assessment of coal fired power plant
DESCRIPTION
Life Cycle Assessment of Coal Fired Power PlantTRANSCRIPT
Life Cycle Assessment of Coal-fired Power Production
Pamela L. SpathMargaret K. MannDawn R. Kerr
Including contributions on process definition and data acquisition from:John Marano and Massood Ramezan, Federal Energy Technology Center
Life Cycle Assessment

NOTICE
This report was prepared as an account of work sponsored by an agency of the United Statesgovernment. Neither the United States government nor any agency thereof, nor any of their employees,makes any warranty, express or implied, or assumes any legal liability or responsibility for the accuracy,completeness, or usefulness of any information, apparatus, product, or process disclosed, or representsthat its use would not infringe privately owned rights. Reference herein to any specific commercialproduct, process, or service by trade name, trademark, manufacturer, or otherwise does not necessarilyconstitute or imply its endorsement, recommendation, or favoring by the United States government or anyagency thereof. The views and opinions of authors expressed herein do not necessarily state or reflectthose of the United States government or any agency thereof.
Available to DOE and DOE contractors from:Office of Scientific and Technical Information (OSTI)P.O. Box 62Oak Ridge, TN 37831
Prices available by calling 423-576-8401
Available to the public from:National Technical Information Service (NTIS)U.S. Department of Commerce5285 Port Royal RoadSpringfield, VA 22161703-605-6000 or 800-553-6847orDOE Information Bridgehttp://www.doe.gov/bridge/home.html
Printed on paper containing at least 50% wastepaper, including 20% postconsumer waste
National Renewable Energy Laboratory1617 Cole BoulevardGolden, Colorado 80401-3393
NREL is a U.S. Department of Energy LaboratoryOperated by Midwest Research Institute •••• Battelle •••• Bechtel
Contract No. DE-AC36-98-GO10337
June 1999 • NREL/TP-570-25119
Life Cycle Assessment ofCoal-fired Power Production
Pamela L. Spath, Margaret K. Mann, andDawn R. Kerr
Including contributions on process definition and dataacquisition from: John Marano and Massood RamezanFederal Energy Technology Center
Prepared under Task No. BP911030
i
EXECUTIVE SUMMARY
Coal has the largest share of utility power generation in the United States, accounting for approximately56% of all utility-produced electricity (U.S. DOE, 1998). Therefore, understanding the environmentalimplications of producing electricity from coal is an important component of any plan to reduce totalemissions and resource consumption. A life cycle assessment (LCA) on the production of electricity fromcoal was performed in order to examine the environmental aspects of current and future pulverized coalboiler systems. Three systems were examined: 1) a plant that represents the average emissions andefficiency of currently operating coal-fired power plants in the U.S. (this tells us about the status quo),2) a new coal-fired power plant that meets the New Source Performance Standards (NSPS), and 3) ahighly advanced coal-fired power plant utilizing a low emission boiler system (LEBS).
LCA is a systematic analytical method that helps identify, evaluate, and minimize the environmentalimpacts of a specific process or competing processes. Material and energy balances are used to quantifythe emissions, resource consumption, and energy use (i.e., stressors) of all processes betweentransformation of raw materials into useful products and the final disposal of all products and by-products. The results are then used to evaluate the environmental impacts of the process so that effortscan be focused on mitigating possible effects.
Each system analyzed consists of coal mining, transportation, and electricity generation. In keeping withthe cradle-to-grave concept of LCA, upstream processes required for the operation of these threesubsystems were also included in this study. Both surface and underground mining were examined, withthe coal being surface mined by strip mining or by the underground technique of longwall mining. Thecoal is transported via rail, truck, or a combination of rail and barge by one of four cases tested: averageuser by land, average user by river, farthest user, and mine mouth.
As expected, because coal combustion results in the production of CO from carbon that was previously2
sequestered underground, CO accounts for the vast majority (98%-99% by weight) of the total air2
emissions from each system examined. The rate of production is 1,022 g/kWh, 941 g/kWh, and 741g/kWh for the Average, NSPS, and LEBS systems, respectively. Two other climate change gases,methane and nitrous oxide, are also emitted from the system. Although the global warming potential(GWP) of these gases is much higher than that of CO , they are emitted in much smaller quantities and2
therefore do not significantly change the GWP of the overall systems.
Apart from the CO produced during coal combustion, operations related to flue gas clean-up produce2
more CO than any other upstream process. Limestone production, transportation, and use account for2
59% and 62% of the non-coal CO emissions in the Average and NSPS systems. These amounts are2
greater than twice the CO emissions related to transportation of the coal. In the LEBS system, operations2
associated with the production and use of natural gas to regenerate the CuO sorbent are responsible for35% of the total non-coal CO emissions. Coal transportation, in this system, produces nearly 40% of2
the non-coal CO .2
0
2
4
6
8
10
12
P a rticu la te s S O x N O x C H 4 C O N M H C s (e )
Ave rageN S PSLE B S
Air
emis
sion
s (e
xclu
ding
CO
) (g
/kW
h)2
ii
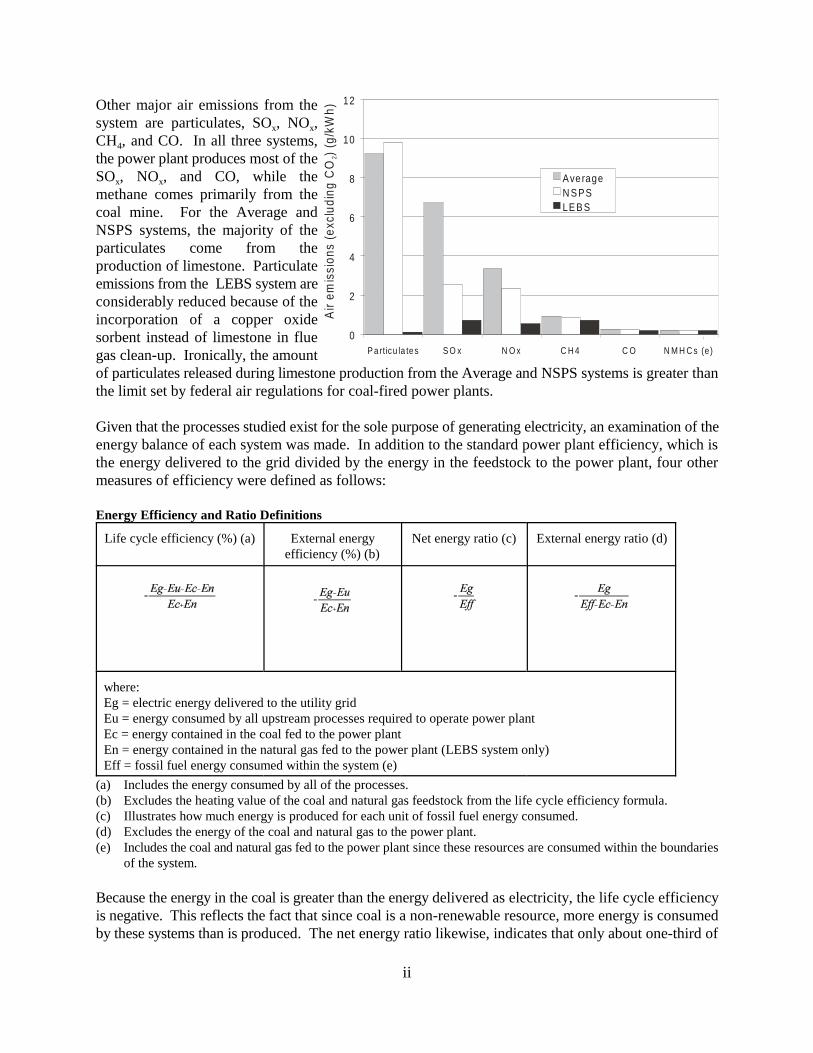
Other major air emissions from thesystem are particulates, SO , NO ,x x
CH , and CO. In all three systems,4
the power plant produces most of theSO , NO , and CO, while thex x
methane comes primarily from thecoal mine. For the Average andNSPS systems, the majority of theparticulates come from theproduction of limestone. Particulateemissions from the LEBS system areconsiderably reduced because of theincorporation of a copper oxidesorbent instead of limestone in fluegas clean-up. Ironically, the amountof particulates released during limestone production from the Average and NSPS systems is greater thanthe limit set by federal air regulations for coal-fired power plants.
Given that the processes studied exist for the sole purpose of generating electricity, an examination of theenergy balance of each system was made. In addition to the standard power plant efficiency, which isthe energy delivered to the grid divided by the energy in the feedstock to the power plant, four othermeasures of efficiency were defined as follows:
Energy Efficiency and Ratio Definitions
Life cycle efficiency (%) (a) External energyefficiency (%) (b)
Net energy ratio (c) External energy ratio (d)
where:Eg = electric energy delivered to the utility gridEu = energy consumed by all upstream processes required to operate power plantEc = energy contained in the coal fed to the power plantEn = energy contained in the natural gas fed to the power plant (LEBS system only)Eff = fossil fuel energy consumed within the system (e)
(a) Includes the energy consumed by all of the processes.(b) Excludes the heating value of the coal and natural gas feedstock from the life cycle efficiency formula.(c) Illustrates how much energy is produced for each unit of fossil fuel energy consumed.(d) Excludes the energy of the coal and natural gas to the power plant.(e) Includes the coal and natural gas fed to the power plant since these resources are consumed within the boundaries
of the system.
Because the energy in the coal is greater than the energy delivered as electricity, the life cycle efficiencyis negative. This reflects the fact that since coal is a non-renewable resource, more energy is consumedby these systems than is produced. The net energy ratio likewise, indicates that only about one-third of
0
50
100
150
200
250
300
350
400
450
500
coa l lim e stone o il na tu ra l g a s
Ave rage
N SPS
LE BS
Res
ourc
e co
nsum
ptio
n (g
/kW
h)
iii
every unit of energy into the system is obtained as electricity. Although the net energy ratio is a morecorrect measure of the net energy balance of the system, the external measures are useful because theyexpose the rate of energy consumption by upstream operations.
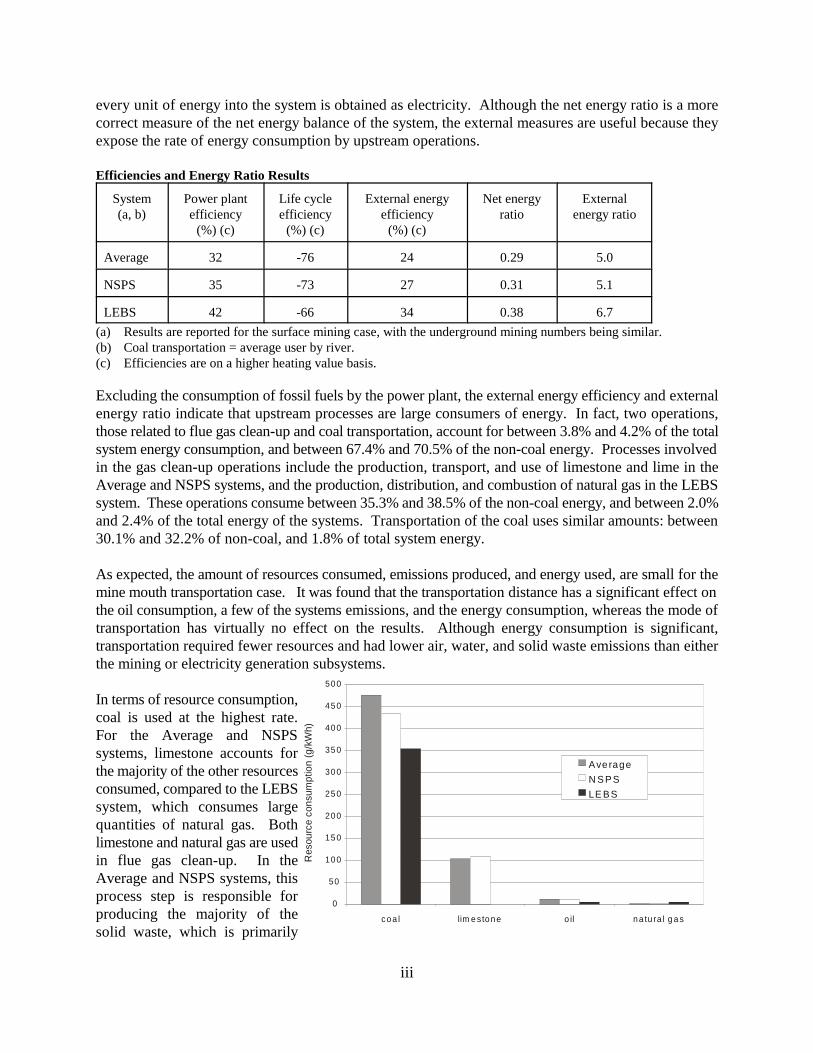
Efficiencies and Energy Ratio Results
System(a, b)
Power plantefficiency(%) (c)
Life cycleefficiency(%) (c)
External energyefficiency(%) (c)
Net energyratio
Externalenergy ratio
Average 32 -76 24 0.29 5.0
NSPS 35 -73 27 0.31 5.1
LEBS 42 -66 34 0.38 6.7
(a) Results are reported for the surface mining case, with the underground mining numbers being similar.(b) Coal transportation = average user by river.(c) Efficiencies are on a higher heating value basis.
Excluding the consumption of fossil fuels by the power plant, the external energy efficiency and externalenergy ratio indicate that upstream processes are large consumers of energy. In fact, two operations,those related to flue gas clean-up and coal transportation, account for between 3.8% and 4.2% of the totalsystem energy consumption, and between 67.4% and 70.5% of the non-coal energy. Processes involvedin the gas clean-up operations include the production, transport, and use of limestone and lime in theAverage and NSPS systems, and the production, distribution, and combustion of natural gas in the LEBSsystem. These operations consume between 35.3% and 38.5% of the non-coal energy, and between 2.0%and 2.4% of the total energy of the systems. Transportation of the coal uses similar amounts: between30.1% and 32.2% of non-coal, and 1.8% of total system energy.
As expected, the amount of resources consumed, emissions produced, and energy used, are small for themine mouth transportation case. It was found that the transportation distance has a significant effect onthe oil consumption, a few of the systems emissions, and the energy consumption, whereas the mode oftransportation has virtually no effect on the results. Although energy consumption is significant,transportation required fewer resources and had lower air, water, and solid waste emissions than eitherthe mining or electricity generation subsystems.
In terms of resource consumption,coal is used at the highest rate.For the Average and NSPSsystems, limestone accounts forthe majority of the other resourcesconsumed, compared to the LEBSsystem, which consumes largequantities of natural gas. Bothlimestone and natural gas are usedin flue gas clean-up. In theAverage and NSPS systems, thisprocess step is responsible forproducing the majority of thesolid waste, which is primarily
iv
clean-up waste and ash that must be landfilled. The flue gas clean-up process for the LEBS systemutilizes a regenerable sorbent, therefore, the bulk of the waste from this system is ash.
Overall, the environmental impacts from surface are similar to those of underground mining. Onedifference is that the surface mining subsystem results in a higher amount of airborne ammonia emissionsdue to the production of ammonium nitrate explosives used at the mine. Another important differenceis that underground mining requires limestone which emits a large amount of particulates during itsproduction. Therefore the particulate emissions will be higher for underground mining compared tosurface mining. Additionally, underground mining, because it is able to access deeper seams that havebeen under higher pressures, produces approximately twice the methane emissions as surface mining.
A sensitivity analysis was used to identify those parameters that most influence the major results of thestudy. Overall, finding ways to reduce the amount of coal being consumed, while still producing the sameamount of electricity, offers the best opportunity to mitigate emissions, resource consumption, and energyuse of these systems. Therefore, changing the power plant efficiency had the largest effect, since thechange in the amount of coal not only changes the stressors directly associated with coal combustion, butalso those stressors from upstream processes that are proportional to how much coal is used (e.g.,limestone and transportation requirements). In general, the system was found to be sufficiently large, andthe model reasonably robust, that the major conclusions remained the same for all cases tested.
Several areas were identified where design changes could improve the environmental impact of thesecoal-fired boiler systems. One obvious way to reduce the amount of waste generated by these powersystems is to maximize the amount of flue gas clean-up waste and ash that is used in alternative serviceswhen possible. Additionally, because the largest portion of several stressors come from limestoneproduction, the overall system would benefit from using a type of gas clean-up other than conventionallimestone scrubbing. Care should be taken, however, that the alternative technology does not adverselyimpact the environment in other ways. A third change that may improve the environmental outcome iscapturing the methane emitted from the coal mine for uses such as power production, fuel use at the minesite (for water treatment or coal preparation), or as additional natural gas supply.
v
Table of Contents
1.0 Introduction . . . . . . . . . . . . . . . . . . . . . . . . . . . . . . . . . . . . . . . . . . . . . . . . . . . . . . . . . . . . . . . . . . 3
2.0 Methodology . . . . . . . . . . . . . . . . . . . . . . . . . . . . . . . . . . . . . . . . . . . . . . . . . . . . . . . . . . . . . . . . . 52.1 System Boundaries and Data Availability. . . . . . . . . . . . . . . . . . . . . . . . . . . . . . . . . . . . . . . . 52.2 Methodology - Energy Considerations. . . . . . . . . . . . . . . . . . . . . . . . . . . . . . . . . . . . . . . . . . 62.3 Methodology - Comparison with Other Systems. . . . . . . . . . . . . . . . . . . . . . . . . . . . . . . . . . . 62.4 Methodology - Sensitivity Analysis. . . . . . . . . . . . . . . . . . . . . . . . . . . . . . . . . . . . . . . . . . . . . 82.5 Accounting . . . . . . . . . . . . . . . . . . . . . . . . . . . . . . . . . . . . . . . . . . . . . . . . . . . . . . . . . . . . . . . . 82.6 Time Frame and Issues in Assessing Environmental Consequences . . . . . . . . . . . . . . . . . . . . 9
3.0 Description of Pulverized Coal Boiler Plants Studied . . . . . . . . . . . . . . . . . . . . . . . . . . . . . . . . . 103.1 Average Plant . . . . . . . . . . . . . . . . . . . . . . . . . . . . . . . . . . . . . . . . . . . . . . . . . . . . . . . . . . . . . 103.2 NSPS Plant. . . . . . . . . . . . . . . . . . . . . . . . . . . . . . . . . . . . . . . . . . . . . . . . . . . . . . . . . . . . . . . 113.3 LEBS Plant . . . . . . . . . . . . . . . . . . . . . . . . . . . . . . . . . . . . . . . . . . . . . . . . . . . . . . . . . . . . . . . 13
4.0 Description of Coal Used in Analysis . . . . . . . . . . . . . . . . . . . . . . . . . . . . . . . . . . . . . . . . . . . . . 13
5.0 Description of Process Blocks Studied in the LCA . . . . . . . . . . . . . . . . . . . . . . . . . . . . . . . . . . . 145.1 Base Case Coal Mining Assumptions . . . . . . . . . . . . . . . . . . . . . . . . . . . . . . . . . . . . . . . . . . 14
5.1.1 Surface Coal Mining Equipment & Mine Requirements. . . . . . . . . . . . . . . . . . . . . . . 155.1.2 Surface Coal Mining Reclamation Requirements. . . . . . . . . . . . . . . . . . . . . . . . . . . . . 165.1.3 Underground Coal Mining Equipment & Mine Requirements. . . . . . . . . . . . . . . . . . . 175.1.4 Coal Preparation/Cleaning . . . . . . . . . . . . . . . . . . . . . . . . . . . . . . . . . . . . . . . . . . . . . . 195.1.5 Coal Mining Methane Emissions . . . . . . . . . . . . . . . . . . . . . . . . . . . . . . . . . . . . . . . . . 195.1.6 Transportation of Chemicals/Materials . . . . . . . . . . . . . . . . . . . . . . . . . . . . . . . . . . . . . 21
5.2 Base Case Coal Transportation Assumptions . . . . . . . . . . . . . . . . . . . . . . . . . . . . . . . . . . . . 215.3 Base Case Power Plant Construction & Decommissioning Assumptions . . . . . . . . . . . . . . . 245.4 Base Case Power Generation Assumptions . . . . . . . . . . . . . . . . . . . . . . . . . . . . . . . . . . . . . . 25
5.4.1 Trace Elements. . . . . . . . . . . . . . . . . . . . . . . . . . . . . . . . . . . . . . . . . . . . . . . . . . . . . . . 265.4.2 Recycling of Power Plant Flue Gas Clean-up Waste and Ash . . . . . . . . . . . . . . . . . . . 275.4.3 Landfilling of Flue Gas Clean-up Waste, Ash, and Refuse. . . . . . . . . . . . . . . . . . . . . 28
6.0 Base Case Results by Impact Category . . . . . . . . . . . . . . . . . . . . . . . . . . . . . . . . . . . . . . . . . . . . 296.1 Carbon Dioxide Emissions. . . . . . . . . . . . . . . . . . . . . . . . . . . . . . . . . . . . . . . . . . . . . . . . . . . 296.2 Air Emissions . . . . . . . . . . . . . . . . . . . . . . . . . . . . . . . . . . . . . . . . . . . . . . . . . . . . . . . . . . . . . 356.3 Water Emissions . . . . . . . . . . . . . . . . . . . . . . . . . . . . . . . . . . . . . . . . . . . . . . . . . . . . . . . . . . 406.4 Energy Consumption . . . . . . . . . . . . . . . . . . . . . . . . . . . . . . . . . . . . . . . . . . . . . . . . . . . . . . . 406.5 Resource Consumption . . . . . . . . . . . . . . . . . . . . . . . . . . . . . . . . . . . . . . . . . . . . . . . . . . . . . 426.6 Solid Waste . . . . . . . . . . . . . . . . . . . . . . . . . . . . . . . . . . . . . . . . . . . . . . . . . . . . . . . . . . . . . . 44
7.0 Results Specific to the Three Major Subsystems . . . . . . . . . . . . . . . . . . . . . . . . . . . . . . . . . . . . . 457.1 Base Case Coal Mining Results . . . . . . . . . . . . . . . . . . . . . . . . . . . . . . . . . . . . . . . . . . . . . . . 457.2 Base Case Coal Transportation Results . . . . . . . . . . . . . . . . . . . . . . . . . . . . . . . . . . . . . . . . . 457.3 Base Case Power Plant Construction & Decommissioning Results . . . . . . . . . . . . . . . . . . . . 46
vi
7.4 Base Case Power Generation Results . . . . . . . . . . . . . . . . . . . . . . . . . . . . . . . . . . . . . . . . . . . 46
8.0 Sensitivity Analysis. . . . . . . . . . . . . . . . . . . . . . . . . . . . . . . . . . . . . . . . . . . . . . . . . . . . . . . . . . . 488.1 Power Plant Efficiency Sensitivity Analysis (Case A-B). . . . . . . . . . . . . . . . . . . . . . . . . . . . 538.2 Pond Versus Landfilling of Power Plant Ash Sensitivity Analysis (Case C). . . . . . . . . . . . . 548.3 Power Plant Construction & Decommissioning Sensitivity Analysis (Case D). . . . . . . . . . . 548.4 Coal Mining Methane Emissions Sensitivity Analysis (Case E). . . . . . . . . . . . . . . . . . . . . . 558.5 Transportation Sensitivity Analysis (Case F-H). . . . . . . . . . . . . . . . . . . . . . . . . . . . . . . . . . . 55
8.5.1 Mine Mouth Case (Case F) . . . . . . . . . . . . . . . . . . . . . . . . . . . . . . . . . . . . . . . . . . . . . . 578.5.2 Average User By Land (Case G) . . . . . . . . . . . . . . . . . . . . . . . . . . . . . . . . . . . . . . . . . 578.5.3 Farthest User (Case H) . . . . . . . . . . . . . . . . . . . . . . . . . . . . . . . . . . . . . . . . . . . . . . . . . 57
8.6 Flue Gas Clean-up Waste & Ash Recovery and Disposal Sensitivity Analysis(Cases I-L & Q-T) . . . . . . . . . . . . . . . . . . . . . . . . . . . . . . . . . . . . . . . . . . . . . . . . . . . . . . . . . 57
8.7 Power Plant Operating Capacity Factor Sensitivity Analysis (Case M). . . . . . . . . . . . . . . . . 588.8 Mining Equipment Materials Sensitivity Analysis (Case N-O). . . . . . . . . . . . . . . . . . . . . . . 598.9 Landfilling versus Recycling Sensitivity Analysis (Case P). . . . . . . . . . . . . . . . . . . . . . . . . 59
9.0 Impact Assessment . . . . . . . . . . . . . . . . . . . . . . . . . . . . . . . . . . . . . . . . . . . . . . . . . . . . . . . . . . . . 599.1 Discussion of Stressor Categories . . . . . . . . . . . . . . . . . . . . . . . . . . . . . . . . . . . . . . . . . . . . . 60
9.1.1 Atmospheric Concerns . . . . . . . . . . . . . . . . . . . . . . . . . . . . . . . . . . . . . . . . . . . . . . . . . 609.1.2 Climate Change. . . . . . . . . . . . . . . . . . . . . . . . . . . . . . . . . . . . . . . . . . . . . . . . . . . . . . . 619.1.3 Greenhouse Gases. . . . . . . . . . . . . . . . . . . . . . . . . . . . . . . . . . . . . . . . . . . . . . . . . . . . . 619.1.4 Particulate Matter and Climate. . . . . . . . . . . . . . . . . . . . . . . . . . . . . . . . . . . . . . . . . . . 619.1.5 Ozone Depletion Compounds. . . . . . . . . . . . . . . . . . . . . . . . . . . . . . . . . . . . . . . . . . . . 649.1.6 Smog: Photochemical and London. . . . . . . . . . . . . . . . . . . . . . . . . . . . . . . . . . . . . . . . 649.1.7 Acid Deposition. . . . . . . . . . . . . . . . . . . . . . . . . . . . . . . . . . . . . . . . . . . . . . . . . . . . . . 679.1.8 Contributors to Corrosion . . . . . . . . . . . . . . . . . . . . . . . . . . . . . . . . . . . . . . . . . . . . . . . 689.1.9 Radionuclides. . . . . . . . . . . . . . . . . . . . . . . . . . . . . . . . . . . . . . . . . . . . . . . . . . . . . . . . 68
9.2 Known Effects of Specific Stressors . . . . . . . . . . . . . . . . . . . . . . . . . . . . . . . . . . . . . . . . . . . 689.2.1 Nitrogen Compounds. . . . . . . . . . . . . . . . . . . . . . . . . . . . . . . . . . . . . . . . . . . . . . . . . . 689.2.2 Sulfur Compounds. . . . . . . . . . . . . . . . . . . . . . . . . . . . . . . . . . . . . . . . . . . . . . . . . . . . 709.2.3 Carbon Dioxide. . . . . . . . . . . . . . . . . . . . . . . . . . . . . . . . . . . . . . . . . . . . . . . . . . . . . . . 709.2.4 Carbon Monoxide. . . . . . . . . . . . . . . . . . . . . . . . . . . . . . . . . . . . . . . . . . . . . . . . . . . . . 709.2.5 Methane . . . . . . . . . . . . . . . . . . . . . . . . . . . . . . . . . . . . . . . . . . . . . . . . . . . . . . . . . . . . 719.2.6 Non-Methane Hydrocarbons (NMHCs). . . . . . . . . . . . . . . . . . . . . . . . . . . . . . . . . . . . 719.2.7 Cyanides . . . . . . . . . . . . . . . . . . . . . . . . . . . . . . . . . . . . . . . . . . . . . . . . . . . . . . . . . . . . 729.2.8 Ozone . . . . . . . . . . . . . . . . . . . . . . . . . . . . . . . . . . . . . . . . . . . . . . . . . . . . . . . . . . . . . . 739.2.9 Particulates . . . . . . . . . . . . . . . . . . . . . . . . . . . . . . . . . . . . . . . . . . . . . . . . . . . . . . . . . . 739.2.10 Trace Elements and Their Compounds. . . . . . . . . . . . . . . . . . . . . . . . . . . . . . . . . . . . 739.2.11 Alkali Metals . . . . . . . . . . . . . . . . . . . . . . . . . . . . . . . . . . . . . . . . . . . . . . . . . . . . . . . 779.2.12 Fluorine, Fluorides, and Hydrogen Fluoride . . . . . . . . . . . . . . . . . . . . . . . . . . . . . . . . 779.2.13 Hydrogen Chloride . . . . . . . . . . . . . . . . . . . . . . . . . . . . . . . . . . . . . . . . . . . . . . . . . . . 789.2.14 Radon . . . . . . . . . . . . . . . . . . . . . . . . . . . . . . . . . . . . . . . . . . . . . . . . . . . . . . . . . . . . . 78
10.0 Improvement . . . . . . . . . . . . . . . . . . . . . . . . . . . . . . . . . . . . . . . . . . . . . . . . . . . . . . . . . . . . . . . 7810.1 Flue Gas Clean-up . . . . . . . . . . . . . . . . . . . . . . . . . . . . . . . . . . . . . . . . . . . . . . . . . . . . . . . . 7810.2 Methane from Coal Mining . . . . . . . . . . . . . . . . . . . . . . . . . . . . . . . . . . . . . . . . . . . . . . . . . 81
vii
10.3 Flue Gas Clean-up Waste & Ash . . . . . . . . . . . . . . . . . . . . . . . . . . . . . . . . . . . . . . . . . . . . . 83
11.0 Summary of Results and Discussion . . . . . . . . . . . . . . . . . . . . . . . . . . . . . . . . . . . . . . . . . . . . . 8411.1 CO Emissions . . . . . . . . . . . . . . . . . . . . . . . . . . . . . . . . . . . . . . . . . . . . . . . . . . . . . . . . . . . 842
11.2 Non-CO Air Emissions . . . . . . . . . . . . . . . . . . . . . . . . . . . . . . . . . . . . . . . . . . . . . . . . . . . . 852
11.3 Flue Gas Clean-up . . . . . . . . . . . . . . . . . . . . . . . . . . . . . . . . . . . . . . . . . . . . . . . . . . . . . . . . 8611.4 Transportation Subsystem . . . . . . . . . . . . . . . . . . . . . . . . . . . . . . . . . . . . . . . . . . . . . . . . . . 8611.5 Energy . . . . . . . . . . . . . . . . . . . . . . . . . . . . . . . . . . . . . . . . . . . . . . . . . . . . . . . . . . . . . . . . . 8611.6 Water Emissions, Wastes and Resources . . . . . . . . . . . . . . . . . . . . . . . . . . . . . . . . . . . . . . . 8711.7 Surface versus Underground Mining. . . . . . . . . . . . . . . . . . . . . . . . . . . . . . . . . . . . . . . . . . 8811.8 Sensitivity Analysis Findings. . . . . . . . . . . . . . . . . . . . . . . . . . . . . . . . . . . . . . . . . . . . . . . . 8811.9 Improvement Opportunities. . . . . . . . . . . . . . . . . . . . . . . . . . . . . . . . . . . . . . . . . . . . . . . . . 88
12.0 Future Work . . . . . . . . . . . . . . . . . . . . . . . . . . . . . . . . . . . . . . . . . . . . . . . . . . . . . . . . . . . . . . . . 88
13.0 Related Studies . . . . . . . . . . . . . . . . . . . . . . . . . . . . . . . . . . . . . . . . . . . . . . . . . . . . . . . . . . . . . . 89
14.0 Acknowledgments. . . . . . . . . . . . . . . . . . . . . . . . . . . . . . . . . . . . . . . . . . . . . . . . . . . . . . . . . . . 91
15.0 References and Pertinent Literature . . . . . . . . . . . . . . . . . . . . . . . . . . . . . . . . . . . . . . . . . . . . . . 92
Appendices
Appendix A: Graphical Representation of the LCA System in TEAM®
Appendix B: Additional Results Tables
Appendix C: Additional Figures
viii
List of Figures
Figure 1: Conceptual Drawing - Coal LCA System . . . . . . . . . . . . . . . . . . . . . . . . . . . . . . . . . . . . . . . 4Figure 2: Coal Production and Transportation Boundaries for Life Cycle Assessment. . . . . . . . . . . . 7Figure 3: Power Generation and Transportation Boundaries for Life Cycle Assessment. . . . . . . . . . 7Figure 4: Schematic of a Typical Coal-fired Power Plant . . . . . . . . . . . . . . . . . . . . . . . . . . . . . . . . . 12Figure 5: LEBS Commercial Generating Unit - DB Riley Design. . . . . . . . . . . . . . . . . . . . . . . . . . . 12Figure 6: Coal Preparation - Jig Cleaning Process . . . . . . . . . . . . . . . . . . . . . . . . . . . . . . . . . . . . . . . 20Figure 7: Coal LCA CO Results - Average System . . . . . . . . . . . . . . . . . . . . . . . . . . . . . . . . . . . . . 332
Figure 8: Yearly Carbon Dioxide Emissions (surface mining & average user by river). . . . . . . . . . 33Figure 9: Yearly Particulate Emissions (surface mining & average user by river). . . . . . . . . . . . . . . 37Figure 10: Yearly Particulate Emissions (underground mining & average user by river). . . . . . . . . 37Figure 11: Yearly Sulfur Oxide Emissions (SO as SO )x 2
(surface mining & average user by river). . . . . . . . . . . . . . . . . . . . . . . . . . . . . . . . . . . . . 38Figure 12: Yearly Nitrogen Oxide Emissions (NO as NO )x 2
(surface mining & average user by river). . . . . . . . . . . . . . . . . . . . . . . . . . . . . . . . . . . . . 38Figure 13: Yearly Methane Emissions (surface mining & average user by river). . . . . . . . . . . . . . . 39Figure 14: Yearly Total Non-Coal Energy Consumption
(surface mining & average user by river). . . . . . . . . . . . . . . . . . . . . . . . . . . . . . . . . . . . . 43Figure 15: Yearly Iron Ore Consumption (surface mining & average user by river). . . . . . . . . . . . . 47Figure 16: Sensitivity Results for Life Cycle Efficiency -
Average System, Surface Mining Case. . . . . . . . . . . . . . . . . . . . . . . . . . . . . . . . . . . . . . . 51Figure 17: Sensitivity Results for External Energy Efficiency -
Average System, Surface Mining Case. . . . . . . . . . . . . . . . . . . . . . . . . . . . . . . . . . . . . . . 51Figure 18: Sensitivity Results for Net Energy Ratio -
Average System, Surface Mining Case. . . . . . . . . . . . . . . . . . . . . . . . . . . . . . . . . . . . . . . 52Figure 19: Sensitivity Results for External Energy Ratio -
Average System, Surface Mining Case. . . . . . . . . . . . . . . . . . . . . . . . . . . . . . . . . . . . . . . 52Figure 20: Concentration of Carbon Dioxide in the Earth’s Atmosphere. . . . . . . . . . . . . . . . . . . . . 62Figure 21: Absorptivity Spectrum for a Few Atmospheric Gases . . . . . . . . . . . . . . . . . . . . . . . . . . . 63
ix
List of Tables
Table 1: Process Blocks Taken from DEAM . . . . . . . . . . . . . . . . . . . . . . . . . . . . . . . . . . . . . . . . . . . . 8Table 2: Major Yearly Operations of the Three Subsystems . . . . . . . . . . . . . . . . . . . . . . . . . . . . . . . . 9Table 3: Plant Information for Average System . . . . . . . . . . . . . . . . . . . . . . . . . . . . . . . . . . . . . . . . . 11Table 4: New Source Performance Standards for Fossil-Fueled Power Plants . . . . . . . . . . . . . . . . . 11Table 5: Plant Information for NSPS System. . . . . . . . . . . . . . . . . . . . . . . . . . . . . . . . . . . . . . . . . . . 11Table 6: Plant Information for LEBS System . . . . . . . . . . . . . . . . . . . . . . . . . . . . . . . . . . . . . . . . . . . 13Table 7: Illinois No. 6 Coal Analysis . . . . . . . . . . . . . . . . . . . . . . . . . . . . . . . . . . . . . . . . . . . . . . . . . 14Table 8: Surface Mining Equipment Material Requirements (Base Case). . . . . . . . . . . . . . . . . . . . . 15Table 9: Reclamation Mulching and Seeding Requirements (Base Case) . . . . . . . . . . . . . . . . . . . . . 17Table 10: Underground Mining Equipment Material Requirements (Base Case). . . . . . . . . . . . . . . 17Table 11: Underground Mining Electrical Requirements (Base Case). . . . . . . . . . . . . . . . . . . . . . . . 18Table 12: Coal Cleaning Utility and Landfilling Requirements (Base Case). . . . . . . . . . . . . . . . . . . 19Table 13: Coal Mining Methane Emissions (Base Case) . . . . . . . . . . . . . . . . . . . . . . . . . . . . . . . . . . 21Table 14: Chemicals and Materials Transported . . . . . . . . . . . . . . . . . . . . . . . . . . . . . . . . . . . . . . . . 21Table 15: Coal Transported per Year . . . . . . . . . . . . . . . . . . . . . . . . . . . . . . . . . . . . . . . . . . . . . . . . . 23Table 16: Yearly Barge & Train Deliveries Required for Coal Transport - Average User by River Case . . . . . . . . . . . . . . . . . . . . . . . . . . . . . . . . . . . . . . . . . . . . . . . 23Table 17: Barge, Train, and Truck Material Requirements . . . . . . . . . . . . . . . . . . . . . . . . . . . . . . . . 23Table 18: Plant Material Requirements (Base Case) . . . . . . . . . . . . . . . . . . . . . . . . . . . . . . . . . . . . . 24Table 19: Power Plant Resource/Input Requirements (Base Case). . . . . . . . . . . . . . . . . . . . . . . . . . 25Table 20: Power Plant Air Emissions (Base Case) . . . . . . . . . . . . . . . . . . . . . . . . . . . . . . . . . . . . . . . 25Table 21: Power Plant Solid Wastes (Base Case) . . . . . . . . . . . . . . . . . . . . . . . . . . . . . . . . . . . . . . . 26Table 22: Power Plant Trace Element Emissions. . . . . . . . . . . . . . . . . . . . . . . . . . . . . . . . . . . . . . . . 26Table 23: Landfilling Equipment (Base Case). . . . . . . . . . . . . . . . . . . . . . . . . . . . . . . . . . . . . . . . . . 28Table 29: CO Results . . . . . . . . . . . . . . . . . . . . . . . . . . . . . . . . . . . . . . . . . . . . . . . . . . . . . . . . . . . . 292
Table 24: Average Resource Consumption per kWh of Net Electricity Produced - Average System (surface mining & average user by river). . . . . . . . . . . . . . . . . . . . . . . . 30
Table 25: Average Air Emissions per kWh of Net Electricity Produced - Average System (surface mining & average user by river). . . . . . . . . . . . . . . . . . . . . . . . 30
Table 26: Average Water Emissions per kWh of Net Electricity Produced - Average System (surface mining & average user by river). . . . . . . . . . . . . . . . . . . . . . . . 31
Table 27: Average Energy Requirements per kWh of Net Electricity Produced - Average System (surface mining & average user by river). . . . . . . . . . . . . . . . . . . . . . . . 31
Table 28: Average Solid Waste Generation per kWh of Net Electricity Produced - Average System (surface mining & average user by river). . . . . . . . . . . . . . . . . . . . . . . . 32
Table 30: Measuring CO Emissions - Definitions and Numbers . . . . . . . . . . . . . . . . . . . . . . . . . . . 342
Table 31: Breakdown of Non-Coal CO Results for Lime and Limestone. . . . . . . . . . . . . . . . . . . . 352
Table 32: Air Emissions (Excluding CO ) . . . . . . . . . . . . . . . . . . . . . . . . . . . . . . . . . . . . . . . . . . . . . 352
Table 33: Energy Efficiency and Energy Ratio Definitions . . . . . . . . . . . . . . . . . . . . . . . . . . . . . . . . 40Table 34: Efficiencies and Energy Ratio Results . . . . . . . . . . . . . . . . . . . . . . . . . . . . . . . . . . . . . . . . 41Table 35: Energy - Definitions and Values . . . . . . . . . . . . . . . . . . . . . . . . . . . . . . . . . . . . . . . . . . . . 41Table 36: Breakdown of Non-Coal Energy for Lime and Limestone. . . . . . . . . . . . . . . . . . . . . . . . 42Table 37: Resource Consumption . . . . . . . . . . . . . . . . . . . . . . . . . . . . . . . . . . . . . . . . . . . . . . . . . . . 44Table 38: Sensitivity Analysis Condensed Results - Average System (surface mining). . . . . . . . . . 49Table 39: Sensitivity Analysis Efficiencies and Energy Ratios - Average System. . . . . . . . . . . . . . . 50
x
Table 40: Sensitivity Results for Power Plant Efficiency - Percent Change. . . . . . . . . . . . . . . . . . . 53Table 41: Energy Efficiencies and Ratios - Sensitivity Results for Changes in Power Plant Efficiency. . . . . . . . . . . . . . . . . . . . . . . . 53Table 42: Plant Material Requirements Used in Sensitivity Analysis. . . . . . . . . . . . . . . . . . . . . . . . 54Table 43: Coal Mining Methane Emissions Used in Sensitivity. . . . . . . . . . . . . . . . . . . . . . . . . . . . 55Table 44: Energy Efficiencies and Ratios - Sensitivity Results for Changes in Transportation. . . . . 56Table 45: Most Significant Stressor Results for Changes in Transportation . . . . . . . . . . . . . . . . . . . 56Table 46: Recovered FGC Waste Sensitivity Numbers (Average and NSPS only). . . . . . . . . . . . . . 58Table 47: Recovered Ash Sensitivity Numbers (Average, NSPS, & LEBS). . . . . . . . . . . . . . . . . . . 58Table 48: Impacts Associated with Stressor Categories . . . . . . . . . . . . . . . . . . . . . . . . . . . . . . . . . . . 60Table 49: London versus Photochemical Smog. . . . . . . . . . . . . . . . . . . . . . . . . . . . . . . . . . . . . . . . . 65Table 50: Aquatic Organisms Lost - Due to Acidification of Lakes and Streams . . . . . . . . . . . . . . . 67Table 51: Comparison of Limestone FGC versus Copper Oxide Process. . . . . . . . . . . . . . . . . . . . . 80Table 52: Coal Mining Methane Emissions for 1996. . . . . . . . . . . . . . . . . . . . . . . . . . . . . . . . . . . . . 81Table 53: Applications and Requirements for Recovered Methane . . . . . . . . . . . . . . . . . . . . . . . . . . 82Table 54: Power Plant FGC Waste and Ash . . . . . . . . . . . . . . . . . . . . . . . . . . . . . . . . . . . . . . . . . . . 83
xi
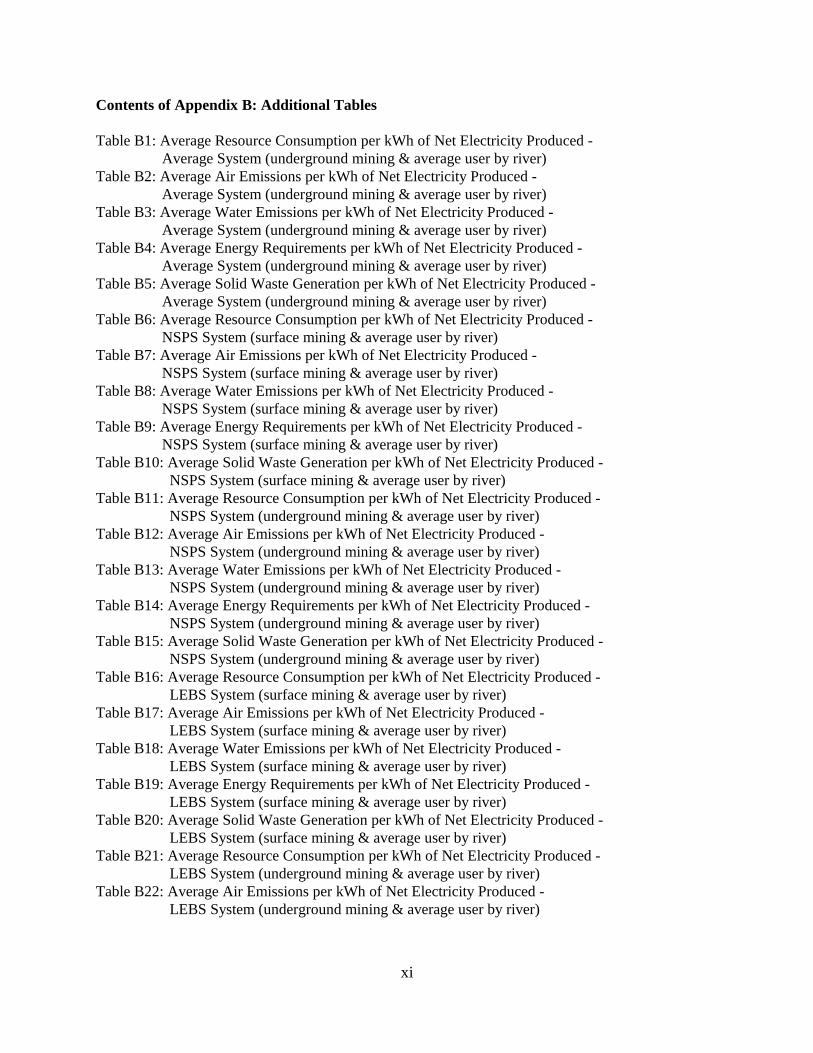
Contents of Appendix B: Additional Tables
Table B1: Average Resource Consumption per kWh of Net Electricity Produced - Average System (underground mining & average user by river)
Table B2: Average Air Emissions per kWh of Net Electricity Produced - Average System (underground mining & average user by river)
Table B3: Average Water Emissions per kWh of Net Electricity Produced - Average System (underground mining & average user by river)
Table B4: Average Energy Requirements per kWh of Net Electricity Produced - Average System (underground mining & average user by river)
Table B5: Average Solid Waste Generation per kWh of Net Electricity Produced - Average System (underground mining & average user by river)
Table B6: Average Resource Consumption per kWh of Net Electricity Produced - NSPS System (surface mining & average user by river)
Table B7: Average Air Emissions per kWh of Net Electricity Produced - NSPS System (surface mining & average user by river)
Table B8: Average Water Emissions per kWh of Net Electricity Produced - NSPS System (surface mining & average user by river)
Table B9: Average Energy Requirements per kWh of Net Electricity Produced - NSPS System (surface mining & average user by river)
Table B10: Average Solid Waste Generation per kWh of Net Electricity Produced - NSPS System (surface mining & average user by river)
Table B11: Average Resource Consumption per kWh of Net Electricity Produced - NSPS System (underground mining & average user by river)
Table B12: Average Air Emissions per kWh of Net Electricity Produced - NSPS System (underground mining & average user by river)
Table B13: Average Water Emissions per kWh of Net Electricity Produced - NSPS System (underground mining & average user by river)
Table B14: Average Energy Requirements per kWh of Net Electricity Produced - NSPS System (underground mining & average user by river)
Table B15: Average Solid Waste Generation per kWh of Net Electricity Produced - NSPS System (underground mining & average user by river)
Table B16: Average Resource Consumption per kWh of Net Electricity Produced - LEBS System (surface mining & average user by river)
Table B17: Average Air Emissions per kWh of Net Electricity Produced - LEBS System (surface mining & average user by river)
Table B18: Average Water Emissions per kWh of Net Electricity Produced - LEBS System (surface mining & average user by river)
Table B19: Average Energy Requirements per kWh of Net Electricity Produced - LEBS System (surface mining & average user by river)
Table B20: Average Solid Waste Generation per kWh of Net Electricity Produced - LEBS System (surface mining & average user by river)
Table B21: Average Resource Consumption per kWh of Net Electricity Produced - LEBS System (underground mining & average user by river)
Table B22: Average Air Emissions per kWh of Net Electricity Produced - LEBS System (underground mining & average user by river)
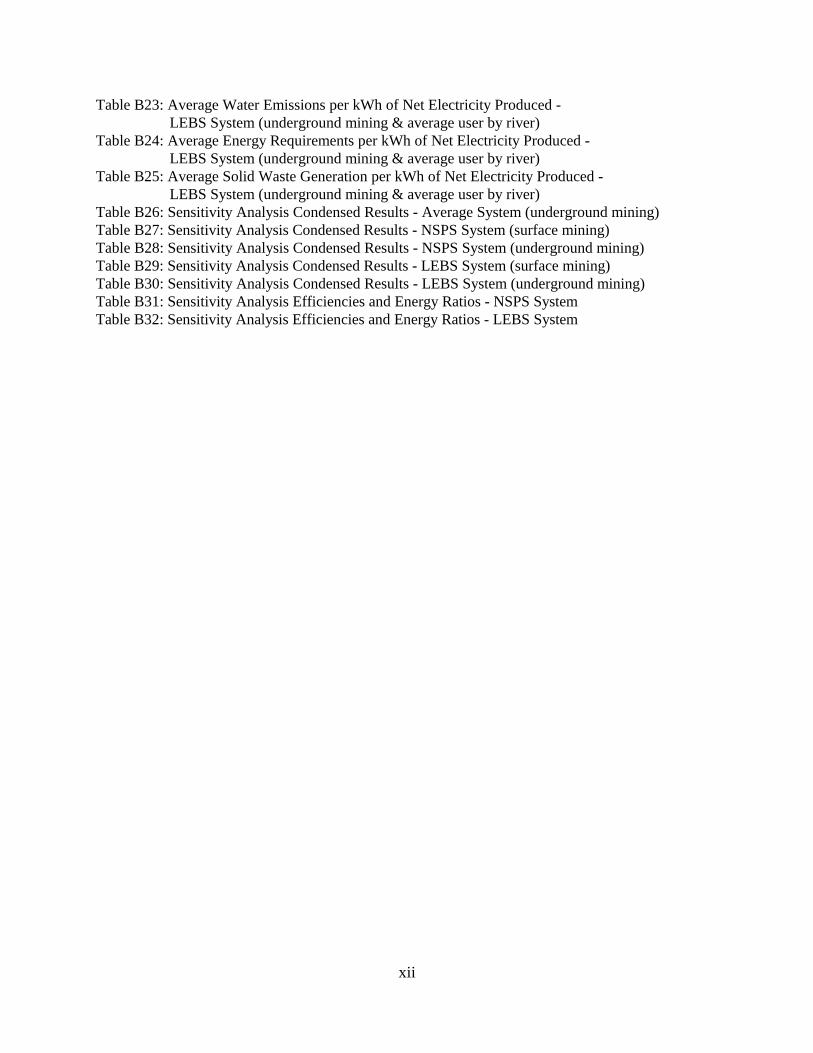
xii
Table B23: Average Water Emissions per kWh of Net Electricity Produced - LEBS System (underground mining & average user by river)
Table B24: Average Energy Requirements per kWh of Net Electricity Produced - LEBS System (underground mining & average user by river)
Table B25: Average Solid Waste Generation per kWh of Net Electricity Produced - LEBS System (underground mining & average user by river)
Table B26: Sensitivity Analysis Condensed Results - Average System (underground mining)Table B27: Sensitivity Analysis Condensed Results - NSPS System (surface mining)Table B28: Sensitivity Analysis Condensed Results - NSPS System (underground mining)Table B29: Sensitivity Analysis Condensed Results - LEBS System (surface mining)Table B30: Sensitivity Analysis Condensed Results - LEBS System (underground mining)Table B31: Sensitivity Analysis Efficiencies and Energy Ratios - NSPS SystemTable B32: Sensitivity Analysis Efficiencies and Energy Ratios - LEBS System
xiii
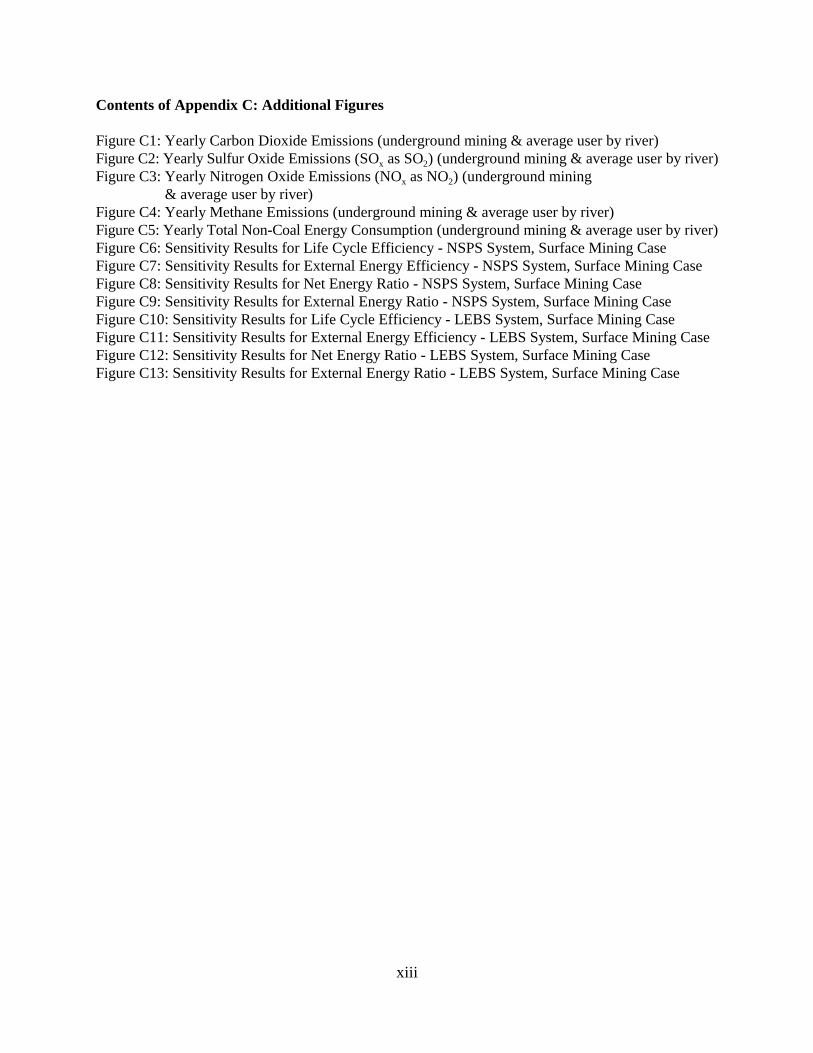
Contents of Appendix C: Additional Figures
Figure C1: Yearly Carbon Dioxide Emissions (underground mining & average user by river)Figure C2: Yearly Sulfur Oxide Emissions (SO as SO ) (underground mining & average user by river)x 2
Figure C3: Yearly Nitrogen Oxide Emissions (NO as NO ) (underground miningx 2
& average user by river)Figure C4: Yearly Methane Emissions (underground mining & average user by river)Figure C5: Yearly Total Non-Coal Energy Consumption (underground mining & average user by river)Figure C6: Sensitivity Results for Life Cycle Efficiency - NSPS System, Surface Mining CaseFigure C7: Sensitivity Results for External Energy Efficiency - NSPS System, Surface Mining CaseFigure C8: Sensitivity Results for Net Energy Ratio - NSPS System, Surface Mining CaseFigure C9: Sensitivity Results for External Energy Ratio - NSPS System, Surface Mining CaseFigure C10: Sensitivity Results for Life Cycle Efficiency - LEBS System, Surface Mining CaseFigure C11: Sensitivity Results for External Energy Efficiency - LEBS System, Surface Mining CaseFigure C12: Sensitivity Results for Net Energy Ratio - LEBS System, Surface Mining CaseFigure C13: Sensitivity Results for External Energy Ratio - LEBS System, Surface Mining Case
1
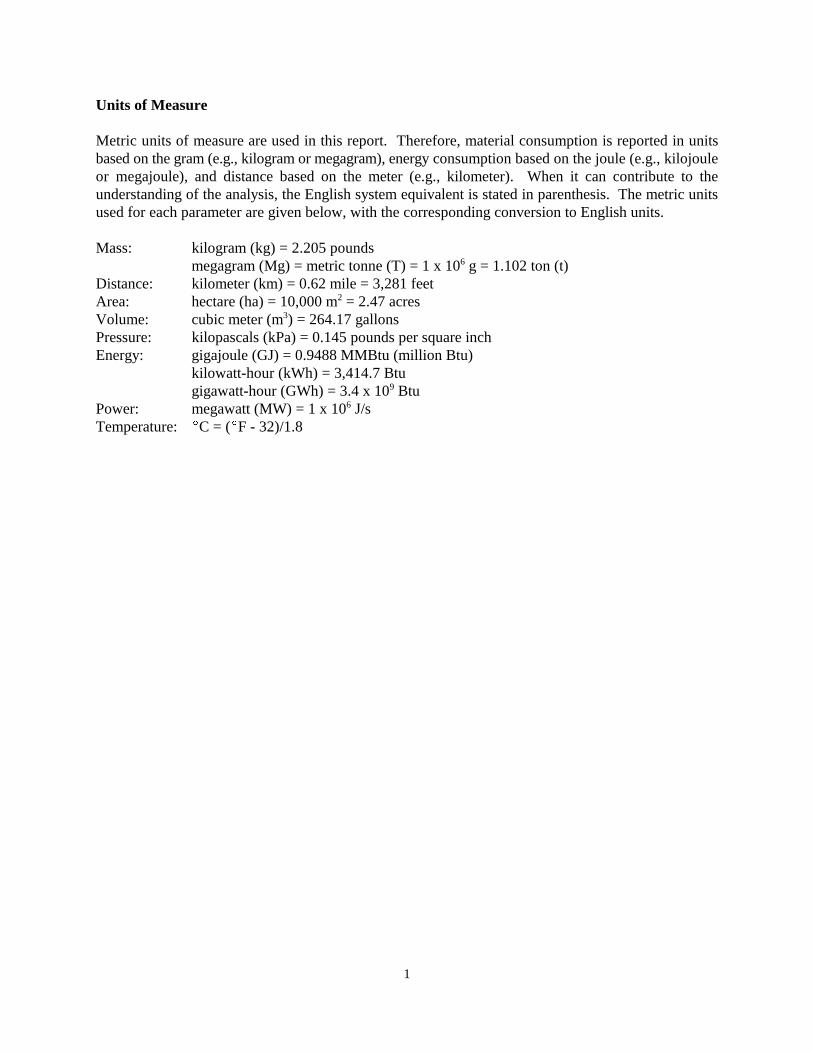
Units of Measure
Metric units of measure are used in this report. Therefore, material consumption is reported in unitsbased on the gram (e.g., kilogram or megagram), energy consumption based on the joule (e.g., kilojouleor megajoule), and distance based on the meter (e.g., kilometer). When it can contribute to theunderstanding of the analysis, the English system equivalent is stated in parenthesis. The metric unitsused for each parameter are given below, with the corresponding conversion to English units.
Mass: kilogram (kg) = 2.205 poundsmegagram (Mg) = metric tonne (T) = 1 x 10 g = 1.102 ton (t)6
Distance: kilometer (km) = 0.62 mile = 3,281 feetArea: hectare (ha) = 10,000 m = 2.47 acres2
Volume: cubic meter (m ) = 264.17 gallons3
Pressure: kilopascals (kPa) = 0.145 pounds per square inchEnergy: gigajoule (GJ) = 0.9488 MMBtu (million Btu)
kilowatt-hour (kWh) = 3,414.7 Btugigawatt-hour (GWh) = 3.4 x 10 Btu9
Power: megawatt (MW) = 1 x 10 J/s6
Temperature: (C = ((F - 32)/1.8
2
Abbreviations and Terms
CAAA - 1990 Clean Air Act AmendmentsCFC - chloroflourocarbonsCFR - Code of Federal RegulationsDEAM - Data for Environmental Analysis and Management (TEAM database)®
EIA - Energy Information AdministrationEPRI - Electric Power Research InstituteFETC - Federal Energy Technology CenterFGC - flue gas clean-upGWP - global warming potentialHAP - hazardous air pollutantHHV - higher heating valueIEA - International Energy AgencyIGCC - integrated gasification combined cycleIPCC - Intergovernmental Panel on Climate ChangeLCA - life cycle assessmentLEBS - low emission boiler systemMAF - moisture and ash free (coal)MM - millionMMBtu - million British thermal unitsMulch - A natural or artificial layer of plant residue or other materials placed on the soil surface to
protect seeds, to prevent blowing, to retain soil moisture, to curtail erosion, and to modify soiltemperature
non-coal CO - Total system CO emissions minus the CO emissions generated from coal combustion2 2 2
non-coal energy - The total energy consumed by the system excluding the energy content of the coal tothe power plant
NMHCs - non-methane hydrocarbons, including VOCsNREL - National Renewable Energy LaboratoryNSPS - New Source Performance StandardOECD - Organization for Economic Co-operation and DevelopmentOverburden - The earth, rock, and other material that lie above the coalPAN - peroxyacetal nitrateppmv - parts per million by volumeReclamation- The process of reconverting mined land to its former or other productive usesStressor - A term that collectively defines emissions, resource consumption, and energy use; a
substance or activity that results in a change to the natural environmentStressor category - A group of stressors that defines possible impactsTEAM - Tools for Environmental Analysis and Management (software by Ecobalance, Inc.)®
U.S. DOE - United States Department of EnergyU.S. EPA - United States Environmental Protection AgencyVOC - volatile organic compound
3
1.0 Introduction
The history of the United States is closely linked with the availability and use of coal (U.S. DOE, 1995).Since 1984, and at varying times before that, coal has been the leading single source of energy in the U.S.(U.S. DOE, 1998), now accounting for 35.3% of all energy produced. Coal accounts for greater than56% of the fuel consumed in making electricity in the U.S., and 87% of all coal consumed is used in coal-fired power plants. Along with its enormous contributions to society’s demand for energy, the use of coalhas resulted in some negative environmental effects. Coal mining can result in the destruction of landwhich is strip mined, the production of overburden waste and slag heaps, mine fires, and the occasionalcollapse of underground mines. At the power plant, sulfur dioxide, NO , and particulate matter arex
released into the air. In the production of electricity, coal is responsible for 93.4% and 80.2% of totalU.S. SO and NO emissions, respectively. Additionally, because coal is a fossil fuel, its use results in2 x
the production of CO . In the U.S., coal is responsible for 35.8% of all CO production, and 73.5% of2 2
electric power plant CO (1997 AER, figure 12.5). The use of pollution control technologies and low-2
sulfur coals can result in dramatically lower environmental emissions from coal-fired power plants.Additionally, efforts to reclaim coal mines have minimized permanent damage to coal-bearing lands.
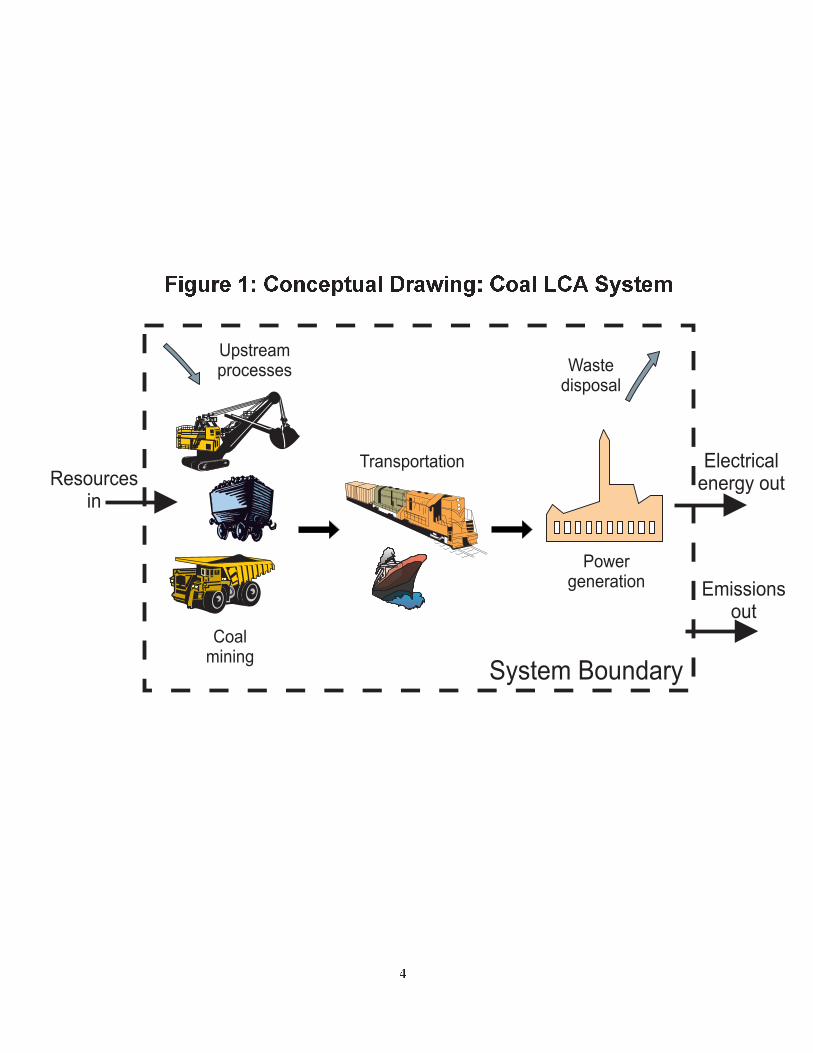
Because coal plays such a significant role in the generation of electricity in the U.S., understanding theimpact it has on the environment is an important part of understanding energy and environmental issuesin general. To this end, the National Renewable Energy Laboratory (NREL) has performed a life cycleassessment (LCA) on three coal-fired power systems. In addition to focusing on the impacts from thepower plant, the emissions, resource consumption, and energy use of all processes required for the powerplant to operate, including any necessary waste disposal and material recycling, were assessed. Figure1 is a conceptual drawing of the coal-to-electricity system that was studied. To examine both the currentstatus of electricity from coal as well as emerging and future technologies, three systems were examined:1) a plant that represents the average emissions and efficiency of currently operating coal-fired powerplants in the U.S., 2) a new coal-fired power plant that meets the New Source Performance Standards(NSPS), and 3) a highly advanced coal-fired power plant utilizing a low emission boiler system (LEBS).
All three power plants were assumed to use Illinois No. 6 coal, excavated from a mine located in centralIllinois. Both surface (strip) and underground (longwall) mining were examined. The coal is transportedvia rail, truck, or a combination of rail and barge by one of four cases tested: average user by land,average user by river, farthest user, and mine mouth. Other materials such as chemicals and wastes aretransported via truck and rail. The sizes of the Average, NSPS, and LEBS power plants are 360 MW,425 MW, and 404 MW, respectively, and factor for the base case analysis each plant was assumed tooperate at a 60% capacity.
The primary goal of this life cycle assessment is to quantify and analyze the environmental aspects ofproducing electricity from a coal-fired power system. All resources, emissions, and energy flows of eachsystem were inventoried in a cradle-to-grave manner, including processes that are common between thethree systems. These analyses, therefore, can be compared, but were not conducted for the purpose ofcomparison. Rather, the total environmental picture of each system, distinct from the others, can bediscerned from this analysis.
To quantify the total economic and environmental benefits and drawbacks of a process, an LCA can beperformed in conjunction with a technoeconomic analysis. The results of the LCA can be used to
Upstreamprocesses Waste
disposal
Coalmining
Transportation
Powergeneration
Electricalenergy out
System Boundary
Emissionsout
Resourcesin
Figure 1: Conceptual Drawing: Coal LCA System
4
5
identify opportunities to reduce the environmental burden of the system through design improvements.The cost of these changes, can then be assessed using the model developed for the economic analysis.Because many economic studies have been conducted on these coal systems in the past by groups suchas the Federal Energy Technology Center (FETC), the Electric Power Research Institute (EPRI), Bechtel,and others, economics were not examined as a part of this work. However, recommendations on designchanges to be incorporated in the future are made, in section 10.0 and the parts of the system that areresponsible for the highest rates of emissions, resource consumption, and energy use are identified insection 6.0 of the report.
2.0 Methodology
The methodology used in conducting this LCA is based on the standard three-component model set forthby the Society of Environmental Toxicology and Chemistry (SETAC, 1991). The first component,inventory, consists of material and energy balances for each process within the system. These flows areadded to give the total emissions, resource consumption, and energy use for the system. In performingthe second component, improvement, the results of the inventory step are assessed to identifyopportunities to reduce the effects the system has on the environment. Process changes, materialsubstitution, and recycling possibilities are explored.
The third component, impact assessment, is the least developed and most controversial of the three.Several options for describing the possible impacts on the environment as a result of the system exist.The method for impact assessment that is often the most attractive, valuation, is also the most subjective.It involves assigning values to each environmental stressor (emission, resource used, or amount of energyconsumed) based on its perceived impact; a total “score” or “set of scores” can then be determined foreach system studied. The determination of the severity of an impact when assigning a score to it is highlydependent upon the frame of reference of the analyst or purpose of the study. A less contentious methodis known as categorization. Each stressor is assigned to one or more stressor categories to obtain aqualitative picture of the possible impacts on the environment. Example stressor categories aregreenhouse gases, ozone depleters, carcinogens, resource depletion, and habitat changes. This method,while not providing a quantitative measure of the potential environmental damages, assists in the overallunderstanding of environmental benefits and drawbacks of a process. Finally, a less-is-better approachmay be taken during the impact assessment phase of conducting an LCA. In this method, feweremissions, less resource consumption, and less energy use are aimed for. This approach can be appliedto either analyses of single systems by revealing whether or not design changes made during theimprovement stage of the assessment actually reduced environmental damage, or to comparative analysesby determining which system results in lower amounts of a certain stressor. This method cannot,however, distinguish which system has the greatest consequences if they result in different stressors. Forexample, it is difficult and debatable to say whether a system that emits higher levels of greenhouse gasesis better or worse than a system that results in the release of carcinogens to the environment. For thisstudy, the less-is-better and categorization approaches were taken.
2.1 System Boundaries and Data Availability
The system boundaries for this LCA were drawn as broadly as possible; all of the major processesnecessary to produce electricity from coal such as coal mining, equipment manufacturing, transportation,and chemicals production for the mining and power plant operations were included. The material andenergy flows of processes involved in the extraction of raw materials and the production of intermediate
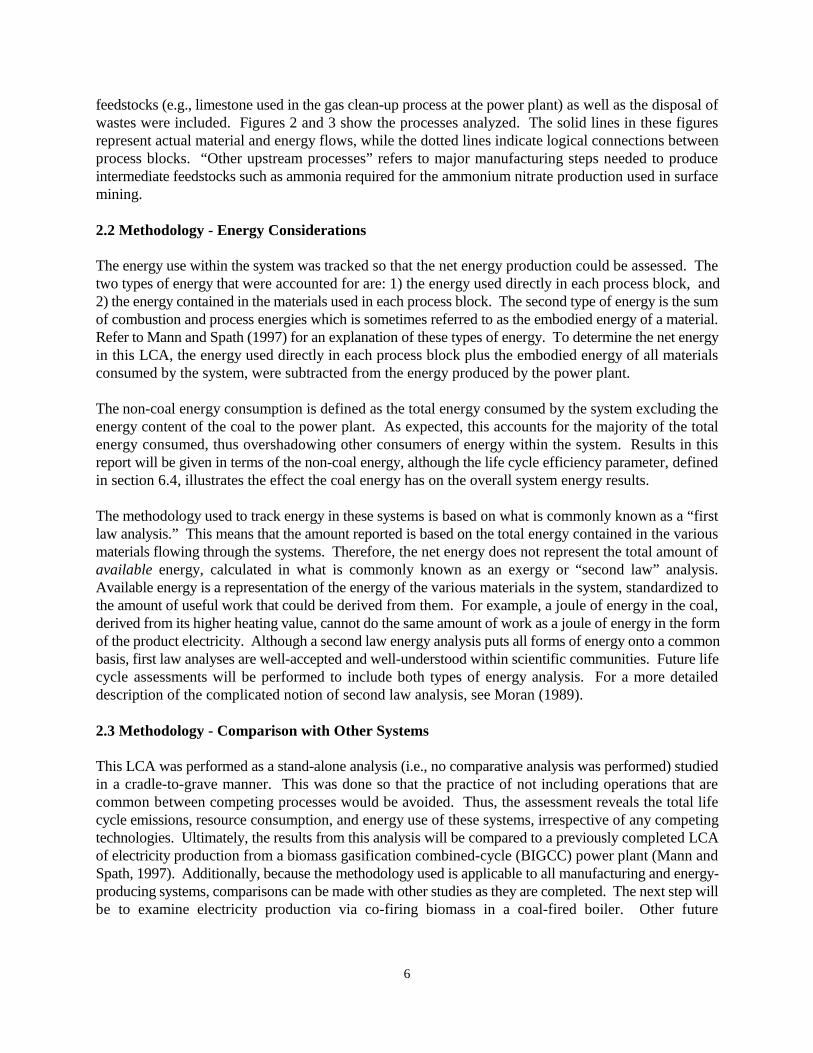
6
feedstocks (e.g., limestone used in the gas clean-up process at the power plant) as well as the disposal ofwastes were included. Figures 2 and 3 show the processes analyzed. The solid lines in these figuresrepresent actual material and energy flows, while the dotted lines indicate logical connections betweenprocess blocks. “Other upstream processes” refers to major manufacturing steps needed to produceintermediate feedstocks such as ammonia required for the ammonium nitrate production used in surfacemining.
2.2 Methodology - Energy Considerations
The energy use within the system was tracked so that the net energy production could be assessed. Thetwo types of energy that were accounted for are: 1) the energy used directly in each process block, and2) the energy contained in the materials used in each process block. The second type of energy is the sumof combustion and process energies which is sometimes referred to as the embodied energy of a material.Refer to Mann and Spath (1997) for an explanation of these types of energy. To determine the net energyin this LCA, the energy used directly in each process block plus the embodied energy of all materialsconsumed by the system, were subtracted from the energy produced by the power plant.
The non-coal energy consumption is defined as the total energy consumed by the system excluding theenergy content of the coal to the power plant. As expected, this accounts for the majority of the totalenergy consumed, thus overshadowing other consumers of energy within the system. Results in thisreport will be given in terms of the non-coal energy, although the life cycle efficiency parameter, definedin section 6.4, illustrates the effect the coal energy has on the overall system energy results.
The methodology used to track energy in these systems is based on what is commonly known as a “firstlaw analysis.” This means that the amount reported is based on the total energy contained in the variousmaterials flowing through the systems. Therefore, the net energy does not represent the total amount ofavailable energy, calculated in what is commonly known as an exergy or “second law” analysis.Available energy is a representation of the energy of the various materials in the system, standardized tothe amount of useful work that could be derived from them. For example, a joule of energy in the coal,derived from its higher heating value, cannot do the same amount of work as a joule of energy in the formof the product electricity. Although a second law energy analysis puts all forms of energy onto a commonbasis, first law analyses are well-accepted and well-understood within scientific communities. Future lifecycle assessments will be performed to include both types of energy analysis. For a more detaileddescription of the complicated notion of second law analysis, see Moran (1989).
2.3 Methodology - Comparison with Other Systems
This LCA was performed as a stand-alone analysis (i.e., no comparative analysis was performed) studiedin a cradle-to-grave manner. This was done so that the practice of not including operations that arecommon between competing processes would be avoided. Thus, the assessment reveals the total lifecycle emissions, resource consumption, and energy use of these systems, irrespective of any competingtechnologies. Ultimately, the results from this analysis will be compared to a previously completed LCAof electricity production from a biomass gasification combined-cycle (BIGCC) power plant (Mann andSpath, 1997). Additionally, because the methodology used is applicable to all manufacturing and energy-producing systems, comparisons can be made with other studies as they are completed. The next step willbe to examine electricity production via co-firing biomass in a coal-fired boiler. Other future
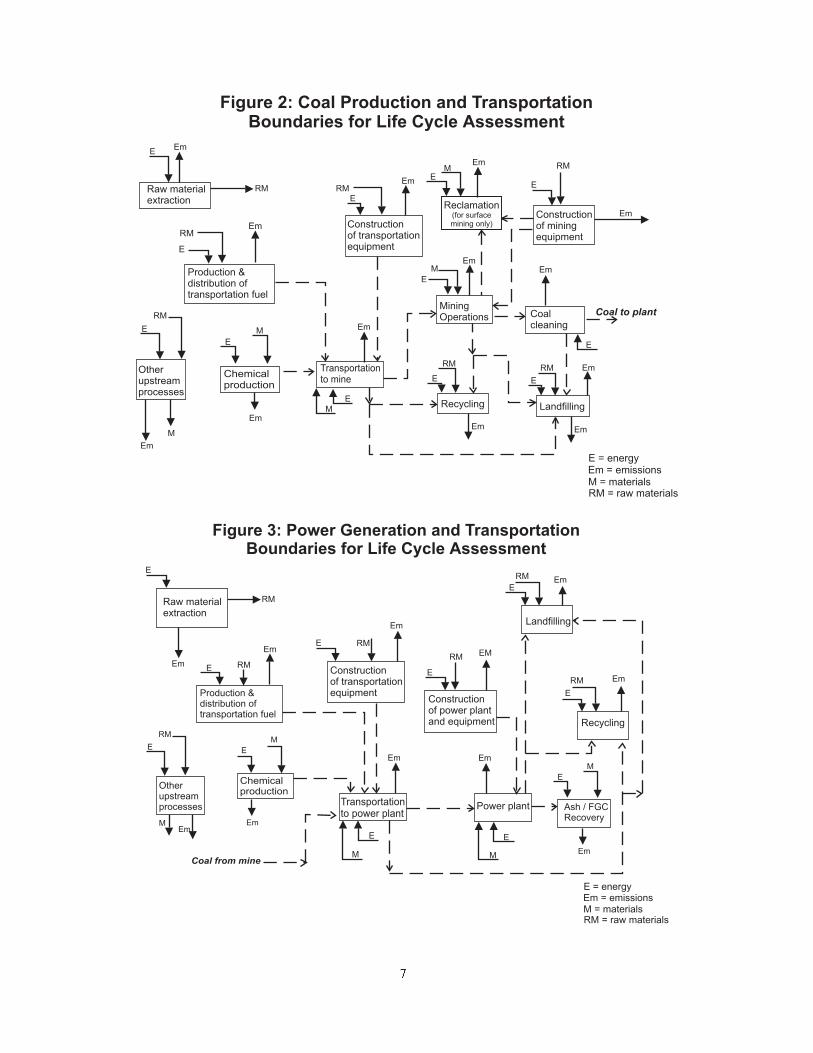
Figure 2: Coal Production and TransportationBoundaries for Life Cycle Assessment
Otherupstreamprocesses
Chemicalproduction
Constructionof miningequipment
Constructionof transportationequipment
RM
E
E
RM
ERME
M
E
Em
Transportationto mine
M
E
Em
Em
Em
Em
Em
Em
Em
Em
MiningOperations
M
M
E
E
E
Raw materialextraction
Coalcleaning
Coal to plant
EmRM
E
Landfilling
Em Em
RM
E
Recycling
RM = raw materialsM = materials
E = energyEm = emissions
Reclamation(for surfacemining only)
RM
E
Production &distribution oftransportation fuel
Em
RM
M
Figure 3: Power Generation and TransportationBoundaries for Life Cycle Assessment
RM = raw materialsM = materials
E = energyEm = emissions
Constructionof power plantand equipment
RM
E
Transportationto power plant
M
E
Em
Constructionof transportationequipment
RM
E
Em
EM
Power plant
M
E
Em
RM
E
Landfilling
Em
RM
E
Recycling
Em
Coal from mine
Otherupstreamprocesses
Chemicalproduction
RM
EM
M
E
E
EmEm
E
Production &distribution oftransportation fuel
Em
E
RM
Em
Raw materialextraction
Ash / FGCRecovery
Em
RM
M
7
8
studies include electricity generation systems for direct wood combustion, natural gas-fired powersystems, and power plants using different biomass feedstocks such as alfalfa and switchgrass.
2.4 Methodology - Sensitivity Analysis
A sensitivity analysis was conducted to determine the parameters that had the largest effects on the resultsand to determine the impact of estimated data as well as variations in data on the conclusions. Variablesincluded in the sensitivity analysis were chosen to reflect system areas that had inherently more unknownsin the data as well as areas in which variations will likely occur during normal operations. Eachparameter was changed independently of all others so that the magnitude of its effect on the base casecould be assessed. Therefore, no one single sensitivity case reflects the best or worse-case scenarios forthis system. However, any dependence other variables have on the variable being changed is taken intoaccount. For instance, changing the power plant efficiency affects the amount of coal required at theplant, which in turn affects the coal mining and transportation requirements. These effects were takeninto account automatically in the LCA model.
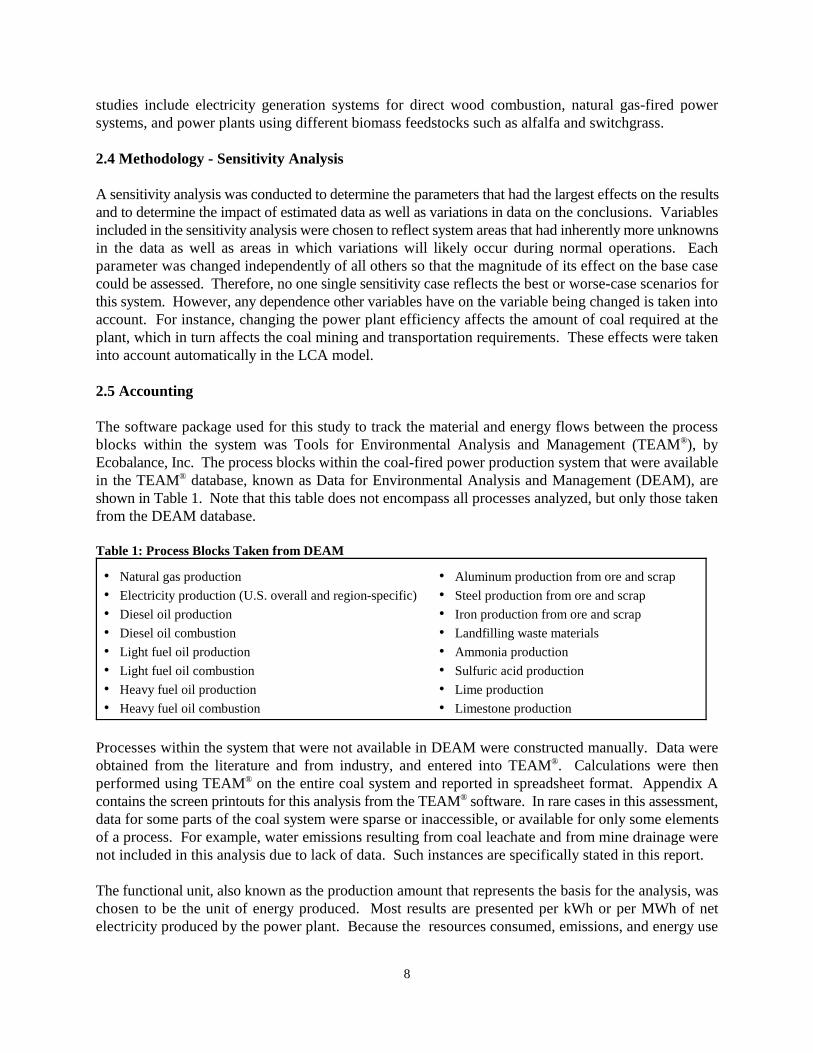
2.5 Accounting
The software package used for this study to track the material and energy flows between the processblocks within the system was Tools for Environmental Analysis and Management (TEAM ), by®
Ecobalance, Inc. The process blocks within the coal-fired power production system that were availablein the TEAM database, known as Data for Environmental Analysis and Management (DEAM), are®
shown in Table 1. Note that this table does not encompass all processes analyzed, but only those takenfrom the DEAM database.
Table 1: Process Blocks Taken from DEAM
• Natural gas production • Aluminum production from ore and scrap
• Electricity production (U.S. overall and region-specific)• Steel production from ore and scrap
• Diesel oil production • Iron production from ore and scrap
• Diesel oil combustion • Landfilling waste materials
• Light fuel oil production • Ammonia production
• Light fuel oil combustion • Sulfuric acid production
• Heavy fuel oil production • Lime production
• Heavy fuel oil combustion • Limestone production
Processes within the system that were not available in DEAM were constructed manually. Data wereobtained from the literature and from industry, and entered into TEAM . Calculations were then®
performed using TEAM on the entire coal system and reported in spreadsheet format. Appendix A®
contains the screen printouts for this analysis from the TEAM software. In rare cases in this assessment,®
data for some parts of the coal system were sparse or inaccessible, or available for only some elementsof a process. For example, water emissions resulting from coal leachate and from mine drainage werenot included in this analysis due to lack of data. Such instances are specifically stated in this report.
The functional unit, also known as the production amount that represents the basis for the analysis, waschosen to be the unit of energy produced. Most results are presented per kWh or per MWh of netelectricity produced by the power plant. Because the resources consumed, emissions, and energy use
9
are functions of the size of the plant and the technology, care should be taken in scaling results to largeror smaller facilities, or applying them to other coal systems.
2.6 Time Frame and Issues in Assessing Environmental Consequences
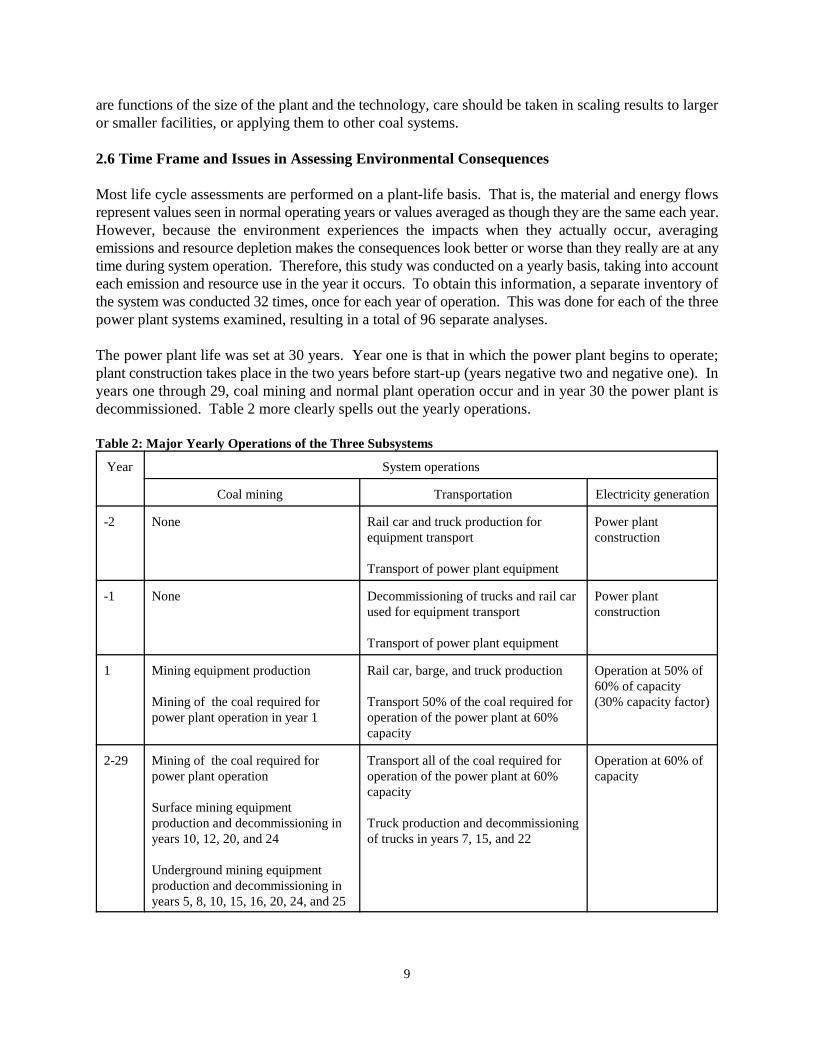
Most life cycle assessments are performed on a plant-life basis. That is, the material and energy flowsrepresent values seen in normal operating years or values averaged as though they are the same each year.However, because the environment experiences the impacts when they actually occur, averagingemissions and resource depletion makes the consequences look better or worse than they really are at anytime during system operation. Therefore, this study was conducted on a yearly basis, taking into accounteach emission and resource use in the year it occurs. To obtain this information, a separate inventory ofthe system was conducted 32 times, once for each year of operation. This was done for each of the threepower plant systems examined, resulting in a total of 96 separate analyses.
The power plant life was set at 30 years. Year one is that in which the power plant begins to operate;plant construction takes place in the two years before start-up (years negative two and negative one). Inyears one through 29, coal mining and normal plant operation occur and in year 30 the power plant isdecommissioned. Table 2 more clearly spells out the yearly operations.
Table 2: Major Yearly Operations of the Three Subsystems
Year System operations
Coal mining Transportation Electricity generation
-2 None Rail car and truck production forequipment transport
Transport of power plant equipment
Power plantconstruction
-1 None Decommissioning of trucks and rail carused for equipment transport
Transport of power plant equipment
Power plantconstruction
1 Mining equipment production
Mining of the coal required forpower plant operation in year 1
Rail car, barge, and truck production
Transport 50% of the coal required foroperation of the power plant at 60%capacity
Operation at 50% of60% of capacity(30% capacity factor)
2-29 Mining of the coal required forpower plant operation
Surface mining equipmentproduction and decommissioning inyears 10, 12, 20, and 24
Underground mining equipmentproduction and decommissioning inyears 5, 8, 10, 15, 16, 20, 24, and 25
Transport all of the coal required foroperation of the power plant at 60%capacity
Truck production and decommissioningof trucks in years 7, 15, and 22
Operation at 60% ofcapacity
Year System operations
Coal mining Transportation Electricity generation
10
30 Mining of the coal required forpower plant operation in year 30
Reclamation for surface mining
Decommissioning of miningequipment
Transport 75% of the coal required foroperation of the power plant at 60%capacity
Decommissioning of rail cars, barges,and trucks
Operation at 75% of60% of capacity(45% capacity factor)
Decommissioning ofpower plant
3.0 Description of Pulverized Coal Boiler Plants Studied
All three power plant systems examined (Average, NSPS, and LEBS) incorporate pulverized coal boilers.From their extensive data sets and expertise in the field, researchers at the Federal Energy TechnologyCenter provided information on the performance, resource consumption, emissions, and waste generationfor the three power plant designs. A separate LCA was conducted for each system. Because the powerplant data for each case were taken from a specific plant or model, detailed in the following sections, theplant sizes for the Average, NSPS, and LEBS systems vary from 360 MW to 425 MW. The methodologyand assumptions for the mining and transportation subsystems remained the same from system to system,but varied according to the amount of coal required by each plant. The electricity generation subsystemwas changed to match the material and energy requirements of the power plants as outlined in thefollowing three sections (see section 5.4 for more details about the specific resource and emissions dataused for each system).
An entirely different coal technology, integrated gasification combined cycle (IGCC), was not includedin this analysis. Rather than using a pulverized coal boiler and a steam cycle, IGCC uses coal gasificationto produce a combustible gas that generates electricity in a gas turbine; steam is produced in a heatrecovery steam generator, and used to produce more electricity in a steam turbine. Current plans are toexamine this system in future LCAs conducted by NREL and FETC.
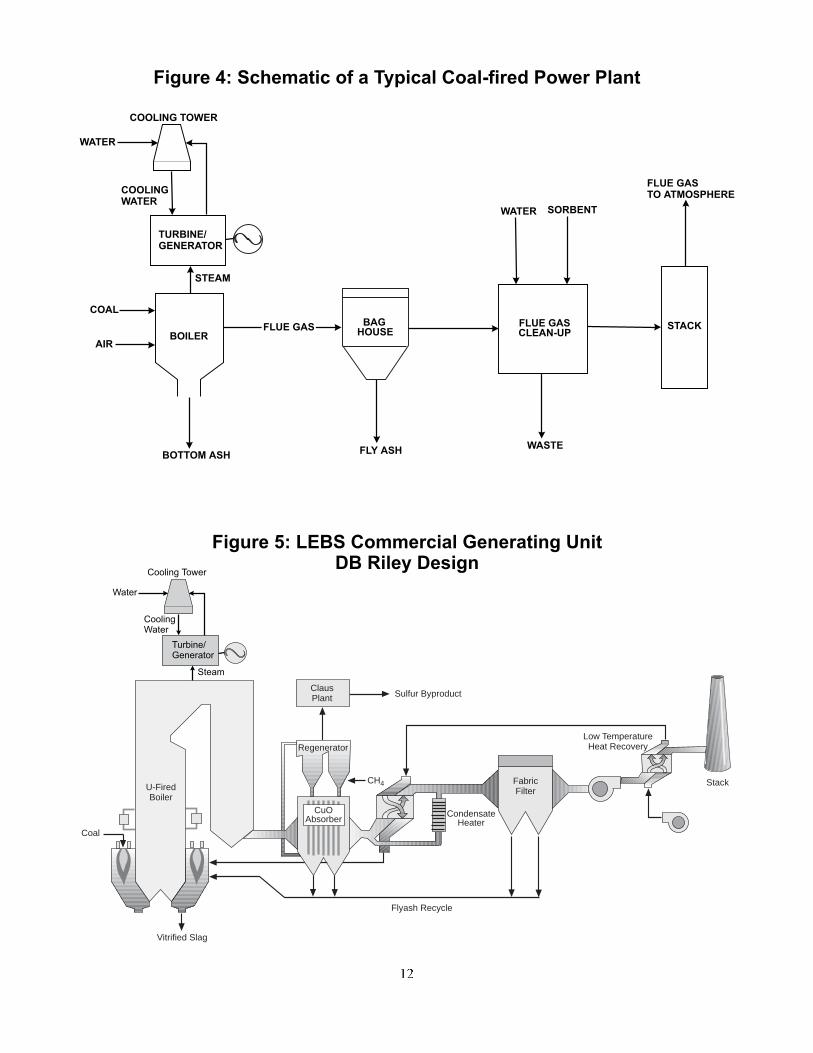
3.1 Average Plant
The Average coal power plant consists of the following main equipment/process steps: pulverized coalboiler, baghouse filter, conventional limestone flue gas clean-up (FGC) system, heat recovery steamgenerator, and steam turbine (see Figure 4). The emissions for this system represent the averageemissions from all U.S. coal-fired power plants in 1995. These were calculated by dividing the total coal-generated U.S. emissions of a particular pollutant on a weight basis (kg) by the total electricity generated(kWh) from coal in the U.S. (Utility Data Institute, 1996). To maintain a mass balance around the powerplant, a specific plant with emissions similar to the calculated averages and feeding the designated typeof coal for this LCA was identified from the database. The actual resource requirements, final emissions,and energy consumption from this identified plant were used to represent the Average power plant in thestudy. The efficiency is typical of an average base-load plant operating in the U.S. in 1995. Table 3contains the key power plant parameters for this system.
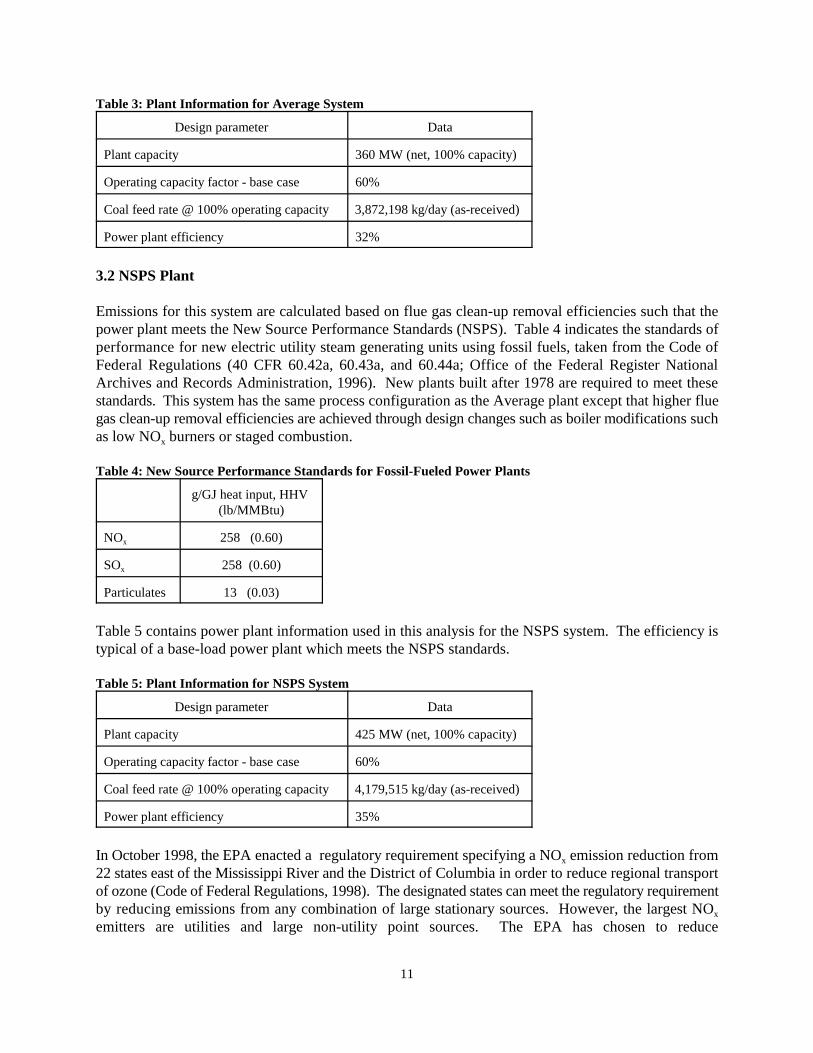
11
Table 3: Plant Information for Average System
Design parameter Data
Plant capacity 360 MW (net, 100% capacity)
Operating capacity factor - base case 60%
Coal feed rate @ 100% operating capacity 3,872,198 kg/day (as-received)
Power plant efficiency 32%
3.2 NSPS Plant
Emissions for this system are calculated based on flue gas clean-up removal efficiencies such that thepower plant meets the New Source Performance Standards (NSPS). Table 4 indicates the standards ofperformance for new electric utility steam generating units using fossil fuels, taken from the Code ofFederal Regulations (40 CFR 60.42a, 60.43a, and 60.44a; Office of the Federal Register NationalArchives and Records Administration, 1996). New plants built after 1978 are required to meet thesestandards. This system has the same process configuration as the Average plant except that higher fluegas clean-up removal efficiencies are achieved through design changes such as boiler modifications suchas low NO burners or staged combustion.x
Table 4: New Source Performance Standards for Fossil-Fueled Power Plants
g/GJ heat input, HHV (lb/MMBtu)
NOx 258 (0.60)
SOx 258 (0.60)
Particulates 13 (0.03)
Table 5 contains power plant information used in this analysis for the NSPS system. The efficiency istypical of a base-load power plant which meets the NSPS standards.
Table 5: Plant Information for NSPS System
Design parameter Data
Plant capacity 425 MW (net, 100% capacity)
Operating capacity factor - base case 60%
Coal feed rate @ 100% operating capacity 4,179,515 kg/day (as-received)
Power plant efficiency 35%
In October 1998, the EPA enacted a regulatory requirement specifying a NO emission reduction fromx
22 states east of the Mississippi River and the District of Columbia in order to reduce regional transportof ozone (Code of Federal Regulations, 1998). The designated states can meet the regulatory requirementby reducing emissions from any combination of large stationary sources. However, the largest NOx
emitters are utilities and large non-utility point sources. The EPA has chosen to reduce
Vitrified Slag
CH4 Stack
CuOAbsorber
Regenerator
ClausPlant Sulfur Byproduct
CondensateHeater
FabricFilter
Flyash Recycle
Low TemperatureHeat Recovery
U-FiredBoiler
Coal
Figure 5: LEBS Commercial Generating UnitDB Riley Design
BOILER
FLUE GASCLEAN-UP
COOLING TOWER
WATER
COOLINGWATER
COAL
STEAM
AIR
BOTTOM ASH FLY ASH
WATER SORBENT
WASTE
FLUE GASTO ATMOSPHERE
STACK
Figure 4: Schematic of a Typical Coal-fired Power Plant
BAGHOUSE
FLUE GAS
TURBINE/GENERATOR
Cooling Tower
Water
Steam
CoolingWater
Turbine/Generator
12
13
emissions to 65 g of NO /GJ of heat input (0.15 lb/MMBtu) from a power generation facility. This levelx
is significantly less than the NSPS limit of 258 g/GJ (0.60 lb/MMBtu) listed in Table 4. In response tothis regulation, many power generation facilities will reduce their NO emissions by adding a process stepx
that incorporates selective catalytic reduction or selective noncatalytic reduction. This LCA could bemodified to include one of these NO reduction technologies by incorporating the resources, energy, andx
emissions related to ammonia production, transport, and use.
3.3 LEBS Plant
Emissions for this system are those forecasted from a future plant utilizing a Low Emission BoilerSystem. LEBS is projected to have significantly higher thermal efficiency, better performance, and alower cost of electricity than current coal-fired power plants. The technology being considered in thisassessment is by the developer, DB Riley Inc. (Ruth, 1997), and is being researched under the Departmentof Energy’s sponsorship. The objective of the LEBS program is to produce technologies that result inlower emissions such that NO and SO emissions are 1/6 of those specified by NSPS and particulatex x
emissions are 1/3 of NSPS. The DB Riley technology uses a low-NO system with advanced burners,x
air staging, and a wet ash slagging system. The copper oxide flue gas clean-up process utilizes aregenerable sorbent, removing both SO and NO from the flue gas and producing sulfuric acid or sulfur2 x
as a by-product instead of creating a solid waste. NO reduction occurs through the reaction of thex
sulfated sorbent with ammonia, which is injected prior to catalyst rejuvenation. The sorbent is thenregenerated using natural gas as the reducing agent. Figure 5 is a sketch of what this theoretical plantwould look like. Table 6 contains power plant information used in this analysis for the LEBS system.
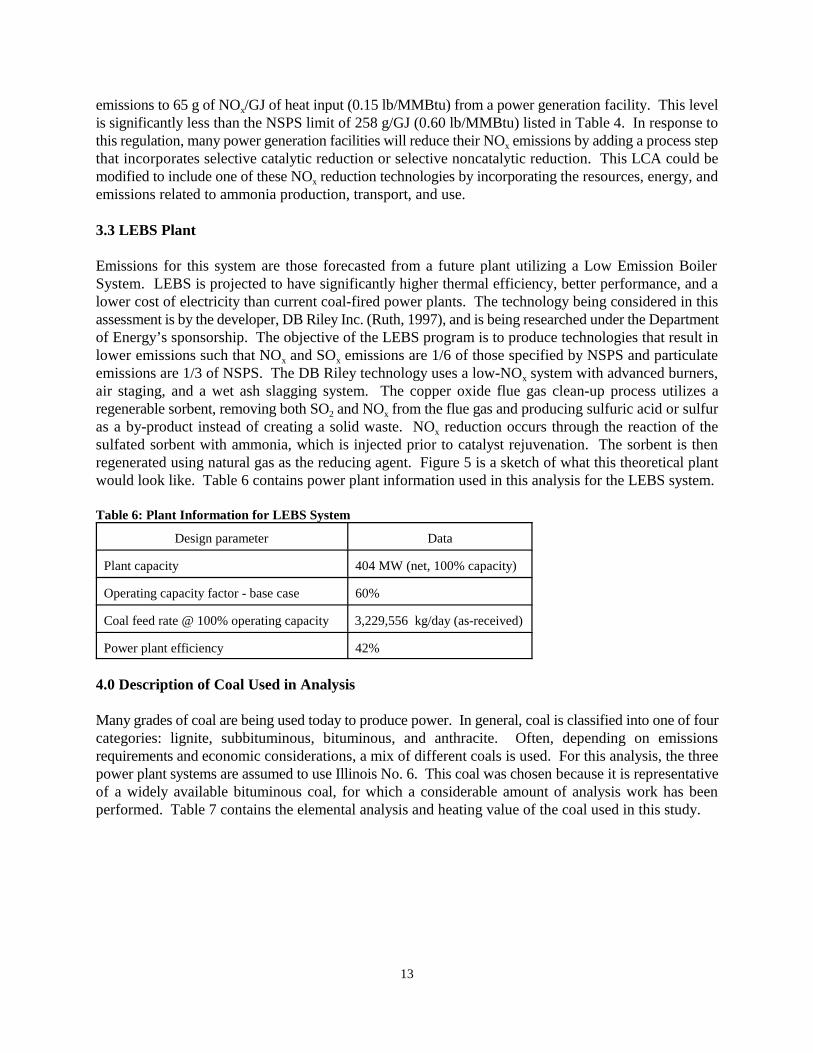
Table 6: Plant Information for LEBS System
Design parameter Data
Plant capacity 404 MW (net, 100% capacity)
Operating capacity factor - base case 60%
Coal feed rate @ 100% operating capacity 3,229,556 kg/day (as-received)
Power plant efficiency 42%
4.0 Description of Coal Used in Analysis
Many grades of coal are being used today to produce power. In general, coal is classified into one of fourcategories: lignite, subbituminous, bituminous, and anthracite. Often, depending on emissionsrequirements and economic considerations, a mix of different coals is used. For this analysis, the threepower plant systems are assumed to use Illinois No. 6. This coal was chosen because it is representativeof a widely available bituminous coal, for which a considerable amount of analysis work has beenperformed. Table 7 contains the elemental analysis and heating value of the coal used in this study.
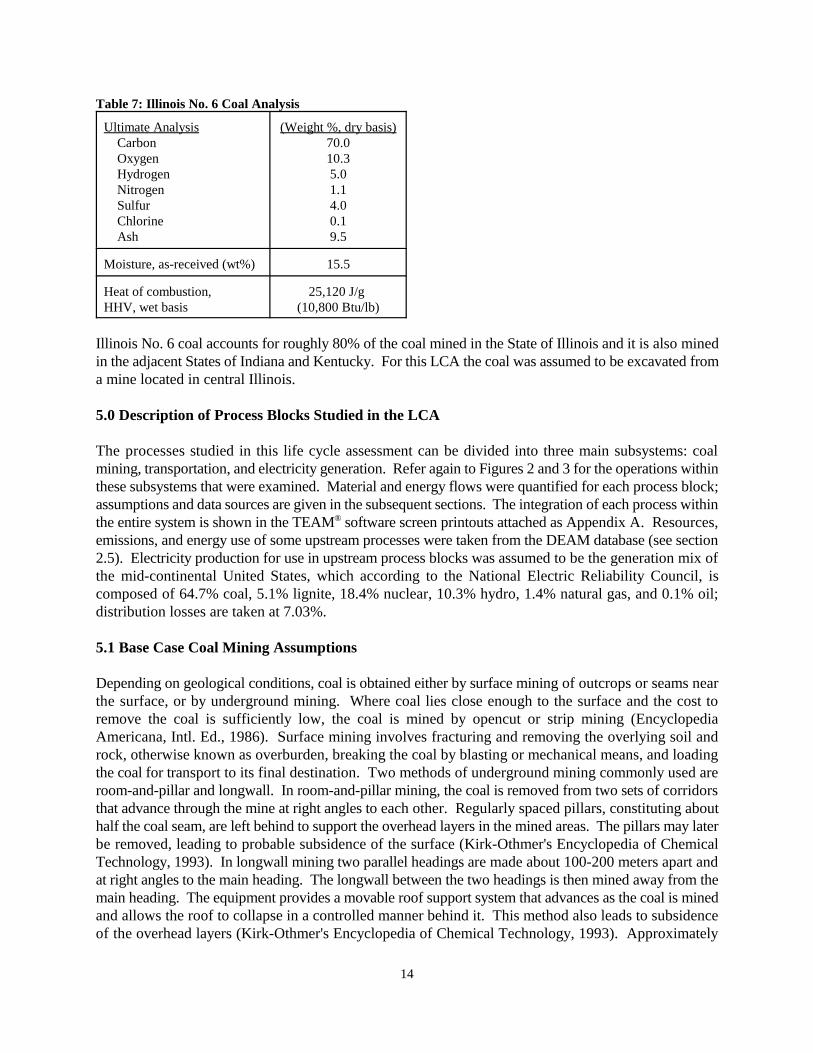
14
Table 7: Illinois No. 6 Coal Analysis
Ultimate Analysis Carbon Oxygen Hydrogen Nitrogen Sulfur Chlorine Ash
(Weight %, dry basis)70.010.35.01.14.00.19.5
Moisture, as-received (wt%) 15.5
Heat of combustion, HHV, wet basis
25,120 J/g (10,800 Btu/lb)
Illinois No. 6 coal accounts for roughly 80% of the coal mined in the State of Illinois and it is also minedin the adjacent States of Indiana and Kentucky. For this LCA the coal was assumed to be excavated froma mine located in central Illinois.
5.0 Description of Process Blocks Studied in the LCA
The processes studied in this life cycle assessment can be divided into three main subsystems: coalmining, transportation, and electricity generation. Refer again to Figures 2 and 3 for the operations withinthese subsystems that were examined. Material and energy flows were quantified for each process block;assumptions and data sources are given in the subsequent sections. The integration of each process withinthe entire system is shown in the TEAM software screen printouts attached as Appendix A. Resources,®
emissions, and energy use of some upstream processes were taken from the DEAM database (see section2.5). Electricity production for use in upstream process blocks was assumed to be the generation mix ofthe mid-continental United States, which according to the National Electric Reliability Council, iscomposed of 64.7% coal, 5.1% lignite, 18.4% nuclear, 10.3% hydro, 1.4% natural gas, and 0.1% oil;distribution losses are taken at 7.03%.
5.1 Base Case Coal Mining Assumptions
Depending on geological conditions, coal is obtained either by surface mining of outcrops or seams nearthe surface, or by underground mining. Where coal lies close enough to the surface and the cost toremove the coal is sufficiently low, the coal is mined by opencut or strip mining (EncyclopediaAmericana, Intl. Ed., 1986). Surface mining involves fracturing and removing the overlying soil androck, otherwise known as overburden, breaking the coal by blasting or mechanical means, and loadingthe coal for transport to its final destination. Two methods of underground mining commonly used areroom-and-pillar and longwall. In room-and-pillar mining, the coal is removed from two sets of corridorsthat advance through the mine at right angles to each other. Regularly spaced pillars, constituting abouthalf the coal seam, are left behind to support the overhead layers in the mined areas. The pillars may laterbe removed, leading to probable subsidence of the surface (Kirk-Othmer's Encyclopedia of ChemicalTechnology, 1993). In longwall mining two parallel headings are made about 100-200 meters apart andat right angles to the main heading. The longwall between the two headings is then mined away from themain heading. The equipment provides a movable roof support system that advances as the coal is minedand allows the roof to collapse in a controlled manner behind it. This method also leads to subsidenceof the overhead layers (Kirk-Othmer's Encyclopedia of Chemical Technology, 1993). Approximately
15
62% of the coal in the U.S. is mined by surface mining, while 38% is obtained by underground mining(U.S. DOE, 1997).
The resources, environmental emissions, and energy use associated with the excavation of coal wereincluded in this LCA. The processes studied include raw material extraction, equipment manufacture,coal mining, coal preparation/cleaning, all necessary transportation of chemicals, and any upstreamprocesses (refer again to Figures 2 and 3 and to the TEAM screen printouts in Appendix A). Both®
surface and underground mining were examined. The coal is either surface mined via strip mining ormined by the underground technique of longwall mining. The resources, energy, and emissionsassociated with the mining equipment are based on the types of machinery used for each coal excavationprocess, the fuel requirements, and the lifetime of the machinery. This information was gathered fromvarious literature sources and mining companies. Additionally, the process steps involved in landreclamation are included in the surface mining option. As stated earlier, the mining techniques for aparticular region are dictated by the geological and topographical conditions. Even where techniques aregenerally comparable, equipment choices and operation procedures may differ (Ullmann's Encyclopediaof Industrial Chemistry, 1986). Since a specific mine site was not chosen, the mining requirements forboth surface and underground mining were based on previous studies by the Bureau of Mines (Sidneyet al, 1976 and Duda and Hemingway, 1976, respectively). The following sections contain the detailsused in this analysis for each mining technique.
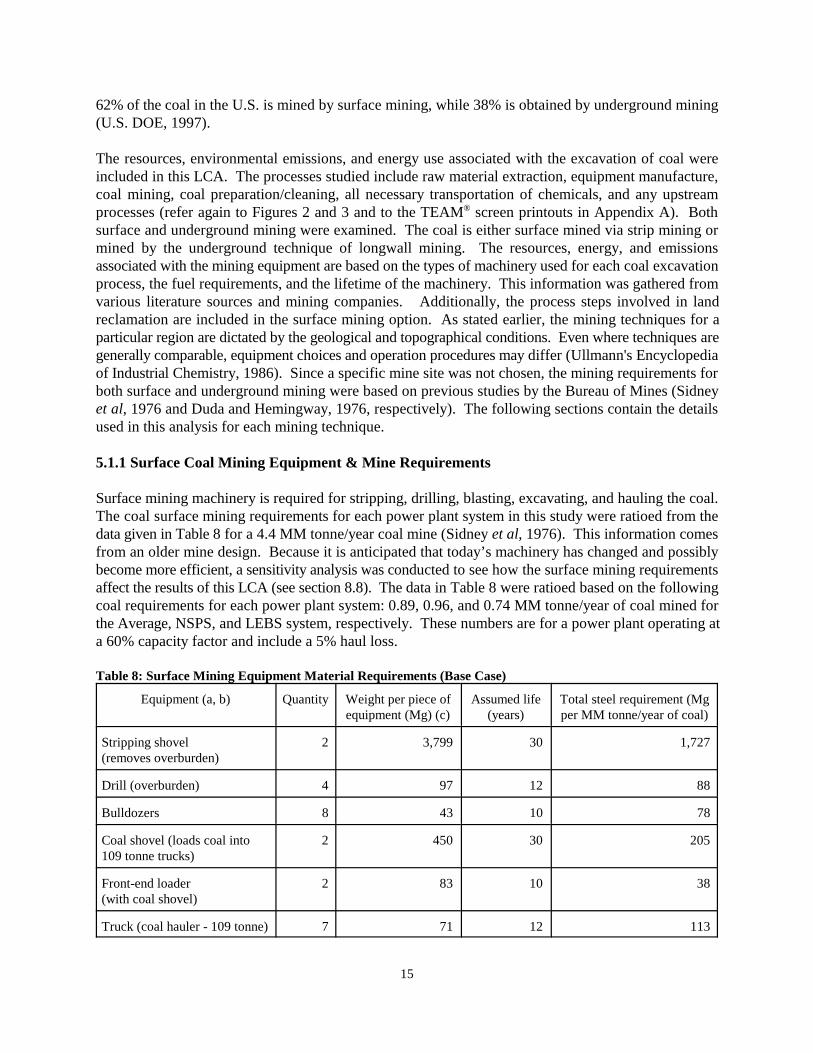
5.1.1 Surface Coal Mining Equipment & Mine Requirements
Surface mining machinery is required for stripping, drilling, blasting, excavating, and hauling the coal.The coal surface mining requirements for each power plant system in this study were ratioed from thedata given in Table 8 for a 4.4 MM tonne/year coal mine (Sidney et al, 1976). This information comesfrom an older mine design. Because it is anticipated that today’s machinery has changed and possiblybecome more efficient, a sensitivity analysis was conducted to see how the surface mining requirementsaffect the results of this LCA (see section 8.8). The data in Table 8 were ratioed based on the followingcoal requirements for each power plant system: 0.89, 0.96, and 0.74 MM tonne/year of coal mined forthe Average, NSPS, and LEBS system, respectively. These numbers are for a power plant operating ata 60% capacity factor and include a 5% haul loss.
Table 8: Surface Mining Equipment Material Requirements (Base Case)
Equipment (a, b) Quantity Weight per piece ofequipment (Mg) (c)
Assumed life(years)
Total steel requirement (Mgper MM tonne/year of coal)
Stripping shovel(removes overburden)
2 3,799 30 1,727
Drill (overburden) 4 97 12 88
Bulldozers 8 43 10 78
Coal shovel (loads coal into109 tonne trucks)
2 450 30 205
Front-end loader(with coal shovel)
2 83 10 38
Truck (coal hauler - 109 tonne) 7 71 12 113
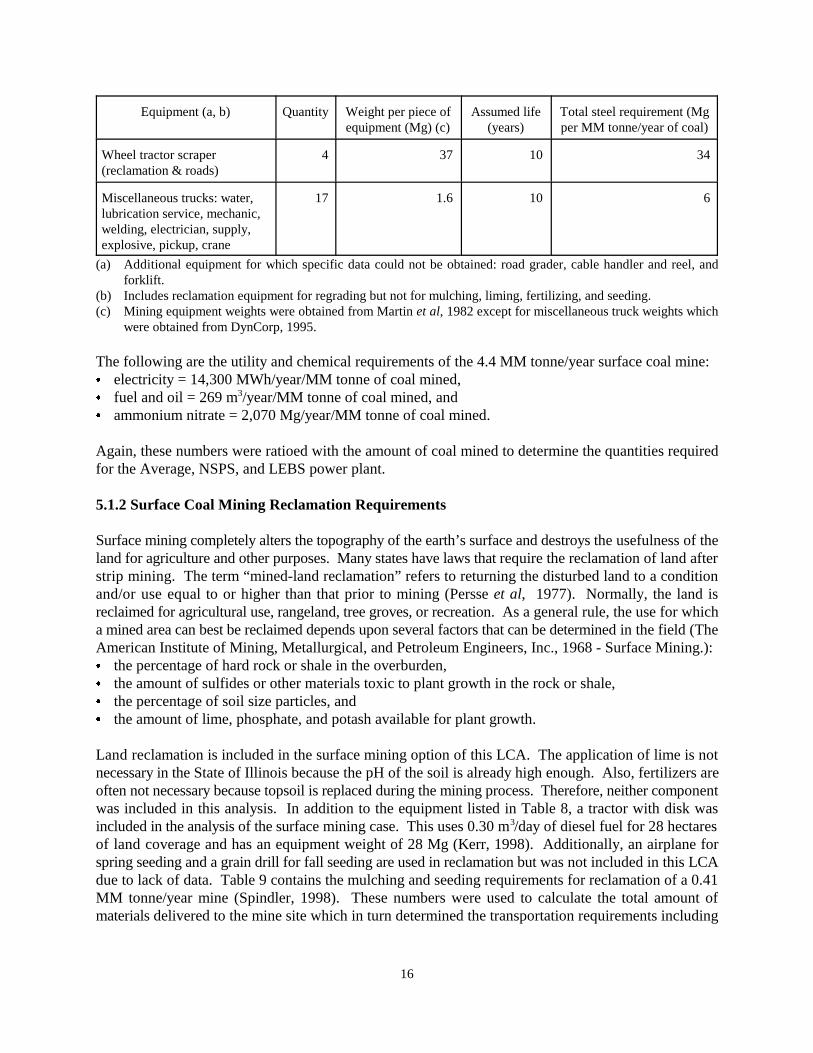
Equipment (a, b) Quantity Weight per piece ofequipment (Mg) (c)
Assumed life(years)
Total steel requirement (Mgper MM tonne/year of coal)
16
Wheel tractor scraper(reclamation & roads)
4 37 10 34
Miscellaneous trucks: water,lubrication service, mechanic,welding, electrician, supply,explosive, pickup, crane
17 1.6 10 6
(a) Additional equipment for which specific data could not be obtained: road grader, cable handler and reel, andforklift.
(b) Includes reclamation equipment for regrading but not for mulching, liming, fertilizing, and seeding.(c) Mining equipment weights were obtained from Martin et al, 1982 except for miscellaneous truck weights which
were obtained from DynCorp, 1995.
The following are the utility and chemical requirements of the 4.4 MM tonne/year surface coal mine:& electricity = 14,300 MWh/year/MM tonne of coal mined,& fuel and oil = 269 m /year/MM tonne of coal mined, and3
& ammonium nitrate = 2,070 Mg/year/MM tonne of coal mined.
Again, these numbers were ratioed with the amount of coal mined to determine the quantities requiredfor the Average, NSPS, and LEBS power plant.
5.1.2 Surface Coal Mining Reclamation Requirements
Surface mining completely alters the topography of the earth’s surface and destroys the usefulness of theland for agriculture and other purposes. Many states have laws that require the reclamation of land afterstrip mining. The term “mined-land reclamation” refers to returning the disturbed land to a conditionand/or use equal to or higher than that prior to mining (Persse et al, 1977). Normally, the land isreclaimed for agricultural use, rangeland, tree groves, or recreation. As a general rule, the use for whicha mined area can best be reclaimed depends upon several factors that can be determined in the field (TheAmerican Institute of Mining, Metallurgical, and Petroleum Engineers, Inc., 1968 - Surface Mining.):& the percentage of hard rock or shale in the overburden,& the amount of sulfides or other materials toxic to plant growth in the rock or shale,& the percentage of soil size particles, and& the amount of lime, phosphate, and potash available for plant growth.
Land reclamation is included in the surface mining option of this LCA. The application of lime is notnecessary in the State of Illinois because the pH of the soil is already high enough. Also, fertilizers areoften not necessary because topsoil is replaced during the mining process. Therefore, neither componentwas included in this analysis. In addition to the equipment listed in Table 8, a tractor with disk wasincluded in the analysis of the surface mining case. This uses 0.30 m /day of diesel fuel for 28 hectares3
of land coverage and has an equipment weight of 28 Mg (Kerr, 1998). Additionally, an airplane forspring seeding and a grain drill for fall seeding are used in reclamation but was not included in this LCAdue to lack of data. Table 9 contains the mulching and seeding requirements for reclamation of a 0.41MM tonne/year mine (Spindler, 1998). These numbers were used to calculate the total amount ofmaterials delivered to the mine site which in turn determined the transportation requirements including
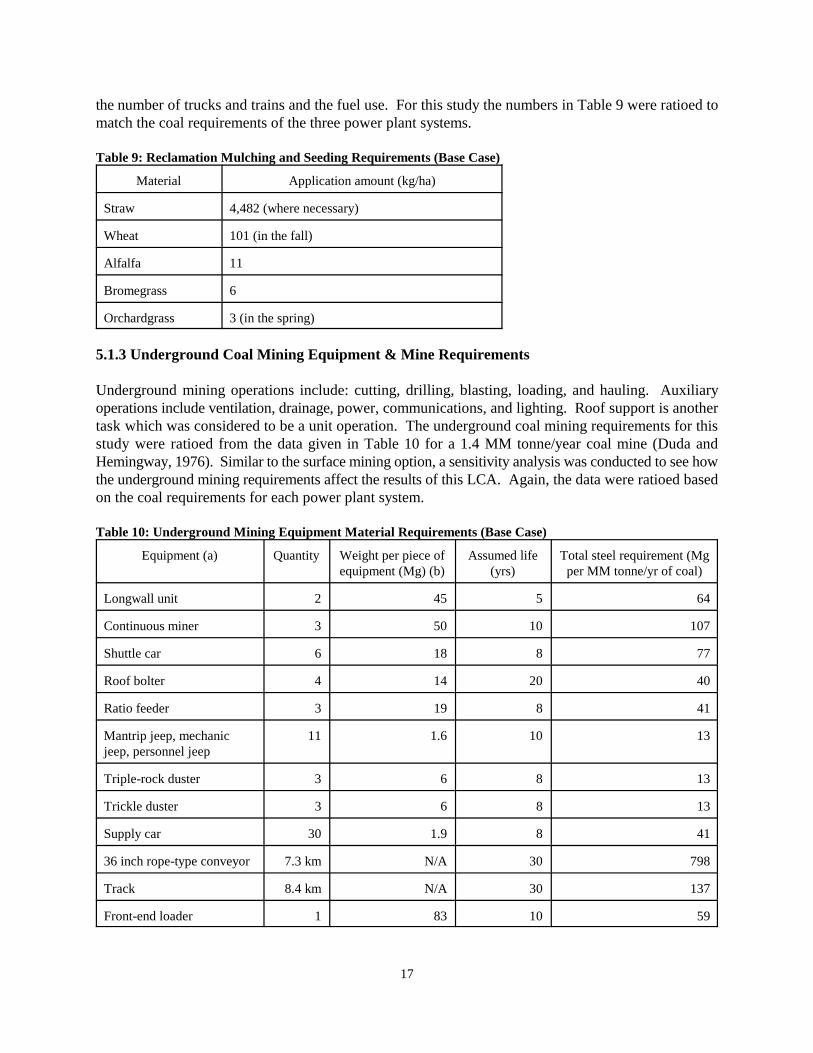
17
the number of trucks and trains and the fuel use. For this study the numbers in Table 9 were ratioed tomatch the coal requirements of the three power plant systems.
Table 9: Reclamation Mulching and Seeding Requirements (Base Case)
Material Application amount (kg/ha)
Straw 4,482 (where necessary)
Wheat 101 (in the fall)
Alfalfa 11
Bromegrass 6
Orchardgrass 3 (in the spring)
5.1.3 Underground Coal Mining Equipment & Mine Requirements
Underground mining operations include: cutting, drilling, blasting, loading, and hauling. Auxiliaryoperations include ventilation, drainage, power, communications, and lighting. Roof support is anothertask which was considered to be a unit operation. The underground coal mining requirements for thisstudy were ratioed from the data given in Table 10 for a 1.4 MM tonne/year coal mine (Duda andHemingway, 1976). Similar to the surface mining option, a sensitivity analysis was conducted to see howthe underground mining requirements affect the results of this LCA. Again, the data were ratioed basedon the coal requirements for each power plant system.
Table 10: Underground Mining Equipment Material Requirements (Base Case)
Equipment (a) Quantity Weight per piece ofequipment (Mg) (b)
Assumed life(yrs)
Total steel requirement (Mgper MM tonne/yr of coal)
Longwall unit 2 45 5 64
Continuous miner 3 50 10 107
Shuttle car 6 18 8 77
Roof bolter 4 14 20 40
Ratio feeder 3 19 8 41
Mantrip jeep, mechanicjeep, personnel jeep
11 1.6 10 13
Triple-rock duster 3 6 8 13
Trickle duster 3 6 8 13
Supply car 30 1.9 8 41
36 inch rope-type conveyor 7.3 km N/A 30 798
Track 8.4 km N/A 30 137
Front-end loader 1 83 10 59
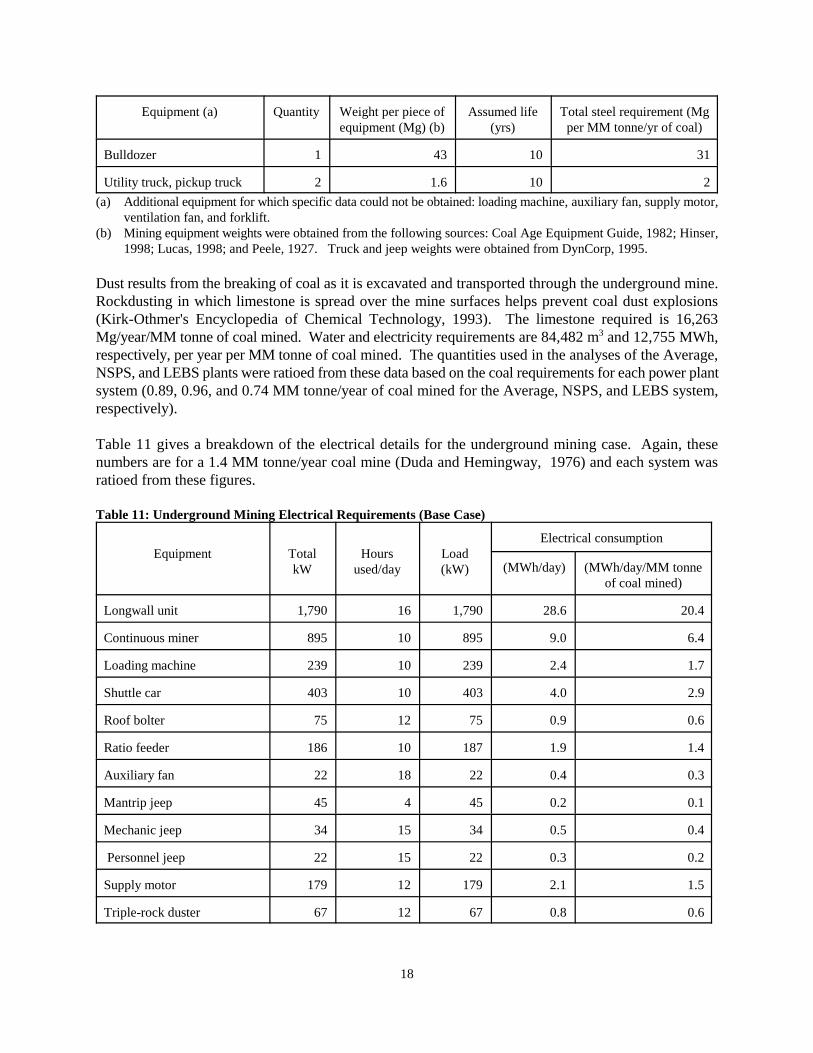
Equipment (a) Quantity Weight per piece ofequipment (Mg) (b)
Assumed life(yrs)
Total steel requirement (Mgper MM tonne/yr of coal)
18
Bulldozer 1 43 10 31
Utility truck, pickup truck 2 1.6 10 2
(a) Additional equipment for which specific data could not be obtained: loading machine, auxiliary fan, supply motor,ventilation fan, and forklift.
(b) Mining equipment weights were obtained from the following sources: Coal Age Equipment Guide, 1982; Hinser,1998; Lucas, 1998; and Peele, 1927. Truck and jeep weights were obtained from DynCorp, 1995.
Dust results from the breaking of coal as it is excavated and transported through the underground mine.Rockdusting in which limestone is spread over the mine surfaces helps prevent coal dust explosions(Kirk-Othmer's Encyclopedia of Chemical Technology, 1993). The limestone required is 16,263Mg/year/MM tonne of coal mined. Water and electricity requirements are 84,482 m and 12,755 MWh,3
respectively, per year per MM tonne of coal mined. The quantities used in the analyses of the Average,NSPS, and LEBS plants were ratioed from these data based on the coal requirements for each power plantsystem (0.89, 0.96, and 0.74 MM tonne/year of coal mined for the Average, NSPS, and LEBS system,respectively).
Table 11 gives a breakdown of the electrical details for the underground mining case. Again, thesenumbers are for a 1.4 MM tonne/year coal mine (Duda and Hemingway, 1976) and each system wasratioed from these figures.
Table 11: Underground Mining Electrical Requirements (Base Case)
Equipment TotalkW
Hoursused/day
Load(kW)
Electrical consumption
(MWh/day) (MWh/day/MM tonneof coal mined)
Longwall unit 1,790 16 1,790 28.6 20.4
Continuous miner 895 10 895 9.0 6.4
Loading machine 239 10 239 2.4 1.7
Shuttle car 403 10 403 4.0 2.9
Roof bolter 75 12 75 0.9 0.6
Ratio feeder 186 10 187 1.9 1.4
Auxiliary fan 22 18 22 0.4 0.3
Mantrip jeep 45 4 45 0.2 0.1
Mechanic jeep 34 15 34 0.5 0.4
Personnel jeep 22 15 22 0.3 0.2
Supply motor 179 12 179 2.1 1.5
Triple-rock duster 67 12 67 0.8 0.6
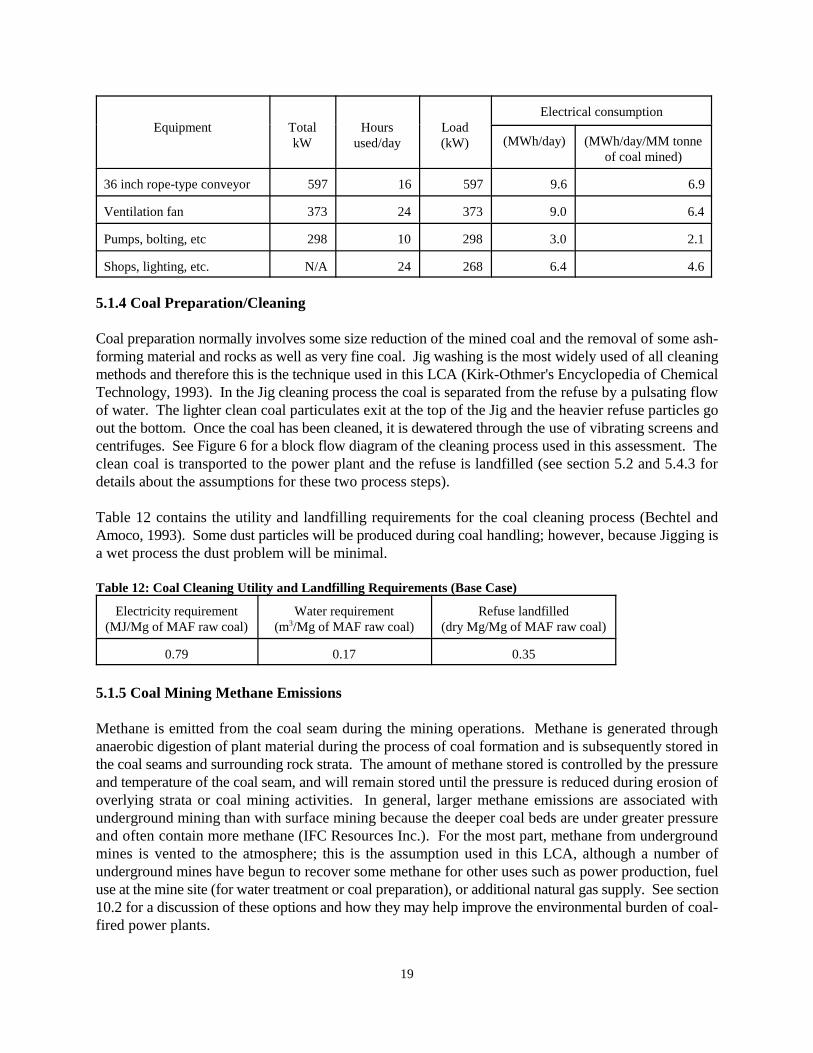
Equipment TotalkW
Hoursused/day
Load(kW)
Electrical consumption
(MWh/day) (MWh/day/MM tonneof coal mined)
19
36 inch rope-type conveyor 597 16 597 9.6 6.9
Ventilation fan 373 24 373 9.0 6.4
Pumps, bolting, etc 298 10 298 3.0 2.1
Shops, lighting, etc. N/A 24 268 6.4 4.6
5.1.4 Coal Preparation/Cleaning
Coal preparation normally involves some size reduction of the mined coal and the removal of some ash-forming material and rocks as well as very fine coal. Jig washing is the most widely used of all cleaningmethods and therefore this is the technique used in this LCA (Kirk-Othmer's Encyclopedia of ChemicalTechnology, 1993). In the Jig cleaning process the coal is separated from the refuse by a pulsating flowof water. The lighter clean coal particulates exit at the top of the Jig and the heavier refuse particles goout the bottom. Once the coal has been cleaned, it is dewatered through the use of vibrating screens andcentrifuges. See Figure 6 for a block flow diagram of the cleaning process used in this assessment. Theclean coal is transported to the power plant and the refuse is landfilled (see section 5.2 and 5.4.3 fordetails about the assumptions for these two process steps).
Table 12 contains the utility and landfilling requirements for the coal cleaning process (Bechtel andAmoco, 1993). Some dust particles will be produced during coal handling; however, because Jigging isa wet process the dust problem will be minimal.
Table 12: Coal Cleaning Utility and Landfilling Requirements (Base Case)
Electricity requirement(MJ/Mg of MAF raw coal)
Water requirement(m /Mg of MAF raw coal)3
Refuse landfilled(dry Mg/Mg of MAF raw coal)
0.79 0.17 0.35
5.1.5 Coal Mining Methane Emissions
Methane is emitted from the coal seam during the mining operations. Methane is generated throughanaerobic digestion of plant material during the process of coal formation and is subsequently stored inthe coal seams and surrounding rock strata. The amount of methane stored is controlled by the pressureand temperature of the coal seam, and will remain stored until the pressure is reduced during erosion ofoverlying strata or coal mining activities. In general, larger methane emissions are associated withunderground mining than with surface mining because the deeper coal beds are under greater pressureand often contain more methane (IFC Resources Inc.). For the most part, methane from undergroundmines is vented to the atmosphere; this is the assumption used in this LCA, although a number ofunderground mines have begun to recover some methane for other uses such as power production, fueluse at the mine site (for water treatment or coal preparation), or additional natural gas supply. See section10.2 for a discussion of these options and how they may help improve the environmental burden of coal-fired power plants.
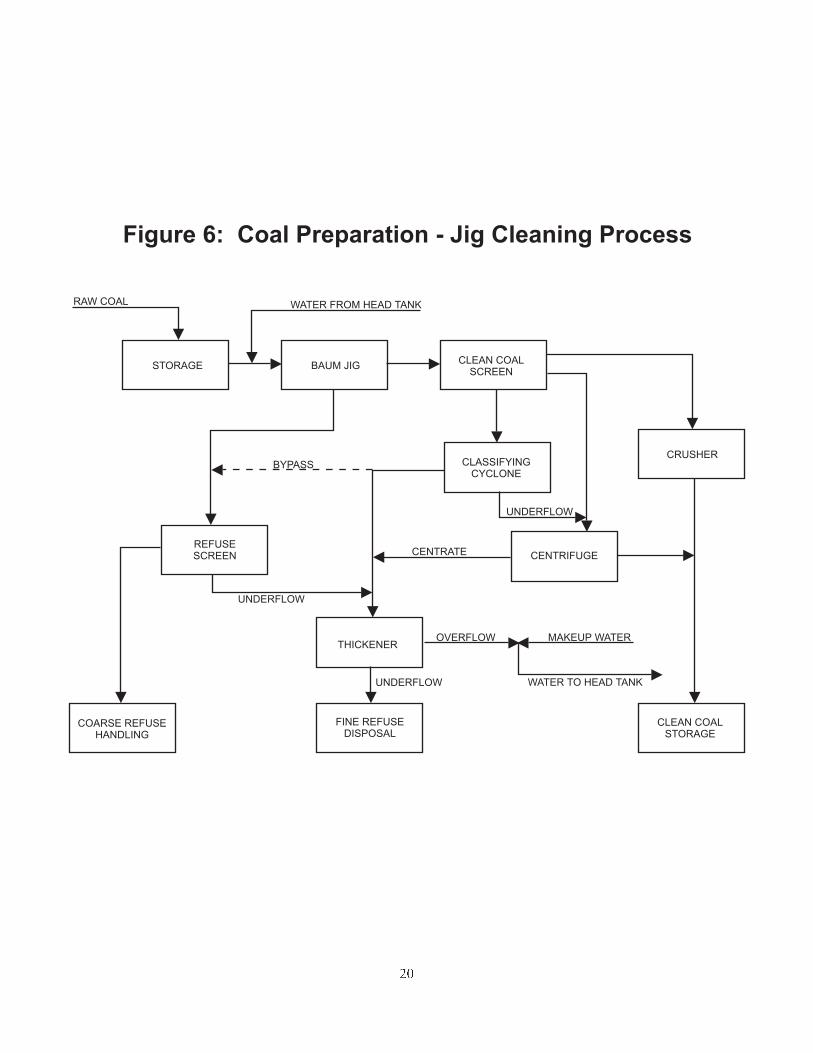
Figure 6: Coal Preparation - Jig Cleaning Process
RAW COAL WATER FROM HEAD TANK
BYPASS
CENTRATE
UNDERFLOW
OVERFLOW MAKEUP WATER
UNDERFLOW
WATER TO HEAD TANKUNDERFLOW
STORAGE BAUM JIGCLEAN COAL
SCREEN
CRUSHERCLASSIFYING
CYCLONE
REFUSESCREEN CENTRIFUGE
THICKENER
COARSE REFUSEHANDLING
FINE REFUSEDISPOSAL
CLEAN COALSTORAGE
20
21
Table 13 shows the surface and underground mining methane emissions used in the base case of this LCA(U.S. EPA, 1998). These are the average methane emissions for the Illinois region in 1996 for bothmining techniques. A sensitivity analysis was conducted using numbers from another data source todetermine the effect of the assumed value used in this LCA.
Table 13: Coal Mining Methane Emissions (Base Case)
Mining technique Methane emissions(g of CH /kg of as-received coal)4
Surface 1.91
Underground 4.23
5.1.6 Transportation of Chemicals/Materials
Chemicals and materials must be transported from their point of production to either the coal mine or thepower plant. The transportation requirements were assumed to be 60% by rail and 40% by truck overan average distance of 640 km (based on details gathered for NREL’s biomass power LCA study - Mannand Spath, 1997). Table 14 contains a list of specific chemicals and materials that are transported in thiscoal study:
Table 14: Chemicals and Materials Transported
Chemical/material Unit operation Destination
Limestone Underground mining Coal mine
Ammonium nitrate Surface mining Coal mine
Seeds Reclamation Coal mine
Lime Power plant operation Power plant (Average & NSPS case)
Limestone Power plant operation Power plant (Average & NSPS case)
Ammonia Power plant operation Power plant (LEBS case)
Light fuel oil and diesel are used in the trains and trucks, respectively. Similar to coal transport(discussed in section 5.2), the resources, energy, and emissions related to extracting crude oil, distillingit, producing a usable transportation fuel, and distributing it to refueling stations plus the emissionsproduced during combustion of the fuel were included in the LCA. Additionally, the stressors associatedwith manufacturing the trains and trucks were included.
5.2 Base Case Coal Transportation Assumptions
The inventory assessment for the transportation subsystem includes the energy required and emissionsgenerated for the transportation of coal by barge, train, or truck between the boundaries of the coal miningand power generation subsystems. Any transportation requirements within the boundaries of the coalmining and power generation subsystems are included in the inventory assessment for that subsystem (seesections 5.1.6 and 5.4.3 for details about chemical/material transport and waste transport to a landfill,respectively).
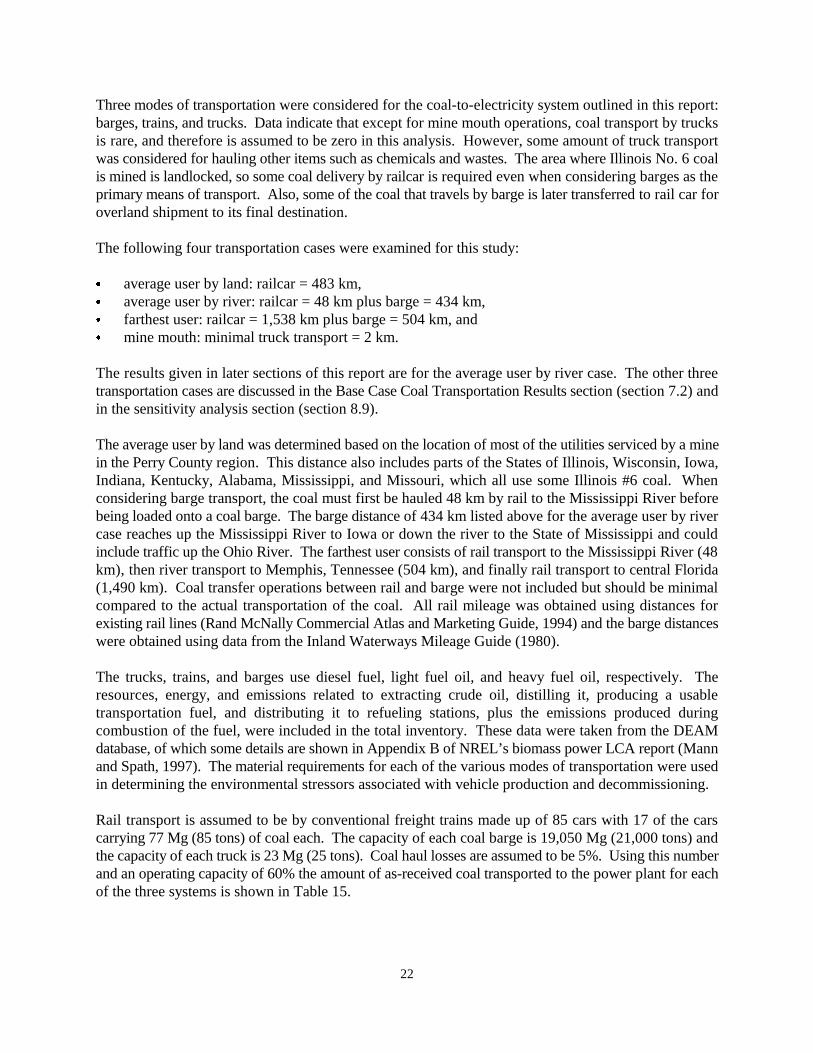
22
Three modes of transportation were considered for the coal-to-electricity system outlined in this report:barges, trains, and trucks. Data indicate that except for mine mouth operations, coal transport by trucksis rare, and therefore is assumed to be zero in this analysis. However, some amount of truck transportwas considered for hauling other items such as chemicals and wastes. The area where Illinois No. 6 coalis mined is landlocked, so some coal delivery by railcar is required even when considering barges as theprimary means of transport. Also, some of the coal that travels by barge is later transferred to rail car foroverland shipment to its final destination.
The following four transportation cases were examined for this study:
& average user by land: railcar = 483 km,& average user by river: railcar = 48 km plus barge = 434 km,& farthest user: railcar = 1,538 km plus barge = 504 km, and& mine mouth: minimal truck transport = 2 km.
The results given in later sections of this report are for the average user by river case. The other threetransportation cases are discussed in the Base Case Coal Transportation Results section (section 7.2) andin the sensitivity analysis section (section 8.9).
The average user by land was determined based on the location of most of the utilities serviced by a minein the Perry County region. This distance also includes parts of the States of Illinois, Wisconsin, Iowa,Indiana, Kentucky, Alabama, Mississippi, and Missouri, which all use some Illinois #6 coal. Whenconsidering barge transport, the coal must first be hauled 48 km by rail to the Mississippi River beforebeing loaded onto a coal barge. The barge distance of 434 km listed above for the average user by rivercase reaches up the Mississippi River to Iowa or down the river to the State of Mississippi and couldinclude traffic up the Ohio River. The farthest user consists of rail transport to the Mississippi River (48km), then river transport to Memphis, Tennessee (504 km), and finally rail transport to central Florida(1,490 km). Coal transfer operations between rail and barge were not included but should be minimalcompared to the actual transportation of the coal. All rail mileage was obtained using distances forexisting rail lines (Rand McNally Commercial Atlas and Marketing Guide, 1994) and the barge distanceswere obtained using data from the Inland Waterways Mileage Guide (1980).
The trucks, trains, and barges use diesel fuel, light fuel oil, and heavy fuel oil, respectively. Theresources, energy, and emissions related to extracting crude oil, distilling it, producing a usabletransportation fuel, and distributing it to refueling stations, plus the emissions produced duringcombustion of the fuel, were included in the total inventory. These data were taken from the DEAMdatabase, of which some details are shown in Appendix B of NREL’s biomass power LCA report (Mannand Spath, 1997). The material requirements for each of the various modes of transportation were usedin determining the environmental stressors associated with vehicle production and decommissioning.
Rail transport is assumed to be by conventional freight trains made up of 85 cars with 17 of the carscarrying 77 Mg (85 tons) of coal each. The capacity of each coal barge is 19,050 Mg (21,000 tons) andthe capacity of each truck is 23 Mg (25 tons). Coal haul losses are assumed to be 5%. Using this numberand an operating capacity of 60% the amount of as-received coal transported to the power plant for eachof the three systems is shown in Table 15.
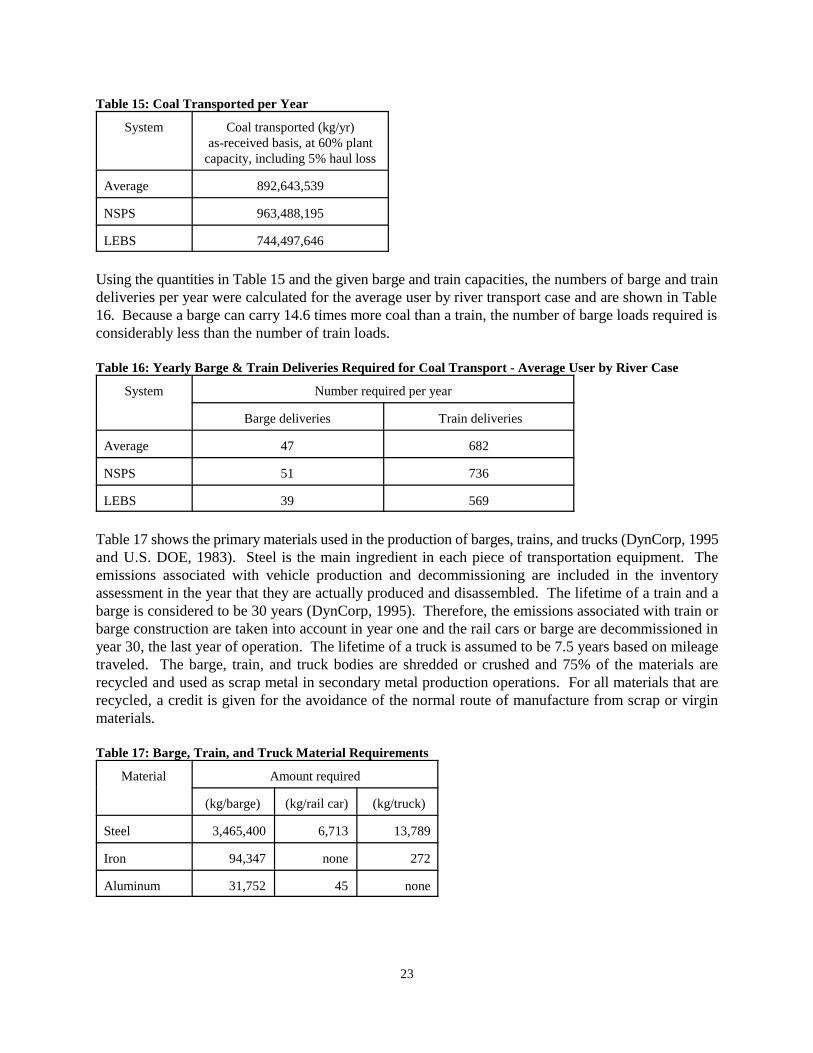
23
Table 15: Coal Transported per Year
System Coal transported (kg/yr)as-received basis, at 60% plant
capacity, including 5% haul loss
Average 892,643,539
NSPS 963,488,195
LEBS 744,497,646
Using the quantities in Table 15 and the given barge and train capacities, the numbers of barge and traindeliveries per year were calculated for the average user by river transport case and are shown in Table16. Because a barge can carry 14.6 times more coal than a train, the number of barge loads required isconsiderably less than the number of train loads.
Table 16: Yearly Barge & Train Deliveries Required for Coal Transport - Average User by River Case
System Number required per year
Barge deliveries Train deliveries
Average 47 682
NSPS 51 736
LEBS 39 569
Table 17 shows the primary materials used in the production of barges, trains, and trucks (DynCorp, 1995and U.S. DOE, 1983). Steel is the main ingredient in each piece of transportation equipment. Theemissions associated with vehicle production and decommissioning are included in the inventoryassessment in the year that they are actually produced and disassembled. The lifetime of a train and abarge is considered to be 30 years (DynCorp, 1995). Therefore, the emissions associated with train orbarge construction are taken into account in year one and the rail cars or barge are decommissioned inyear 30, the last year of operation. The lifetime of a truck is assumed to be 7.5 years based on mileagetraveled. The barge, train, and truck bodies are shredded or crushed and 75% of the materials arerecycled and used as scrap metal in secondary metal production operations. For all materials that arerecycled, a credit is given for the avoidance of the normal route of manufacture from scrap or virginmaterials.
Table 17: Barge, Train, and Truck Material Requirements
Material Amount required
(kg/barge) (kg/rail car) (kg/truck)
Steel 3,465,400 6,713 13,789
Iron 94,347 none 272
Aluminum 31,752 45 none
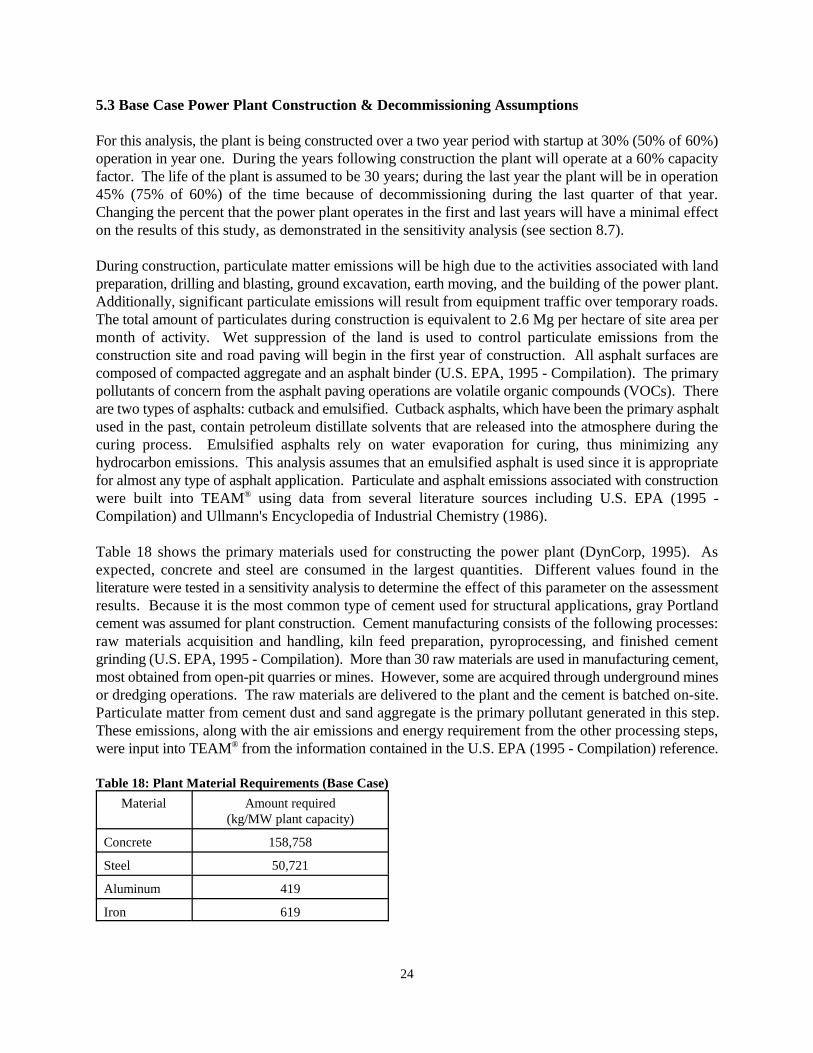
24
5.3 Base Case Power Plant Construction & Decommissioning Assumptions
For this analysis, the plant is being constructed over a two year period with startup at 30% (50% of 60%)operation in year one. During the years following construction the plant will operate at a 60% capacityfactor. The life of the plant is assumed to be 30 years; during the last year the plant will be in operation45% (75% of 60%) of the time because of decommissioning during the last quarter of that year.Changing the percent that the power plant operates in the first and last years will have a minimal effecton the results of this study, as demonstrated in the sensitivity analysis (see section 8.7).
During construction, particulate matter emissions will be high due to the activities associated with landpreparation, drilling and blasting, ground excavation, earth moving, and the building of the power plant.Additionally, significant particulate emissions will result from equipment traffic over temporary roads.The total amount of particulates during construction is equivalent to 2.6 Mg per hectare of site area permonth of activity. Wet suppression of the land is used to control particulate emissions from theconstruction site and road paving will begin in the first year of construction. All asphalt surfaces arecomposed of compacted aggregate and an asphalt binder (U.S. EPA, 1995 - Compilation). The primarypollutants of concern from the asphalt paving operations are volatile organic compounds (VOCs). Thereare two types of asphalts: cutback and emulsified. Cutback asphalts, which have been the primary asphaltused in the past, contain petroleum distillate solvents that are released into the atmosphere during thecuring process. Emulsified asphalts rely on water evaporation for curing, thus minimizing anyhydrocarbon emissions. This analysis assumes that an emulsified asphalt is used since it is appropriatefor almost any type of asphalt application. Particulate and asphalt emissions associated with constructionwere built into TEAM using data from several literature sources including U.S. EPA (1995 -®
Compilation) and Ullmann's Encyclopedia of Industrial Chemistry (1986). Table 18 shows the primary materials used for constructing the power plant (DynCorp, 1995). Asexpected, concrete and steel are consumed in the largest quantities. Different values found in theliterature were tested in a sensitivity analysis to determine the effect of this parameter on the assessmentresults. Because it is the most common type of cement used for structural applications, gray Portlandcement was assumed for plant construction. Cement manufacturing consists of the following processes:raw materials acquisition and handling, kiln feed preparation, pyroprocessing, and finished cementgrinding (U.S. EPA, 1995 - Compilation). More than 30 raw materials are used in manufacturing cement,most obtained from open-pit quarries or mines. However, some are acquired through underground minesor dredging operations. The raw materials are delivered to the plant and the cement is batched on-site.Particulate matter from cement dust and sand aggregate is the primary pollutant generated in this step.These emissions, along with the air emissions and energy requirement from the other processing steps,were input into TEAM from the information contained in the U.S. EPA (1995 - Compilation) reference.®
Table 18: Plant Material Requirements (Base Case)
Material Amount required(kg/MW plant capacity)
Concrete 158,758
Steel 50,721
Aluminum 419
Iron 619
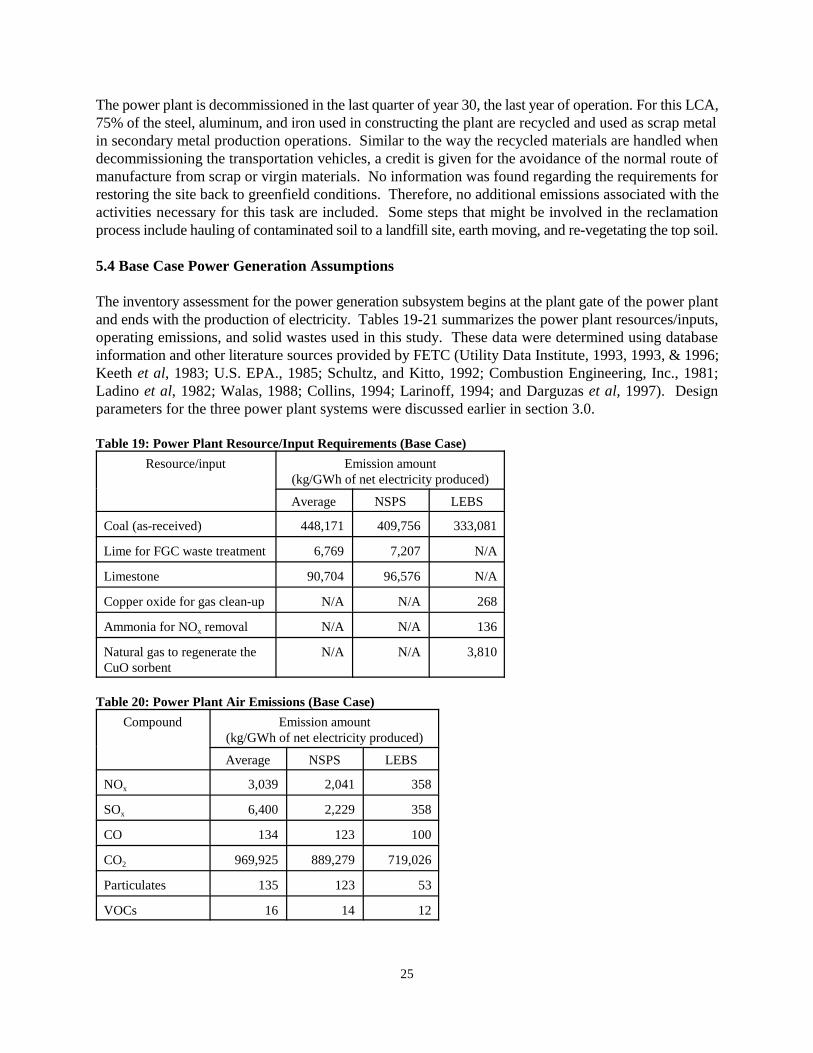
25
The power plant is decommissioned in the last quarter of year 30, the last year of operation. For this LCA,75% of the steel, aluminum, and iron used in constructing the plant are recycled and used as scrap metalin secondary metal production operations. Similar to the way the recycled materials are handled whendecommissioning the transportation vehicles, a credit is given for the avoidance of the normal route ofmanufacture from scrap or virgin materials. No information was found regarding the requirements forrestoring the site back to greenfield conditions. Therefore, no additional emissions associated with theactivities necessary for this task are included. Some steps that might be involved in the reclamationprocess include hauling of contaminated soil to a landfill site, earth moving, and re-vegetating the top soil.
5.4 Base Case Power Generation Assumptions
The inventory assessment for the power generation subsystem begins at the plant gate of the power plantand ends with the production of electricity. Tables 19-21 summarizes the power plant resources/inputs,operating emissions, and solid wastes used in this study. These data were determined using databaseinformation and other literature sources provided by FETC (Utility Data Institute, 1993, 1993, & 1996;Keeth et al, 1983; U.S. EPA., 1985; Schultz, and Kitto, 1992; Combustion Engineering, Inc., 1981;Ladino et al, 1982; Walas, 1988; Collins, 1994; Larinoff, 1994; and Darguzas et al, 1997). Designparameters for the three power plant systems were discussed earlier in section 3.0.
Table 19: Power Plant Resource/Input Requirements (Base Case)
Resource/input Emission amount(kg/GWh of net electricity produced)
Average NSPS LEBS
Coal (as-received) 448,171 409,756 333,081
Lime for FGC waste treatment 6,769 7,207 N/A
Limestone 90,704 96,576 N/A
Copper oxide for gas clean-up N/A N/A 268
Ammonia for NO removalx N/A N/A 136
Natural gas to regenerate theCuO sorbent
N/A N/A 3,810
Table 20: Power Plant Air Emissions (Base Case)
Compound Emission amount(kg/GWh of net electricity produced)
Average NSPS LEBS
NOx 3,039 2,041 358
SOx 6,400 2,229 358
CO 134 123 100
CO2 969,925 889,279 719,026
Particulates 135 123 53
VOCs 16 14 12
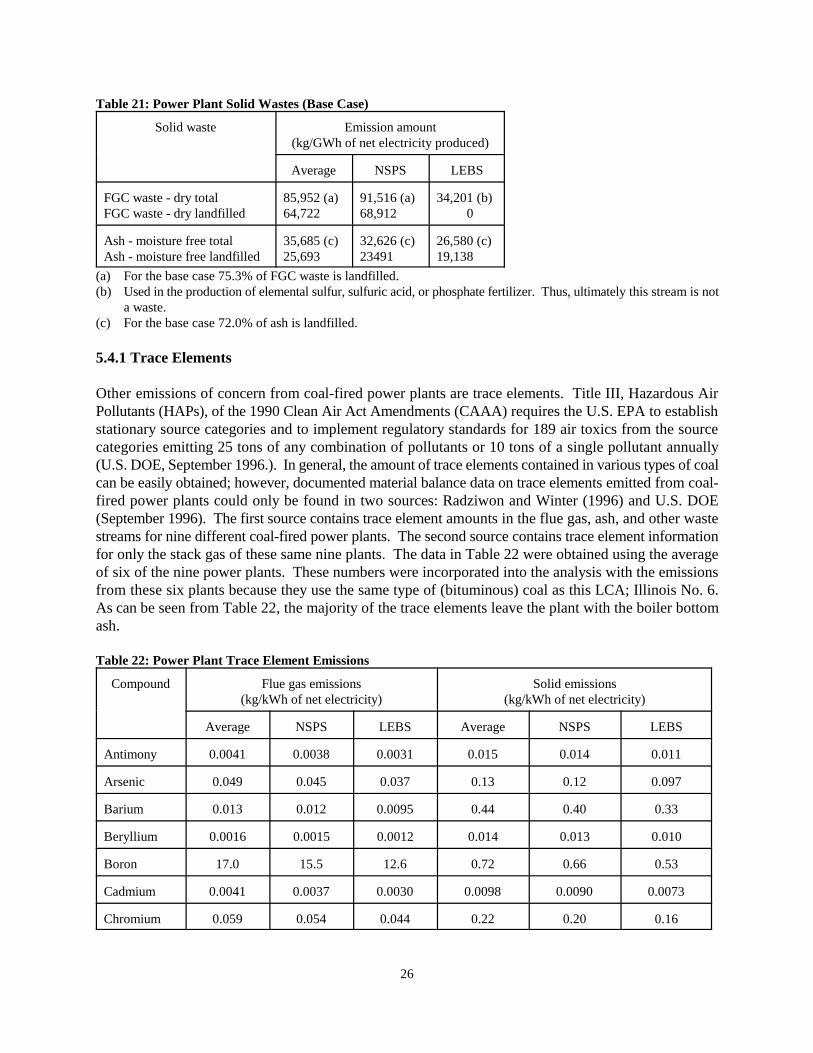
26
Table 21: Power Plant Solid Wastes (Base Case)
Solid waste Emission amount(kg/GWh of net electricity produced)
Average NSPS LEBS
FGC waste - dry totalFGC waste - dry landfilled
85,952 (a)64,722
91,516 (a)68,912
34,201 (b) 0
Ash - moisture free totalAsh - moisture free landfilled
35,685 (c)25,693
32,626 (c)23491
26,580 (c)19,138
(a) For the base case 75.3% of FGC waste is landfilled.(b) Used in the production of elemental sulfur, sulfuric acid, or phosphate fertilizer. Thus, ultimately this stream is not
a waste.(c) For the base case 72.0% of ash is landfilled.
5.4.1 Trace Elements
Other emissions of concern from coal-fired power plants are trace elements. Title III, Hazardous AirPollutants (HAPs), of the 1990 Clean Air Act Amendments (CAAA) requires the U.S. EPA to establishstationary source categories and to implement regulatory standards for 189 air toxics from the sourcecategories emitting 25 tons of any combination of pollutants or 10 tons of a single pollutant annually(U.S. DOE, September 1996.). In general, the amount of trace elements contained in various types of coalcan be easily obtained; however, documented material balance data on trace elements emitted from coal-fired power plants could only be found in two sources: Radziwon and Winter (1996) and U.S. DOE(September 1996). The first source contains trace element amounts in the flue gas, ash, and other wastestreams for nine different coal-fired power plants. The second source contains trace element informationfor only the stack gas of these same nine plants. The data in Table 22 were obtained using the averageof six of the nine power plants. These numbers were incorporated into the analysis with the emissionsfrom these six plants because they use the same type of (bituminous) coal as this LCA; Illinois No. 6.As can be seen from Table 22, the majority of the trace elements leave the plant with the boiler bottomash.
Table 22: Power Plant Trace Element Emissions
Compound Flue gas emissions(kg/kWh of net electricity)
Solid emissions(kg/kWh of net electricity)
Average NSPS LEBS Average NSPS LEBS
Antimony 0.0041 0.0038 0.0031 0.015 0.014 0.011
Arsenic 0.049 0.045 0.037 0.13 0.12 0.097
Barium 0.013 0.012 0.0095 0.44 0.40 0.33
Beryllium 0.0016 0.0015 0.0012 0.014 0.013 0.010
Boron 17.0 15.5 12.6 0.72 0.66 0.53
Cadmium 0.0041 0.0037 0.0030 0.0098 0.0090 0.0073
Chromium 0.059 0.054 0.044 0.22 0.20 0.16
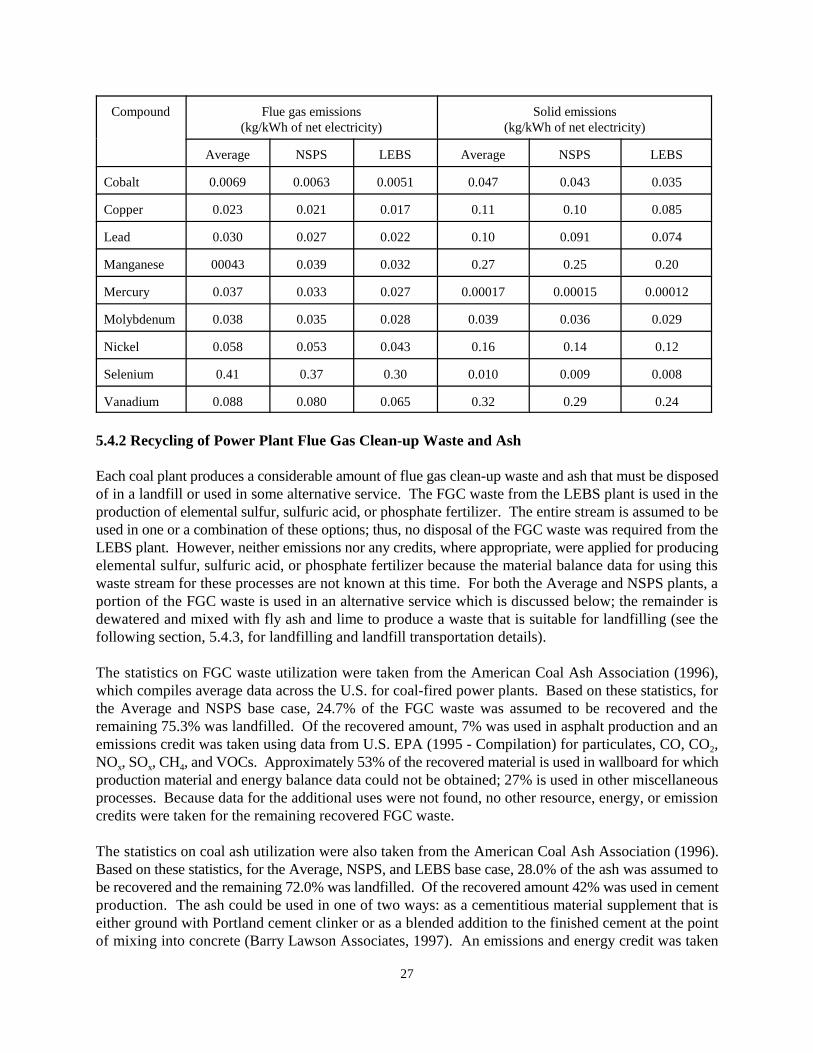
Compound Flue gas emissions(kg/kWh of net electricity)
Solid emissions(kg/kWh of net electricity)
Average NSPS LEBS Average NSPS LEBS
27
Cobalt 0.0069 0.0063 0.0051 0.047 0.043 0.035
Copper 0.023 0.021 0.017 0.11 0.10 0.085
Lead 0.030 0.027 0.022 0.10 0.091 0.074
Manganese 00043 0.039 0.032 0.27 0.25 0.20
Mercury 0.037 0.033 0.027 0.00017 0.00015 0.00012
Molybdenum 0.038 0.035 0.028 0.039 0.036 0.029
Nickel 0.058 0.053 0.043 0.16 0.14 0.12
Selenium 0.41 0.37 0.30 0.010 0.009 0.008
Vanadium 0.088 0.080 0.065 0.32 0.29 0.24
5.4.2 Recycling of Power Plant Flue Gas Clean-up Waste and Ash
Each coal plant produces a considerable amount of flue gas clean-up waste and ash that must be disposedof in a landfill or used in some alternative service. The FGC waste from the LEBS plant is used in theproduction of elemental sulfur, sulfuric acid, or phosphate fertilizer. The entire stream is assumed to beused in one or a combination of these options; thus, no disposal of the FGC waste was required from theLEBS plant. However, neither emissions nor any credits, where appropriate, were applied for producingelemental sulfur, sulfuric acid, or phosphate fertilizer because the material balance data for using thiswaste stream for these processes are not known at this time. For both the Average and NSPS plants, aportion of the FGC waste is used in an alternative service which is discussed below; the remainder isdewatered and mixed with fly ash and lime to produce a waste that is suitable for landfilling (see thefollowing section, 5.4.3, for landfilling and landfill transportation details).
The statistics on FGC waste utilization were taken from the American Coal Ash Association (1996),which compiles average data across the U.S. for coal-fired power plants. Based on these statistics, forthe Average and NSPS base case, 24.7% of the FGC waste was assumed to be recovered and theremaining 75.3% was landfilled. Of the recovered amount, 7% was used in asphalt production and anemissions credit was taken using data from U.S. EPA (1995 - Compilation) for particulates, CO, CO ,2
NO , SO , CH , and VOCs. Approximately 53% of the recovered material is used in wallboard for whichx x 4
production material and energy balance data could not be obtained; 27% is used in other miscellaneousprocesses. Because data for the additional uses were not found, no other resource, energy, or emissioncredits were taken for the remaining recovered FGC waste.
The statistics on coal ash utilization were also taken from the American Coal Ash Association (1996).Based on these statistics, for the Average, NSPS, and LEBS base case, 28.0% of the ash was assumed tobe recovered and the remaining 72.0% was landfilled. Of the recovered amount 42% was used in cementproduction. The ash could be used in one of two ways: as a cementitious material supplement that iseither ground with Portland cement clinker or as a blended addition to the finished cement at the pointof mixing into concrete (Barry Lawson Associates, 1997). An emissions and energy credit was taken
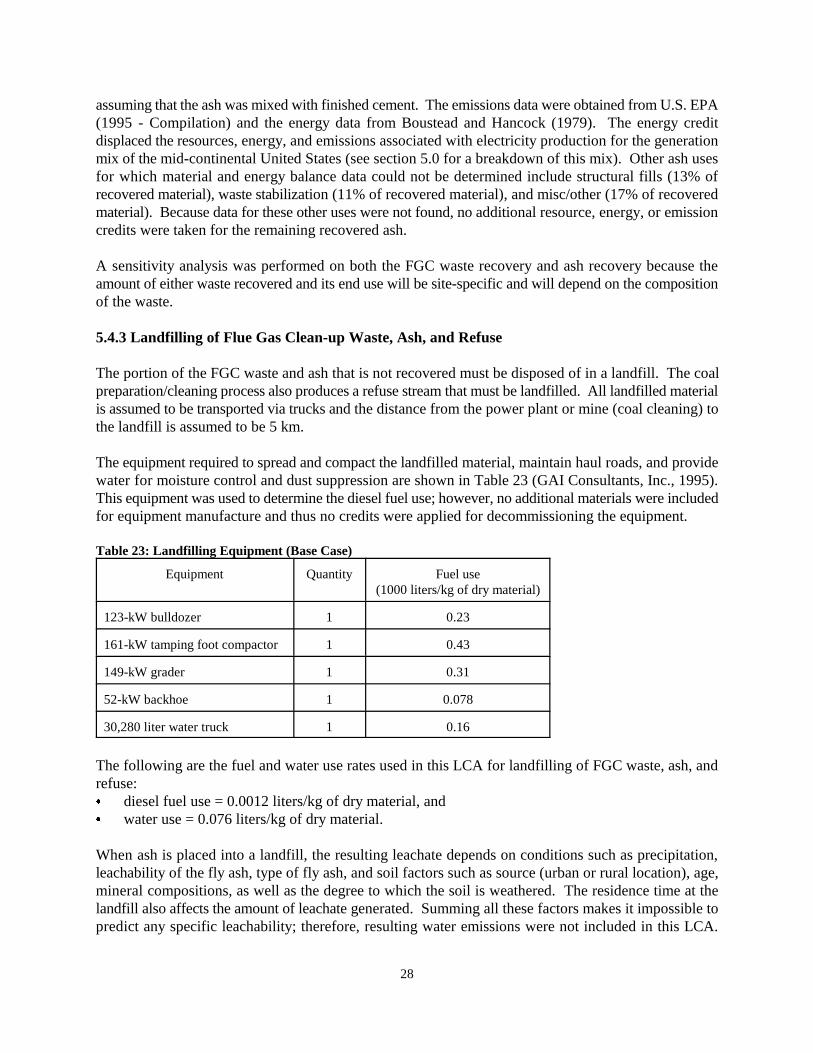
28
assuming that the ash was mixed with finished cement. The emissions data were obtained from U.S. EPA(1995 - Compilation) and the energy data from Boustead and Hancock (1979). The energy creditdisplaced the resources, energy, and emissions associated with electricity production for the generationmix of the mid-continental United States (see section 5.0 for a breakdown of this mix). Other ash usesfor which material and energy balance data could not be determined include structural fills (13% ofrecovered material), waste stabilization (11% of recovered material), and misc/other (17% of recoveredmaterial). Because data for these other uses were not found, no additional resource, energy, or emissioncredits were taken for the remaining recovered ash.
A sensitivity analysis was performed on both the FGC waste recovery and ash recovery because theamount of either waste recovered and its end use will be site-specific and will depend on the compositionof the waste.
5.4.3 Landfilling of Flue Gas Clean-up Waste, Ash, and Refuse
The portion of the FGC waste and ash that is not recovered must be disposed of in a landfill. The coalpreparation/cleaning process also produces a refuse stream that must be landfilled. All landfilled materialis assumed to be transported via trucks and the distance from the power plant or mine (coal cleaning) tothe landfill is assumed to be 5 km.
The equipment required to spread and compact the landfilled material, maintain haul roads, and providewater for moisture control and dust suppression are shown in Table 23 (GAI Consultants, Inc., 1995).This equipment was used to determine the diesel fuel use; however, no additional materials were includedfor equipment manufacture and thus no credits were applied for decommissioning the equipment.
Table 23: Landfilling Equipment (Base Case)
Equipment Quantity Fuel use(1000 liters/kg of dry material)
123-kW bulldozer 1 0.23
161-kW tamping foot compactor 1 0.43
149-kW grader 1 0.31
52-kW backhoe 1 0.078
30,280 liter water truck 1 0.16
The following are the fuel and water use rates used in this LCA for landfilling of FGC waste, ash, andrefuse:& diesel fuel use = 0.0012 liters/kg of dry material, and& water use = 0.076 liters/kg of dry material.
When ash is placed into a landfill, the resulting leachate depends on conditions such as precipitation,leachability of the fly ash, type of fly ash, and soil factors such as source (urban or rural location), age,mineral compositions, as well as the degree to which the soil is weathered. The residence time at thelandfill also affects the amount of leachate generated. Summing all these factors makes it impossible topredict any specific leachability; therefore, resulting water emissions were not included in this LCA.
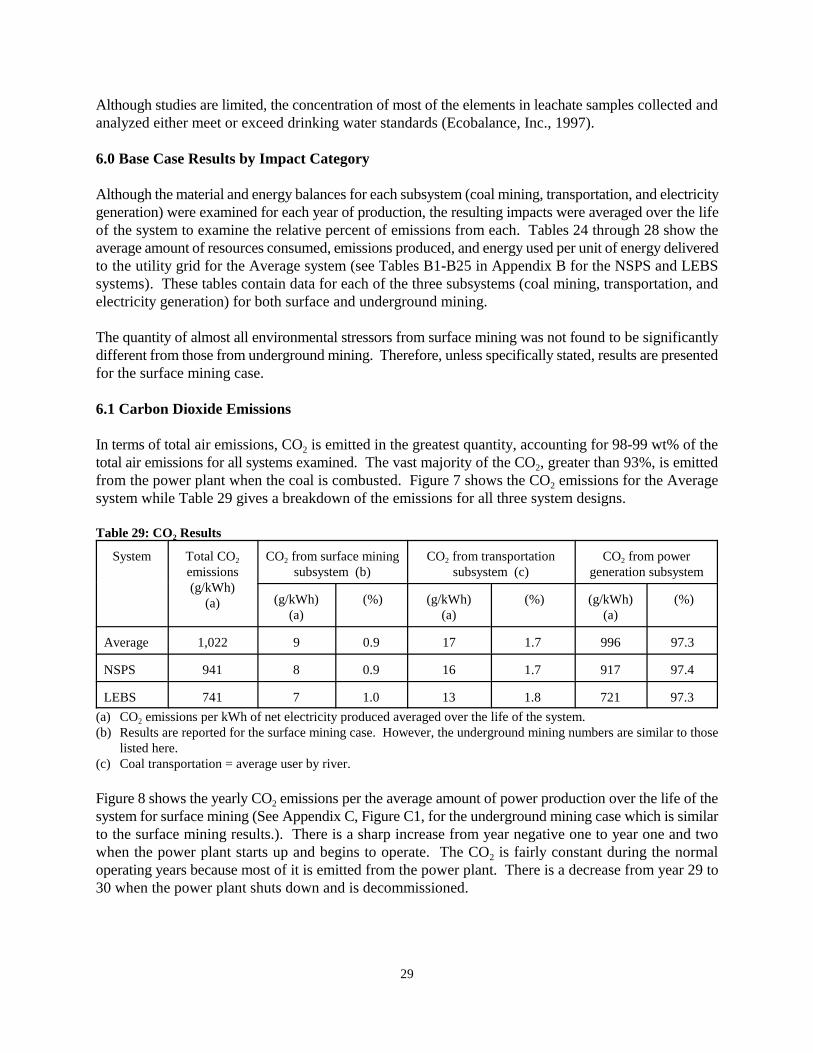
29
Although studies are limited, the concentration of most of the elements in leachate samples collected andanalyzed either meet or exceed drinking water standards (Ecobalance, Inc., 1997).
6.0 Base Case Results by Impact Category
Although the material and energy balances for each subsystem (coal mining, transportation, and electricitygeneration) were examined for each year of production, the resulting impacts were averaged over the lifeof the system to examine the relative percent of emissions from each. Tables 24 through 28 show theaverage amount of resources consumed, emissions produced, and energy used per unit of energy deliveredto the utility grid for the Average system (see Tables B1-B25 in Appendix B for the NSPS and LEBSsystems). These tables contain data for each of the three subsystems (coal mining, transportation, andelectricity generation) for both surface and underground mining.
The quantity of almost all environmental stressors from surface mining was not found to be significantlydifferent from those from underground mining. Therefore, unless specifically stated, results are presentedfor the surface mining case.
6.1 Carbon Dioxide Emissions
In terms of total air emissions, CO is emitted in the greatest quantity, accounting for 98-99 wt% of the2
total air emissions for all systems examined. The vast majority of the CO , greater than 93%, is emitted2
from the power plant when the coal is combusted. Figure 7 shows the CO emissions for the Average2
system while Table 29 gives a breakdown of the emissions for all three system designs.
Table 29: CO Results2
System Total CO2emissions(g/kWh)
(a)
CO from surface mining2
subsystem (b)CO from transportation2
subsystem (c)CO from power2
generation subsystem
(g/kWh)(a)
(%) (g/kWh)(a)
(%) (g/kWh)(a)
(%)
Average 1,022 9 0.9 17 1.7 996 97.3
NSPS 941 8 0.9 16 1.7 917 97.4
LEBS 741 7 1.0 13 1.8 721 97.3
(a) CO emissions per kWh of net electricity produced averaged over the life of the system.2
(b) Results are reported for the surface mining case. However, the underground mining numbers are similar to thoselisted here.
(c) Coal transportation = average user by river.
Figure 8 shows the yearly CO emissions per the average amount of power production over the life of the2
system for surface mining (See Appendix C, Figure C1, for the underground mining case which is similarto the surface mining results.). There is a sharp increase from year negative one to year one and twowhen the power plant starts up and begins to operate. The CO is fairly constant during the normal2
operating years because most of it is emitted from the power plant. There is a decrease from year 29 to30 when the power plant shuts down and is decommissioned.
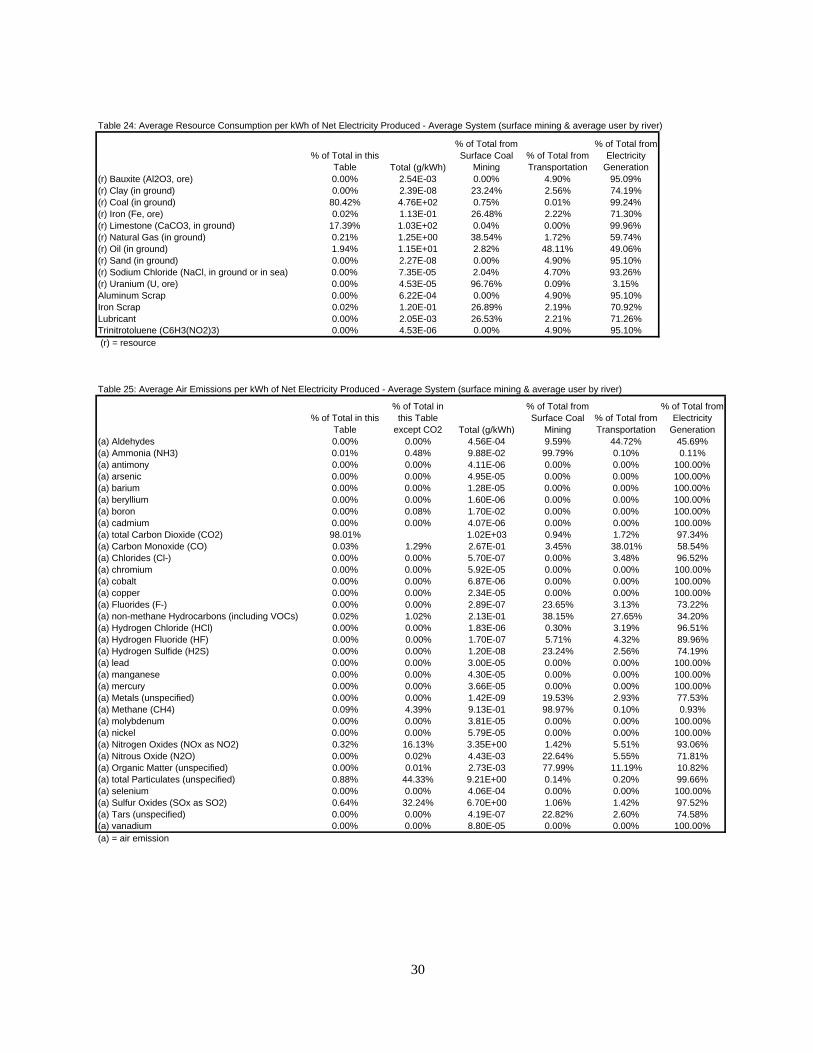
Table 24: Average Resource Consumption per kWh of Net Electricity Produced - Average System (surface mining & average user by river)
% of Total in this Table Total (g/kWh)
% of Total from Surface Coal
Mining% of Total from Transportation
% of Total from Electricity
Generation(r) Bauxite (Al2O3, ore) 0.00% 2.54E-03 0.00% 4.90% 95.09%(r) Clay (in ground) 0.00% 2.39E-08 23.24% 2.56% 74.19%(r) Coal (in ground) 80.42% 4.76E+02 0.75% 0.01% 99.24%(r) Iron (Fe, ore) 0.02% 1.13E-01 26.48% 2.22% 71.30%(r) Limestone (CaCO3, in ground) 17.39% 1.03E+02 0.04% 0.00% 99.96%(r) Natural Gas (in ground) 0.21% 1.25E+00 38.54% 1.72% 59.74%(r) Oil (in ground) 1.94% 1.15E+01 2.82% 48.11% 49.06%(r) Sand (in ground) 0.00% 2.27E-08 0.00% 4.90% 95.10%(r) Sodium Chloride (NaCl, in ground or in sea) 0.00% 7.35E-05 2.04% 4.70% 93.26%(r) Uranium (U, ore) 0.00% 4.53E-05 96.76% 0.09% 3.15%Aluminum Scrap 0.00% 6.22E-04 0.00% 4.90% 95.10%Iron Scrap 0.02% 1.20E-01 26.89% 2.19% 70.92%Lubricant 0.00% 2.05E-03 26.53% 2.21% 71.26%Trinitrotoluene (C6H3(NO2)3) 0.00% 4.53E-06 0.00% 4.90% 95.10% (r) = resource
Table 25: Average Air Emissions per kWh of Net Electricity Produced - Average System (surface mining & average user by river)
% of Total in this Table
% of Total in this Table
except CO2 Total (g/kWh)
% of Total from Surface Coal
Mining% of Total from Transportation
% of Total from Electricity
Generation(a) Aldehydes 0.00% 0.00% 4.56E-04 9.59% 44.72% 45.69%(a) Ammonia (NH3) 0.01% 0.48% 9.88E-02 99.79% 0.10% 0.11%(a) antimony 0.00% 0.00% 4.11E-06 0.00% 0.00% 100.00%(a) arsenic 0.00% 0.00% 4.95E-05 0.00% 0.00% 100.00%(a) barium 0.00% 0.00% 1.28E-05 0.00% 0.00% 100.00%(a) beryllium 0.00% 0.00% 1.60E-06 0.00% 0.00% 100.00%(a) boron 0.00% 0.08% 1.70E-02 0.00% 0.00% 100.00%(a) cadmium 0.00% 0.00% 4.07E-06 0.00% 0.00% 100.00%(a) total Carbon Dioxide (CO2) 98.01% 1.02E+03 0.94% 1.72% 97.34%(a) Carbon Monoxide (CO) 0.03% 1.29% 2.67E-01 3.45% 38.01% 58.54%(a) Chlorides (Cl-) 0.00% 0.00% 5.70E-07 0.00% 3.48% 96.52%(a) chromium 0.00% 0.00% 5.92E-05 0.00% 0.00% 100.00%(a) cobalt 0.00% 0.00% 6.87E-06 0.00% 0.00% 100.00%(a) copper 0.00% 0.00% 2.34E-05 0.00% 0.00% 100.00%(a) Fluorides (F-) 0.00% 0.00% 2.89E-07 23.65% 3.13% 73.22%(a) non-methane Hydrocarbons (including VOCs) 0.02% 1.02% 2.13E-01 38.15% 27.65% 34.20%(a) Hydrogen Chloride (HCl) 0.00% 0.00% 1.83E-06 0.30% 3.19% 96.51%(a) Hydrogen Fluoride (HF) 0.00% 0.00% 1.70E-07 5.71% 4.32% 89.96%(a) Hydrogen Sulfide (H2S) 0.00% 0.00% 1.20E-08 23.24% 2.56% 74.19%(a) lead 0.00% 0.00% 3.00E-05 0.00% 0.00% 100.00%(a) manganese 0.00% 0.00% 4.30E-05 0.00% 0.00% 100.00%(a) mercury 0.00% 0.00% 3.66E-05 0.00% 0.00% 100.00%(a) Metals (unspecified) 0.00% 0.00% 1.42E-09 19.53% 2.93% 77.53%(a) Methane (CH4) 0.09% 4.39% 9.13E-01 98.97% 0.10% 0.93%(a) molybdenum 0.00% 0.00% 3.81E-05 0.00% 0.00% 100.00%(a) nickel 0.00% 0.00% 5.79E-05 0.00% 0.00% 100.00%(a) Nitrogen Oxides (NOx as NO2) 0.32% 16.13% 3.35E+00 1.42% 5.51% 93.06%(a) Nitrous Oxide (N2O) 0.00% 0.02% 4.43E-03 22.64% 5.55% 71.81%(a) Organic Matter (unspecified) 0.00% 0.01% 2.73E-03 77.99% 11.19% 10.82%(a) total Particulates (unspecified) 0.88% 44.33% 9.21E+00 0.14% 0.20% 99.66%(a) selenium 0.00% 0.00% 4.06E-04 0.00% 0.00% 100.00%(a) Sulfur Oxides (SOx as SO2) 0.64% 32.24% 6.70E+00 1.06% 1.42% 97.52%(a) Tars (unspecified) 0.00% 0.00% 4.19E-07 22.82% 2.60% 74.58%(a) vanadium 0.00% 0.00% 8.80E-05 0.00% 0.00% 100.00%(a) = air emission
30
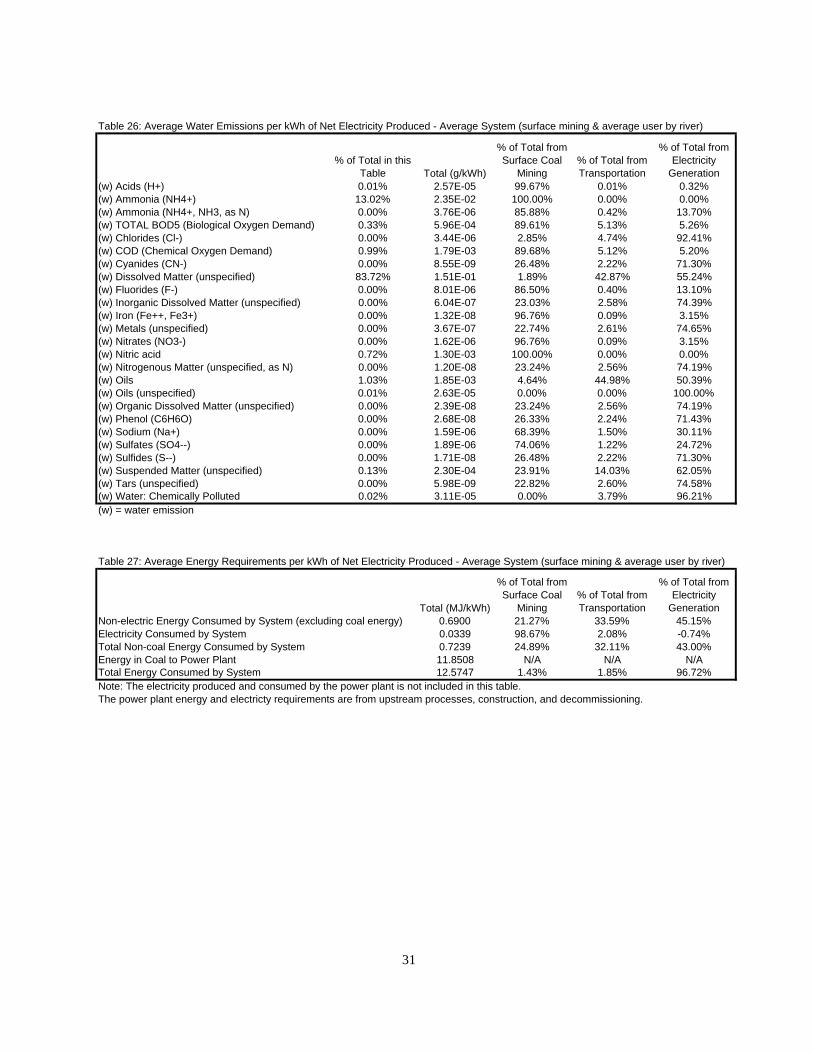
Table 26: Average Water Emissions per kWh of Net Electricity Produced - Average System (surface mining & average user by river)
% of Total in this Table Total (g/kWh)
% of Total from Surface Coal
Mining% of Total from Transportation
% of Total from Electricity
Generation(w) Acids (H+) 0.01% 2.57E-05 99.67% 0.01% 0.32%(w) Ammonia (NH4+) 13.02% 2.35E-02 100.00% 0.00% 0.00%(w) Ammonia (NH4+, NH3, as N) 0.00% 3.76E-06 85.88% 0.42% 13.70%(w) TOTAL BOD5 (Biological Oxygen Demand) 0.33% 5.96E-04 89.61% 5.13% 5.26%(w) Chlorides (Cl-) 0.00% 3.44E-06 2.85% 4.74% 92.41%(w) COD (Chemical Oxygen Demand) 0.99% 1.79E-03 89.68% 5.12% 5.20%(w) Cyanides (CN-) 0.00% 8.55E-09 26.48% 2.22% 71.30%(w) Dissolved Matter (unspecified) 83.72% 1.51E-01 1.89% 42.87% 55.24%(w) Fluorides (F-) 0.00% 8.01E-06 86.50% 0.40% 13.10%(w) Inorganic Dissolved Matter (unspecified) 0.00% 6.04E-07 23.03% 2.58% 74.39%(w) Iron (Fe++, Fe3+) 0.00% 1.32E-08 96.76% 0.09% 3.15%(w) Metals (unspecified) 0.00% 3.67E-07 22.74% 2.61% 74.65%(w) Nitrates (NO3-) 0.00% 1.62E-06 96.76% 0.09% 3.15%(w) Nitric acid 0.72% 1.30E-03 100.00% 0.00% 0.00%(w) Nitrogenous Matter (unspecified, as N) 0.00% 1.20E-08 23.24% 2.56% 74.19%(w) Oils 1.03% 1.85E-03 4.64% 44.98% 50.39%(w) Oils (unspecified) 0.01% 2.63E-05 0.00% 0.00% 100.00%(w) Organic Dissolved Matter (unspecified) 0.00% 2.39E-08 23.24% 2.56% 74.19%(w) Phenol (C6H6O) 0.00% 2.68E-08 26.33% 2.24% 71.43%(w) Sodium (Na+) 0.00% 1.59E-06 68.39% 1.50% 30.11%(w) Sulfates (SO4--) 0.00% 1.89E-06 74.06% 1.22% 24.72%(w) Sulfides (S--) 0.00% 1.71E-08 26.48% 2.22% 71.30%(w) Suspended Matter (unspecified) 0.13% 2.30E-04 23.91% 14.03% 62.05%(w) Tars (unspecified) 0.00% 5.98E-09 22.82% 2.60% 74.58%(w) Water: Chemically Polluted 0.02% 3.11E-05 0.00% 3.79% 96.21%(w) = water emission
Table 27: Average Energy Requirements per kWh of Net Electricity Produced - Average System (surface mining & average user by river)
Total (MJ/kWh)
% of Total from Surface Coal
Mining% of Total from Transportation
% of Total from Electricity
GenerationNon-electric Energy Consumed by System (excluding coal energy) 0.6900 21.27% 33.59% 45.15%Electricity Consumed by System 0.0339 98.67% 2.08% -0.74%Total Non-coal Energy Consumed by System 0.7239 24.89% 32.11% 43.00%Energy in Coal to Power Plant 11.8508 N/A N/A N/ATotal Energy Consumed by System 12.5747 1.43% 1.85% 96.72%Note: The electricity produced and consumed by the power plant is not included in this table.The power plant energy and electricty requirements are from upstream processes, construction, and decommissioning.
31
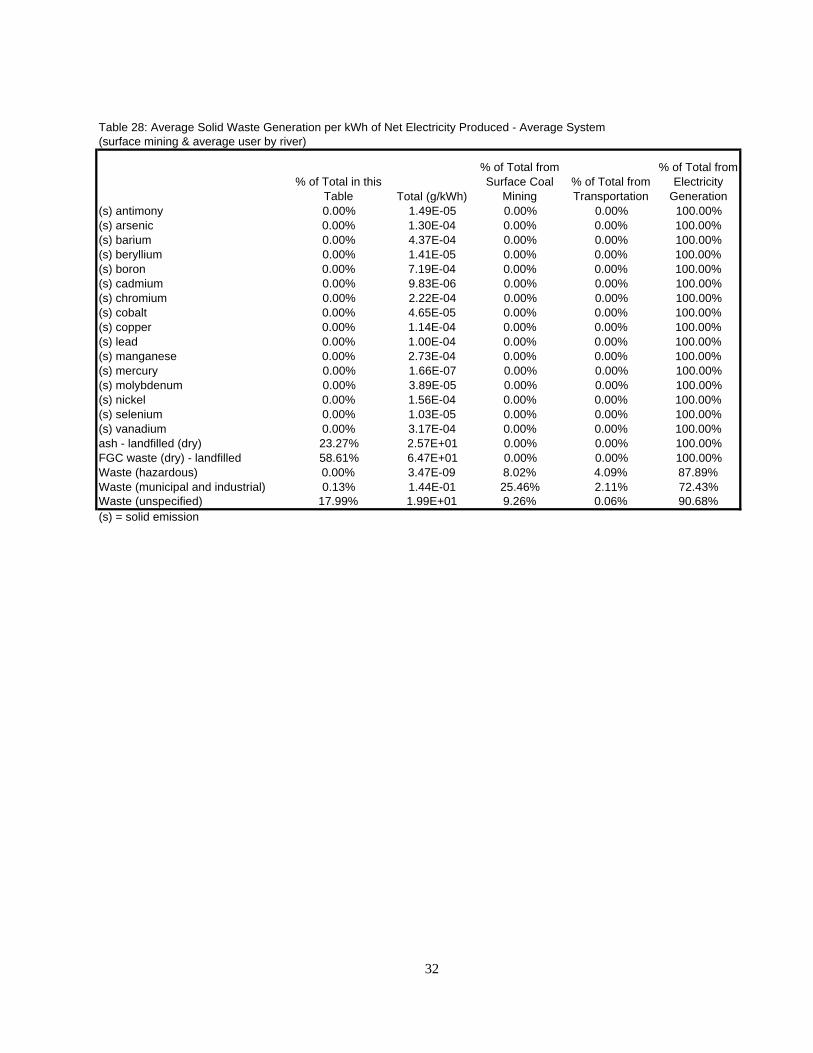
Table 28: Average Solid Waste Generation per kWh of Net Electricity Produced - Average System (surface mining & average user by river)
% of Total in this Table Total (g/kWh)
% of Total from Surface Coal
Mining% of Total from Transportation
% of Total from Electricity
Generation(s) antimony 0.00% 1.49E-05 0.00% 0.00% 100.00%(s) arsenic 0.00% 1.30E-04 0.00% 0.00% 100.00%(s) barium 0.00% 4.37E-04 0.00% 0.00% 100.00%(s) beryllium 0.00% 1.41E-05 0.00% 0.00% 100.00%(s) boron 0.00% 7.19E-04 0.00% 0.00% 100.00%(s) cadmium 0.00% 9.83E-06 0.00% 0.00% 100.00%(s) chromium 0.00% 2.22E-04 0.00% 0.00% 100.00%(s) cobalt 0.00% 4.65E-05 0.00% 0.00% 100.00%(s) copper 0.00% 1.14E-04 0.00% 0.00% 100.00%(s) lead 0.00% 1.00E-04 0.00% 0.00% 100.00%(s) manganese 0.00% 2.73E-04 0.00% 0.00% 100.00%(s) mercury 0.00% 1.66E-07 0.00% 0.00% 100.00%(s) molybdenum 0.00% 3.89E-05 0.00% 0.00% 100.00%(s) nickel 0.00% 1.56E-04 0.00% 0.00% 100.00%(s) selenium 0.00% 1.03E-05 0.00% 0.00% 100.00%(s) vanadium 0.00% 3.17E-04 0.00% 0.00% 100.00%ash - landfilled (dry) 23.27% 2.57E+01 0.00% 0.00% 100.00%FGC waste (dry) - landfilled 58.61% 6.47E+01 0.00% 0.00% 100.00%Waste (hazardous) 0.00% 3.47E-09 8.02% 4.09% 87.89%Waste (municipal and industrial) 0.13% 1.44E-01 25.46% 2.11% 72.43%Waste (unspecified) 17.99% 1.99E+01 9.26% 0.06% 90.68%(s) = solid emission
32
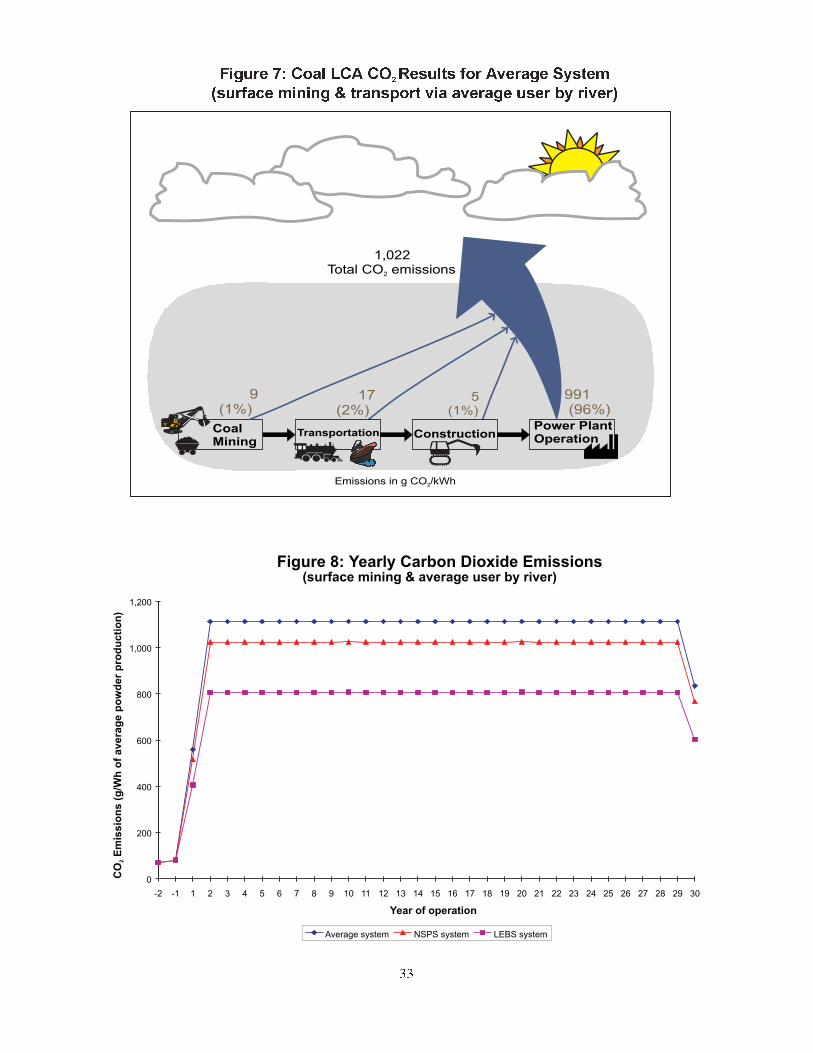
Figure 7: Coal LCA CO Results for Average System
(surface mining & transport via average user by river)2
Power PlantOperation
TransportationCoalMining
Construction
5(1%)
991(96%)
17(2%)
9(1%)
Emissions in g CO /kWh2
1,022Total CO emissions2
Figure 8: Yearly Carbon Dioxide Emissions(surface mining & average user by river)
0
200
400
600
800
1,000
1,200
-2 -1 1 2 3 4 5 6 7 8 9 10 11 12 13 14 15 16 17 18 19 20 21 22 23 24 25 26 27 28 29 30
Year of operation
CO
Em
issio
ns
(g/W
ho
favera
ge
po
wd
er
pro
du
cti
on
)2
Average system NSPS system LEBS system
33
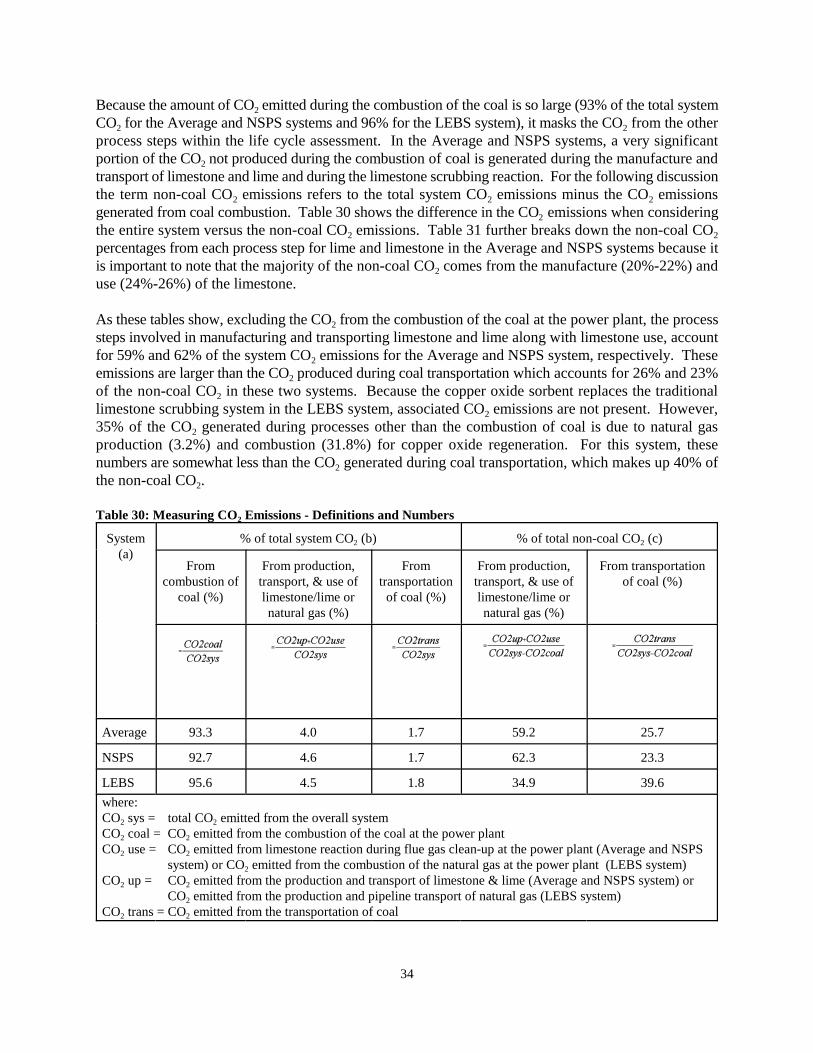
34
Because the amount of CO emitted during the combustion of the coal is so large (93% of the total system2
CO for the Average and NSPS systems and 96% for the LEBS system), it masks the CO from the other2 2
process steps within the life cycle assessment. In the Average and NSPS systems, a very significantportion of the CO not produced during the combustion of coal is generated during the manufacture and2
transport of limestone and lime and during the limestone scrubbing reaction. For the following discussionthe term non-coal CO emissions refers to the total system CO emissions minus the CO emissions2 2 2
generated from coal combustion. Table 30 shows the difference in the CO emissions when considering2
the entire system versus the non-coal CO emissions. Table 31 further breaks down the non-coal CO2 2
percentages from each process step for lime and limestone in the Average and NSPS systems because itis important to note that the majority of the non-coal CO comes from the manufacture (20%-22%) and2
use (24%-26%) of the limestone.
As these tables show, excluding the CO from the combustion of the coal at the power plant, the process2
steps involved in manufacturing and transporting limestone and lime along with limestone use, accountfor 59% and 62% of the system CO emissions for the Average and NSPS system, respectively. These2
emissions are larger than the CO produced during coal transportation which accounts for 26% and 23%2
of the non-coal CO in these two systems. Because the copper oxide sorbent replaces the traditional2
limestone scrubbing system in the LEBS system, associated CO emissions are not present. However,2
35% of the CO generated during processes other than the combustion of coal is due to natural gas2
production (3.2%) and combustion (31.8%) for copper oxide regeneration. For this system, thesenumbers are somewhat less than the CO generated during coal transportation, which makes up 40% of2
the non-coal CO .2
Table 30: Measuring CO Emissions - Definitions and Numbers2
System(a)
% of total system CO (b)2 % of total non-coal CO (c)2
Fromcombustion of
coal (%)
From production,transport, & use oflimestone/lime ornatural gas (%)
Fromtransportationof coal (%)
From production,transport, & use oflimestone/lime ornatural gas (%)
From transportationof coal (%)
Average 93.3 4.0 1.7 59.2 25.7
NSPS 92.7 4.6 1.7 62.3 23.3
LEBS 95.6 4.5 1.8 34.9 39.6
where:CO sys = total CO emitted from the overall system2 2
CO coal = CO emitted from the combustion of the coal at the power plant2 2
CO use = CO emitted from limestone reaction during flue gas clean-up at the power plant (Average and NSPS2 2
system) or CO emitted from the combustion of the natural gas at the power plant (LEBS system)2
CO up = CO emitted from the production and transport of limestone & lime (Average and NSPS system) or2 2
CO emitted from the production and pipeline transport of natural gas (LEBS system)2
CO trans = CO emitted from the transportation of coal2 2
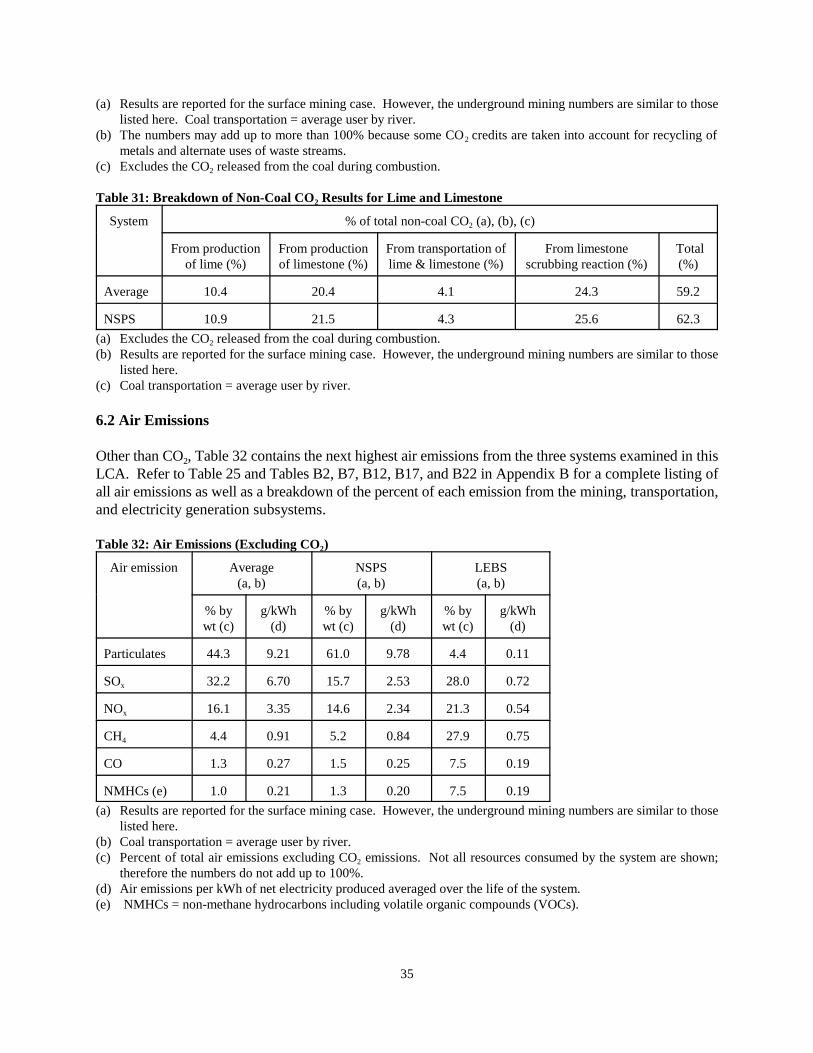
35
(a) Results are reported for the surface mining case. However, the underground mining numbers are similar to thoselisted here. Coal transportation = average user by river.
(b) The numbers may add up to more than 100% because some CO credits are taken into account for recycling of2
metals and alternate uses of waste streams.(c) Excludes the CO released from the coal during combustion.2
Table 31: Breakdown of Non-Coal CO Results for Lime and Limestone2
System % of total non-coal CO (a), (b), (c)2
From productionof lime (%)
From productionof limestone (%)
From transportation oflime & limestone (%)
From limestonescrubbing reaction (%)
Total(%)
Average 10.4 20.4 4.1 24.3 59.2
NSPS 10.9 21.5 4.3 25.6 62.3
(a) Excludes the CO released from the coal during combustion.2
(b) Results are reported for the surface mining case. However, the underground mining numbers are similar to thoselisted here.
(c) Coal transportation = average user by river.
6.2 Air Emissions
Other than CO , Table 32 contains the next highest air emissions from the three systems examined in this2
LCA. Refer to Table 25 and Tables B2, B7, B12, B17, and B22 in Appendix B for a complete listing ofall air emissions as well as a breakdown of the percent of each emission from the mining, transportation,and electricity generation subsystems.
Table 32: Air Emissions (Excluding CO )2
Air emission Average(a, b)
NSPS(a, b)
LEBS(a, b)
% bywt (c)
g/kWh(d)
% bywt (c)
g/kWh(d)
% bywt (c)
g/kWh(d)
Particulates 44.3 9.21 61.0 9.78 4.4 0.11
SOx 32.2 6.70 15.7 2.53 28.0 0.72
NOx 16.1 3.35 14.6 2.34 21.3 0.54
CH4 4.4 0.91 5.2 0.84 27.9 0.75
CO 1.3 0.27 1.5 0.25 7.5 0.19
NMHCs (e) 1.0 0.21 1.3 0.20 7.5 0.19
(a) Results are reported for the surface mining case. However, the underground mining numbers are similar to thoselisted here.
(b) Coal transportation = average user by river.(c) Percent of total air emissions excluding CO emissions. Not all resources consumed by the system are shown;2
therefore the numbers do not add up to 100%.(d) Air emissions per kWh of net electricity produced averaged over the life of the system.(e) NMHCs = non-methane hydrocarbons including volatile organic compounds (VOCs).
36
The numbers in the following discussion are given for surface mining and transportation via the averageuser by river case. In all three systems the power plant produces most of the SO , NO , and CO while thex x
methane comes primarily from the coal mine (see Table 25 and the following tables in Appendix B: B2,B7, B12, B17, and B22 for a breakdown). For the Average and NSPS system, the majority of theparticulates come from the production of limestone (89% of the total particulate emissions for bothsystems) and are created during the quarrying operations. Although the overall amount of particulatesare considerably less for the LEBS system, the bulk of the particulates are emitted by the power plantduring normal operation (47% of the total particulate emissions); the second predominant source ofparticulates is copper oxide production (22% of the total particulate emissions). For all three systems,the NMHC emissions are evenly distributed among the mining, transportation, and power generationsubsystems. However, for the LEBS system it should be noted that 36% of the total NMHC emissionsare emitted during natural gas production.
Figures 9 and 10 show the yearly particulate emissions per the average amount of power production overthe life of the system for both surface and underground mining. Figures 11 and 12 show the yearly SO ,x
and NO emissions for surface mining only (Figures C2 and C3, in Appendix C contain the yearly SO ,x x
and NO results for the underground mining case. These graphs are similar to the surface mining ones.).x
Particulates, SO , and NO are the criteria pollutants that fall under the New Source Performancex x
Standards under the Code of Federal Regulations. As expected, the LEBS plant emits fewer particulates,SO , and NO in accord with its design goals. Also, the particulate emissions from the LEBS system arex x
considerably less than from the Average or NSPS plant. This is almost entirely due to the fact that theLEBS plant does not require limestone for flue gas clean-up, which during its production results in largequantities of particulates. Some limestone is used in underground mining, making the yearly particulateemissions using this mining technique higher than those from surface mining; this is evident whencomparing Figures 9 and 10.
Figure 12 shows that the NO emissions for the LEBS system in year one are less than the constructionx
years because the amount of NO produced during cement manufacturing is large compared to the amountx
of NO produced from the plant which only operates at 50% capacity in year one. The yearly CHx 4
emissions are shown in Figure 13 (See Appendix C, Figure C4, for the yearly underground mining CH4
emissions.). These graphs differ from the particulates, SO , and NO figures in that the methanex x
emissions for each of the three power plant systems are similar primarily because the majority of themethane comes from the coal mine. The average CH emissions over the life of the plant equal 0.91,4
0.84, and 0.71 g/kWh of average power production for the Average, NSPS, and LEBS system,respectively; by contrast, the SO emissions for the three systems are 6.7, 2.5, and 0.72 g/kWh of averagex
power production for the Average, NSPS, and LEBS system, respectively.
Three air emissions that are generally believed to have the potential to contribute to global warming wereemitted from these systems. They are CO , CH , and N O. To determine the total global warming2 4 2
potential (GWP) from these compounds, weighting factors determined by the Intergovernmental Panelon Climate Change (IPCC) were applied. The GWP of a gas reflects its cumulative radiative capacityover a specified period of time. For this study, the 100 year time frame factors were used. Therecommended values, expressed as the GWP of a gas relative to CO on a mass basis, were 21 for2
methane and 310 for nitrous oxide (Houghton et al, 1996). For the Average system using surface mining,CO , CH , and N O were found to be emitted at rates of 1,021.5 g/kWh, 0.9 g/kWh, and 0.004 g/kWh,2 4 2
respectively. Applying the appropriate GWP factors, this equates to 1,021.5, 19.2, and 1.4 g CO2
equivalent/kWh, respectively. Thus, the total potential of this system to contribute to global warming
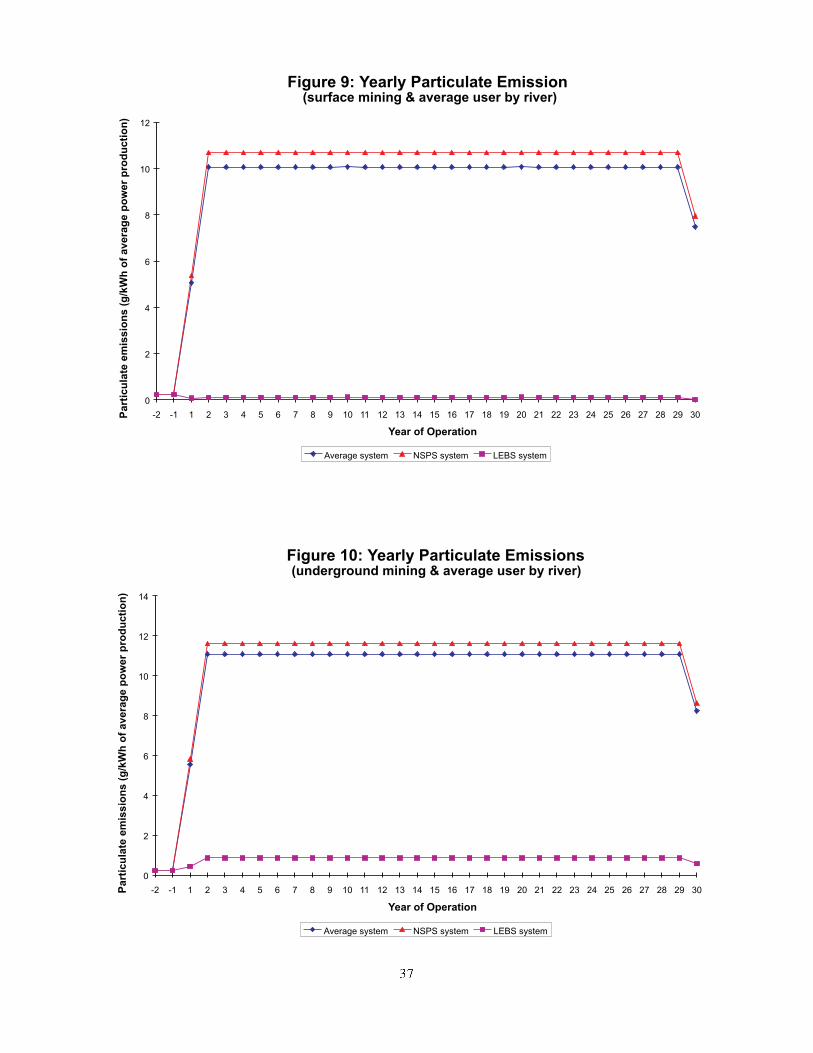
Figure 9: Yearly Particulate Emission(surface mining & average user by river)
0
2
4
6
8
10
12
-2 -1 1 2 3 4 5 6 7 8 9 10 11 12 13 14 15 16 17 18 19 20 21 22 23 24 25 26 27 28 29 30
Year of Operation
Average system NSPS system LEBS system
Figure 10: Yearly Particulate Emissions(underground mining & average user by river)
0
2
4
6
8
10
12
14
-2 -1 1 2 3 4 5 6 7 8 9 10 11 12 13 14 15 16 17 18 19 20 21 22 23 24 25 26 27 28 29 30
Year of Operation
Part
icu
late
em
issio
ns
(g/k
Wh
of
ave
rag
ep
ow
er
pro
du
cti
on
)P
art
icu
late
em
issio
ns
(g/k
Wh
of
avera
ge
po
wer
pro
du
cti
on
)
Average system NSPS system LEBS system
37
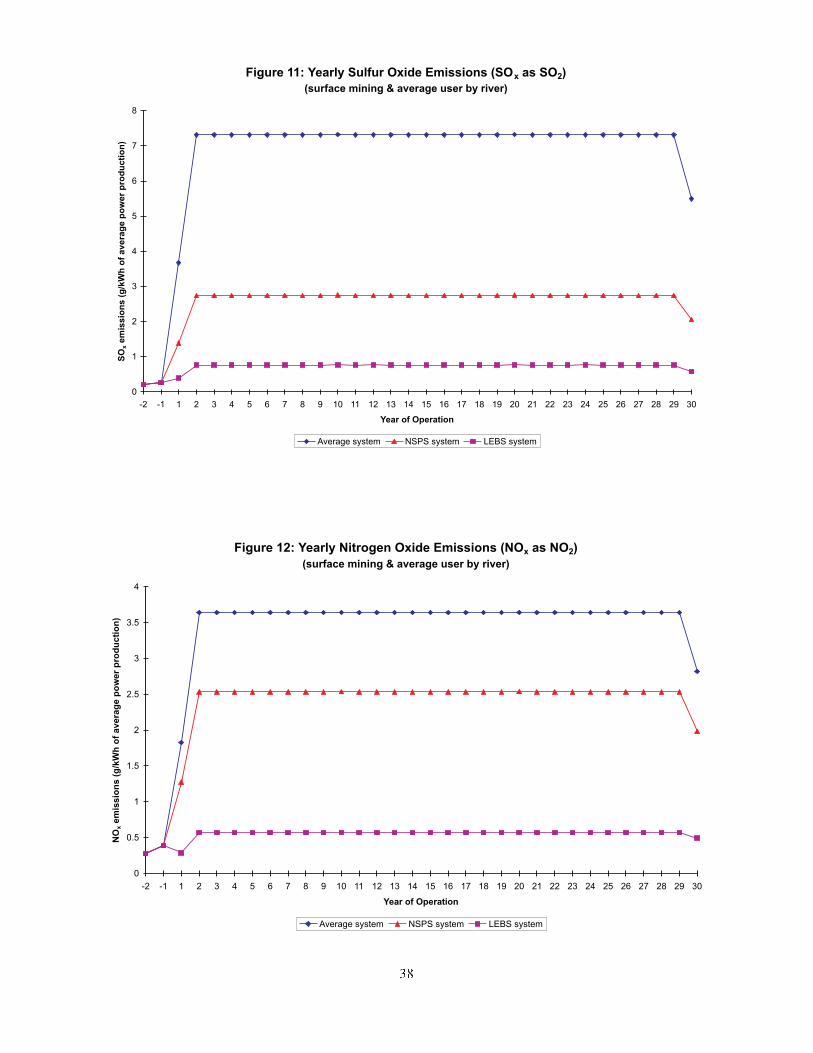
Figure 11: Yearly Sulfur Oxide Emissions (SOx as SO2)
(surface mining & average user by river)
0
1
2
3
4
5
6
7
8
-2 -1 1 2 3 4 5 6 7 8 9 10 11 12 13 14 15 16 17 18 19 20 21 22 23 24 25 26 27 28 29 30
Year of Operation
SO
xe
mis
sio
ns
(g/k
Wh
of
av
era
ge
po
we
rp
rod
uc
tio
n)
Average system NSPS system LEBS system
Figure 12: Yearly Nitrogen Oxide Emissions (NOx as NO2)
(surface mining & average user by river)
0
0.5
1
1.5
2
2.5
3
3.5
4
-2 -1 1 2 3 4 5 6 7 8 9 10 11 12 13 14 15 16 17 18 19 20 21 22 23 24 25 26 27 28 29 30
Year of Operation
NO
xe
mis
sio
ns
(g/k
Wh
of
av
era
ge
po
we
rp
rod
uc
tio
n)
Average system NSPS system LEBS system
38
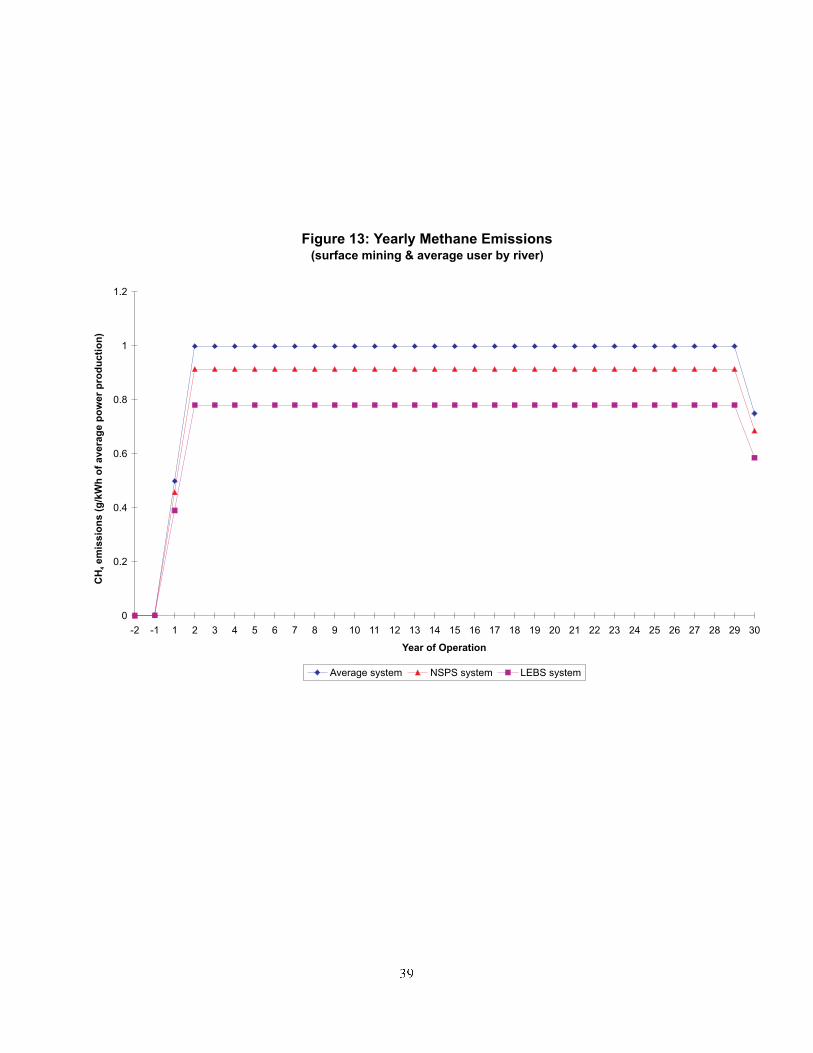
Figure 13: Yearly Methane Emissions(surface mining & average user by river)
0
0.2
0.4
0.6
0.8
1
1.2
-2 -1 1 2 3 4 5 6 7 8 9 10 11 12 13 14 15 16 17 18 19 20 21 22 23 24 25 26 27 28 29 30
Year of Operation
CH
em
iss
ion
s(g
/kW
ho
fa
ve
rag
ep
ow
er
pro
du
cti
on
)4
Average system NSPS system LEBS system
39
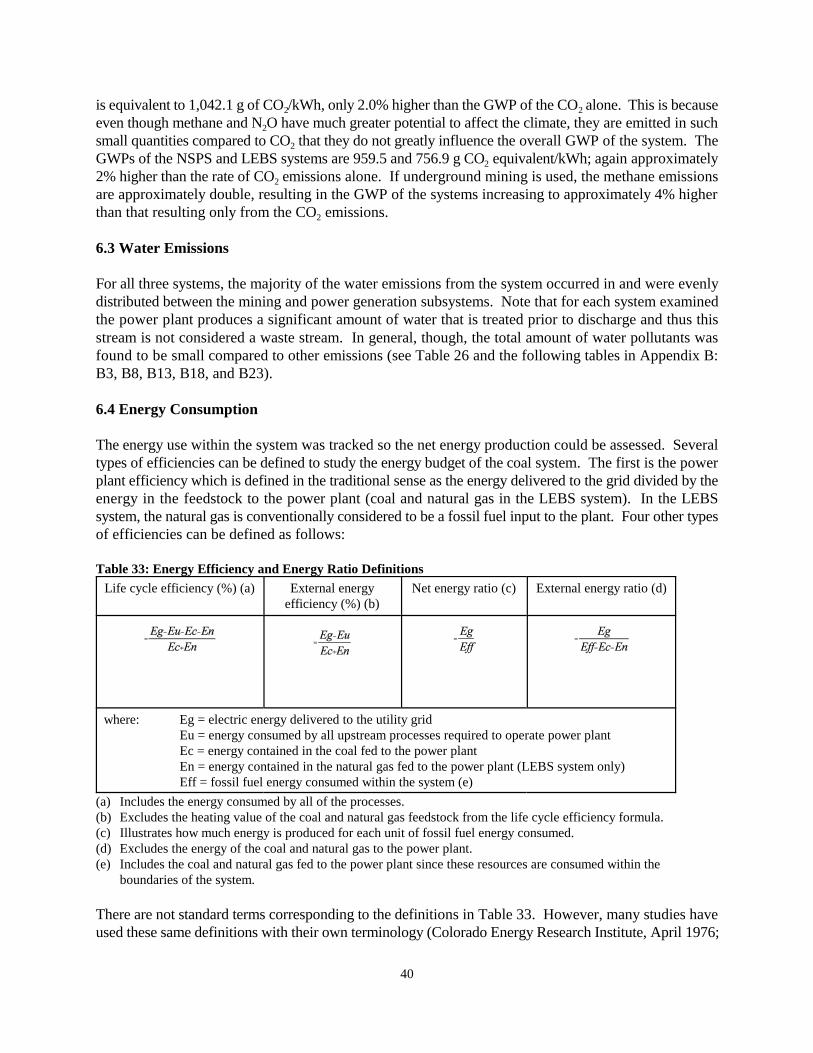
40
is equivalent to 1,042.1 g of CO /kWh, only 2.0% higher than the GWP of the CO alone. This is because2 2
even though methane and N O have much greater potential to affect the climate, they are emitted in such2
small quantities compared to CO that they do not greatly influence the overall GWP of the system. The2
GWPs of the NSPS and LEBS systems are 959.5 and 756.9 g CO equivalent/kWh; again approximately2
2% higher than the rate of CO emissions alone. If underground mining is used, the methane emissions2
are approximately double, resulting in the GWP of the systems increasing to approximately 4% higherthan that resulting only from the CO emissions.2
6.3 Water Emissions
For all three systems, the majority of the water emissions from the system occurred in and were evenlydistributed between the mining and power generation subsystems. Note that for each system examinedthe power plant produces a significant amount of water that is treated prior to discharge and thus thisstream is not considered a waste stream. In general, though, the total amount of water pollutants wasfound to be small compared to other emissions (see Table 26 and the following tables in Appendix B:B3, B8, B13, B18, and B23).
6.4 Energy Consumption
The energy use within the system was tracked so the net energy production could be assessed. Severaltypes of efficiencies can be defined to study the energy budget of the coal system. The first is the powerplant efficiency which is defined in the traditional sense as the energy delivered to the grid divided by theenergy in the feedstock to the power plant (coal and natural gas in the LEBS system). In the LEBSsystem, the natural gas is conventionally considered to be a fossil fuel input to the plant. Four other typesof efficiencies can be defined as follows:
Table 33: Energy Efficiency and Energy Ratio Definitions
Life cycle efficiency (%) (a) External energyefficiency (%) (b)
Net energy ratio (c) External energy ratio (d)
where: Eg = electric energy delivered to the utility gridEu = energy consumed by all upstream processes required to operate power plantEc = energy contained in the coal fed to the power plantEn = energy contained in the natural gas fed to the power plant (LEBS system only)Eff = fossil fuel energy consumed within the system (e)
(a) Includes the energy consumed by all of the processes.(b) Excludes the heating value of the coal and natural gas feedstock from the life cycle efficiency formula.(c) Illustrates how much energy is produced for each unit of fossil fuel energy consumed.(d) Excludes the energy of the coal and natural gas to the power plant.(e) Includes the coal and natural gas fed to the power plant since these resources are consumed within the
boundaries of the system.
There are not standard terms corresponding to the definitions in Table 33. However, many studies haveused these same definitions with their own terminology (Colorado Energy Research Institute, April 1976;
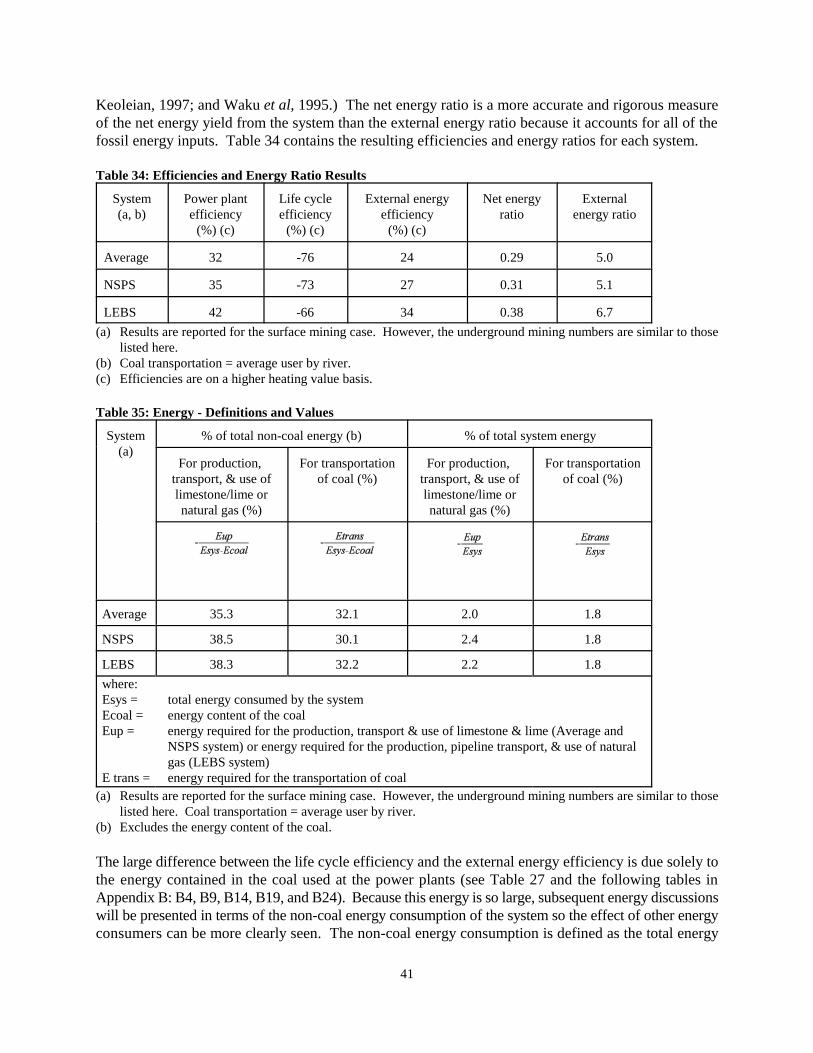
41
Keoleian, 1997; and Waku et al, 1995.) The net energy ratio is a more accurate and rigorous measureof the net energy yield from the system than the external energy ratio because it accounts for all of thefossil energy inputs. Table 34 contains the resulting efficiencies and energy ratios for each system.
Table 34: Efficiencies and Energy Ratio Results
System(a, b)
Power plantefficiency(%) (c)
Life cycleefficiency(%) (c)
External energyefficiency(%) (c)
Net energyratio
Externalenergy ratio
Average 32 -76 24 0.29 5.0
NSPS 35 -73 27 0.31 5.1
LEBS 42 -66 34 0.38 6.7
(a) Results are reported for the surface mining case. However, the underground mining numbers are similar to thoselisted here.
(b) Coal transportation = average user by river.(c) Efficiencies are on a higher heating value basis.
Table 35: Energy - Definitions and Values
System(a)
% of total non-coal energy (b) % of total system energy
For production, transport, & use oflimestone/lime ornatural gas (%)
For transportationof coal (%)
For production, transport, & use oflimestone/lime ornatural gas (%)
For transportationof coal (%)
Average 35.3 32.1 2.0 1.8
NSPS 38.5 30.1 2.4 1.8
LEBS 38.3 32.2 2.2 1.8
where:Esys = total energy consumed by the systemEcoal = energy content of the coalEup = energy required for the production, transport & use of limestone & lime (Average and
NSPS system) or energy required for the production, pipeline transport, & use of naturalgas (LEBS system)
E trans = energy required for the transportation of coal(a) Results are reported for the surface mining case. However, the underground mining numbers are similar to those
listed here. Coal transportation = average user by river.(b) Excludes the energy content of the coal.
The large difference between the life cycle efficiency and the external energy efficiency is due solely tothe energy contained in the coal used at the power plants (see Table 27 and the following tables inAppendix B: B4, B9, B14, B19, and B24). Because this energy is so large, subsequent energy discussionswill be presented in terms of the non-coal energy consumption of the system so the effect of other energyconsumers can be more clearly seen. The non-coal energy consumption is defined as the total energy
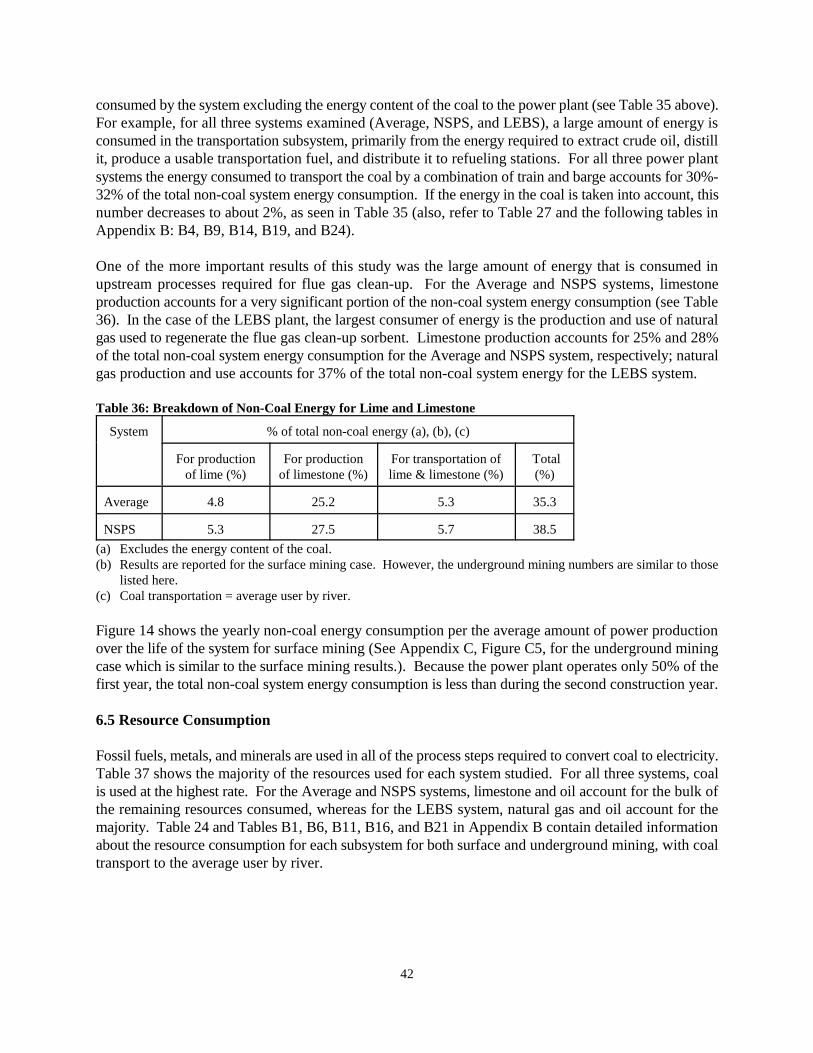
42
consumed by the system excluding the energy content of the coal to the power plant (see Table 35 above).For example, for all three systems examined (Average, NSPS, and LEBS), a large amount of energy isconsumed in the transportation subsystem, primarily from the energy required to extract crude oil, distillit, produce a usable transportation fuel, and distribute it to refueling stations. For all three power plantsystems the energy consumed to transport the coal by a combination of train and barge accounts for 30%-32% of the total non-coal system energy consumption. If the energy in the coal is taken into account, thisnumber decreases to about 2%, as seen in Table 35 (also, refer to Table 27 and the following tables inAppendix B: B4, B9, B14, B19, and B24).
One of the more important results of this study was the large amount of energy that is consumed inupstream processes required for flue gas clean-up. For the Average and NSPS systems, limestoneproduction accounts for a very significant portion of the non-coal system energy consumption (see Table36). In the case of the LEBS plant, the largest consumer of energy is the production and use of naturalgas used to regenerate the flue gas clean-up sorbent. Limestone production accounts for 25% and 28%of the total non-coal system energy consumption for the Average and NSPS system, respectively; naturalgas production and use accounts for 37% of the total non-coal system energy for the LEBS system.
Table 36: Breakdown of Non-Coal Energy for Lime and Limestone
System % of total non-coal energy (a), (b), (c)
For productionof lime (%)
For productionof limestone (%)
For transportation oflime & limestone (%)
Total(%)
Average 4.8 25.2 5.3 35.3
NSPS 5.3 27.5 5.7 38.5
(a) Excludes the energy content of the coal.(b) Results are reported for the surface mining case. However, the underground mining numbers are similar to those
listed here.(c) Coal transportation = average user by river.
Figure 14 shows the yearly non-coal energy consumption per the average amount of power productionover the life of the system for surface mining (See Appendix C, Figure C5, for the underground miningcase which is similar to the surface mining results.). Because the power plant operates only 50% of thefirst year, the total non-coal system energy consumption is less than during the second construction year.
6.5 Resource Consumption
Fossil fuels, metals, and minerals are used in all of the process steps required to convert coal to electricity.Table 37 shows the majority of the resources used for each system studied. For all three systems, coalis used at the highest rate. For the Average and NSPS systems, limestone and oil account for the bulk ofthe remaining resources consumed, whereas for the LEBS system, natural gas and oil account for themajority. Table 24 and Tables B1, B6, B11, B16, and B21 in Appendix B contain detailed informationabout the resource consumption for each subsystem for both surface and underground mining, with coaltransport to the average user by river.
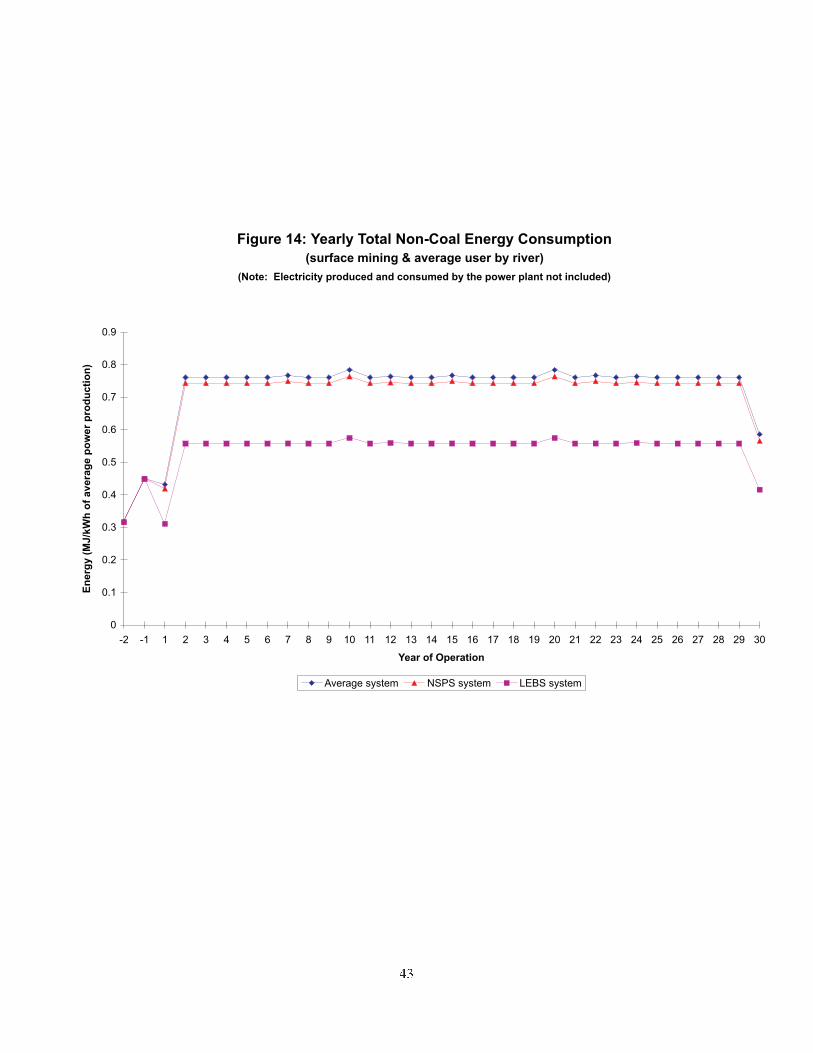
Figure 14: Yearly Total Non-Coal Energy Consumption
(surface mining & average user by river)
(Note: Electricity produced and consumed by the power plant not included)
0
0.1
0.2
0.3
0.4
0.5
0.6
0.7
0.8
0.9
-2 -1 1 2 3 4 5 6 7 8 9 10 11 12 13 14 15 16 17 18 19 20 21 22 23 24 25 26 27 28 29 30
Year of Operation
En
erg
y(M
J/k
Wh
of
av
era
ge
po
we
rp
rod
uc
tio
n)
Average system NSPS system LEBS system
43
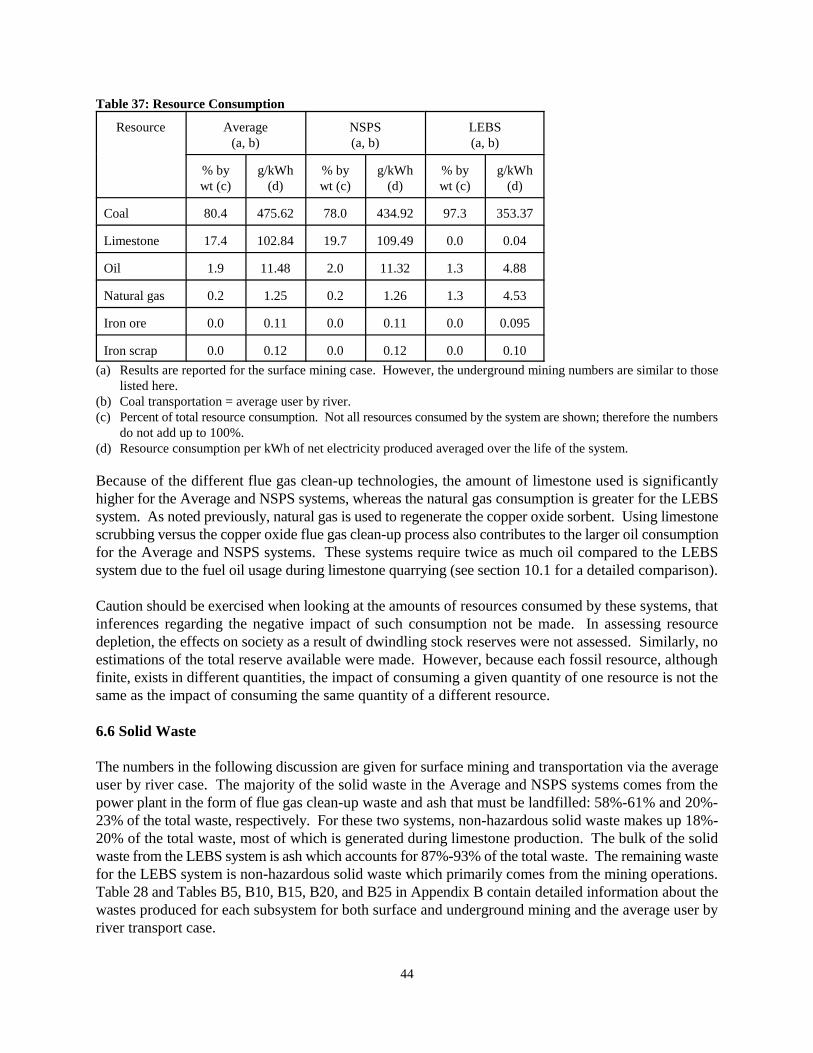
44
Table 37: Resource Consumption
Resource Average(a, b)
NSPS(a, b)
LEBS(a, b)
% bywt (c)
g/kWh(d)
% bywt (c)
g/kWh(d)
% bywt (c)
g/kWh(d)
Coal 80.4 475.62 78.0 434.92 97.3 353.37
Limestone 17.4 102.84 19.7 109.49 0.0 0.04
Oil 1.9 11.48 2.0 11.32 1.3 4.88
Natural gas 0.2 1.25 0.2 1.26 1.3 4.53
Iron ore 0.0 0.11 0.0 0.11 0.0 0.095
Iron scrap 0.0 0.12 0.0 0.12 0.0 0.10
(a) Results are reported for the surface mining case. However, the underground mining numbers are similar to thoselisted here.
(b) Coal transportation = average user by river.(c) Percent of total resource consumption. Not all resources consumed by the system are shown; therefore the numbers
do not add up to 100%.(d) Resource consumption per kWh of net electricity produced averaged over the life of the system.
Because of the different flue gas clean-up technologies, the amount of limestone used is significantlyhigher for the Average and NSPS systems, whereas the natural gas consumption is greater for the LEBSsystem. As noted previously, natural gas is used to regenerate the copper oxide sorbent. Using limestonescrubbing versus the copper oxide flue gas clean-up process also contributes to the larger oil consumptionfor the Average and NSPS systems. These systems require twice as much oil compared to the LEBSsystem due to the fuel oil usage during limestone quarrying (see section 10.1 for a detailed comparison).
Caution should be exercised when looking at the amounts of resources consumed by these systems, thatinferences regarding the negative impact of such consumption not be made. In assessing resourcedepletion, the effects on society as a result of dwindling stock reserves were not assessed. Similarly, noestimations of the total reserve available were made. However, because each fossil resource, althoughfinite, exists in different quantities, the impact of consuming a given quantity of one resource is not thesame as the impact of consuming the same quantity of a different resource.
6.6 Solid Waste
The numbers in the following discussion are given for surface mining and transportation via the averageuser by river case. The majority of the solid waste in the Average and NSPS systems comes from thepower plant in the form of flue gas clean-up waste and ash that must be landfilled: 58%-61% and 20%-23% of the total waste, respectively. For these two systems, non-hazardous solid waste makes up 18%-20% of the total waste, most of which is generated during limestone production. The bulk of the solidwaste from the LEBS system is ash which accounts for 87%-93% of the total waste. The remaining wastefor the LEBS system is non-hazardous solid waste which primarily comes from the mining operations.Table 28 and Tables B5, B10, B15, B20, and B25 in Appendix B contain detailed information about thewastes produced for each subsystem for both surface and underground mining and the average user byriver transport case.
45
7.0 Results Specific to the Three Major Subsystems
7.1 Base Case Coal Mining Results
Overall, the environmental impacts from surface and underground mining are essentially equal. Otherthan the mining methane emissions which will ultimately be site-specific, the main difference betweenthe two techniques is that the surface mining subsystem results in a higher amount of airborne ammoniaemissions due to the production of ammonium nitrate explosives used at the mine. For example, theaverage yearly airborne ammonia emissions for the Average system are 0.099 g/kWh of net electricityproduced for the surface mining case versus 0.00022 g/kWh of net electricity produced for undergroundmining for the average user by river transport case. Another important difference between the two miningtechniques is that underground mining requires limestone, which emits a large amount of particulatesduring its production. Therefore, the particulate emissions in systems using this mining method will behigher. For example, the average yearly particulate emissions for the Average system are 0.0092 g/kWhof net electricity produced for the surface mining case versus 0.93 g/kWh of net electricity produced forunderground mining (average user by river transport).
In general, coal mining uses more electricity than the transportation and electricity generation subsystems.As expected, the majority of the overall methane emissions come from the mine itself. Also, about halfof the water emissions come from the mining subsystem.
7.2 Base Case Coal Transportation Results
Of the three subsystems examined (coal mining, transportation, and electricity production), transportationrequired the least amount of resources and had the lowest air, water, and solid waste emissions even whenconsidering the farthest user case (see Tables 24-28 and Tables B1-B25 in Appendix B for the averageuser by river numbers and percentages). However, the energy consumption for this subsystem wassignificant (excluding the mine mouth case). For mine mouth operation, all stressors are less than 3.5%of the total over the life of the system, with the majority around 0.1%. However, for the other threetransportation cases (average user by river, average user by land, and farthest user) oil consumption aswell as a few air and water emissions are high.
Regarding the average user by river and average user by land cases in the Average and NSPS systems,the oil consumption was about 45% of the total over the life of the system; this increased to 80% for thefarthest user case. For the LEBS system, the oil consumption amounted to 85% for the average user byriver and average user by land, increasing to 95% for the farthest user case.
For all three power plant systems (Average, NSPS, and LEBS), of the total non-coal energy consumedby the system the percent from transportation was about 33% for both the average user by river andaverage user by land cases. However, this percentage increased to approximately 67% for the farthestuser case. Thus, the transportation distance was found to have a substantial effect on amount of oilconsumed, a few of the system emissions, and the non-coal energy consumption, whereas the mode oftransportation has virtually no effect on any major results.
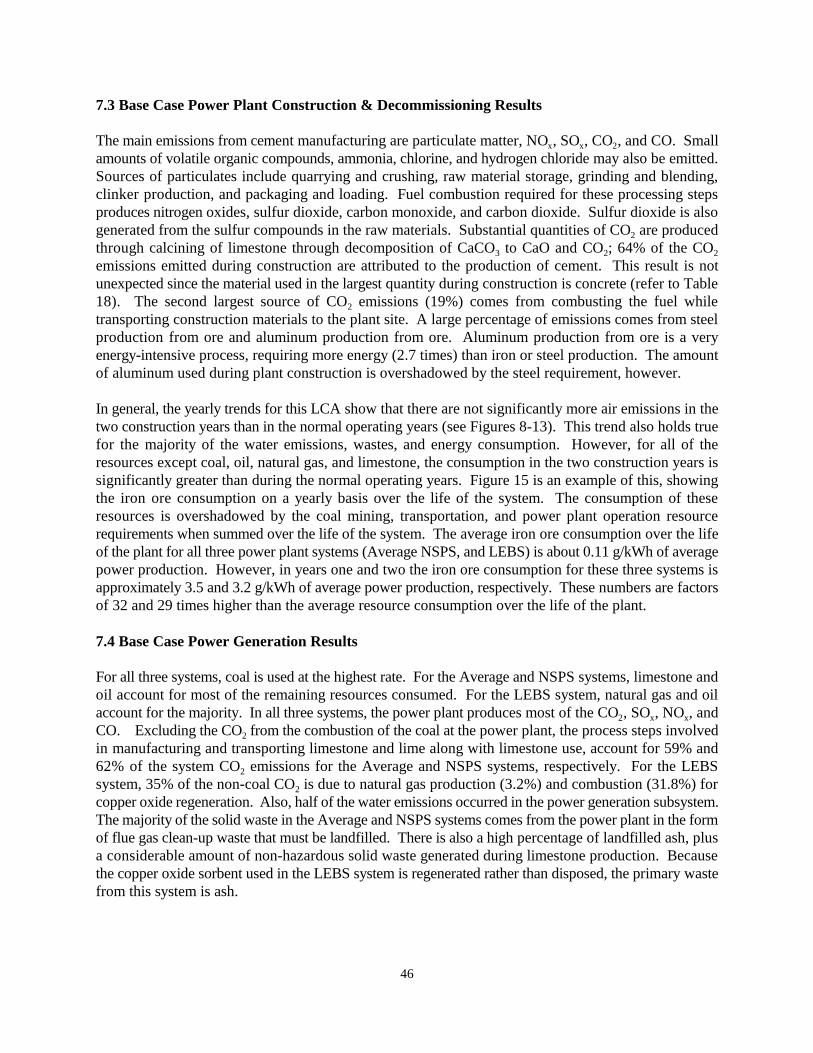
46
7.3 Base Case Power Plant Construction & Decommissioning Results
The main emissions from cement manufacturing are particulate matter, NO , SO , CO , and CO. Smallx x 2
amounts of volatile organic compounds, ammonia, chlorine, and hydrogen chloride may also be emitted.Sources of particulates include quarrying and crushing, raw material storage, grinding and blending,clinker production, and packaging and loading. Fuel combustion required for these processing stepsproduces nitrogen oxides, sulfur dioxide, carbon monoxide, and carbon dioxide. Sulfur dioxide is alsogenerated from the sulfur compounds in the raw materials. Substantial quantities of CO are produced2
through calcining of limestone through decomposition of CaCO to CaO and CO ; 64% of the CO3 2 2
emissions emitted during construction are attributed to the production of cement. This result is notunexpected since the material used in the largest quantity during construction is concrete (refer to Table18). The second largest source of CO emissions (19%) comes from combusting the fuel while2
transporting construction materials to the plant site. A large percentage of emissions comes from steelproduction from ore and aluminum production from ore. Aluminum production from ore is a veryenergy-intensive process, requiring more energy (2.7 times) than iron or steel production. The amountof aluminum used during plant construction is overshadowed by the steel requirement, however.
In general, the yearly trends for this LCA show that there are not significantly more air emissions in thetwo construction years than in the normal operating years (see Figures 8-13). This trend also holds truefor the majority of the water emissions, wastes, and energy consumption. However, for all of theresources except coal, oil, natural gas, and limestone, the consumption in the two construction years issignificantly greater than during the normal operating years. Figure 15 is an example of this, showingthe iron ore consumption on a yearly basis over the life of the system. The consumption of theseresources is overshadowed by the coal mining, transportation, and power plant operation resourcerequirements when summed over the life of the system. The average iron ore consumption over the lifeof the plant for all three power plant systems (Average NSPS, and LEBS) is about 0.11 g/kWh of averagepower production. However, in years one and two the iron ore consumption for these three systems isapproximately 3.5 and 3.2 g/kWh of average power production, respectively. These numbers are factorsof 32 and 29 times higher than the average resource consumption over the life of the plant.
7.4 Base Case Power Generation Results
For all three systems, coal is used at the highest rate. For the Average and NSPS systems, limestone andoil account for most of the remaining resources consumed. For the LEBS system, natural gas and oilaccount for the majority. In all three systems, the power plant produces most of the CO , SO , NO , and2 x x
CO. Excluding the CO from the combustion of the coal at the power plant, the process steps involved2
in manufacturing and transporting limestone and lime along with limestone use, account for 59% and62% of the system CO emissions for the Average and NSPS systems, respectively. For the LEBS2
system, 35% of the non-coal CO is due to natural gas production (3.2%) and combustion (31.8%) for2
copper oxide regeneration. Also, half of the water emissions occurred in the power generation subsystem.The majority of the solid waste in the Average and NSPS systems comes from the power plant in the formof flue gas clean-up waste that must be landfilled. There is also a high percentage of landfilled ash, plusa considerable amount of non-hazardous solid waste generated during limestone production. Becausethe copper oxide sorbent used in the LEBS system is regenerated rather than disposed, the primary wastefrom this system is ash.
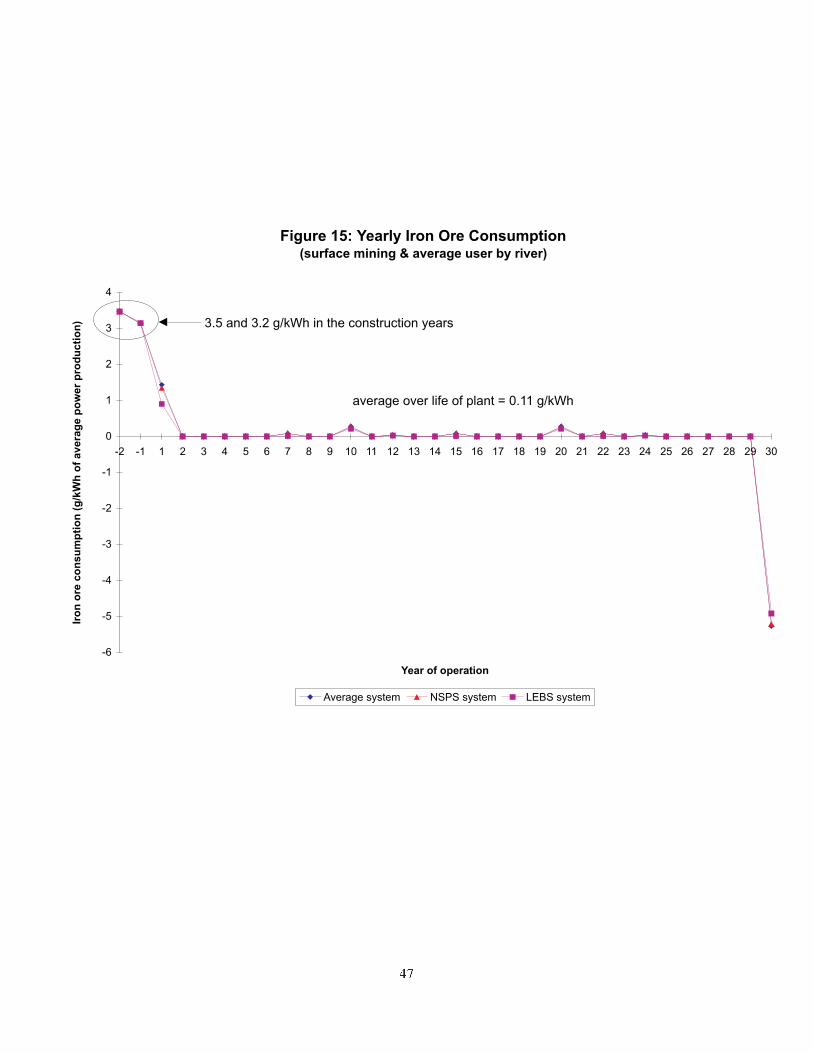
47
Figure 15: Yearly Iron Ore Consumption(surface mining & average user by river)
-6
-5
-4
-3
-2
-1
0
1
2
3
4
-2 -1 1 2 3 4 5 6 7 8 9 10 11 12 13 14 15 16 17 18 19 20 21 22 23 24 25 26 27 28 29 30
Year of operation
Iro
no
rec
on
su
mp
tio
n(g
/kW
ho
fa
ve
rag
ep
ow
er
pro
du
cti
on
)
Average system NSPS system LEBS system
average over life of plant = 0.11 g/kWh
3.5 and 3.2 g/kWh in the construction years
48
For the Average and NSPS systems, a large amount of the total non-coal energy requirement for thepower generation subsystem comes from limestone production whereas for the LEBS system, the largestconsumer of energy is in the production and consumption of natural gas. Limestone production accountsfor 25% and 28% of the total non-coal system energy consumption for the Average and NSPS system,respectively. Natural gas production and use account for 37% of the total non-coal system energy for theLEBS system. As expected, the LEBS plant requires fewer resources and energy and produces feweremissions and waste per unit of energy delivered to the utility grid than the Average or NSPS systems.
8.0 Sensitivity Analysis
A sensitivity analysis was conducted to determine the parameters that had the largest effects on the resultsand to determine the impact of estimated data as well as variations in data on the conclusions. Variablesincluded in the sensitivity analysis were chosen to reflect system areas that had inherently more unknownsin the data in addition to areas where major assumptions were made. Each parameter was changedindependently of all others so that the magnitude of its effect on the base case could be assessed.Therefore, no single sensitivity case represents the best or worst situation under which these systemsmight operate.
One variable may affect several factors and thus several process steps, or it may affect only one block inthe overall life cycle assessment. For instance, changing the power plant efficiency affects the amountof coal required at the plant, which in turn affects the coal mining and transportation requirements.However, varying the amount of materials used to build the power plant affects only the emissionsassociated with plant construction and decommissioning. These effects were taken into accountautomatically in the LCA model.
The base case assumed transportation to the average user by river. Table 38 and Tables B26-B30 inAppendix B summarize the effects on the major emissions, energy use, and resource consumption relativeto the base case for the parameters varied in the sensitivity analysis. Note that all resources and emissionsare not shown in these tables. The percentages shown represent the deviation from the base case valueswhen comparing the results on a per unit of energy produced (i.e., MWh) basis. The positive numbersindicate a percent increase; the negative numbers signify a decrease. Table 39 and Tables B31-B32contain the sensitivity analysis results for the efficiencies and energy ratios. For easier interpretation,Figures 16-19 are graphical representations of these results for surface mining only for the Average powerplant system (See Appendix C, Figures C6-C13, for the surface mining results of the LEBS and NSPSsystems). The sensitivity cases that result in the largest change from the base case values are highlightedin these figures.
In general, the only way to appreciably reduce the emissions, resource consumption, and energy use ofthese systems, is to reduce the amount of coal being consumed. The vast majority of CO , SO , NO , and2 x x
CO air emissions result directly from coal combustion. Similarly, the energy consumed by the systemsis due in large part to the consumption of the energy contained in the coal. Additionally, the bestopportunity to reduce stressors associated with upstream processes is to reduce coal use at the powerplant. For example, using less coal will result in lower limestone and transportation requirements. Thesein turn will reduce upstream CO and particulate emissions, resource consumption, and energy use. For2
these reasons, changing the power plant efficiency by +/- 5 percentage points resulted in the largestchange in emissions, resource consumption, and energy use. Increasing or decreasing the coaltransportation distance had the next largest effect, although changing the mode of transportation (i.e.,
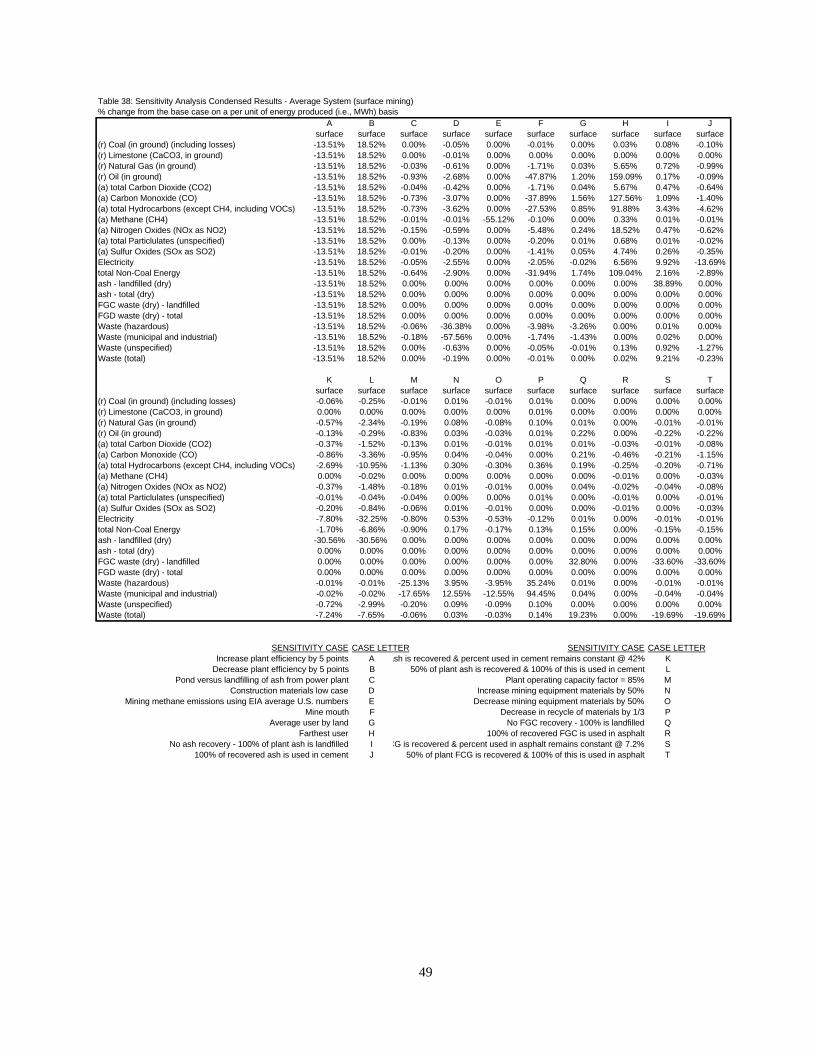
Table 38: Sensitivity Analysis Condensed Results - Average System (surface mining)% change from the base case on a per unit of energy produced (i.e., MWh) basis
A B C D E F G H I Jsurface surface surface surface surface surface surface surface surface surface
(r) Coal (in ground) (including losses) -13.51% 18.52% 0.00% -0.05% 0.00% -0.01% 0.00% 0.03% 0.08% -0.10%(r) Limestone (CaCO3, in ground) -13.51% 18.52% 0.00% -0.01% 0.00% 0.00% 0.00% 0.00% 0.00% 0.00%(r) Natural Gas (in ground) -13.51% 18.52% -0.03% -0.61% 0.00% -1.71% 0.03% 5.65% 0.72% -0.99%(r) Oil (in ground) -13.51% 18.52% -0.93% -2.68% 0.00% -47.87% 1.20% 159.09% 0.17% -0.09%(a) total Carbon Dioxide (CO2) -13.51% 18.52% -0.04% -0.42% 0.00% -1.71% 0.04% 5.67% 0.47% -0.64%(a) Carbon Monoxide (CO) -13.51% 18.52% -0.73% -3.07% 0.00% -37.89% 1.56% 127.56% 1.09% -1.40%(a) total Hydrocarbons (except CH4, including VOCs) -13.51% 18.52% -0.73% -3.62% 0.00% -27.53% 0.85% 91.88% 3.43% -4.62%(a) Methane (CH4) -13.51% 18.52% -0.01% -0.01% -55.12% -0.10% 0.00% 0.33% 0.01% -0.01%(a) Nitrogen Oxides (NOx as NO2) -13.51% 18.52% -0.15% -0.59% 0.00% -5.48% 0.24% 18.52% 0.47% -0.62%(a) total Particlulates (unspecified) -13.51% 18.52% 0.00% -0.13% 0.00% -0.20% 0.01% 0.68% 0.01% -0.02%(a) Sulfur Oxides (SOx as SO2) -13.51% 18.52% -0.01% -0.20% 0.00% -1.41% 0.05% 4.74% 0.26% -0.35%Electricity -13.51% 18.52% -0.05% -2.55% 0.00% -2.05% -0.02% 6.56% 9.92% -13.69%total Non-Coal Energy -13.51% 18.52% -0.64% -2.90% 0.00% -31.94% 1.74% 109.04% 2.16% -2.89%ash - landfilled (dry) -13.51% 18.52% 0.00% 0.00% 0.00% 0.00% 0.00% 0.00% 38.89% 0.00%ash - total (dry) -13.51% 18.52% 0.00% 0.00% 0.00% 0.00% 0.00% 0.00% 0.00% 0.00%FGC waste (dry) - landfilled -13.51% 18.52% 0.00% 0.00% 0.00% 0.00% 0.00% 0.00% 0.00% 0.00%FGD waste (dry) - total -13.51% 18.52% 0.00% 0.00% 0.00% 0.00% 0.00% 0.00% 0.00% 0.00%Waste (hazardous) -13.51% 18.52% -0.06% -36.38% 0.00% -3.98% -3.26% 0.00% 0.01% 0.00%Waste (municipal and industrial) -13.51% 18.52% -0.18% -57.56% 0.00% -1.74% -1.43% 0.00% 0.02% 0.00%Waste (unspecified) -13.51% 18.52% 0.00% -0.63% 0.00% -0.05% -0.01% 0.13% 0.92% -1.27%Waste (total) -13.51% 18.52% 0.00% -0.19% 0.00% -0.01% 0.00% 0.02% 9.21% -0.23%
K L M N O P Q R S Tsurface surface surface surface surface surface surface surface surface surface
(r) Coal (in ground) (including losses) -0.06% -0.25% -0.01% 0.01% -0.01% 0.01% 0.00% 0.00% 0.00% 0.00%(r) Limestone (CaCO3, in ground) 0.00% 0.00% 0.00% 0.00% 0.00% 0.01% 0.00% 0.00% 0.00% 0.00%(r) Natural Gas (in ground) -0.57% -2.34% -0.19% 0.08% -0.08% 0.10% 0.01% 0.00% -0.01% -0.01%(r) Oil (in ground) -0.13% -0.29% -0.83% 0.03% -0.03% 0.01% 0.22% 0.00% -0.22% -0.22%(a) total Carbon Dioxide (CO2) -0.37% -1.52% -0.13% 0.01% -0.01% 0.01% 0.01% -0.03% -0.01% -0.08%(a) Carbon Monoxide (CO) -0.86% -3.36% -0.95% 0.04% -0.04% 0.00% 0.21% -0.46% -0.21% -1.15%(a) total Hydrocarbons (except CH4, including VOCs) -2.69% -10.95% -1.13% 0.30% -0.30% 0.36% 0.19% -0.25% -0.20% -0.71%(a) Methane (CH4) 0.00% -0.02% 0.00% 0.00% 0.00% 0.00% 0.00% -0.01% 0.00% -0.03%(a) Nitrogen Oxides (NOx as NO2) -0.37% -1.48% -0.18% 0.01% -0.01% 0.00% 0.04% -0.02% -0.04% -0.08%(a) total Particlulates (unspecified) -0.01% -0.04% -0.04% 0.00% 0.00% 0.01% 0.00% -0.01% 0.00% -0.01%(a) Sulfur Oxides (SOx as SO2) -0.20% -0.84% -0.06% 0.01% -0.01% 0.00% 0.00% -0.01% 0.00% -0.03%Electricity -7.80% -32.25% -0.80% 0.53% -0.53% -0.12% 0.01% 0.00% -0.01% -0.01%total Non-Coal Energy -1.70% -6.86% -0.90% 0.17% -0.17% 0.13% 0.15% 0.00% -0.15% -0.15%ash - landfilled (dry) -30.56% -30.56% 0.00% 0.00% 0.00% 0.00% 0.00% 0.00% 0.00% 0.00%ash - total (dry) 0.00% 0.00% 0.00% 0.00% 0.00% 0.00% 0.00% 0.00% 0.00% 0.00%FGC waste (dry) - landfilled 0.00% 0.00% 0.00% 0.00% 0.00% 0.00% 32.80% 0.00% -33.60% -33.60%FGD waste (dry) - total 0.00% 0.00% 0.00% 0.00% 0.00% 0.00% 0.00% 0.00% 0.00% 0.00%Waste (hazardous) -0.01% -0.01% -25.13% 3.95% -3.95% 35.24% 0.01% 0.00% -0.01% -0.01%Waste (municipal and industrial) -0.02% -0.02% -17.65% 12.55% -12.55% 94.45% 0.04% 0.00% -0.04% -0.04%Waste (unspecified) -0.72% -2.99% -0.20% 0.09% -0.09% 0.10% 0.00% 0.00% 0.00% 0.00%Waste (total) -7.24% -7.65% -0.06% 0.03% -0.03% 0.14% 19.23% 0.00% -19.69% -19.69%
SENSITIVITY CASE CASE LETTER SENSITIVITY CASE CASE LETTERIncrease plant efficiency by 5 points A ash is recovered & percent used in cement remains constant @ 42% K
Decrease plant efficiency by 5 points B 50% of plant ash is recovered & 100% of this is used in cement LPond versus landfilling of ash from power plant C Plant operating capacity factor = 85% M
Construction materials low case D Increase mining equipment materials by 50% NMining methane emissions using EIA average U.S. numbers E Decrease mining equipment materials by 50% O
Mine mouth F Decrease in recycle of materials by 1/3 PAverage user by land G No FGC recovery - 100% is landfilled Q
Farthest user H 100% of recovered FGC is used in asphalt RNo ash recovery - 100% of plant ash is landfilled I CG is recovered & percent used in asphalt remains constant @ 7.2% S
100% of recovered ash is used in cement J 50% of plant FCG is recovered & 100% of this is used in asphalt T
49
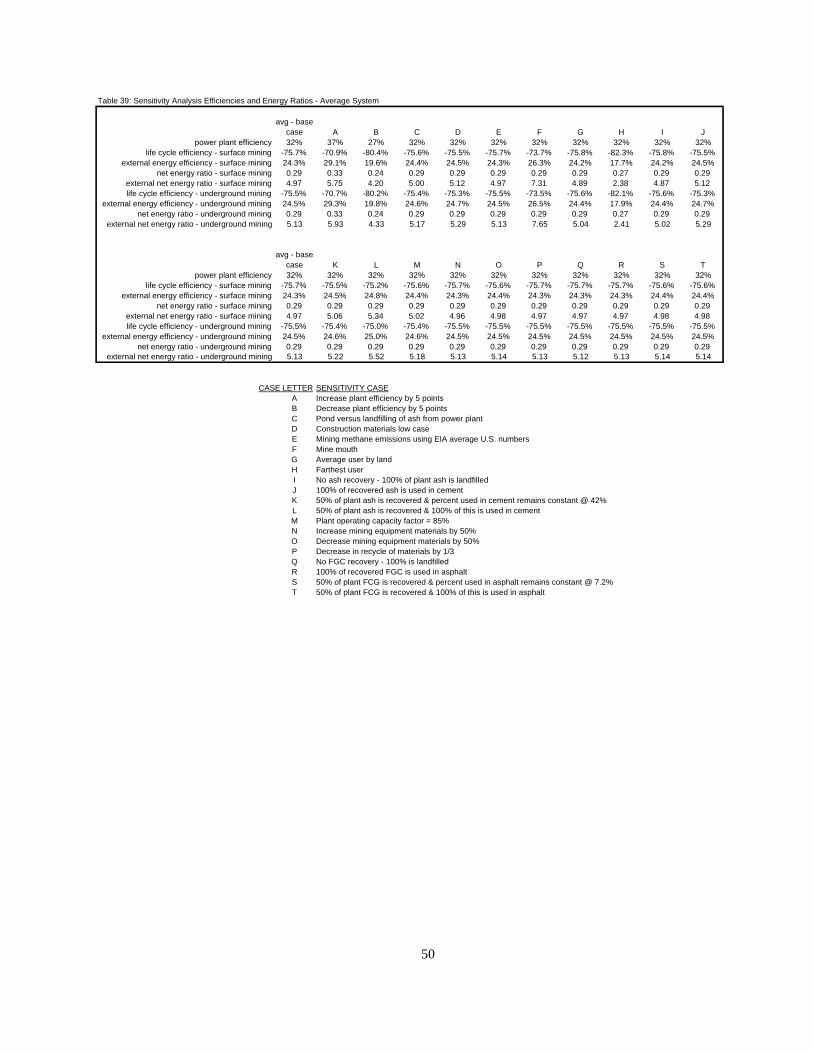
Table 39: Sensitivity Analysis Efficiencies and Energy Ratios - Average System
avg - base case A B C D E F G H I J
power plant efficiency 32% 37% 27% 32% 32% 32% 32% 32% 32% 32% 32%life cycle efficiency - surface mining -75.7% -70.9% -80.4% -75.6% -75.5% -75.7% -73.7% -75.8% -82.3% -75.8% -75.5%
external energy efficiency - surface mining 24.3% 29.1% 19.6% 24.4% 24.5% 24.3% 26.3% 24.2% 17.7% 24.2% 24.5%net energy ratio - surface mining 0.29 0.33 0.24 0.29 0.29 0.29 0.29 0.29 0.27 0.29 0.29
external net energy ratio - surface mining 4.97 5.75 4.20 5.00 5.12 4.97 7.31 4.89 2.38 4.87 5.12life cycle efficiency - underground mining -75.5% -70.7% -80.2% -75.4% -75.3% -75.5% -73.5% -75.6% -82.1% -75.6% -75.3%
external energy efficiency - underground mining 24.5% 29.3% 19.8% 24.6% 24.7% 24.5% 26.5% 24.4% 17.9% 24.4% 24.7%net energy ratio - underground mining 0.29 0.33 0.24 0.29 0.29 0.29 0.29 0.29 0.27 0.29 0.29
external net energy ratio - underground mining 5.13 5.93 4.33 5.17 5.29 5.13 7.65 5.04 2.41 5.02 5.29
avg - base case K L M N O P Q R S T
power plant efficiency 32% 32% 32% 32% 32% 32% 32% 32% 32% 32% 32%life cycle efficiency - surface mining -75.7% -75.5% -75.2% -75.6% -75.7% -75.6% -75.7% -75.7% -75.7% -75.6% -75.6%
external energy efficiency - surface mining 24.3% 24.5% 24.8% 24.4% 24.3% 24.4% 24.3% 24.3% 24.3% 24.4% 24.4%net energy ratio - surface mining 0.29 0.29 0.29 0.29 0.29 0.29 0.29 0.29 0.29 0.29 0.29
external net energy ratio - surface mining 4.97 5.06 5.34 5.02 4.96 4.98 4.97 4.97 4.97 4.98 4.98life cycle efficiency - underground mining -75.5% -75.4% -75.0% -75.4% -75.5% -75.5% -75.5% -75.5% -75.5% -75.5% -75.5%
external energy efficiency - underground mining 24.5% 24.6% 25.0% 24.6% 24.5% 24.5% 24.5% 24.5% 24.5% 24.5% 24.5%net energy ratio - underground mining 0.29 0.29 0.29 0.29 0.29 0.29 0.29 0.29 0.29 0.29 0.29
external net energy ratio - underground mining 5.13 5.22 5.52 5.18 5.13 5.14 5.13 5.12 5.13 5.14 5.14
CASE LETTER SENSITIVITY CASEA Increase plant efficiency by 5 pointsB Decrease plant efficiency by 5 pointsC Pond versus landfilling of ash from power plantD Construction materials low caseE Mining methane emissions using EIA average U.S. numbersF Mine mouthG Average user by landH Farthest userI No ash recovery - 100% of plant ash is landfilledJ 100% of recovered ash is used in cementK 50% of plant ash is recovered & percent used in cement remains constant @ 42%L 50% of plant ash is recovered & 100% of this is used in cementM Plant operating capacity factor = 85%N Increase mining equipment materials by 50%O Decrease mining equipment materials by 50%P Decrease in recycle of materials by 1/3Q No FGC recovery - 100% is landfilledR 100% of recovered FGC is used in asphaltS 50% of plant FCG is recovered & percent used in asphalt remains constant @ 7.2%T 50% of plant FCG is recovered & 100% of this is used in asphalt
50
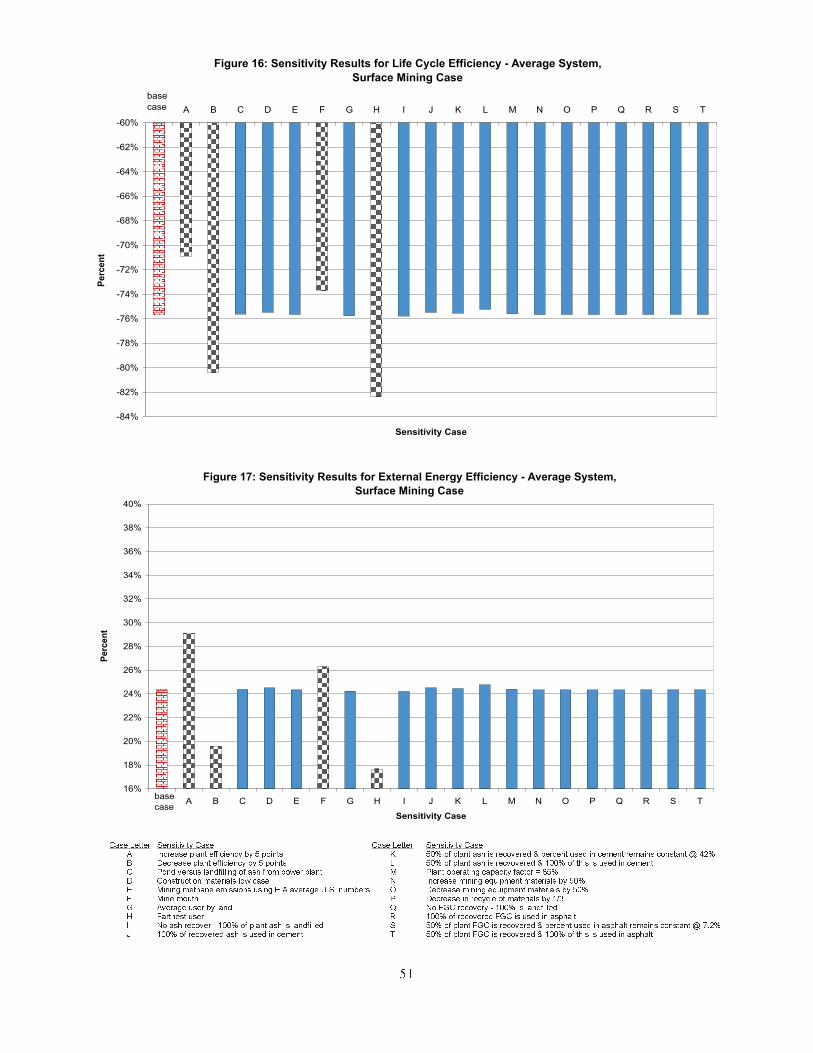
Figure 16: Sensitivity Results for Life Cycle Efficiency - Average System,
Surface Mining Case
-84%
-82%
-80%
-78%
-76%
-74%
-72%
-70%
-68%
-66%
-64%
-62%
-60%
A B C D E F G H I J K L M N O P Q R S T
Sensitivity Case
Pe
rce
nt
base
case
Figure 17: Sensitivity Results for External Energy Efficiency - Average System,
Surface Mining Case
16%
18%
20%
22%
24%
26%
28%
30%
32%
34%
36%
38%
40%
A B C D E F G H I J K L M N O P Q R S T
Sensitivity Case
Pe
rce
nt
base
case
Case Letter Case LetterSensitivity Case Sensitivity CaseA Increase plant efficiency by 5 points K 50% of plant ash is recovered & percent used in cement remains constant @ 42%B Decrease plant efficiency by 5 points L 50% of plant ash is recvovered & 100% of this is used in cementC Pond versus landfilling of ash from power plant M Plant operating capacity factor = 85%D Construction materials low case N Increase mining equipment materials by 50%E Mining methane emissions using EIA average U.S. numbers O Decrease mining equipment materials by 50%F Mine mouth P Decrease in recycle of materials by 1/3G Average user by land Q No FGC recovery - 100% is landfilledH Farthest user R 100% of recovered FGC is used in asphaltI No ash recover - 100% of plant ash is landfilled S 50% of plant FGC is recovered & percent used in asphalt remains constant @ 7.2%J 100% of recovered ash is used in cement T 50% of plant FGC is recovered & 100% of this is used in asphalt
51
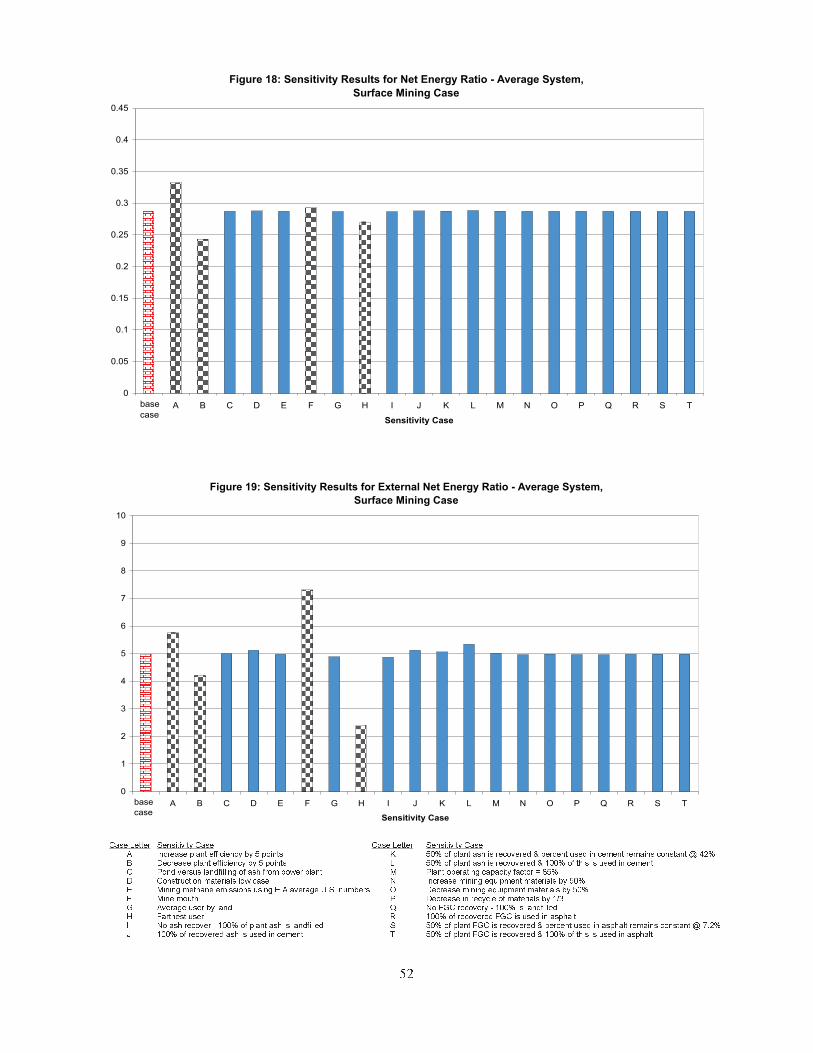
Figure 18: Sensitivity Results for Net Energy Ratio - Average System,
Surface Mining Case
0
0.05
0.1
0.15
0.2
0.25
0.3
0.35
0.4
0.45
A B C D E F G H I J K L M N O P Q R S T
Sensitivity Case
base
case
Figure 19: Sensitivity Results for External Net Energy Ratio - Average System,
Surface Mining Case
0
1
2
3
4
5
6
7
8
9
10
A B C D E F G H I J K L M N O P Q R S T
Sensitivity Case
base
case
Case Letter Case LetterSensitivity Case Sensitivity CaseA Increase plant efficiency by 5 points K 50% of plant ash is recovered & percent used in cement remains constant @ 42%B Decrease plant efficiency by 5 points L 50% of plant ash is recvovered & 100% of this is used in cementC Pond versus landfilling of ash from power plant M Plant operating capacity factor = 85%D Construction materials low case N Increase mining equipment materials by 50%E Mining methane emissions using EIA average U.S. numbers O Decrease mining equipment materials by 50%F Mine mouth P Decrease in recycle of materials by 1/3G Average user by land Q No FGC recovery - 100% is landfilledH Farthest user R 100% of recovered FGC is used in asphaltI No ash recover - 100% of plant ash is landfilled S 50% of plant FGC is recovered & percent used in asphalt remains constant @ 7.2%J 100% of recovered ash is used in cement T 50% of plant FGC is recovered & 100% of this is used in asphalt
52
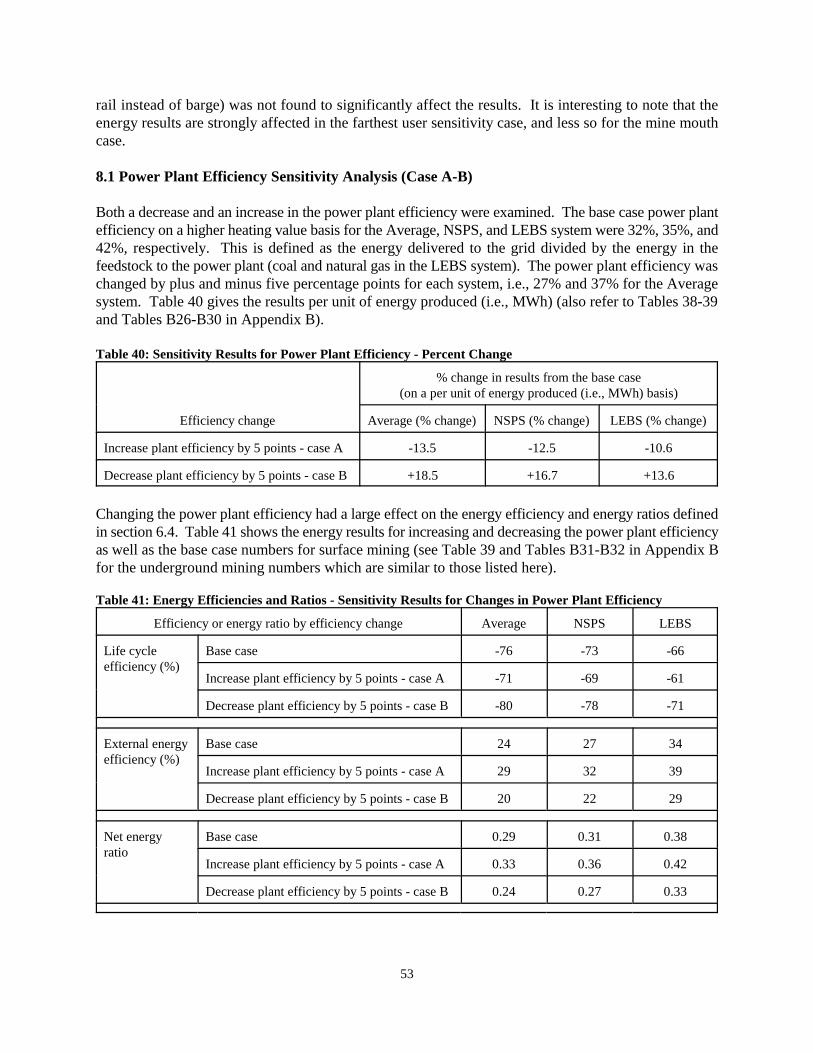
53
rail instead of barge) was not found to significantly affect the results. It is interesting to note that theenergy results are strongly affected in the farthest user sensitivity case, and less so for the mine mouthcase.
8.1 Power Plant Efficiency Sensitivity Analysis (Case A-B)
Both a decrease and an increase in the power plant efficiency were examined. The base case power plantefficiency on a higher heating value basis for the Average, NSPS, and LEBS system were 32%, 35%, and42%, respectively. This is defined as the energy delivered to the grid divided by the energy in thefeedstock to the power plant (coal and natural gas in the LEBS system). The power plant efficiency waschanged by plus and minus five percentage points for each system, i.e., 27% and 37% for the Averagesystem. Table 40 gives the results per unit of energy produced (i.e., MWh) (also refer to Tables 38-39and Tables B26-B30 in Appendix B).
Table 40: Sensitivity Results for Power Plant Efficiency - Percent Change
Efficiency change
% change in results from the base case(on a per unit of energy produced (i.e., MWh) basis)
Average (% change) NSPS (% change) LEBS (% change)
Increase plant efficiency by 5 points - case A -13.5 -12.5 -10.6
Decrease plant efficiency by 5 points - case B +18.5 +16.7 +13.6
Changing the power plant efficiency had a large effect on the energy efficiency and energy ratios definedin section 6.4. Table 41 shows the energy results for increasing and decreasing the power plant efficiencyas well as the base case numbers for surface mining (see Table 39 and Tables B31-B32 in Appendix Bfor the underground mining numbers which are similar to those listed here).
Table 41: Energy Efficiencies and Ratios - Sensitivity Results for Changes in Power Plant Efficiency
Efficiency or energy ratio by efficiency change Average NSPS LEBS
Life cycleefficiency (%)
Base case -76 -73 -66
Increase plant efficiency by 5 points - case A -71 -69 -61
Decrease plant efficiency by 5 points - case B -80 -78 -71
External energyefficiency (%)
Base case 24 27 34
Increase plant efficiency by 5 points - case A 29 32 39
Decrease plant efficiency by 5 points - case B 20 22 29
Net energyratio
Base case 0.29 0.31 0.38
Increase plant efficiency by 5 points - case A 0.33 0.36 0.42
Decrease plant efficiency by 5 points - case B 0.24 0.27 0.33
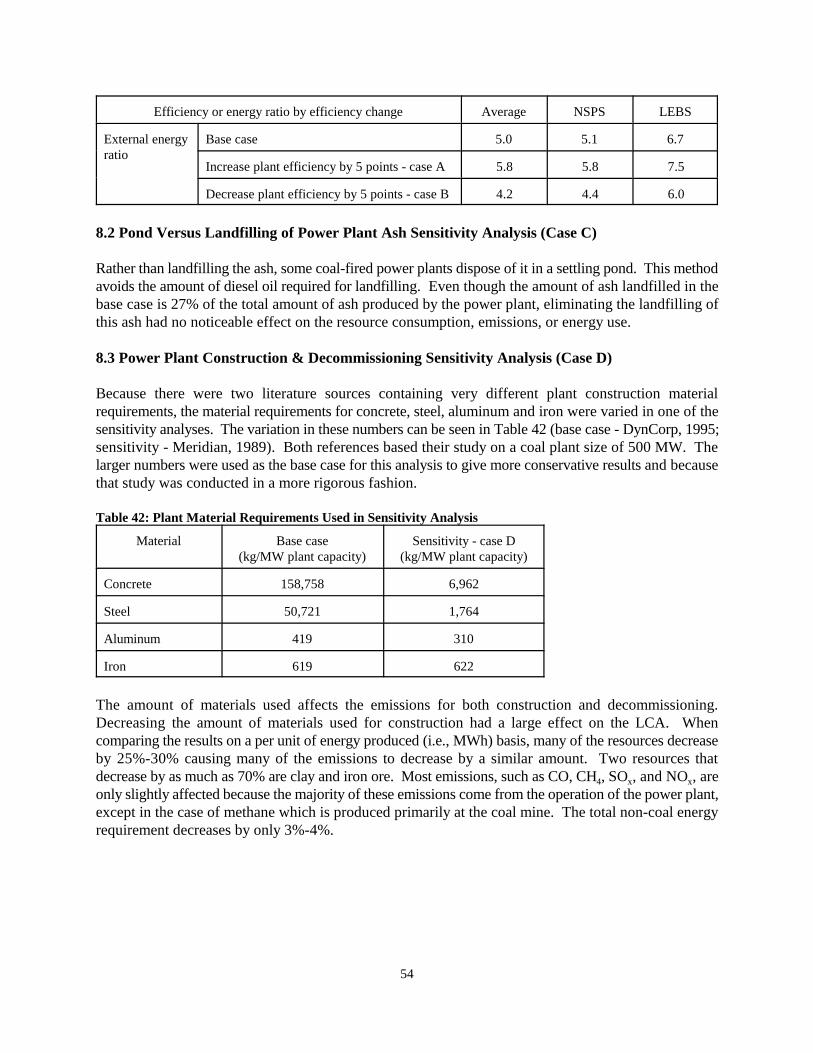
Efficiency or energy ratio by efficiency change Average NSPS LEBS
54
External energyratio
Base case 5.0 5.1 6.7
Increase plant efficiency by 5 points - case A 5.8 5.8 7.5
Decrease plant efficiency by 5 points - case B 4.2 4.4 6.0
8.2 Pond Versus Landfilling of Power Plant Ash Sensitivity Analysis (Case C)
Rather than landfilling the ash, some coal-fired power plants dispose of it in a settling pond. This methodavoids the amount of diesel oil required for landfilling. Even though the amount of ash landfilled in thebase case is 27% of the total amount of ash produced by the power plant, eliminating the landfilling ofthis ash had no noticeable effect on the resource consumption, emissions, or energy use.
8.3 Power Plant Construction & Decommissioning Sensitivity Analysis (Case D)
Because there were two literature sources containing very different plant construction materialrequirements, the material requirements for concrete, steel, aluminum and iron were varied in one of thesensitivity analyses. The variation in these numbers can be seen in Table 42 (base case - DynCorp, 1995;sensitivity - Meridian, 1989). Both references based their study on a coal plant size of 500 MW. Thelarger numbers were used as the base case for this analysis to give more conservative results and becausethat study was conducted in a more rigorous fashion.
Table 42: Plant Material Requirements Used in Sensitivity Analysis
Material Base case(kg/MW plant capacity)
Sensitivity - case D(kg/MW plant capacity)
Concrete 158,758 6,962
Steel 50,721 1,764
Aluminum 419 310
Iron 619 622
The amount of materials used affects the emissions for both construction and decommissioning.Decreasing the amount of materials used for construction had a large effect on the LCA. Whencomparing the results on a per unit of energy produced (i.e., MWh) basis, many of the resources decreaseby 25%-30% causing many of the emissions to decrease by a similar amount. Two resources thatdecrease by as much as 70% are clay and iron ore. Most emissions, such as CO, CH , SO , and NO , are4 x x
only slightly affected because the majority of these emissions come from the operation of the power plant,except in the case of methane which is produced primarily at the coal mine. The total non-coal energyrequirement decreases by only 3%-4%.
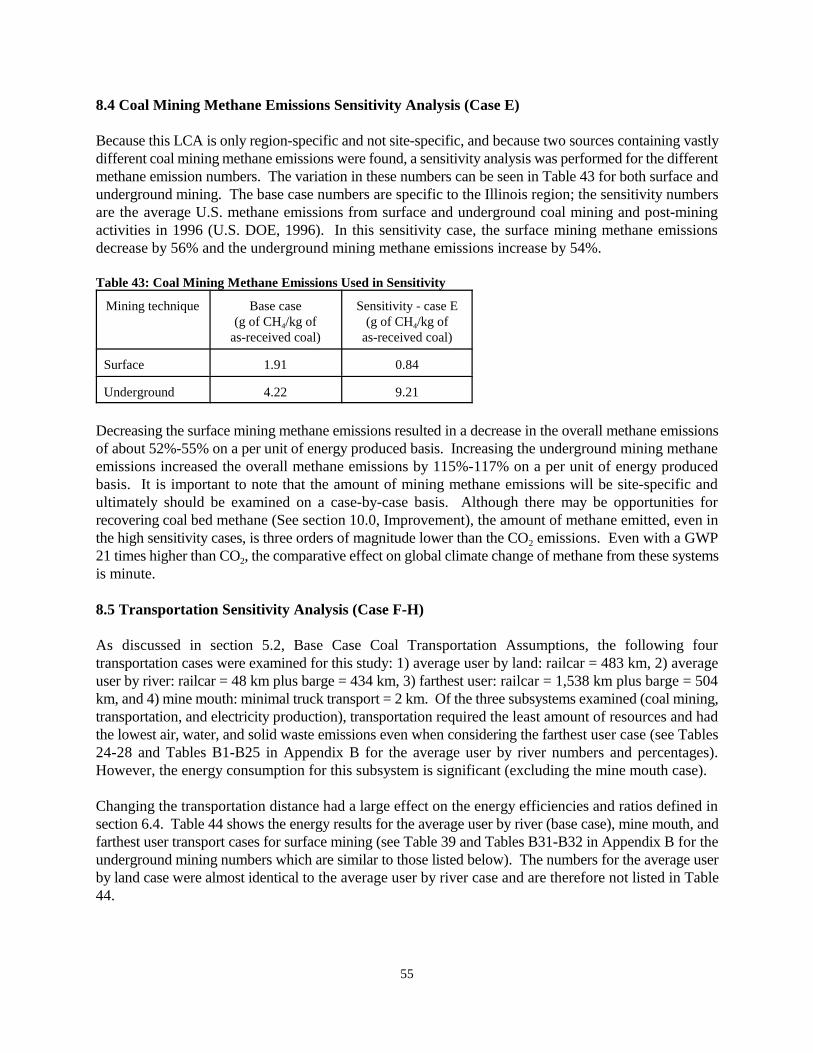
55
8.4 Coal Mining Methane Emissions Sensitivity Analysis (Case E)
Because this LCA is only region-specific and not site-specific, and because two sources containing vastlydifferent coal mining methane emissions were found, a sensitivity analysis was performed for the differentmethane emission numbers. The variation in these numbers can be seen in Table 43 for both surface andunderground mining. The base case numbers are specific to the Illinois region; the sensitivity numbersare the average U.S. methane emissions from surface and underground coal mining and post-miningactivities in 1996 (U.S. DOE, 1996). In this sensitivity case, the surface mining methane emissionsdecrease by 56% and the underground mining methane emissions increase by 54%.
Table 43: Coal Mining Methane Emissions Used in Sensitivity
Mining technique Base case(g of CH /kg of4
as-received coal)
Sensitivity - case E(g of CH /kg of4
as-received coal)
Surface 1.91 0.84
Underground 4.22 9.21
Decreasing the surface mining methane emissions resulted in a decrease in the overall methane emissionsof about 52%-55% on a per unit of energy produced basis. Increasing the underground mining methaneemissions increased the overall methane emissions by 115%-117% on a per unit of energy producedbasis. It is important to note that the amount of mining methane emissions will be site-specific andultimately should be examined on a case-by-case basis. Although there may be opportunities forrecovering coal bed methane (See section 10.0, Improvement), the amount of methane emitted, even inthe high sensitivity cases, is three orders of magnitude lower than the CO emissions. Even with a GWP2
21 times higher than CO , the comparative effect on global climate change of methane from these systems2
is minute.
8.5 Transportation Sensitivity Analysis (Case F-H)
As discussed in section 5.2, Base Case Coal Transportation Assumptions, the following fourtransportation cases were examined for this study: 1) average user by land: railcar = 483 km, 2) averageuser by river: railcar = 48 km plus barge = 434 km, 3) farthest user: railcar = 1,538 km plus barge = 504km, and 4) mine mouth: minimal truck transport = 2 km. Of the three subsystems examined (coal mining,transportation, and electricity production), transportation required the least amount of resources and hadthe lowest air, water, and solid waste emissions even when considering the farthest user case (see Tables24-28 and Tables B1-B25 in Appendix B for the average user by river numbers and percentages).However, the energy consumption for this subsystem is significant (excluding the mine mouth case).
Changing the transportation distance had a large effect on the energy efficiencies and ratios defined insection 6.4. Table 44 shows the energy results for the average user by river (base case), mine mouth, andfarthest user transport cases for surface mining (see Table 39 and Tables B31-B32 in Appendix B for theunderground mining numbers which are similar to those listed below). The numbers for the average userby land case were almost identical to the average user by river case and are therefore not listed in Table44.
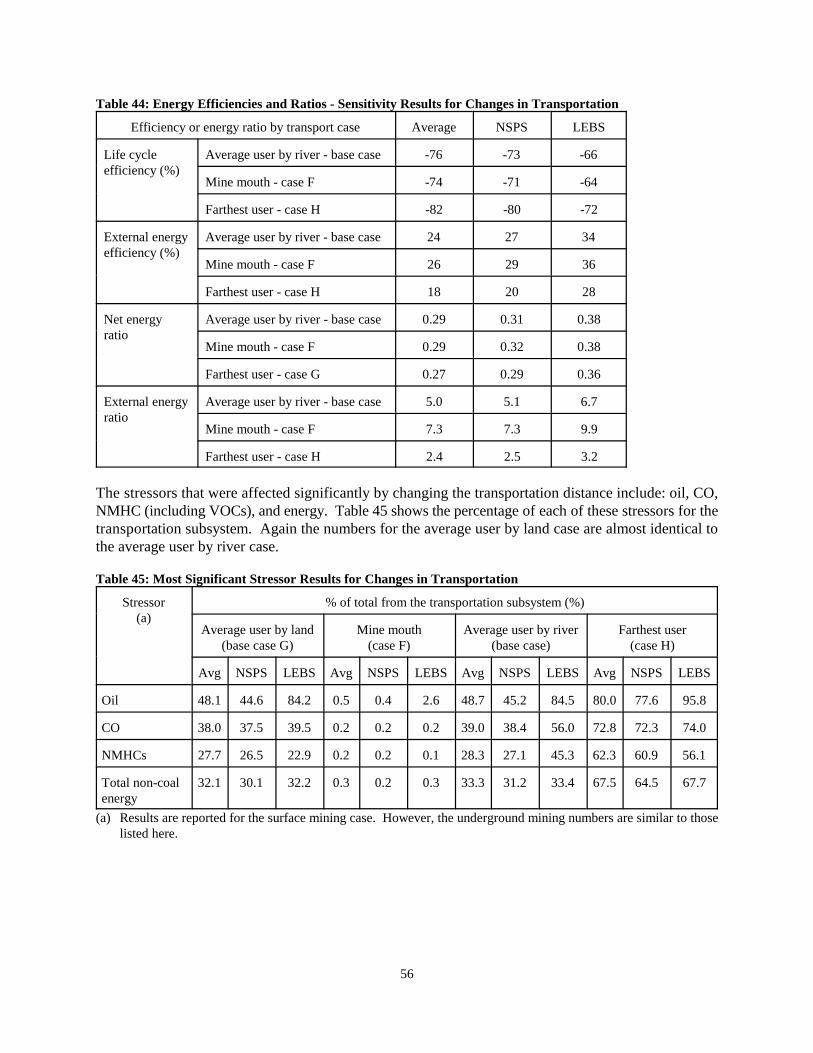
56
Table 44: Energy Efficiencies and Ratios - Sensitivity Results for Changes in Transportation
Efficiency or energy ratio by transport case Average NSPS LEBS
Life cycleefficiency (%)
Average user by river - base case -76 -73 -66
Mine mouth - case F -74 -71 -64
Farthest user - case H -82 -80 -72
External energyefficiency (%)
Average user by river - base case 24 27 34
Mine mouth - case F 26 29 36
Farthest user - case H 18 20 28
Net energyratio
Average user by river - base case 0.29 0.31 0.38
Mine mouth - case F 0.29 0.32 0.38
Farthest user - case G 0.27 0.29 0.36
External energyratio
Average user by river - base case 5.0 5.1 6.7
Mine mouth - case F 7.3 7.3 9.9
Farthest user - case H 2.4 2.5 3.2
The stressors that were affected significantly by changing the transportation distance include: oil, CO,NMHC (including VOCs), and energy. Table 45 shows the percentage of each of these stressors for thetransportation subsystem. Again the numbers for the average user by land case are almost identical tothe average user by river case.
Table 45: Most Significant Stressor Results for Changes in Transportation
Stressor(a)
% of total from the transportation subsystem (%)
Average user by land(base case G)
Mine mouth(case F)
Average user by river(base case)
Farthest user(case H)
Avg NSPS LEBS Avg NSPS LEBS Avg NSPS LEBS Avg NSPS LEBS
Oil 48.1 44.6 84.2 0.5 0.4 2.6 48.7 45.2 84.5 80.0 77.6 95.8
CO 38.0 37.5 39.5 0.2 0.2 0.2 39.0 38.4 56.0 72.8 72.3 74.0
NMHCs 27.7 26.5 22.9 0.2 0.2 0.1 28.3 27.1 45.3 62.3 60.9 56.1
Total non-coalenergy
32.1 30.1 32.2 0.3 0.2 0.3 33.3 31.2 33.4 67.5 64.5 67.7
(a) Results are reported for the surface mining case. However, the underground mining numbers are similar to thoselisted here.
57
8.5.1 Mine Mouth Case (Case F)
For mine mouth operation, all stressors that result from transportation are minimal. Overall, anyindividual stressor for this subsystem amounts to less than 3.5% of the total over the life of the system,with the majority around 0.1%. When examining differences between the average user by river transportcase and having to transport the coal only a minimal distance, the only resource that decreasessignificantly is oil: -48%, -44% , and -84% for the Average, NSPS, and LEBS system, respectively. Twoair emissions that are reduced considerably are CO and total hydrocarbons (including VOCs, butexcluding CH4). For each of the three power plant systems, the CO decreases by about 38% and theNMHCs by 23%-30%. Also, the non-coal energy consumption decreases by 30%-32% for each powerplant system (Average, NSPS, and LEBS). For percentages and percent changes in the previouslymentioned stressors see Table 45 and Table 38, respectively (also see Tables B26-B30 in Appendix B).
8.5.2 Average User By Land (Case G)
The stressors for the average user by land case are almost identical to the those from the average user byriver case. The amount of oil consumed by transportation in each case represents 45%- 48% of the totalover the life of the system for both the Average and NSPS systems and 84% for the LEBS system (seeTable 45). Of the total non-coal energy consumed by the system, the percent used in transportation wasabout 33% for both of these transportation cases for all three power plant systems (Average, NSPS, andLEBS) (see Table 45). The majority of any single air or water emission from these two transportationcases makes up only 4%-8% of the total system air or water emissions.
8.5.3 Farthest User (Case H)
As expected, the resources, emissions, and energy use due to transportation are highest for the farthestuser case. Oil consumption was about 80% of the system total averaged over the life of the system forthe Average and NSPS systems, and 95% for the LEBS system. Of the total non-coal energy consumedby the system, transportation accounted for approximately 67% in all three power plant systems (Average,NSPS, and LEBS) (see Table 45). When examining differences between farthest user and average userby river transport cases, the stressors that change significantly are oil consumption, CO, totalhydrocarbons (except CH4, including VOCs), and energy consumption. Oil increases by 159%, 148%, and 278% for the Average, NSPS, and LEBS system, respectively. The two air emissions increase byabout 128% for CO and 92% for the NMHCs. The non-coal energy consumption decreases by 102%-110% for each of the three power plant systems. For percentages and percent changes in the previouslymentioned stressors see Table 45 and Table 38, respectively (also see Tables B26-B30 in Appendix B).
8.6 Flue Gas Clean-up Waste & Ash Recovery and Disposal Sensitivity Analysis(Cases I-L & Q-T)
The base case numbers for FGC waste and ash recovery are based on U.S. averages. However, in general,the amount of either waste recovered and its end use will be site-specific and will depend on thecomposition of the waste. For example, the composition of fly ash varies greatly depending on thecomposition and volatility of the coal as well as the type of boiler at the plant (Ecobalance, Inc., 1997).Therefore, to determine the effects of these two variables on the results, the percentage of FGC wasterecovered and the amount of recovered material credited to asphalt production were varied. Thepercentage of ash recovered and the amount of recovered material credited to cement production were
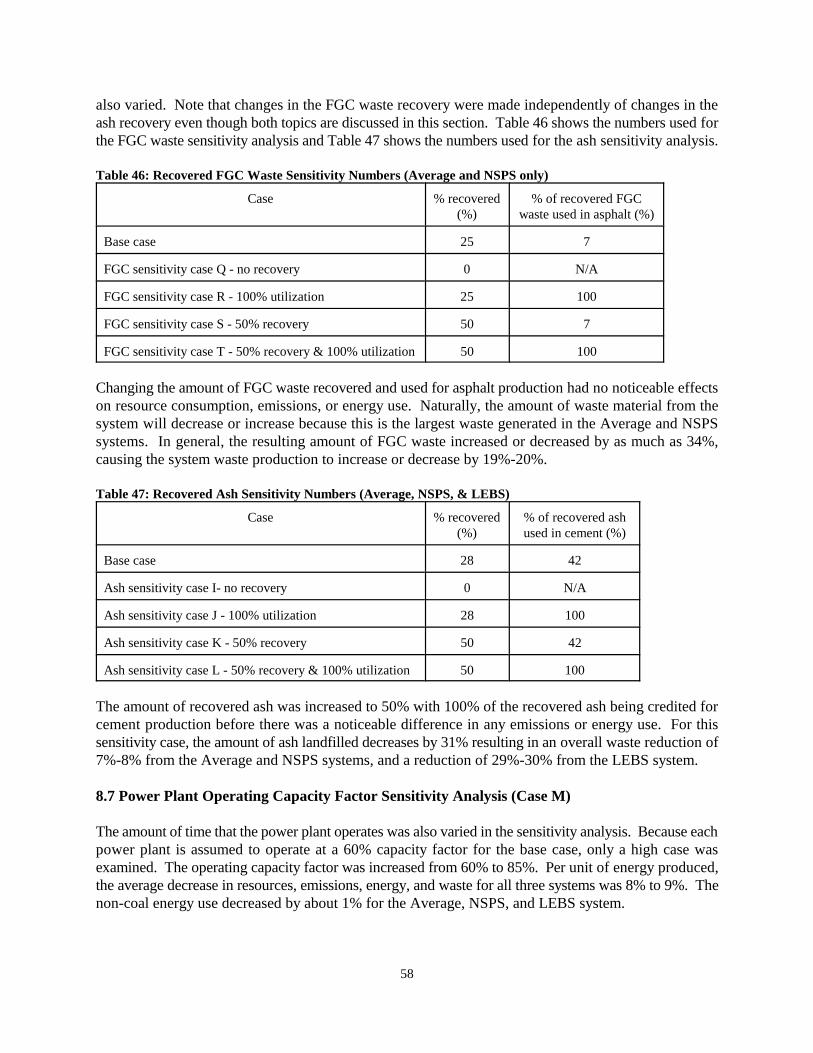
58
also varied. Note that changes in the FGC waste recovery were made independently of changes in theash recovery even though both topics are discussed in this section. Table 46 shows the numbers used forthe FGC waste sensitivity analysis and Table 47 shows the numbers used for the ash sensitivity analysis.
Table 46: Recovered FGC Waste Sensitivity Numbers (Average and NSPS only)
Case % recovered(%)
% of recovered FGCwaste used in asphalt (%)
Base case 25 7
FGC sensitivity case Q - no recovery 0 N/A
FGC sensitivity case R - 100% utilization 25 100
FGC sensitivity case S - 50% recovery 50 7
FGC sensitivity case T - 50% recovery & 100% utilization 50 100
Changing the amount of FGC waste recovered and used for asphalt production had no noticeable effectson resource consumption, emissions, or energy use. Naturally, the amount of waste material from thesystem will decrease or increase because this is the largest waste generated in the Average and NSPSsystems. In general, the resulting amount of FGC waste increased or decreased by as much as 34%,causing the system waste production to increase or decrease by 19%-20%.
Table 47: Recovered Ash Sensitivity Numbers (Average, NSPS, & LEBS)
Case % recovered(%)
% of recovered ashused in cement (%)
Base case 28 42
Ash sensitivity case I- no recovery 0 N/A
Ash sensitivity case J - 100% utilization 28 100
Ash sensitivity case K - 50% recovery 50 42
Ash sensitivity case L - 50% recovery & 100% utilization 50 100
The amount of recovered ash was increased to 50% with 100% of the recovered ash being credited forcement production before there was a noticeable difference in any emissions or energy use. For thissensitivity case, the amount of ash landfilled decreases by 31% resulting in an overall waste reduction of7%-8% from the Average and NSPS systems, and a reduction of 29%-30% from the LEBS system.
8.7 Power Plant Operating Capacity Factor Sensitivity Analysis (Case M)
The amount of time that the power plant operates was also varied in the sensitivity analysis. Because eachpower plant is assumed to operate at a 60% capacity factor for the base case, only a high case wasexamined. The operating capacity factor was increased from 60% to 85%. Per unit of energy produced,the average decrease in resources, emissions, energy, and waste for all three systems was 8% to 9%. Thenon-coal energy use decreased by about 1% for the Average, NSPS, and LEBS system.
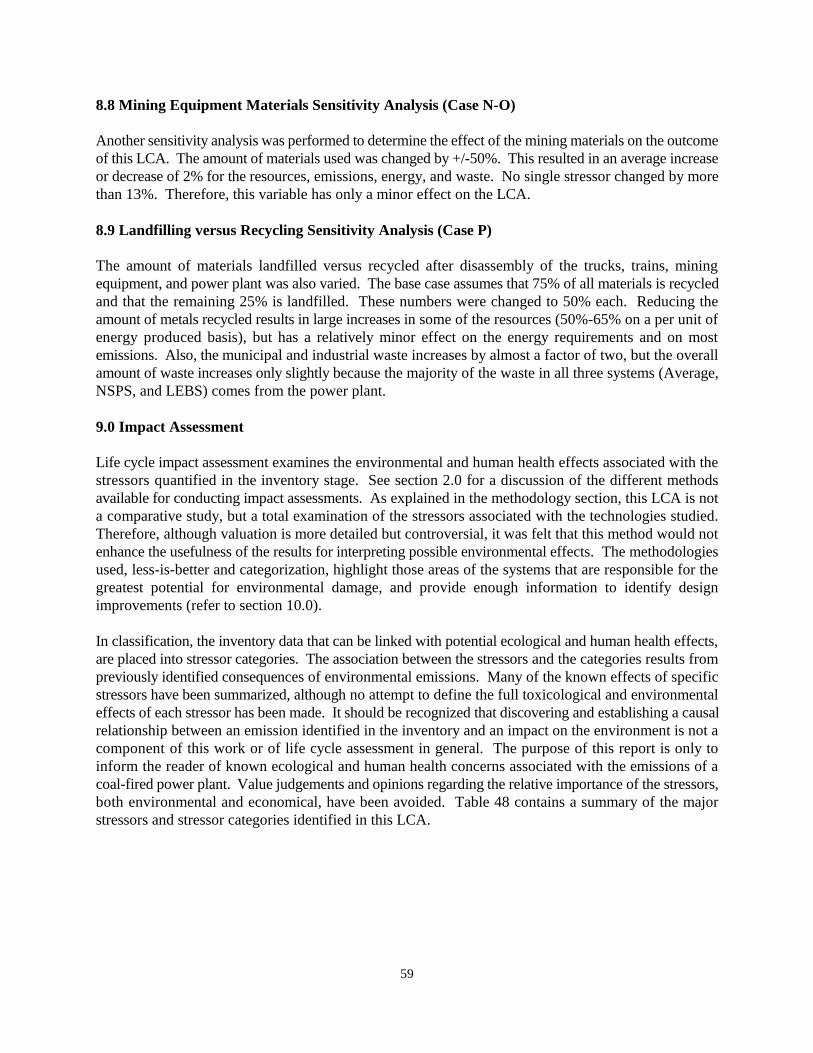
59
8.8 Mining Equipment Materials Sensitivity Analysis (Case N-O)
Another sensitivity analysis was performed to determine the effect of the mining materials on the outcomeof this LCA. The amount of materials used was changed by +/-50%. This resulted in an average increaseor decrease of 2% for the resources, emissions, energy, and waste. No single stressor changed by morethan 13%. Therefore, this variable has only a minor effect on the LCA.
8.9 Landfilling versus Recycling Sensitivity Analysis (Case P)
The amount of materials landfilled versus recycled after disassembly of the trucks, trains, miningequipment, and power plant was also varied. The base case assumes that 75% of all materials is recycledand that the remaining 25% is landfilled. These numbers were changed to 50% each. Reducing theamount of metals recycled results in large increases in some of the resources (50%-65% on a per unit ofenergy produced basis), but has a relatively minor effect on the energy requirements and on mostemissions. Also, the municipal and industrial waste increases by almost a factor of two, but the overallamount of waste increases only slightly because the majority of the waste in all three systems (Average,NSPS, and LEBS) comes from the power plant.
9.0 Impact Assessment
Life cycle impact assessment examines the environmental and human health effects associated with thestressors quantified in the inventory stage. See section 2.0 for a discussion of the different methodsavailable for conducting impact assessments. As explained in the methodology section, this LCA is nota comparative study, but a total examination of the stressors associated with the technologies studied.Therefore, although valuation is more detailed but controversial, it was felt that this method would notenhance the usefulness of the results for interpreting possible environmental effects. The methodologiesused, less-is-better and categorization, highlight those areas of the systems that are responsible for thegreatest potential for environmental damage, and provide enough information to identify designimprovements (refer to section 10.0).
In classification, the inventory data that can be linked with potential ecological and human health effects,are placed into stressor categories. The association between the stressors and the categories results frompreviously identified consequences of environmental emissions. Many of the known effects of specificstressors have been summarized, although no attempt to define the full toxicological and environmentaleffects of each stressor has been made. It should be recognized that discovering and establishing a causalrelationship between an emission identified in the inventory and an impact on the environment is not acomponent of this work or of life cycle assessment in general. The purpose of this report is only toinform the reader of known ecological and human health concerns associated with the emissions of acoal-fired power plant. Value judgements and opinions regarding the relative importance of the stressors,both environmental and economical, have been avoided. Table 48 contains a summary of the majorstressors and stressor categories identified in this LCA.
60
Table 48: Impacts Associated with Stressor Categories
Stressor categories Stressors Major impactcategory (a)
Areaimpacted (b)
Major Minor
Ozone depletioncompounds
Cl atom, NO, OH radical,H atom, CFCs
H, E R, G
Climate change Greenhouse gases CO , CH , N O, CFCs, O ,2 4 2 3
CO and NO (indirectly), waterx
vapor
H, E R, G
Particulates H, E L, R
Contributors to smog Photochemical NO , O , VOCsx 3 H, E L, R
London Particulates, SO2 H, E L, R
Acidificationprecursors
SO (H SO , H SO ),2 2 4 2 3
NO (HNO ), CO (HCO ),x 3 2 3-
F (HF), CL (HCl)- -
H, E L, R
Contributors tocorrosion
NH , NH salts, SO , H S, O ,3 4 2 2 3+
O , H O, Cl, HCl, CL salts,2 2-
alkali metals
E L
Radionuclides Radon H L
Trace elements Sb, Ar, Be, B, Cd, Cr, Co, Cu,Pb, Mn, Hg, Mo, Ni, Se, V
H, E L
Other stressors withtoxic effects
NMHCs, CN- H, E L
(a) H = human health, E = ecological health.(b) L= local (county), R = regional (state), G = global.
9.1 Discussion of Stressor Categories
In this section, the stressor categories into which various emissions were placed are discussed. The orderin which the information is arranged does not imply that one stressor category is more important than anyother.
9.1.1 Atmospheric Concerns
The earth’s atmosphere is unique, as far as we know, in that its composition and structure make it capableof supporting life. The four major components of the atmosphere are nitrogen, oxygen, argon, and carbondioxide. The atmosphere consists of four main regions based upon temperature variations. Thetroposphere is the region closest to the earth’s surface. In this region, temperature decreases with altitude.At the tropopause the temperature scheme reverses so that within the next region, the stratosphere, thetemperature increases with altitude. The mesosphere lies above the stratosphere, and the thermospherelies above the mesosphere.
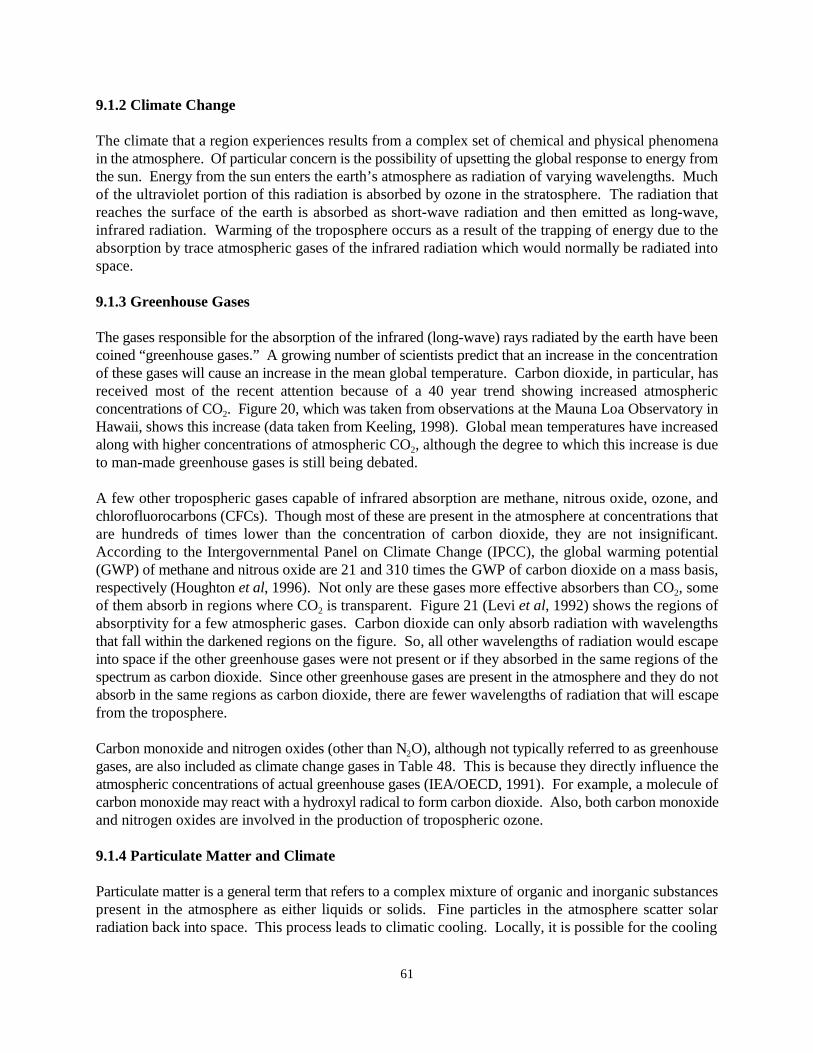
61
9.1.2 Climate Change
The climate that a region experiences results from a complex set of chemical and physical phenomenain the atmosphere. Of particular concern is the possibility of upsetting the global response to energy fromthe sun. Energy from the sun enters the earth’s atmosphere as radiation of varying wavelengths. Muchof the ultraviolet portion of this radiation is absorbed by ozone in the stratosphere. The radiation thatreaches the surface of the earth is absorbed as short-wave radiation and then emitted as long-wave,infrared radiation. Warming of the troposphere occurs as a result of the trapping of energy due to theabsorption by trace atmospheric gases of the infrared radiation which would normally be radiated intospace.
9.1.3 Greenhouse Gases
The gases responsible for the absorption of the infrared (long-wave) rays radiated by the earth have beencoined “greenhouse gases.” A growing number of scientists predict that an increase in the concentrationof these gases will cause an increase in the mean global temperature. Carbon dioxide, in particular, hasreceived most of the recent attention because of a 40 year trend showing increased atmosphericconcentrations of CO . Figure 20, which was taken from observations at the Mauna Loa Observatory in2
Hawaii, shows this increase (data taken from Keeling, 1998). Global mean temperatures have increasedalong with higher concentrations of atmospheric CO , although the degree to which this increase is due2
to man-made greenhouse gases is still being debated.
A few other tropospheric gases capable of infrared absorption are methane, nitrous oxide, ozone, andchlorofluorocarbons (CFCs). Though most of these are present in the atmosphere at concentrations thatare hundreds of times lower than the concentration of carbon dioxide, they are not insignificant.According to the Intergovernmental Panel on Climate Change (IPCC), the global warming potential(GWP) of methane and nitrous oxide are 21 and 310 times the GWP of carbon dioxide on a mass basis,respectively (Houghton et al, 1996). Not only are these gases more effective absorbers than CO , some2
of them absorb in regions where CO is transparent. Figure 21 (Levi et al, 1992) shows the regions of2
absorptivity for a few atmospheric gases. Carbon dioxide can only absorb radiation with wavelengthsthat fall within the darkened regions on the figure. So, all other wavelengths of radiation would escapeinto space if the other greenhouse gases were not present or if they absorbed in the same regions of thespectrum as carbon dioxide. Since other greenhouse gases are present in the atmosphere and they do notabsorb in the same regions as carbon dioxide, there are fewer wavelengths of radiation that will escapefrom the troposphere.
Carbon monoxide and nitrogen oxides (other than N O), although not typically referred to as greenhouse2
gases, are also included as climate change gases in Table 48. This is because they directly influence theatmospheric concentrations of actual greenhouse gases (IEA/OECD, 1991). For example, a molecule ofcarbon monoxide may react with a hydroxyl radical to form carbon dioxide. Also, both carbon monoxideand nitrogen oxides are involved in the production of tropospheric ozone.
9.1.4 Particulate Matter and Climate
Particulate matter is a general term that refers to a complex mixture of organic and inorganic substancespresent in the atmosphere as either liquids or solids. Fine particles in the atmosphere scatter solarradiation back into space. This process leads to climatic cooling. Locally, it is possible for the cooling
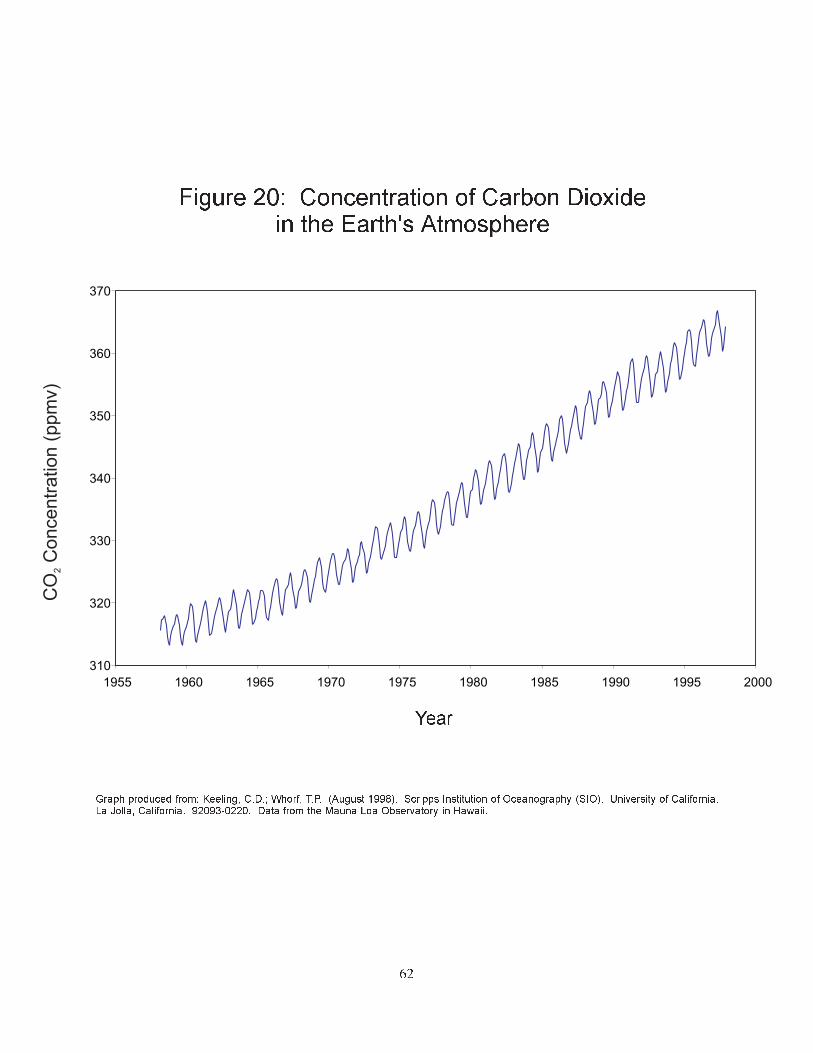
Figure 20: Concentration of Carbon Dioxidein the Earth's Atmosphere
310
320
330
340
350
360
370
1955 1960 1965 1970 1975 1980 1985 1990 1995 2000
Year
2
Graph produced from: Keeling, C.D.; Whorf, T.P. (August 1998). Scripps Institution of Oceanography (SIO). University of California.La Jolla, California. 92093-0220. Data from the Mauna Loa Observatory in Hawaii.
62
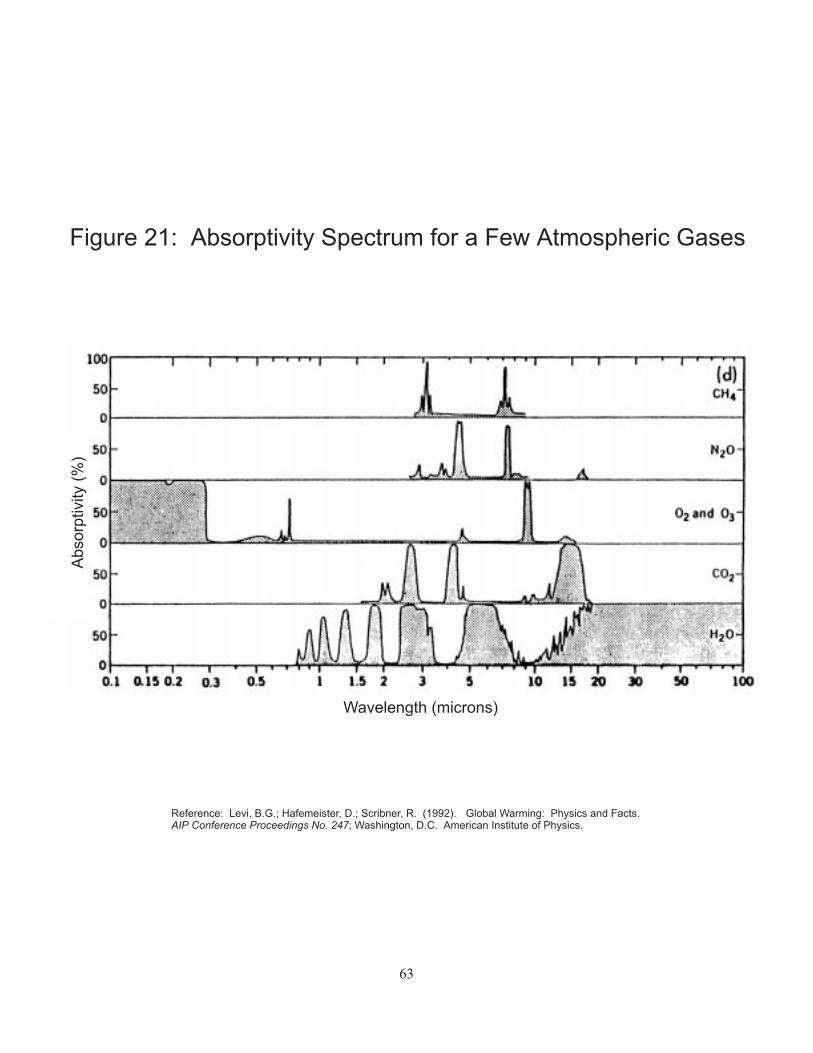
Figure 21: Absorptivity Spectrum for a Few Atmospheric Gases
Wavelength (microns)
Reference: Levi, B.G.; Hafemeister, D.; Scribner, R. (1992). �Global Warming: Physics and Facts.�; Washington, D.C. American Institute of Physics.AIP Conference Proceedings No. 247
63
Absorp
tivity
(%)
64
effect to be large enough to offset the warming effect due to the greenhouse gases. However, particulatematter remains in the atmosphere for a much shorter period of time (days to months) in comparison tothe long-lived greenhouse gases (decades to centuries). Therefore, the effect of particulates adjustsrapidly to increases or decreases in emissions (Watson et al, 1998).
9.1.5 Ozone Depletion Compounds
The term “ozone layer” is misleading, since it implies that there is a distinct region of the atmosphere inwhich ozone is a major atmospheric constituent. In reality, ozone is never more than a trace constituent.The concentration of ozone varies with latitude and season, but even at its maximum concentration, ozoneis never present at more than 10 ppmv (parts per million by volume). Ozone is an important greenhousegas present in both the troposphere and stratosphere. Though it is only present in a trace concentration,ozone is a very important constituent of the stratosphere. Ozone shields the earth from short wavelengthultraviolet radiation. An increased presence in the stratosphere of man-made chemicals that act ascatalysts for the destruction of ozone has raised a great deal of concern. A 5% decrease in the amountof stratospheric ozone has been predicted to produce 20% more cases of skin cancer, mostly squamouscell carcinoma, per year in the United States (Bunce, 1994). A few of the “catalysts” of concern are thefollowing species, which all have an unpaired valence electron: the chlorine atom (Cl), nitric oxide (NO),the hydroxyl radical (OH), and the hydrogen atom (H). According to Bunce (1994), these catalysts alloperate according to the following mechanism (where X equals the odd-electron species):
X + O á XO + O3 2
XO + O á X + O 2
O + O á 2 O3 2
Chlorofluorocarbons (CFCs), a heat transfer fluid introduced in the 1930s for use in refrigerators and airconditioning systems, are susceptible to gradual photolysis which produces more chlorine to participatein the above reactions:
CF Cl á hv, � < 250 nm á CF Cl + Cl2 2 2
9.1.6 Smog: Photochemical and London
There are two types of smog: photochemical smog and London smog. Photochemical smog (such as thatin Los Angeles, California) consists of a yellow-brown haze, which reduces visibility, and consists ofsubstances that both irritate the respiratory tract and cause eye-watering. Nitrogen dioxide is the chemicalresponsible for the color and opacity of the smog, while the irritant species include ozone, aliphaticaldehydes, and organic nitrates. The following four conditions must all be present simultaneously inorder for photochemical smog development (Bunce, 1994):& nitrogen oxides (NO )x
& sunlight& hydrocarbons& temperatures higher than about 18°C.
London smog is quite different from the Los Angeles-type photochemical smog. London smog resultsmainly from the burning of coal, which releases large amounts of particulates and sulfur dioxide gas. Themost devastating occurrence of London smog occurred in London in 1952. Visibility in the center
65
of the affected area was less than 22 yards. Sulfur dioxide concentrations were as high as 1.3 ppm, andtotal particles of 4.5 mg m were recorded. These conditions caused over 4,000 fatalities (Finlayson-Pitts-3
and Pitts, 1986). Comparisons of the two types of smog are shown in Table 49 (Bunce, 1994 andFinlayson-Pitts and Pitts, 1986).
Table 49: London versus Photochemical Smog
Characteristics Type of smog
Photochemical London
Primary pollution source Automobiles Coal burning without appropriateclean-up technologies.
Primary pollutants NO , organicsx SO , sooty particles2
Secondary pollutants O , peroxyacetal nitrate (PAN), HNO ,3 3
aldehydes, sulfates, particulate nitrates, etc.H SO , aerosols, sulfonic acids,2 4
sulfates, etc.
Cause of reduced visibility Liquid aerosol Smoke, soot
Chemistry of the atmosphere Oxidizing (O , PAN)3 Reducing (SO )3
Temperature Hot (� 75(F) Cool (� 35(F)
Relative humidity Low, usually hot and dry High, usually foggy
Time air pollution peaks Noon to evening Early morning
When the impacts of emissions are being considered, it is important to account for effects of the chemistryin which the emissions participate, as well as the inherent toxic effects of each stressor and stressorcategory. A stressor may not be present at toxic concentrations, and yet it may be reacting to form toxiclevels of another compound. The following information explains the complex chemistry for the formationof photochemical smog. The information given is based on the following sources: Bunce, 1994;Finlayson-Pitts & Pitts, 1986; Warneck, 1988; and Wayne, 1991.
Spontaneous chemical reactions that occur when mixing two or more stable chemical reagents are quiterare. For the most part, a reaction will proceed only if stimulated by the addition of energy since mostreactions must overcome an activation energy barrier. Heat is the common source of this energy in thelaboratory; other forms of energy, such as visible or ultraviolet light, are used much less frequently.However, in the atmosphere, the heat content of ambient air is usually insufficient for thermal activationof a reaction. Therefore, solar radiation initiates most atmospheric reactions.
In a sense, the atmosphere is a giant photochemical reactor, in which the sun acts as the radiation source.The sun emits a wide range of radiation wavelengths, but only certain regions of the spectrum areimportant to the photochemistry of the troposphere. Light can become photochemically effective if theenergy is absorbed into a molecule. The mere interaction of radiation with a molecule is insufficient; theenergy must be incorporated into the molecule. Further, light radiation acts in a particulate manner. Aray of light is actually a flux of photons with each photon having a specific amount of energy. Accordingto quantum mechanics, the energy of the photon must exactly correspond to the energy of a higher energylevel in the molecule in order for the photon to be absorbed.
66
Energy levels are customarily distinguished by rotational, vibrational, and electronic motions within amolecule. In general, the excitation of rotational and vibrational levels does not provide the energynecessary for photochemical reactions. In the troposphere, visible and near ultraviolet (l ~ 400–200 nm)radiation is the major source of energy for photochemical reactions, since stratospheric ozone acts as afilter for shorter wavelengths. Radiation of longer wavelengths also reaches the earth’s surface, but thisradiation is too low in energy to cause electronic excitation of molecules. Longer wavelength radiationtends only to heat the atmosphere.
Once a molecule has been excited, the fate of the excitation energy depends on the nature of the moleculeand the amount of energy received. If the excited molecule gives off the energy as radiation, the processis called fluorescence. The molecule may also undergo a process called quenching, in which the energydissipates by collisions with other molecules. The energy may be used for chemical transformations suchas isomerization, dissociation, or ionization. Sensitization, which involves the transfer of all or part ofthe energy to other molecules that can then react further, is a possibility, or the molecule can participatein chemical reactions directly.
One of the most important mechanisms of the atmospheric chemistry leading to photochemical or “LosAngeles” smog involves the photodissociation of ozone (O ). 3
O + hv, � < 400nm á O * + O*3 2
O* + H O á 2 OH2
This reaction sequence is important because of the formation of the hydroxyl radical (OH). The hydroxylradical is not to be confused with the hydroxide anion (OH ). The hydroxyl radical has an unpaired-
electron and is neutral, which makes it chemically distinct from the hydroxide anion. The hydroxylradical is the most powerful oxidant in the troposphere (Bunce, 1994).
The Formation of Ozone, Aldehydes, and Peroxyacetal NitrateNitrogen dioxide is responsible for the brownish coloring of the haze associated with smog, but it alsofacilitates many of the reactions associated with smog formation. In the unpolluted atmosphere, carbonmonoxide (CO) and ozone (O ) react to form carbon dioxide (CO ) and molecular oxygen (O ).3 2 2
However, in the presence of nitrogen oxides, carbon monoxide reacts to produce, rather than destroy,ozone. Because NO and CO are produced during the combustion of fossil fuels, the ozone productionx
reactions typically take place in the lower atmosphere, where the ozone is a pollutant rather than in thestratosphere where it absorbs incoming UV radiation.
Nitrogen oxides also participate in the oxidation reactions of hydrocarbons, which form ozone. Whenthe formation of ozone from the oxidation of carbon monoxide is considered in conjunction with theformation of ozone from the oxidation of methane, the following overall reaction results:
CH + 8 O + 4 hv á CO + 2 H O + 4 O4 2 2 2 3
Thus, the oxidation of only one mole of methane can produce as many as four moles of ozone.
Aldehydes are produced similarly to the way methane is oxidized. An alkyl group undergoes hydrogenabstraction by the hydroxyl radical. The resulting alkyl radical then reacts with molecular oxygen to form
67
an alkylperoxy radical. The peroxide radical then reacts with nitric oxide followed by molecular oxygento form an aldehyde. The formation of organic nitrates also occurs by a free radical initiation andpropagation type mechanism.
9.1.7 Acid Deposition
Usually, rainwater has a pH close to 5.6 because of the reaction between water and atmospheric carbondioxide to form carbonic acid. However, the presence of sulfur oxides and nitrogen oxides (theprecursors to sulfuric and nitric acid), as well as chlorides and fluorides (the precursors to hydrochloricand hydrofluoric acids), can lead to rainfall with a pH lower than 5.0. Rainwater with a pH of 4 to 4.5is not uncommon, and pHs lower than 2 have been recorded (Bunce, 1994).
Excess acidity can be harmful to plants. The leaves of plants may be damaged when the pH ofprecipitation falls below 3.5, although changes in soil can occur at less acidic pHs. The changes in soilwill be the most pronounced in poorly buffered soils. Though there are a few plants that can tolerateacidic soils, most plants prefer an alkaline environment. The acidity of the soil may inhibit seedgermination and seedling growth in addition to other effects (Bunce, 1994). It is believed that calcium,magnesium, and potassium are leached out of the soil by acid rain. Though leaching may initiallyincrease the availability of the cations for vegetation, nutrient deficiency may eventually occur. Also,acidic water may release sufficiently high concentrations of aluminum from minerals in the soil resultingin phytotoxic concentrations (Zakrzewski, 1991). High concentrations of aluminum may also reduce theuptake of nutrient cations such as Ca (Levi et al, 1992).2+
Plant life is not the only ecological concern when acid rain is an issue. In areas where the underlyingrocks have poor buffering capacity (e.g., granite), lakes and streams are sensitive to the addition of acid.The lower the pH becomes, the greater the losses of aquatic life. At a pH less than 4, lakes becomesuitable habitats for white moss. This moss forms a thick covering on the lake bottom preventing nutrientexchange between the water and lake sediments (Bunce, 1994). The Freshwater Institute of Manitobaperformed a research project that involved the purposeful acidification of a small lake in Ontario. ThepH of the lake was intentionally lowered from 6.8 to 5.0 over an eight-year period. The results of thisstudy, as reported by Zakrzewski (1991), are as follows: “At the pH 5.9 the population of a shrimpspecies decreased considerably, another species of crustacean disappeared, and fathead minnow stoppedreproducing. At pH 5.4 all fish stopped reproducing.”
According to Bunce (1994), lakes with a pH lower than 5 commonly do not contain fish. Table 50 givesfurther examples of aquatic organisms that are lost as a result of acidification of lakes and streams.
Table 50: Aquatic Organisms Lost - Due to Acidification of Lakes and Streams
pH Aquatic organism lost
6.0 Death of snails and crustaceans
5.5 Death of salmon, rainbow trout, and whitefish
5.0 Death of perch and pike
4.5 Death of eel and brook trout
68
Structures may also incur damage due to acid rain. A commonly used building material is concrete. Thismaterial is attacked even under the normal conditions of slightly acidic rainwater. However, acidprecipitation speeds up the chemical process of destruction. Iron and steel are also highly susceptible tocorrosion. Acid rain promotes the corrosion process by providing hydrogen ions which catalyze thecorrosion chemistry. Even galvanized steel (steel protected with zinc) may experience acceleratedcorrosion under acidic conditions.
9.1.8 Contributors to Corrosion
The stressors that contribute to the corrosion of metals are ammonia and ammonium salts, sulfur oxides,hydrogen sulfide, oxygen, ozone, water, chlorine, hydrochloric acid, chloride salts, and molten salts ofalkali metals (Barton, 1976; Shreir, 1978; and Kofstad, 1988). Acid rain promotes corrosion of structuresincluding concrete and metal as discussed above in the previous section. Additional information relatedto corrosion is discussed in section 9.2 for that specific stressor.
9.1.9 Radionuclides
Radionuclides are unstable elements that radioactively decay until a stable element is formed. When anelement decays, it divides into two parts. The first is called a daughter (which may or may not beradioactive); the second is the radiation. The three possible types of radiation that may be emitted in thedecay process are: alpha particles, beta particles, and gamma radiation. Alpha particles can travel onlya short distance and cannot go through human skin. Beta particles may penetrate human skin, but theycannot travel completely through the body. Gamma radiation, however, can go all the way through thebody. A few of the naturally occurring radioactive species are uranium, thorium, radium, and radon.Although natural, these sources of radiation are harmful to humans, and exposure to any radioactivity cancause cancer.
9.2 Known Effects of Specific Stressors
The previous section discussed the stressor categories into which various emissions were placed. In thissection, the known ecological and human health effects caused by expected emissions are reported. Theorder in which the information is organized does not imply that one stressor is more harmful to theenvironment or human health than any other stressor. 9.2.1 Nitrogen Compounds
Five major gaseous forms of nitrogen compounds are released as a result of burning coal for electricityproduction. These include nitrogen gas (N ), ammonia (NH ), nitrous oxide (N O), nitric oxide (NO),2 3 2
and nitrogen dioxide (NO ).2
Nitrogen is an odorless gas that constitutes 75.5% by weight or 78.06% by volume of the earth’satmosphere. When a combustion source is applied, this gas combines with oxygen and hydrogen to formnitric oxide and ammonia, respectively (Budavari et al, 1996).
Ammonia is a colorless gas with a very pungent odor. The lower limit of human perception is 53 ppm(Budavari et al, 1996). Ammonia is the only atmospheric gas capable of neutralizing the acids producedwhen SO and NO are oxidized (Warneck, 1988 and Kirkwood and Longley, 1995). Because of this2 x
69
property, ammonia has been used as an agent for controlling NO emissions (Bunce, 1994).x
Neutralization by ammonia leads to the formation of ammonium salt particulates of sulfuric and nitricacids (Warneck, 1988).
Ammonia and its compounds have been well documented for causing ‘season cracking’, a type of stress-corrosion cracking of cold-worked brass (Shreir, 1978). Corrosion can proceed all over the brass surfacewhen ammonium salts are present because they have a low surface tension, which causes sheeting ratherthan drop formation condensation (Barton, 1976). Ammonia appears to be a contributor to the nitrogenloading of the Chesapeake Bay according to a study published by the Environmental Defense Fund(Zakrzewski, 1991) on the role of airborne nitrate deposition in eutrophication of the Chesapeake Bay. Nitrous oxide, commonly known as laughing gas, is a colorless gas with a slightly sweetish odor andtaste. It is very stable and chemically inert at room temperature but dissociates and becomes an oxidantat temperatures higher than 300°C (572°F) (Budavari et al, 1996). This gas absorbs infrared radiation;therefore, tropospheric N O is considered a greenhouse gas with an estimated global warming potential2
310 times (weight basis) that of carbon dioxide (Houghton et al, 1996). Due to its stability and chemicalinertness, there are no known sinks, a chemical or physical process that removes a species from the“reservoir” of concern, for N O in the troposphere other than migration to the stratosphere. In the2
stratosphere, nitrous oxide has two chemical sinks. The first sink is photochemical degradation.
N O + hv á N + O* (an excited oxygen atom)2 2
Nitrous oxide may also undergo a reaction with an excited oxygen atom to produce nitric oxide, NO(Bunce, 1994). Information about the excitation of a species is given in section 9.1.6, Smog:Photochemical and London.
Nitric oxide (NO) and nitrogen dioxide (NO ) are collectively known as NO since they continuously2 x
cycle back and forth. Nitrogen oxides are produced when any fuel is combusted in air or oxygen (Bunce,1994). NO produced in this manner is often referred to as thermal NO . A second-type of NO , oftenx x x
referred to as fuel-bound NO , is produced when nitrogen within a fuel (rather than from air) reacts withx
oxygen.
Nitric oxide is a colorless gas that contains an odd number of electrons (one of its valence electrons isunpaired) and is paramagnetic (Budavari et al, 1996). As an odd-electron species, NO acts as a catalystfor the depletion of stratospheric ozone.
Nitrogen dioxide is a reddish-brown gas with an irritating odor. This chemical species is responsible forthe characteristic yellow-brown haze that exists in Los Angeles, California (Budavari et al, 1996). Thecoloration effect is a result of NO acting as a filter for blue light by strongly absorbing radiation with2
wavelengths less than 430 nm (Finlayson-Pitts and Pitts, 1986). Nitrogen oxides are contributors to aciddeposition caused by the oxidation reaction of NO to nitric acid.x
The ingestion of nitrates (NO ) and nitrites (NO ) can cause relaxation of smooth muscle cells, which3 2- -
can be so drastic that the contractile system is totally inhibited. These compounds can cause blood to poolin the veins so that the heart is not completely filled. Therefore, the systolic blood pressure drops, andthe pulse rate increases. Dilation of blood vessels in the brain leads to headaches. Additionally,
70
acute circulatory collapse and fainting are also possible. Dilation of vessels in the retina leads to visiondisorders (Ullmann, 1985).
The organic nitrate, peroxyacetyl nitrate (PAN), is often present in highly polluted areas because of thereaction between the peroxyacetyl radical and nitrogen dioxide. This species that is associated withphotochemical smog irritates the mucous membranes, eyes, and skin.
9.2.2 Sulfur Compounds
The combustion of coal is the primary source of sulfur pollutants. The sulfur in the coal is oxidized toform sulfur dioxide gas when the coal is burned (Bunce, 1994). Sulfur dioxide is a colorless,nonflammable gas with a strong suffocating odor (Budavari et al, 1996). This gas is readily adsorbedonto the surface of particulate matter. The particulates act as a catalyst for the oxidation of SO to SO2 3
in the presence of moisture. The SO immediately combines with water to form sulfuric acid (H SO ).3 2 4
Many of these particles are removed from the atmosphere through acid deposition such as acid rain, acidsnow, or acid fog. Inhaling these particles can damage the respiratory system (Zakrzewski, 1991). Sulfuroxides are also powerful stimulators of atmospheric corrosion because of their high solubility in water(Shreir, 1978 and Barton, 1976).
Another sulfur compound, hydrogen sulfide (H S), is emitted from each coal-to-electricity system. H S2 2
is a flammable, poisonous gas with a sweetish taste and the characteristic odor of rotten eggs, perceptibleto the human nose when present in air at concentrations of 0.02-0.13 ppm (Budavari et al, 1996). Atnormal atmospheric concentrations, this gas is responsible for the tarnishing of copper, silver, and othermetals with high energies of sulfide formation (Shreir, 1978 and Barton, 1976). H S can also lead to2
corrosion because it is readily oxidized to the powerful atmospheric corrosion stimulant SO (Shreir,2
1978). Sulfides, which are irritants, can emit hydrogen sulfide upon heating (Ullmann, 1985).
9.2.3 Carbon Dioxide
Carbon dioxide is produced from the burning of carbonaceous materials. It is a colorless, odorless,noncombustible gas that has a faint acid taste (Budavari et al, 1996). This gas is necessary forphotosynthesis by plants. CO is the most publicized of the greenhouse gases due to its increasing rate2
of production and atmospheric concentration. Although the link between CO and higher global mean2
temperatures has not been fully established, many in the scientific community are beginning to think thatthe increase in atmospheric CO is likely to have some effect. Many efforts are under way to reduce2
greenhouse gas emissions, particularly CO . For example, in December 1997, the nations attending the2
United Nations Convention on Climate Change agreed to the terms of the Kyoto Protocol, which obligatesindustrialized countries to meet legally binding greenhouse gas emission objectives over the 2008-2012time frame. The International Energy Agency and IPCC are working to gather relevant scientific data andbuild international cooperation to achieve these objectives. Although the consequences of increasedatmospheric CO and global mean temperatures are not known, a proactive approach to mitigation is seen2
by many to be the prudent course of action.
9.2.4 Carbon Monoxide
Carbon monoxide results from the incomplete combustion of hydrocarbons. It is a highly poisonous,odorless, colorless, tasteless, flammable gas (Budavari et al, 1996). Carbon monoxide is particularly
71
dangerous because it cannot be detected by the natural senses of the body (Ullmann, 1985). CO is notitself a greenhouse gas, but it directly influences the concentrations of other greenhouse gases in theatmosphere by removing hydroxyl radicals that could otherwise react to destroy greenhouse gases(Zakrzewski, 1991). However, the primary reason CO is considered a pollutant results from its healthimplications. Carbon monoxide combines with the hemoglobin of the blood to form carboxyhemoglobin,which is useless as an oxygen carrier. At less than 2% carboxyhemoglobin, no health effects are seen inhumans (Zakrzewski, 1991). However, at higher concentrations, toxic symptoms include headache,mental dullness, dizziness, weakness, nausea, vomiting, loss of muscular control, increased thendecreased pulse and respiratory rates, collapse, unconsciousness, and death (Budavari et al, 1996). Whena person is exposed to CO at a concentration of 100 ppmv, up to 15% of the person’s hemoglobin hasbeen converted to carboxyhemoglobin (Bunce, 1994). Physiological functions can be fully restored withthe timely removal of CO from the blood stream. This can be achieved by administering oxygen to theaffected individual. However, the time required for removing 50% of the carbon monoxide from thehemoglobin is 320 minutes or nearly 5.5 hours (Zakrzewski, 1991).
9.2.5 Methane
Methane, the simplest hydrocarbon, is a colorless, odorless, non-poisonous gas (Budavari et al, 1996).This gas has an estimated global warming potential of 21 times (weight basis) that of carbon dioxide(Houghton et al, 1996). Methane is also highly explosive in atmospheric concentrations of 5%-15%. Aslittle as 0.5%-2% CH may be dangerous, especially in the presence of coal dust. In coal mine entries4
used by personnel, methane levels cannot exceed 1%, and in certain designated areas of the mine notfrequented by mine personnel, methane levels cannot exceed 2% as regulated by the Mine Safety andHealth Administration (IFC Resources Inc., 1990).
Acid rain may be contributing, in a minor way, to methane’s atmospheric concentration and globalwarming potential. Many of the soil bacteria that consume atmospheric methane are less effective at thisactivity in response to acid precipitation. A less effective sink for methane leads to increasedconcentrations of atmospheric methane over time, which causes an increased global warming potential(Schlesinger, 1991).
Methane is also a contributor to photochemical smog. Four moles of ozone, one of the irritant speciesassociated with photochemical smog, may be produced for every one mole of methane that is oxidized(Bunce, 1994). See section 9.1.6, Smog: Photochemical and London, under the heading, The Formationof Ozone, for the chemistry that leads to the net reaction shown below:
CH + 8 O á CO + 2 H O + 4 O4 2 2 2 3
9.2.6 Non-Methane Hydrocarbons (NMHCs)
In general, alkanes have a narcotic effect; they diminish awareness of sensory impulses, especially pain,and, in large doses, can cause stupor, coma, and convulsions. However, n-hexane possesses a markedneurotoxic effect that distinguishes it from the other alkanes. It is also a skin irritant. The alkenes aretoxicologically not very active, but higher molecular mass compounds possess narcotic properties. Thealkylbenzenes tend to have low oral toxicity with LD > 5000 mg/kg (Ullmann, 1985). LD which is50 50,
also known as the median lethal concentration, is the concentration of a chemical that is estimated to befatal to 50% of the organisms tested.
72
When handling aldehydes, care must be taken to prevent either the liquids or their vapors from cominginto contact with respiratory organs, eyes, and skin. Because of their health hazards, saturated andunsaturated aliphatic aldehydes, especially the lower members, should be handled only if special safetyprecautions are taken. Aldehydes are highly reactive and sometimes have a very unpleasant and intenseodor (Ullmann, 1985).
Phenol is toxic in high concentrations. It can be absorbed through the skin, by inhalation, andswallowing. Possible results from inhaling phenol vapor or mist are shortness of breath, coughing, andlung edema. Swallowing phenol can lead to caustic burns on the mouth and esophagus and stomachpains. The effect of phenol on the central nervous system, sudden collapse and loss of consciousness,is the same for humans and animals. Historically, phenol was used as a very effective disinfectantbecause of its germicidal effect. However, because of its protein-degenerating effect, it often had aseverely corrosive effect on the skin and mucous membranes (Ullmann, 1985).
Fuel oils, such as heavy and light diesel fuel, differ from one another by their hydrocarbon compositions,boiling point ranges, chemical additives, and uses. Breathing some fuel oils for short periods may causenausea, eye irritation, increased blood pressure, headache, light-headedness, loss of appetite, poorcoordination, and difficulty concentrating. Breathing diesel fuel vapors for long periods may causekidney damage and lower the blood’s ability to clot. Preliminary studies suggest that heavy fuel oils maycause cancer and that light fuel oils do not. However, further investigation is necessary.
In view of the high boiling range and low volatility of lubricants, the environment can be polluted onlythrough seepage into the ground and contamination of surface and subsoil waters. This may happenbecause of careless handling, tank leakage, transport accidents, improper disposal of used oils, or inexpertdraining of lubricant-containing industrial wastewater. The toxicology and occupational health concernsassociated with lubricants vary with type and composition of the lubricant (Ullmann, 1985). However,common symptoms of exposure are skin irritation (resulting from skin contact) or stomach irritation(when ingested).
9.2.7 Cyanides
“Cyanides” is a collective term for the man-made and naturally occurring substances that are composedof the cyanide anion (CN ) and other elements. The single largest source of airborne cyanide emissions-
is vehicle exhaust. Cyanide in the form of vitamin B is needed as part of a healthy diet to prevent12
anemia. However, exposure to high levels of cyanide for a short period harms the central nervous,respiratory, and cardiovascular systems and may cause a coma or death. Brief exposures to lower levelsresult in rapid, deep breathing; shortness of breath; convulsions; and loss of consciousness. Skin contactwith dust containing certain cyanides can cause skin irritation and ulceration. The U.S. EPA has notdetermined whether cyanides should be classified as human carcinogens (U.S. Department of Health andHuman Services, 1993).
73
9.2.8 Ozone
Ozone, a powerful oxidizing agent, is a bluish, explosive gas with a pleasant, characteristic odor atconcentrations of less than 2 ppm (Budavari et al, 1996). At higher concentrations, ozone is an irritatingand injurious respiratory toxin. Acute exposure causes damage to and swelling of the respiratory tissue;chronic exposure may lead to emphysema (Zakrzewski, 1991). The presence of ozone is one cause forthe irritating nature of photochemical smog and is one of the more active greenhouse gases (Bunce,1994). Ozone also participates in corrosion processes by actively promoting the aging of elastomers andother organic substances that are commonly used as protective coatings (Barton, 1976).
Despite the ill effects of ozone in the troposphere, stratospheric ozone is a necessity because it reducesthe penetration of ultraviolet light. UV-B light (280 - 320 nm) is particularly damaging to life becauseradiation in this region of the spectrum is strongly absorbed by proteins, nucleic acids, and otherbiological molecules (Macalady, 1998).
9.2.9 Particulates
Particulate matter is a general term for solid particles that are suspended in the atmosphere. Theseparticles are made up of various compositions of organic and inorganic compounds. Air quality standardsfor particulate matter are now written in terms of total suspended particulate matter and are not classifiedaccording to size. However, the U.S. EPA may mandate a size restricted standard because of size-relatedhealth effects. If inhaled, large particles (> 2.5 µm) are removed in the upper respiratory tract. On theother hand, particles that are typical of fossil fuel combustion are much smaller (< 2.5 µm) and arerespirable. They are not removed in the upper respiratory tract, but rather travel to the region of the lowerrespiratory tract where gas exchange occurs. In addition, they typically contain more toxic species thanthe large particles. Therefore, small particles are a greater health risk than large particles (Finlayson-Pittsand Pitts, 1986).
Particulates are not only a health risk, they also act as catalysts for the oxidation of sulfur dioxide whichleads to acid precipitation. In addition, small particles are responsible for most light scattering andvisibility reduction (Finlayson-Pitts and Pitts, 1986).
9.2.10 Trace Elements and Their Compounds
This section contains information about the trace elements included in the inventory analysis portion ofthe coal-fired power plant life cycle assessment. The toxicological effects of exposure by ingestion aregiven even though the primary means of exposure is inhalation for most of these trace elements. Allinformation in this section, unless otherwise noted, has been taken from the Agency for Toxic Substancesand Disease Registry (U.S. Department of Health and Human Services, 1993).
AntimonyAntimony is a silvery-white metal that is released into the environment from natural sources and fromindustry. Mixed into alloys, it is used in lead acid batteries, solder, sheet and pipe metal, bearings,castings, and pewter. It is also used in paints, ceramics, and fireworks. In the air, antimony attaches tosmall particles that may stay airborne for many days. Eventually, most antimony ends up in the soil,where it adheres strongly to particles that contain iron, manganese, or aluminum. Breathing high levelsof antimony for a long time can irritate the eyes and lungs as well as cause heart and lung problems,
74
stomach pain, diarrhea, vomiting, and stomach ulcers. Ingesting large doses of antimony can causevomiting. Limited information is available about the effects of antimony on humans. However, in short-term studies, animals that were exposed to high levels of airborne antimony experienced lung, heart, liver,and kidney damage. Those exposed to very high levels died. In long-term studies, animals exposed tovery low levels of antimony had eye irritation, hair loss, lung damage, heart problems, and fertilityproblems. As to its human carcinogenicity, antimony has not yet been classified by the U.S. EPA.
ArsenicInorganic arsenic compounds are poisonous to humans. They are used to preserve wood and to makeinsecticides and weed killers. Organic forms of arsenic compounds are usually less harmful thaninorganic forms. Fish and shellfish build up organic arsenic in their tissues, but most of the arseniccontained in fish is not toxic. High levels (60 ppm) of inorganic arsenic can be fatal. Arsenic damagesmany tissues including nerves, stomach, intestines, and skin. Breathing high levels can cause a sore throatand irritated lungs. Lower levels of exposure to inorganic arsenic compounds may cause nausea,vomiting, and diarrhea, decreased production of red and white blood cells, abnormal heart rhythm, bloodvessel damage, and a “pins and needles” sensation in the hands and feet. Long-term exposure toinorganic arsenic may lead to a darkening of the skin and the appearance of small corns or warts on thepalms, soles, and torso. Direct skin contact may cause redness and swelling. Finally, arsenic is a knowncarcinogen.
BariumInsoluble barium compounds are not toxic. Soluble barium compounds, however, may cause harmfuleffects. Most barium poisoning is caused by mistaking soluble barium compounds, such as bariumcarbonate, for the insoluble and therefore nontoxic barium sulfate, which is used as a contrast agent inx-ray diagnosis (Ullmann, 1985). Barium compounds are used by oil and gas industries to make drillingmuds, which make it easier to drill through rock by keeping the drill bit lubricated. These compoundsare also used to make paint, bricks, tiles, glass, and rubber. Ingesting high levels of soluble bariumcompounds may cause difficulty in breathing, increased blood pressure, changes in heart rhythm, stomachirritation, brain swelling, muscle weakness, and damage to the liver, kidney, heart, and spleen. The U.S.Department of Health and Human Services has not classified barium as to its human carcinogenicity.
BerylliumPure beryllium is a hard, grayish metal that is used in electric parts, machine parts, ceramics, aircraft parts,nuclear weapons, and mirrors. Most of the beryllium that can be inhaled is released into the air by theburning of coal or fuel oil. Beryllium is a toxic substance that can be harmful, depending on the amountand duration of exposure to it. Not all of the effects of beryllium and its compounds are well understood,and not all forms of beryllium are equally toxic. Short term human and animal exposure to high levelsof soluble beryllium compounds can lead to the development of inflammation or reddening and swellingof the lungs, a condition known as acute beryllium disease (similar to pneumonia). Removal fromexposure leads to a reversal of symptoms. Long-term exposure to beryllium or beryllium oxide at muchlower levels has been reported to cause chronic beryllium disease. This disease is characterized byshortness of breath, scarring of the lungs, and berylliosis (non-cancerous growths on the lungs ofhumans). Acute and chronic beryllium diseases can be fatal. Beryllium and its compounds mayreasonably be anticipated to be carcinogens.
75
BoronBoron is often found combined with other substances called borates such as boric acid, salts of borates,and boron oxide. Borates are used most widely to produce glass, but they are also used in fire retardants,leather tanning industries, cosmetics, photographic materials, soaps, and cleaners. Breathing moderatelevels of molecular boron can irritate the nose, throat, and eyes. Reproductive effects have been observedin men exposed to boron over the long-term. Ingesting large amounts of boron over short periods of timecan harm the stomach, intestines, liver, kidney, and brain. Boron has not been classified as to itscarcinogenicity.
CadmiumSince cadmium does not corrode easily, it has many industrial uses. It is used for batteries, pigments,metal coatings, and plastics. However, exposure to cadmium can cause a number of adverse healtheffects. Ingesting high doses severely irritates the stomach, which leads to vomiting and diarrhea;inhaling high doses severely irritates the lungs. However, these high doses are extremely rare. Someeffects seen at more common excess levels are kidney and lung damage (such as emphysema), and lungcancer. Other tissues reported to be injured by cadmium exposure in animals or humans include the liver,the testes, the immune and nervous systems, and the blood. However, reproductive and developmentaleffects have been observed in animals only. In general, soluble cadmium compounds are more toxic thaninsoluble compounds.
ChromiumChromium is considered to be an essential nutrient that helps to maintain normal metabolism of glucose,cholesterol, and fat in humans. Signs of chromium deficiency include weight loss and impairment of thebody’s ability to remove glucose from the blood. One form of chromium that is thought to be an essentialnutrient is trivalent chromium (chromium [III]). Small doses of this substance are necessary, but largedoses may be harmful. One of the major forms of chromium is hexavalent chromium (chromium [VI]).This substance can result in adverse effects such as ulcers of the skin, irritation of the nasal mucosa andperforation of the nasal septum, and irritation of the gastrointestinal tract. It may also cause harm to theliver and kidney. Also, chromium and certain chromium compounds are known carcinogens.
CobaltIndustrially, cobalt is used as a drier for paint and porcelain enamel that is applied to steel bathroomfixtures, large appliances, and kitchen wares. This trace element has both beneficial and harmful effectson human health. Cobalt is beneficial because it causes red blood cells to be produced and this propertymakes it useful for treating anemia. Cobalt is part of Vitamin B , which is essential for human health.12
However, inhaling high levels can be harmful resulting in asthma, pneumonia, or wheezing. Additionally,cobalt is a possible human carcinogen.
CopperCopper is a reddish metal that occurs naturally in rock, soil, water, sediment, and air. It is primarily usedas the metal or alloy in the manufacture of wire, sheet metal, pipe, and other metal products. It is anessential element for all known living organisms. Many copper compounds can be recognized by theirblue-green color. Although copper is necessary for good health, very large single or daily intakes ofcopper can be harmful. Long-term exposure to copper dust can irritate the nose, mouth, and eyes and cancause headaches, dizziness, nausea, and diarrhea. High doses can cause liver and kidney damage andeven death. Copper is not known to cause cancer.
76
LeadLead is a naturally occurring bluish-gray metal. Lead has many uses, but health concerns have causedthe use of lead in gasoline, paints, caulking, and pipe solder to be dramatically reduced in recent years.Regardless of the manner in which lead enters the body, its effects are the same. If a pregnant womanis exposed to lead, it can be carried to the unborn child resulting in premature birth, low birth weight, oreven miscarriage. For infants or young children, lead exposure has been shown to decrease intelligence(IQ) scores, slow growth, and cause hearing problems. Exposure to high levels of lead can damage thebrain and kidneys of adults and children. Exposure to lead may increase blood pressure and damage themale reproductive system. There is insufficient information about whether or not lead is a carcinogen,but tumors have developed in rats and mice that were given large doses.
ManganeseManganese is a naturally occurring, steel gray, lustrous, hard, brittle metal. Potential symptoms ofoverexposure to this metal are parkinsonism, asthenia, insomnia, mental confusion, metal fume fever (drythroat, coughing, tight chest, shortness of breath, rales, and flu-like fever), lower back pain, vomiting,malaise, and fatigue (Budavari et al, 1996).
MercuryMercury is used in thermometers, dental fillings, and batteries. Salts of mercury are used as antisepticcreams and ointments, as well as in skin lightening creams. One form of organic mercury,methylmercury, bioaccumulates in the environment; that is, it can build up in certain fish. Mercury caneasily enter the body by breathing its vapors or by eating organic forms of it in contaminated fish or otherfoods. Once mercury has entered the body, it may be months before all traces leave. Long-term exposureto either organic or inorganic mercury compounds can permanently damage the brain, kidneys, anddeveloping fetuses. In general, the toxicity of inorganic mercury compounds increases with increasingsolubility; in most cases, organic mercury compounds are more toxic than the inorganic ones (Ullmann,1985). Mercury has not been shown to cause cancer in humans.
MolybdenumMolybdenum is an essential trace element. Leguminous plants require molybdenum for bacterial fixationof nitrogen. In animals and humans it serves as a cofactor for the enzymes xanthin oxidase and aldehydeoxidase. The relationship between molybdenum deficiency and esophageal cancer in humans was firstreported in 1966. Information on the toxicity of molybdenum compounds is scarce. In general,molybdenum compounds are of low order of toxicity; any toxic effects are primarily associated withsoluble molybdenum compounds (Ullmann, 1985).
NickelNickel is commonly used for nickel plating, to color ceramics, and to make some batteries. The highestlevel of exposure to nickel commonly comes from dietary intake because it occurs in most food items.Nickel is required to maintain health in animals, but a lack of nickel has not been found to cause adverseeffects to the health of humans. Compared to oral intake, the typical amount of inhaled nickel is small.The most common adverse effects of nickel exposure noted in the general population are skin allergies.However, the U.S. Department of Health and Human Services has determined that nickel and certainnickel compounds may reasonably be anticipated to be carcinogens.
77
SeleniumHumans are exposed daily to selenium in their food. Generally, the levels in food are large enough toprevent diseases that may result from too little selenium. Though necessary for human health, seleniumcompounds can be harmful if daily levels are only somewhat higher than needed. A large ingested doseof sodium selenate or sodium selenite could be life threatening. Long-term exposure to amounts greaterthan necessary may cause brittle hair, deformed nails, or loss of feeling and control of the arms and legs.Selenium sulfide may reasonably be anticipated to be a carcinogen.
VanadiumVanadium is a component in the steel used for automobile parts, springs, and ball bearings. Smallamounts of this element are also used in making rubber, plastics, and ceramics. Vanadium mainly entersthe environment from natural sources and from burning fuel oils. Inhaling high levels of vanadiummainly affects the lungs, throat, and eyes. Workers who breathed it for short or long periods sometimesexperienced lung irritation, coughing, wheezing, chest pains, runny noses, and sore throats. These effectsstopped soon after they stopped breathing the contaminated air. Vanadium has not been classified as toits human carcinogenicity.
9.2.11 Alkali Metals
The term alkali metals refers to the Group IA elements of the periodic table: lithium, sodium, potassium,rubidium, and cesium. Francium is also a group IA element, but it is radioactive and very rare. They areall very reactive due to the single, rather loosely held valence electron. Because of their high reactivity,the alkali metals can be caustic. They are called alkali metals because the oxides of these metals are quitesoluble in water and produce very basic (alkaline) solutions (Brady and Humiston, 1982). Often thealkaline earth metals (Group IIA of the periodic table) are also included in this class of metals forreporting purposes. This group includes beryllium, magnesium, calcium, strontium, and barium. Radium,like francium, is a radioactive element that is not reported as an alkali metal. Like the Group IA elements,the Group IIA elements also produce basic solutions when added to water. The alkaline earth metals aresomewhat less reactive than the alkali metals because they contain two valence electrons that fill thevalence s orbital, making them more stable. The reactivity, metallic properties, and solubility ofhydroxides decrease from the bottom to the top of the periodic table (Brady and Humiston, 1982). Athigh temperatures, molten salts of these metals may cause accelerated corrosion and degradation (Kofstad,1988).
9.2.12 Fluorine, Fluorides, and Hydrogen Fluoride
Fluorine is a by-product of coal combustion that is released entirely in the gas phase. Being a veryreactive species, it combines readily with other atoms and molecules to form fluorides. Fluorides arerespiratory irritants, but their main environmental impact is on plants. Fluorides are phytotoxins that cancause leaf damage and defoliation (Zakrzewski, 1991). At low levels, fluorides are not believed to beharmful to human health. At high levels, fluorine gas and hydrogen fluoride (HF) gas can harm the lungsand heart and can cause death. Even at low levels, these gases can irritate the eyes, skin, and lungs.Contact with hydrogen fluoride can burn the eyes and skin. In humans, hydrogen fluoride causes lesionsof the respiratory system as a result of inhalation of HF vapors and of the skin as a result of direct contact. An environment containing 50 mg/m of air is dangerous. In fact, this concentration should be3
considered as an upper limit for a five minute exposure and may have fatal results if the exposure iscontinued for more than 30 minutes (Ullmann, 1985). Small amounts of sodium fluoride help reduce
78
tooth cavities, but high levels can be harmful. In children whose teeth are forming, high fluorideexposure can cause dental fluorosis with visible changes in the teeth. In adults, high fluoride exposureover a long time can lead to skeletal fluorosis with denser bones, joint pain, and limited joint movement.Fluorine, hydrogen fluoride, and fluorides have not been classified as carcinogens (U.S. Department ofHealth and Human Services, 1993).
9.2.13 Hydrogen Chloride
Hydrogen chloride severely irritates the eye and respiratory tract and, to a lesser extent, the skin.Inhalation causes irritation and damage to mucous membranes. Prolonged occupational exposure toexcessive HCl concentration causes increased incidence of chronic bronchitis or stomach and intestinaldisorders due to abnormal acid levels. Phytotoxic investigation has shown that plants have differingtolerances but lettuce, strawberries, spruce, birch, and apple trees are more sensitive than others. Theseplants should not be exposed to concentrations greater than 0.8 mg/m as a daily average or greater than3
0.1 mg/m as a monthly average (Ullmann, 1985).3
9.2.14 Radon
Radon is a naturally occurring, colorless, odorless, radioactive gas that is formed from the normalradioactive decay of uranium which is present in coal, as well as in most rocks and soils. When uraniumdecays to radon, the radon gas can travel through cracks and fissures in the ground. The most commonform of exposure to higher levels of radon occurs indoors, particularly in basements. Radon itself poseslittle threat to human health. Radon decays much slower than the breathing process so it is almostcompletely exhaled. The half-life of Radon-222 is 3.825 days (Budavari et al, 1996). However, its decayproducts (daughters) are solids that can be inhaled. These daughters do emit gamma radiation, and long-term exposure to gamma radiation can lead to lung cancer and other pulmonary diseases (Cothern andSmith, 1987 and U.S. Department of Health and Human Services, 1993).
10.0 Improvement
Life cycle assessment results can be used to identify opportunities to reduce the environmental burdenof the system through design improvements. This study has highlighted several negative environmentalaspects that are either direct or indirect results of the production of electricity from coal. The discussionin the following sections highlights changes that would reduce these effects. At this point, no attempt hasbeen made to gather additional data and perform supplementary LCAs on alternative process designs thatmay result in more environmentally friendly systems.
10.1 Flue Gas Clean-up
Many of the environmental burdens of coal-fired power systems are due to the production and use oflimestone for flue gas clean-up. In addition to requiring a considerable amount of oil and thus energy,limestone production is responsible for more particulate emissions than any other process step in theAverage and NSPS systems. Additionally, a significant amount of CO is emitted during both production2
and use of the limestone. Since the ratification of the 1990 Clean Air Act, limestone consumption for gasclean-up has increased by a factor of 2.5 within 5 years: 1,051 Mg/year in 1989 to 2,630 Mg/yr in 1994(SRI International, 1996).
79
Because of well-documented health effects, particulate emissions from coal-fired power plants are beingregulated. Ironically, however, the amount of particulates emitted from producing the limestone requiredto operate the Average and NSPS plants is significantly higher than the regulated amount. For new plantsbuilt after 1978, the amount of allowable particulates emitted from the power plant is equivalent to 0.12g/kWh of net electricity produced (calculation made from regulation in 40 CFR 60.42a; Office of theFederal Register National Archives and Records Administration, 1996). By comparison, the particulateemissions for limestone production alone are 8.2 and 8.6 g/kWh of net electricity produced averaged overthe life of the system for the Average and NSPS system, respectively. These numbers are 68 and 72 timeshigher than the regulated amount. The particulate removal efficiency is 99.53% for the Average andNSPS plants and 99.75% for the LEBS plant. Therefore, it is also important to note that if the particulateemissions were not regulated, the emissions from these power plants could be 213 times higher for theAverage and NSPS plants (29 g/kWh and 26 g/kWh, respectively) and 400 times higher for the LEBSplant (21 g/kWh).
One of the best ways to improve the environmental impacts of electricity production from coal-firedboilers is through alternative means of gas clean-up. One example of a different technology is the LEBSplant, which eliminates the conventional limestone flue gas clean-up system and replaces it with aregenerable copper oxide scrubbing process. Table 51 compares the particulate and CO emissions as2
well as the energy and oil requirements for limestone FGC versus the copper oxide process. To make afair comparison, all process steps required for each clean-up technology are included. The numbers forthe limestone FGC include those resulting from the production and transportation of lime and limestoneas well as the CO emissions from the limestone scrubbing reaction. Limestone is used for gas clean-up2
and lime is mixed with the FGC waste before landfilling. The numbers for the copper oxide processinclude those generated from the production and transportation of ammonia, copper oxide, and naturalgas along with the CO emitted from combusting the natural gas at the power plant. The copper oxide2
is the main component of the flue gas clean-up catalyst, ammonia is injected for NO reduction, andx
natural gas is used to regenerate the sorbent.
Thus for flue gas clean-up, the numbers in the Table 51 show that per unit of electricity produced, theLEBS system produces significantly fewer particulates, requires somewhat less energy, consumes a muchsmaller amount of oil, and emits considerably less CO than the Average and NSPS systems for the2
process steps associated with the flue gas clean-up technology. The particulates resulting from theoperations required for clean-up for the Average and NSPS systems are 361 and 385 times higher thanthose from the LEBS system. The non-coal energy requirement associated with flue gas clean-up is onlyreduced from 0.26 - 0.27 MJ/kWh for the Average and NSPS systems to 0.21 MJ/kWh for the LEBSsystem which is roughly 38%-39% of the total system energy requirement for each of the three systems.Because a large amount of fuel oil is consumed during limestone quarrying, the oil resource consumptionfor the Average and NSPS plants are 27 and 29 times higher than that for the LEBS system for theprocess steps associated with flue gas clean-up. Additionally, since the majority of the CO emissions2
are emitted from the combustion of the coal the total CO emissions for each system is high. However,2
the CO emissions associated with the clean-up technology are 28-30 g/kWh lower for the LEBS system.2
Limestone requirements at coal-fired power plants can also be reduced through the use of lower-sulfurcoal. Coal production in the west, particularly in Wyoming and Montana, has increased several-foldduring the past twenty years in response to tighter SO regulations. However, the use of mid- and high-x
sulfur coals is still commonplace.
80
Table 51: Comparison of Limestone FGC versus Copper Oxide Process
System Stressor (a)
Particulates(g/kWh)
CO2
(g/kWh)non-coal energy consumption
(MJ/kWh)oil consumption
(g/kWh)
Associated withgas clean-up
(b), (c)
Systemtotal
(d), (e)
Associated withgas clean-up (b), (c), (f)
Systemtotal
(d), (e)
Associated withgas clean-up
(b), (c)
Systemtotal
(d), (e)
Associated withgas clean-up
(b), (c)
Systemtotal
(d), (e)
Average 9.03 9.21 40 1,022 0.26 0.72 5.2 11.5
NSPS 9.62 9.78 42 941 0.27 0.71 5.5 11.3
LEBS 0.025 0.11 12 741 0.21 0.54 0.19 4.9
(a) Numbers are per kWh of net electricity produced averaged over the life of the system.(b) For Average & NSPS, this column includes only the process steps for limestone FGC which are: production, transportation, and
use of lime and limestone.(c) For LEBS, this column includes only the process steps for the copper oxide process which are: production, transportation, and
use of ammonia, copper oxide, and natural gas. (d) Coal transportation = average user by river. (e) Results are reported for the surface mining case. However, the underground mining numbers are similar to those listed here.
(f) Includes the CO emissions from the limestone scrubbing process (Average & NSPS) or CO emissions from combustion of2 2
natural gas at the power plant (LEBS).
81
It is not enough to simply improve the limestone scrubbing process because the impacts are primarily dueto the production of limestone, not its use. The majority, 89%, of the total system particulate emissions,and 25%-28% of the non-coal system energy consumption, come from limestone production. Unlesstechnologies can be developed that reduce the impact of this clean-up process, the overall environmentalimpacts of power plants using limestone FGC will remain unchanged. Another option that will becompared to these technologies in a future LCA is an IGCC plant which utilizes gas cooling, scrubbing,acid gas removal, and sulfur recovery instead of limestone FGC. Scrubbing would be done with water,which can be treated and recycled, but some solid waste requiring disposal will be created. The acid gasremoval system that removes sulfur compounds would consist of a solvent flowing between an absorberand stripper column. The hydrogen sulfide and sulfur dioxide would then be reacted via the Clausreaction (2 H S + SO á 3 S + 2 H O) to produce elemental sulfur. However, no assumptions should2 2 2
be made regarding the environmental burdens from this technology relative to the three coal-fired powerplants presented in this report. Predicting the outcome of the IGCC technology is not possible withoutlooking at each process step in detail. It should not be assumed that the effects on the environment willbe less than the Average and NSPS systems, only that a possibility exists due to the different gas clean-uptechnology.
10.2 Methane from Coal Mining
Coal mining is the major contributor in the overall system to methane emissions; greater than 99% of thetotal methane emissions come from coal mining for the Average and NSPS systems and greater than 94%for the LEBS system. Higher rank coals, those containing more carbon, tend to contain more methanewithin the structure of the coal and in coalbed fractures. In general, the amount of methane released froma specific mine is a result of the temperature and pressure of the coal seam. Additionally, undergroundmines tend to emit higher amounts of methane than surface mines because the coal beds are deeper andtherefore under greater pressure. The option of capturing some of the methane from underground minesfor an alternative use was not explored in this LCA because the majority of U.S. coal mines vent methaneto the atmosphere. In 1996, the total amount of methane emissions from coal mining in the U.S. wereestimated to be 3.3 million Mg (U.S. EPA, 1998). Of this amount, 67% came from underground mines,13% was emitted from surface mines, and 20% resulted from post-mining activities. See Table 52, below,for a breakdown of the methane generated from each source (U.S. EPA, 1998). The amount of methanerecovered and used from underground mines was equivalent to 0.7 million Mg. This large amount is theresult of 15 coal mines residing primarily in the states of Alabama, New Mexico, and Wyoming that havedeveloped coalbed methane projects (U.S. EPA, 1998 and U.S. DOE, February 1995).
Table 52: Coal Mining Methane Emissions for 1996Mining type Mining activity Methane generated (million Mg)
Underground Post-mining 0.6
Underground mining 2.9
Recovered and used 0.7
Total = 2.8
Surface Post-mining 0.1
Surface mining 0.4
Total = 0.5
Total methane emitted = 3.3
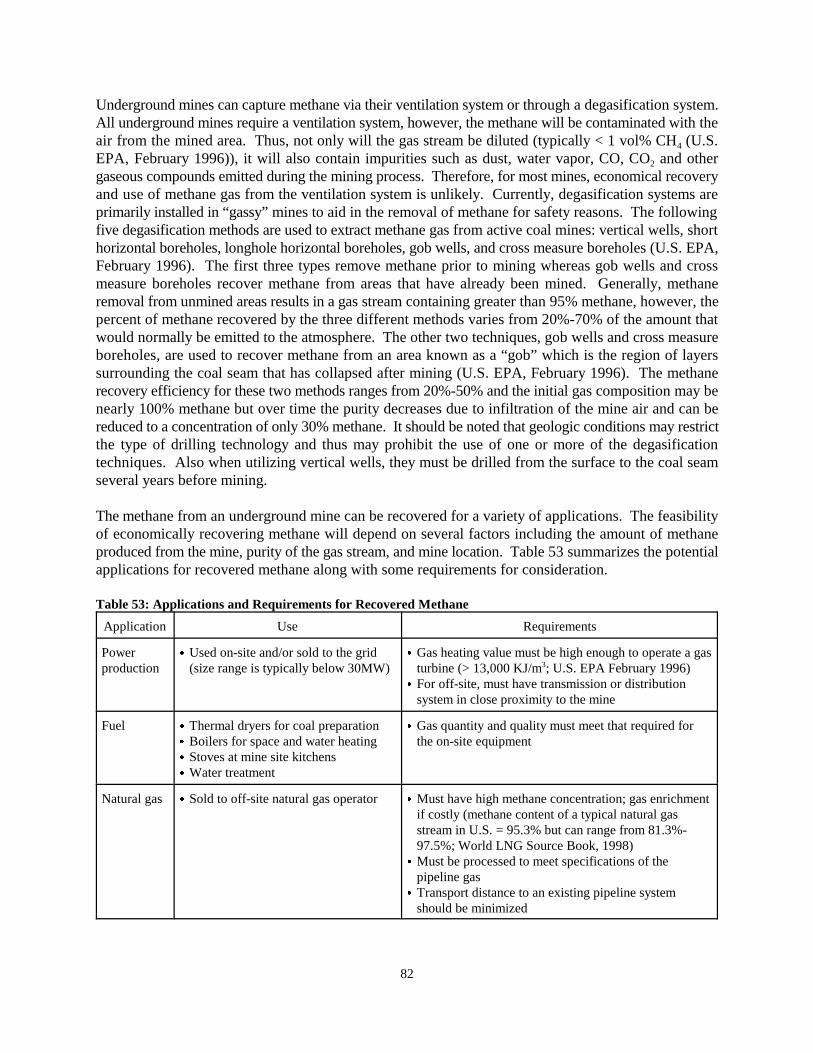
82
Underground mines can capture methane via their ventilation system or through a degasification system.All underground mines require a ventilation system, however, the methane will be contaminated with theair from the mined area. Thus, not only will the gas stream be diluted (typically < 1 vol% CH (U.S.4
EPA, February 1996)), it will also contain impurities such as dust, water vapor, CO, CO and other2
gaseous compounds emitted during the mining process. Therefore, for most mines, economical recoveryand use of methane gas from the ventilation system is unlikely. Currently, degasification systems areprimarily installed in “gassy” mines to aid in the removal of methane for safety reasons. The followingfive degasification methods are used to extract methane gas from active coal mines: vertical wells, shorthorizontal boreholes, longhole horizontal boreholes, gob wells, and cross measure boreholes (U.S. EPA,February 1996). The first three types remove methane prior to mining whereas gob wells and crossmeasure boreholes recover methane from areas that have already been mined. Generally, methaneremoval from unmined areas results in a gas stream containing greater than 95% methane, however, thepercent of methane recovered by the three different methods varies from 20%-70% of the amount thatwould normally be emitted to the atmosphere. The other two techniques, gob wells and cross measureboreholes, are used to recover methane from an area known as a “gob” which is the region of layerssurrounding the coal seam that has collapsed after mining (U.S. EPA, February 1996). The methanerecovery efficiency for these two methods ranges from 20%-50% and the initial gas composition may benearly 100% methane but over time the purity decreases due to infiltration of the mine air and can bereduced to a concentration of only 30% methane. It should be noted that geologic conditions may restrictthe type of drilling technology and thus may prohibit the use of one or more of the degasificationtechniques. Also when utilizing vertical wells, they must be drilled from the surface to the coal seamseveral years before mining.
The methane from an underground mine can be recovered for a variety of applications. The feasibilityof economically recovering methane will depend on several factors including the amount of methaneproduced from the mine, purity of the gas stream, and mine location. Table 53 summarizes the potentialapplications for recovered methane along with some requirements for consideration.
Table 53: Applications and Requirements for Recovered Methane
Application Use Requirements
Powerproduction
& Used on-site and/or sold to the grid(size range is typically below 30MW)
& Gas heating value must be high enough to operate a gasturbine (> 13,000 KJ/m ; U.S. EPA February 1996)3
& For off-site, must have transmission or distributionsystem in close proximity to the mine
Fuel & Thermal dryers for coal preparation& Boilers for space and water heating& Stoves at mine site kitchens& Water treatment
& Gas quantity and quality must meet that required forthe on-site equipment
Natural gas & Sold to off-site natural gas operator & Must have high methane concentration; gas enrichmentif costly (methane content of a typical natural gasstream in U.S. = 95.3% but can range from 81.3%-97.5%; World LNG Source Book, 1998)
& Must be processed to meet specifications of thepipeline gas
& Transport distance to an existing pipeline systemshould be minimized
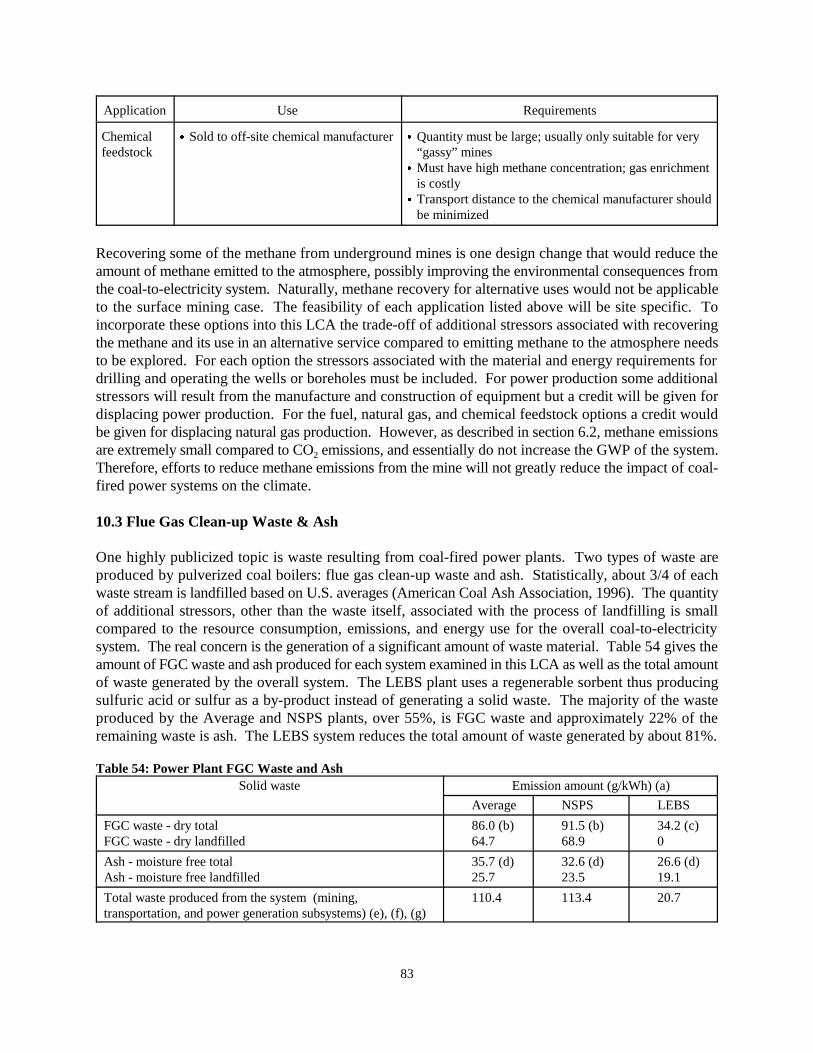
Application Use Requirements
83
Chemicalfeedstock
& Sold to off-site chemical manufacturer& Quantity must be large; usually only suitable for very“gassy” mines
& Must have high methane concentration; gas enrichmentis costly
& Transport distance to the chemical manufacturer shouldbe minimized
Recovering some of the methane from underground mines is one design change that would reduce theamount of methane emitted to the atmosphere, possibly improving the environmental consequences fromthe coal-to-electricity system. Naturally, methane recovery for alternative uses would not be applicableto the surface mining case. The feasibility of each application listed above will be site specific. Toincorporate these options into this LCA the trade-off of additional stressors associated with recoveringthe methane and its use in an alternative service compared to emitting methane to the atmosphere needsto be explored. For each option the stressors associated with the material and energy requirements fordrilling and operating the wells or boreholes must be included. For power production some additionalstressors will result from the manufacture and construction of equipment but a credit will be given fordisplacing power production. For the fuel, natural gas, and chemical feedstock options a credit wouldbe given for displacing natural gas production. However, as described in section 6.2, methane emissionsare extremely small compared to CO emissions, and essentially do not increase the GWP of the system.2
Therefore, efforts to reduce methane emissions from the mine will not greatly reduce the impact of coal-fired power systems on the climate.
10.3 Flue Gas Clean-up Waste & Ash
One highly publicized topic is waste resulting from coal-fired power plants. Two types of waste areproduced by pulverized coal boilers: flue gas clean-up waste and ash. Statistically, about 3/4 of eachwaste stream is landfilled based on U.S. averages (American Coal Ash Association, 1996). The quantityof additional stressors, other than the waste itself, associated with the process of landfilling is smallcompared to the resource consumption, emissions, and energy use for the overall coal-to-electricitysystem. The real concern is the generation of a significant amount of waste material. Table 54 gives theamount of FGC waste and ash produced for each system examined in this LCA as well as the total amountof waste generated by the overall system. The LEBS plant uses a regenerable sorbent thus producingsulfuric acid or sulfur as a by-product instead of generating a solid waste. The majority of the wasteproduced by the Average and NSPS plants, over 55%, is FGC waste and approximately 22% of theremaining waste is ash. The LEBS system reduces the total amount of waste generated by about 81%.
Table 54: Power Plant FGC Waste and AshSolid waste Emission amount (g/kWh) (a)
Average NSPS LEBS
FGC waste - dry totalFGC waste - dry landfilled
86.0 (b)64.7
91.5 (b)68.9
34.2 (c)0
Ash - moisture free totalAsh - moisture free landfilled
35.7 (d)25.7
32.6 (d)23.5
26.6 (d)19.1
Total waste produced from the system (mining,transportation, and power generation subsystems) (e), (f), (g)
110.4 113.4 20.7
84
(a) Numbers are per kWh of net electricity produced averaged over the life of the system.(b) For the base case 75.3% of FGC waste is landfilled.(c) Used in the production of elemental sulfur, sulfuric acid, or phosphate fertilizer. Thus ultimately this stream is not
a waste.(d) For the base case 72.0% of ash is landfilled. (e) Coal transportation = average user by river.(f) Results are reported for the surface mining case. However, the underground mining numbers are similar to those
listed here.(g) The amount of FGC waste and ash used in an alternative service is not included in this total.
A sensitivity analysis was performed on the amounts of FGC waste and ash recovered and used inalternative processes rather than landfilling (see section 8.4 for details). Obviously utilizing more ofeither the FGC waste or ash for an alternative service will reduce the total amount of waste produced fromthe system. However, the feasibility of utilizing either waste stream for another useful product dependson many factors, including the composition of the waste stream and the location of the coal-fired plantin relation to the processing plant or point of use for the alternative service.
11.0 Summary of Results and Discussion
Combustion of coal accounts for the majority of utility power generation in the United States; as a result,the additive environmental consequences of these systems can be quite large. Examining the resourceconsumption, energy requirements, and emissions from a life cycle point of view, including coal mining,transportation, and power production, can help to determine which areas have the greatest environmentalburdens. It may then be possible to focus on improving process steps that have a large impact on theenvironment and human health. The following text summarizes the major findings from this coal-to-electricity LCA.
11.1 CO Emissions2
In terms of total air emissions, CO is emitted in the greatest quantity, accounting for 98-99 wt% of the2
total air emissions for all systems examined. The majority, greater than 93%, of the CO is emitted from2
the power generation subsystem during coal combustion. Because this amount is so large, it overshadowsthe CO from the other process steps within the life cycle assessment. In the Average and NSPS systems,2
a very significant portion of the CO not produced by the combustion of coal is generated while2
manufacturing the limestone and during the limestone scrubbing reaction. For these two systems, anothermajor source of CO is coal transportation. For the LEBS system a significant amount of CO also comes2 2
from the transportation subsystem. However, because the traditional limestone scrubbing system isreplaced with the copper oxide process, a large portion of the non-coal CO generated from this system2
is due to natural gas production and combustion for sorbent regeneration.
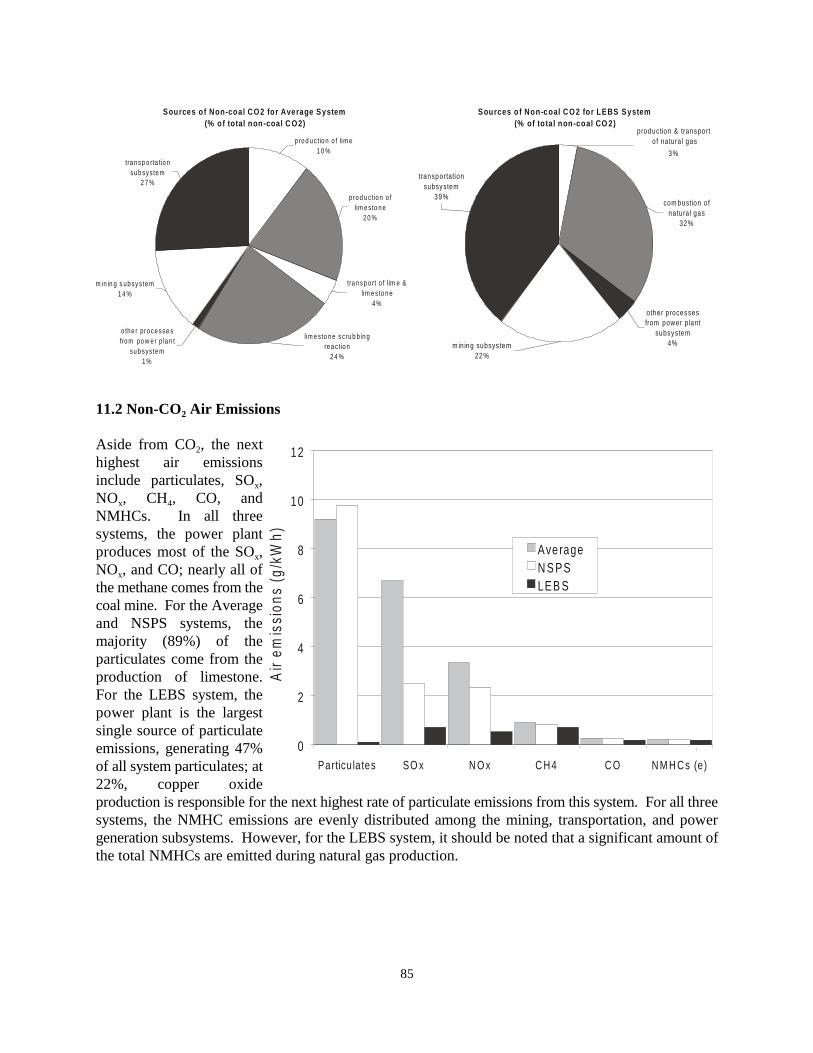
Sources o f Non-coal CO2 fo r Average System(% o f total non-coal C O2)
tra n sp o rt o f l im e & lim e s to n e
4 %
p ro d u c tio n o f lim e s to n e
2 0 %
m in in g s ub sy s te m1 4 %
tra n sp o rta tio n su b sys te m
2 7 %
lim e sto n e s cru b b in g re a c tio n
2 4 %
o the r pro ce sse s fro m po w e r p la n t
su b sys te m1 %
p ro d u c tio n o f lim e1 0 %
Sources o f Non-coal C O2 fo r LEBS System(% of to ta l non-coal CO 2)
other proces ses from power plant
subsy stem4%
com bustion of na tura l gas
32%
m ining subsys tem22%
transportation subsy stem
39%
production & trans po rt o f natura l gas
3%
0
2
4
6
8
10
12
Particu la tes SO x N O x C H 4 C O N M H C s (e)
Ave rageN S PSLEB S
Air
emis
sion
s (g
/kW
h)
85
11.2 Non-CO Air Emissions2
Aside from CO , the next2
highest air emissionsinclude particulates, SO ,x
NO , CH , CO, andx 4
NMHCs. In all threesystems, the power plantproduces most of the SO ,x
NO , and CO; nearly all ofx
the methane comes from thecoal mine. For the Averageand NSPS systems, themajority (89%) of theparticulates come from theproduction of limestone.For the LEBS system, thepower plant is the largestsingle source of particulateemissions, generating 47%of all system particulates; at22%, copper oxideproduction is responsible for the next highest rate of particulate emissions from this system. For all threesystems, the NMHC emissions are evenly distributed among the mining, transportation, and powergeneration subsystems. However, for the LEBS system, it should be noted that a significant amount ofthe total NMHCs are emitted during natural gas production.
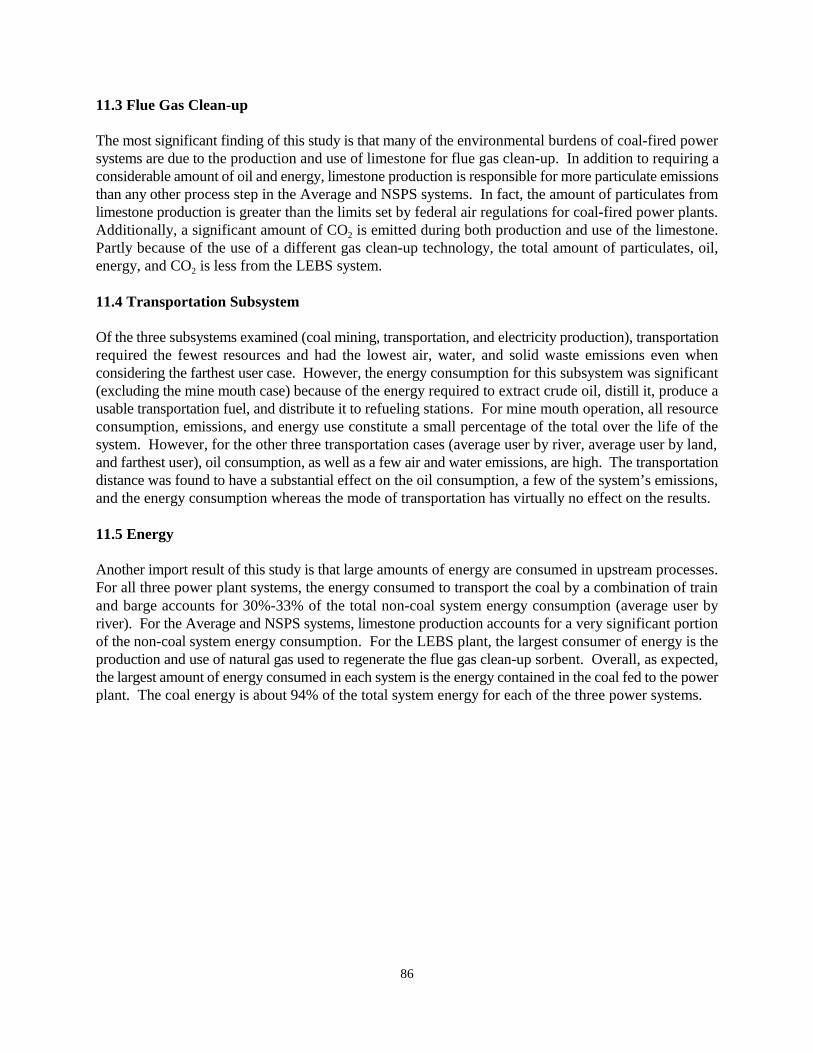
86
11.3 Flue Gas Clean-up
The most significant finding of this study is that many of the environmental burdens of coal-fired powersystems are due to the production and use of limestone for flue gas clean-up. In addition to requiring aconsiderable amount of oil and energy, limestone production is responsible for more particulate emissionsthan any other process step in the Average and NSPS systems. In fact, the amount of particulates fromlimestone production is greater than the limits set by federal air regulations for coal-fired power plants.Additionally, a significant amount of CO is emitted during both production and use of the limestone.2
Partly because of the use of a different gas clean-up technology, the total amount of particulates, oil,energy, and CO is less from the LEBS system. 2
11.4 Transportation Subsystem
Of the three subsystems examined (coal mining, transportation, and electricity production), transportationrequired the fewest resources and had the lowest air, water, and solid waste emissions even whenconsidering the farthest user case. However, the energy consumption for this subsystem was significant(excluding the mine mouth case) because of the energy required to extract crude oil, distill it, produce ausable transportation fuel, and distribute it to refueling stations. For mine mouth operation, all resourceconsumption, emissions, and energy use constitute a small percentage of the total over the life of thesystem. However, for the other three transportation cases (average user by river, average user by land,and farthest user), oil consumption, as well as a few air and water emissions, are high. The transportationdistance was found to have a substantial effect on the oil consumption, a few of the system’s emissions,and the energy consumption whereas the mode of transportation has virtually no effect on the results.
11.5 Energy
Another import result of this study is that large amounts of energy are consumed in upstream processes.For all three power plant systems, the energy consumed to transport the coal by a combination of trainand barge accounts for 30%-33% of the total non-coal system energy consumption (average user byriver). For the Average and NSPS systems, limestone production accounts for a very significant portionof the non-coal system energy consumption. For the LEBS plant, the largest consumer of energy is theproduction and use of natural gas used to regenerate the flue gas clean-up sorbent. Overall, as expected,the largest amount of energy consumed in each system is the energy contained in the coal fed to the powerplant. The coal energy is about 94% of the total system energy for each of the three power systems.
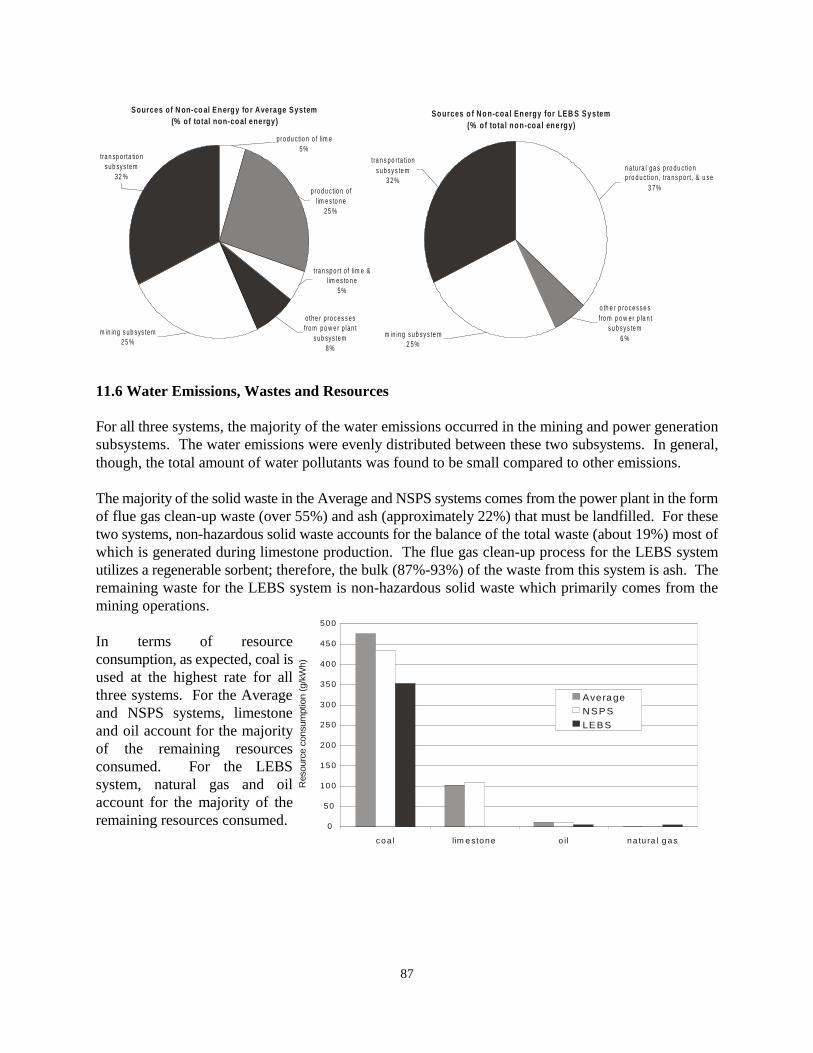
Sources o f No n-coa l En ergy for LEB S Sy stem(% o f to ta l non-coa l ene rgy)
m in ing s ub sy s te m2 5%
o th e r p ro ce ss e s fro m p o w er p la n t
s u b sy s te m6 %
tra n s po rta tion s u b sy s te m
3 2%
n atu ra l ga s p ro du c tio np ro d u c tio n , tra ns p o rt, & u se
3 7%
Sources of N on-co al Energy fo r Average System(% of to tal non-coal energy)
t ra n sp o rt o f lim e & lim e s to n e
5%
pro du c tio n o f lim e s to n e
25 %
tra n sp o rta tio n s ub sys tem
32 %
othe r p ro c es s es fro m po w e r p lan t
s ub sys tem8%
m in in g s ub sys tem25 %
pro du c tio n o f lim e5%
0
50
100
150
200
250
300
350
400
450
500
coa l lim e stone o il na tu ra l g as
Average
N SPS
LEBS
Res
ourc
e co
nsum
ptio
n (g
/kW
h)
87
11.6 Water Emissions, Wastes and Resources
For all three systems, the majority of the water emissions occurred in the mining and power generationsubsystems. The water emissions were evenly distributed between these two subsystems. In general,though, the total amount of water pollutants was found to be small compared to other emissions.
The majority of the solid waste in the Average and NSPS systems comes from the power plant in the formof flue gas clean-up waste (over 55%) and ash (approximately 22%) that must be landfilled. For thesetwo systems, non-hazardous solid waste accounts for the balance of the total waste (about 19%) most ofwhich is generated during limestone production. The flue gas clean-up process for the LEBS systemutilizes a regenerable sorbent; therefore, the bulk (87%-93%) of the waste from this system is ash. Theremaining waste for the LEBS system is non-hazardous solid waste which primarily comes from themining operations.
In terms of resourceconsumption, as expected, coal isused at the highest rate for allthree systems. For the Averageand NSPS systems, limestoneand oil account for the majorityof the remaining resourcesconsumed. For the LEBSsystem, natural gas and oilaccount for the majority of theremaining resources consumed.
88
11.7 Surface versus Underground Mining
Overall, the environmental impacts from surface and underground mining are not significantly differentin any of the three power plant systems examined. The main difference between these two miningtechniques is that the surface mining subsystem results in a higher amount of airborne ammonia emissionsdue to the production of ammonium nitrate explosives which are used at the mine. Another importantdifference is that underground mining requires limestone which emits a large amount of particulatesduring its production. Therefore the particulate emissions will be higher for underground mining thanfor surface mining.
11.8 Sensitivity Analysis Findings
The sensitivity analysis identified the parameters that most affect the stressors produced by these systems.Overall, parameters that appreciably decrease the amount of coal consumed will impact the results of thestudy. In the case of coal consumption, the direct use of coal and the indirect requirements (e.g.,transportation, limestone) related to the use of coal, are responsible for the vast majority of all emissions,resource consumption, and energy use.
11.9 Improvement Opportunities
Design changes can be made in several areas to improve the environmental impact of coal-fired powerplants. Any parameter that reduces the coal consumption will have the largest effect on decreasing thesystems resource consumption, energy usage, air and water emissions, and waste. Because the largestportion of several stressors comes from limestone production and use, changing the type of gas clean-upwill affect the oil usage, energy consumption, particulate and CO emissions, and waste. Likewise, using2
the flue gas clean-up waste and ash in an alternative service can significantly reduce the total amount ofwaste from the system. However, factors such as the location of the power plant, waste composition,and economics play a large role in the plant’s ability to incorporate the waste into a useful product.Additionally, the majority of the methane emissions come from the coal mine, therefore capturing themethane for uses such as power production, fuel use at the mine site (for water treatment or coalpreparation), or additional natural gas supply may improve the environmental consequences of coal-firedpower systems.
12.0 Future Work
The primary goal of this life cycle assessment is to assess the environmental aspects of producingelectricity from a coal-fired power system. The focus of this initial work was on an inventory of allresources, environmental emissions, and energy flows of the system, studied in a cradle-to-grave manner.Ultimately, the resulting stressors will be compared to a previously completed LCA of electricityproduction from a biomass IGCC power plant (Mann and Spath, 1997). The next step will be to examineanother power generation option of co-firing biomass in a coal-fired boiler. Additionally, LCA studieswill be conducted on direct-fired biomass combustion and biomass gasification cofiring systems. Anothercoal technology, IGCC, using coal gasification, cold gas clean up, a gas turbine and a steam cycle willbe investigated. Also, a natural gas system will be studied for comparison to the biomass and coalsystems.
89
13.0 Related Studies
The following is a brief summary of publications related to this LCA. This list was generated fromliterature found while performing this assessment and therefore is not all inclusive of the previouslypublished studies related to life cycle assessment of coal-to-electricity systems. In the past, much hasbeen reported on the emissions and wastes from coal-fired power plants; however, little has been donefrom a life cycle point of view. Data from some of these sources were used in this LCA, as documentedin the main body of this report.
DynCorp EENSP, Inc. (1995).A life cycle assessment of CO and methane emissions from various renewable and non-renewable2
electricity production technologies was performed. The coal technology examined was a 500 MWpulverized coal steam boiler system and the assessment included surface mining and transportation.Additional air emissions as well as resource consumption, energy use, water emissions and waste werenot evaluated. Emissions factors from a modified version of the TEMIS model were used.
Nieuwlaar et al. (1996).The article briefly describes LCA and the methodology they used in evaluating energy productionsystems. The following case studies were examined with their streamlined LCA method: gas enginecogeneration of heat and power, photovoltaic solar cell systems, and coal IGCC. The article stated thatcoal mining, treatment, and transport, were included in the IGCC study in addition to power plantconstruction, operation, and decommissioning. No details were given in this article; however, a documenttitled “Life Cycle Assessment of Integrated Coal Gasification Combined Cycle” is referenced and thisreport is discussed below. The results are categorized into energy use, waste production, exhaustion ofraw materials, global warming, and acidification. A summary of some of the results for the six impactcategories is given for each system examined.
Nieuwlaar and Smit (November 1994).This report gives the results of a life cycle assessment for a 600 MW coal IGCC system. The followingpower plant sections were included: an oxygen blown Shell gasifier, cyclone particulate removal, aselective absorbent (Slufinol) desulfurization section, a Claus unit, a Scot unit, a gas turbine, a HRSG,and a steam turbine. Coal mining and transport were also assessed. 50% of the coal is assumed to comefrom surface mining and the other half from underground mining. Since this study was done for a sitelocated in the Netherlands, transportation of coal was assumed to be primarily from foreign sources inthe U.S., Australia, Columbia, India, and Poland. Although detailed results are not given in the report,many of the conclusions are consistent with those obtained in the present study. The power plant is themajor source of environmental impacts, a conclusion that corroborates our findings. Additionally, theyfound that recovering methane from the coal mine will not have a large impact on the total globalwarming value of the system. We found this to be true because even though the GWP of methane is 21times higher than CO , the amount of methane emitted is much smaller and therefore does not2
significantly change the GWP of the overall system. In contrast to our findings, their study shows nowaste from the power plant, at a minimum, there is ash removed from the cyclone separators. They donot state what they do with the ash but it would not be reasonable to assume that 100% of the ash is usedin some alternative source. Some portion of the ash must be landfilled. Like Nieuwlaar’s 1996 article,listed above, the results are categorized into energy use, waste production, exhaustion of raw materials,global warming, and acidification. Exhaust of raw materials is shown to come solely from constructingthe power plant. Because coal transport occurs over such long distances there should be a significant
90
amount of oil consumed by this subsection. It is not clear why this does not show up in the exhaustionof raw materials category. This study includes the materials for constructing the power plant and thetransportation vessels. It also includes the chemicals required in the gas clean-up and waste watertreatment; however, it does not include any of the upstream process required for producing the chemicalsand transporting them to the power plant. Overall, the study summarizes many important aspects ofelectricity production from coal using IGCC technology, however, a few details are lacking making someof their conclusions incomplete.
Oak Ridge National Laboratory and Resources for the Future. (September 1994).Rather than a life cycle assessment, this study was primarily a methodology for estimating externalitiesof a coal fuel cycle including mining, transportation, and electricity generation as well as construction ofthe power plant. The technology examined is a pulverized fuel plant. Two specific cites are evaluated:east Tennessee and the Four Corners Region of New Mexico. The study considers health (employees andthe public), environmental (ecosystem impacts), and non-environmental impacts (road damage,employment benefits, energy security, etc.).
Swiss Agency for the Environment, Forests and Landscape. (1998).This is a study of cradle-to-grave inventories for aluminum, glass, plastics, paper, cardboard, andcorrugated board, and steel sheets. The inventories include the following stressors: resources, energy,air emissions, water pollutants, and wastes. This two-volume report also gives the resource requirementsand air and water emissions for six different electricity production systems: natural gas, oil, brown coal,hard coal, nuclear, and hydroelectric. However, details regarding resource extraction methods, modesof transportation, and power plant design/parameters are not included.
Vattenfall. (1996).This document outlines the LCA work that Vattenfall has done for the following electricity generationsystems: hydro, nuclear, oil condensing, natural gas combined-cycle, gas turbine, wind, and biofueledcombined heat and power. The assessments are cradle-to-grave, incorporating aspects such asconstruction, demolition, and transportation, but only a select number of stressors were examined. Elevenresources were inventoried in these LCAs, the water emissions were recorded as the total amount ofnitrogen, and the waste was categorized into radioactive, demolition and other. The only air emissionsexamined were NO , SO , CO, dust, HC, and CO . It is not clear what is included in the HC category butx 2 2
since CH is one greenhouse gas that contributes to climate change it should probably be spelled out4
separately. The results of the life-cycle studies are being reviewed by Chalmers Contract ResearchOrganization and the Swedish Environmental Research Institute.
Waku et al. (1995).Energy and CO emissions were examined in a cradle-to-grave LCA for LNG combined cycle and coal2
IGCC systems incorporating CO recovery and sequestration. This paper briefly summarizes these results2
which come from on going research activities sponsored by New Energy and Industrial TechnologyDevelopment Organization. They define net energy ratio to be the total energy produced by the systemdivided by the total energy required for construction, operation, and maintenance of the system. Thisnumber does not include the energy in the natural gas or coal and therefore can only be compared to ourexternal energy ratio. It appears that no other stressors have been examined but that their next step is toinclude inventories of air emissions such as NO and SO .x x

91
14.0 Acknowledgments
We would like to acknowledge the U.S. Department of Energy’s Biomass Power Program for fundingthis work, and John Marano and Massood Ramezan for providing the power plant operating data. Dr.Richard Bain, Dr. Ralph Overend, and Kevin Craig also provided extensive technical guidance andreview. Additionally, our thanks to the many people outside of NREL who have contributed their timeand effort in assisting us, specifically, Dr. Matt Hrebar from the Colorado School of Mines MiningDepartment for providing ideas on how to find the best references and data for the coal mining subsystem,and Vince Camobreco of Ecobalance for his technical support for the TEAM and TEAM Plus software.® ®
92
15.0 References and Pertinent Literature
U.S. Department of Health and Human Services. (1993). Agency for Toxic Substances and DiseaseRegistry (ATSDR). Atlanta, Georgia.
American Coal Ash Association. (1996). Annual Coal Combustion Product (CCP) Survey Report. 1996Coal Combustion Product (CCP)- Production and Use (Short Tons). 2760 Eisenhower Avenue,Suite 304, Alexandria, VA 22314-4553.
Barry Lawson Associates. (1997). Co-Firing II - Cofiring Coal and Biomass in Utility Boilers. Reportof a One-Day Forum. Sponsored by U.S. DOE - Office of Utility Technologies, Northeast RegionalBiomass Program, Southeast Regional Biomass Program, and Great Lakes Regional BiomassProgram, January.
Barton, K. (1976). Protection Against Atmospheric Corrosion. London: John Wiley & Sons, Inc.
Bechtel; Amoco. (March 1993). Direct Coal Liquefaction Baseline Design and System Analysis. FinalReport on Baseline and Improved Baseline. Volume III Options to Baseline Design. Workedperformed for the U.S. Department of Energy under contract #DEAC22 90PC89857.
Benson, S.A.; Steadman, E.N.; Mehta, A.K.; Schmidt, C.E. (1994). Trace Element Transformations inCoal-Fired Power Systems. Amsterdam: Elsevier.
Brady, J.E.; Humiston, G.E. (1982). General Chemistry: Principles and Structure. New York: JohnWiley & Sons, Inc.
Boustead, I.; Hancock, G.F. (1979). Handbook of Industrial Energy Analysis. New York: John Wiley& Sons, pp. 120–146.
Budavari, S.; O’Neil, M.J.; Smith, A.; Heckelman, P.E; Kinneary, J.F. (1996). The Merck Index: AnEncyclopedia of Chemicals, Drugs, and Biologicals. Twelfth Edition. Whitehouse Station, NJ:Merck & Co.
Bunce, N. (1994). Environmental Chemistry. Second Edition. Winnepeg: Wuerz Publishing.
Chameides, W.L.; Perdue, E.M. (1997). Biogeochemical Cycles. New York: Oxford University Press.
Coal Age Equipment Guide. (1982). McGraw-Hill, Inc., New York, New York.
Collins, S. (June 1994). “Gas Turbine Power Plants - Special Report.” Power. Vol. 138. No. 6.
Colorado Energy Research Institute. (April 1976). Summary Report. Net Energy Analysis: An EnergyBalance Study of Fossil Fuel Resources. Golden, CO.
Combustion Engineering, Inc. (1981). Combustion, Fossil Power Systems: A Reference Book on FuelBurning and Steam Generation. 3rd Edition.
93
Cothern, C.R.; Smith, J.E., Jr. (1987). Environmental Radon. New York: Plenum Press.
Damberger, H.; Stiff, B.; Hines, J. (1997). Coal Industry in Illinois. Illinois State Geological Survey.Champaign, IL.
Damberger, H. (1998). Personal correspondence. Illinois State Geological Survey. Champaign, IL.
Darguzas, J.N.; Giermak, E.A.; Gielda, G.S.; Litka, A.F. (1997). “Engineering Development ofAdvanced Coal-Fired Low Emission Boiler Systems (LEBS). Phase III Report, Volume II - RevisedCommercial Generating Unit Design,” submitted by DB Riley, Inc., Worchester, Massachusetts.Prepared for the U.S. Department of Energy. Federal Energy Technology Center. DOE contract no.DE-AC22-92PC92158.
Duda, J.R.; Hemingway, E.L. (1976). Basic Estimated Capital Investment and Operating Costs forUnderground Bituminous Coal Mines Developed for Longwall Mining. U.S. Department of theInterior. Bureau of Mined Information Circular 8715.
DynCorp EENSP, Inc. (1995). Assessment of the Environmental Benefits of Renewables Deployment:A Total Fuel Cycle Analysis of the Greenhouse Gas Impacts of Renewable Generation Technologiesin Regional Utility Systems. Prepared for the National Renewable Energy Laboratory, contract no.DE-AC02-83CH10093, May.
Ecobalance, Inc. (1997). Comparison of Coal Combustion Products (CCPs) Used as Structural FillMaterial vs. Disposal in a Landfill Using the Life Cycle Assessment Framework. Prepared for theAmerican Coal Ash Association, 2760 Eisenhower Avenue, Suite 304, Alexandria, VA 22314-4553,September.
Encyclopedia Americana, Intl. Ed. (1986). Danbury, CT: Grolier Inc.
Evans, R.J.; Bitler, J.R. (1977). Coal Surface Mining Reclamation Costs. U.S. Department of theInterior. Bureau of Mines Information Circular 8695.
Finlayson-Pitts, B.J; Pitts, J.N., Jr. (1986). Atmospheric Chemistry: Fundamentals and ExperimentalTechniques. New York: John Wiley & Sons, Inc.
GAI Consultants, Inc. (1995). Coal Ash Disposal Manual: Third Edition. Prepared for the ElectricPower Research Institute, report no. EPRI TR-104137, research project no. 3176-7, January.
Green, L.E.; Palowitch, E.R. (1977). Comparative Shortwall and Room-and-Pillar Mining Costs. U.S.Department of the Interior. Bureau of Mines Information Circular 8757.
Hinser, D. (1998). Personal correspondence. Joy Mining Machinery Products. Franklin, PA.
Houghton, J.T.; Meira Filho, L.G.; Callander, B.A.; Harris, N.; Kattenberg, A.; Maskell, K., eds. (1996).Climate Change 1995. The Science of Climate Change. Published for the Intergovernmental Panelon Climate Change. New York: Cambridge University Press.
94
IFC Resources Incorporated. (1990). Methane Emissions From Coal Mining. Prepared for the UnitedStates Environmental Protection Agency. Office of Air and Radiation. EPA-400/9-90/008.Washington, D.C.
Illinois Coal Development Board. (1996). Outlook for the Illinois Coal Industry. October.
Illinois State Department of Natural Resources. Office of Mines and Minerals. (1996). Annual CoalMine Operator Report. Year ending 1996.
Inland Waterways Mileage Guide. (1980). Jeffersonville, IN: American Commercial Barge LineCompany.
Keeling, C.D.; Whorf, T.P. (August 1998). Scripps Institution of Oceanography (SIO). University ofCalifornia. La Jolla, California. 92093-0220.
Keeth, R.J.; Miranda, J.E.; Reisdorf, J.B.; Scheck,R.W. (1983). Economic Evaluation of FGD Systems.Volume 1: Throwaway FGD Processes, High- and Low-Sulfur Coal. EPRI CS-3342. ResearchProject 1610-1. Denver, CO: Stearns-Roger Engineering Corporation, December.
Keolian, G.A.; Lewis, G. (1997). Application of Life-cycle Energy Analysis to Photovoltaic ModuleDesign. Progress in Photovoltaics: Research and Application. Vol. 5, pp. 287-300.
Kerr, R. (1998). Personal correspondence. Earthmoving Machinery Inc. Denver, CO.
Kirk-Othmer's Encyclopedia of Chemical Technology. (1993). 4th Edition, Vol. 1, pp. 764; Vol. 2,pp. 693-694; Vol. 5, pp. 40; Vol. 23, pp. 446-447.
Kirkwood, R.C.; Longley, A.J. (1995). Clean Technology and the Environment. London: Chapman &Hall.
Kofstad, P. (1988). High Temperature Corrosion. London: Elsevier Applied Science.
Ladino, R.H.; Miller E.H.; Waltz, R.J.; Leaver, D.E.; Brown R.G. (1982). Engineering Assessment ofan Advanced Pulverized-Coal Power Plant. Westinghouse Electric Corporation. Final Report. EPRICS-2223.
Laidler, K.J.; Meiser, J.H. (1995). Physical Chemistry. Second Edition. Boston: Houghton MifflinCompany.
Larinoff, M. (October, 1994). Specifying Better-Performing Air Cooled Condensers. PowerEngineering. Vol. 98. No. 10. pg 37.
Levi, B.G.; Hafemeister, D.; Scribner, R. (1992). “Global Warming: Physics and Facts.” AIPConference Proceedings No. 247; Washington, D.C. American Institute of Physics.
Lucas, Criss. (1998). Personal correspondence. Norberg Sales Corp., Western Region. Englewood, CO.
95
Macalady, D.L. (1998). Perspectives in Environmental Chemistry. New York: Oxford UniversityPress.
Mann, M.K.; Spath, P.L. (1997). Life Cycle Assessment of a Biomass Gasification Combined-CyclePower System. National Renewable Energy Laboratory, Golden, CO, TP-430-23076.
Martin, P. (1998). Personal correspondence. Martin Consultants, Inc. Golden, CO.
Martin, J.W.; Martin, T.J.; Bennett, T.P.; Martin, K.M. (1982). Surface Mining Equipment. FirstEdition. Martin Consultants, Inc., Golden, CO.
Meridian Corporation. (1989). Energy System Emissions and Material Requirements, for the U.S.Department of Energy, Deputy Assistant Secretary for Renewable Energy, Washington, D.C.,February.
Moran, M.J. (1989). Availability Analysis - A Guide to Efficient Energy Use. Corrected Edition.American Society of Mechanical Engineers Press. New York.
National Research Council. (1991). Rethinking the Ozone Problem in Urban and Regional AirPollution. National Academy Press, Washington, D.C.
Nieuwlaar, E.; Alsema, E.; Van Engelenburg, B. (1996). “Using Life-Cycle Assessments for theEnvironmental Evaluation of Greenhouse Gas Mitigation Options.” Energy ConversionManagement. Vol. 37, No. 6-8, pp. 831-836.
Nieuwlaar, E.; Smit, R. (November 1994). Life Cycle Assessment of Integrated Coal GasificationCombined Cycle. Utrecht University. Department of Science, Technology and Society. ReportNo. 94021.
Oak Ridge National Laboratory and Resources for the Future. (September 1994). EstimatingExternalities of Coal Fuel Cycles. Report No. 3 on the External Costs and Benefits of FuelCycles. Work performed for the U.S. Department of Energy and the Commission of theEuropean Communities. Published by Utility Data Institute and Integrated Resource PlanningReport. McGraw Hill, Inc.
Office of the Federal Register National Archives and Records Administration. (October 1998) Code ofFederal Regulations. Protection of Environment. Title 40. Part II. Finding of SignificantContributions and Rulemaking for Certain States in the Ozone Transport Assessment GroupRegion for Purposes of Reducing regional Transport of Ozone; Rule. Parts 51, 72, 75, and 96..
Office of the Federal Register National Archives and Records Administration. (July 1996) Code ofFederal Regulations. Protection of Environment. Title 40. Part 60.
International Energy Agency, Organization for Economic Co-operation and Development (IEA/OECD).(1991). Greenhouse Gas Emissions: The Energy Dimension. Paris, France: OECD.
Peele, R. (1927). Mining Engineers’ Handbook. Second Edition. John Wiley & Sons, Inc.
96
Persse, F.H.; Lockhard, D.W.; Lindquist, A.E. (1977). Coal Surface Mining Reclamation Costs in theWestern United States. U.S. Department of the Interior. Bureau of Mines Information Circular8737.
Pimentel, D. (1980). Handbook of Energy Utilization in Agriculture. Boca Raton, Florida: CRC Press,Inc.
Radziwon, A.; Winter, E. (1996). Summary of Air Toxics Emissions Testing at Sixteen Utility PowerPlants. Prepared for the U.S. Department of Energy by Burns and Roe Services Corporation,contract no. DE-AC22-94PC92100, July.
Rand McNally Commercial Atlas and Marketing Guide. (1994). 125th ed. Chicago, IL: Rand McNally& Co.
Ruth, L.A. (1997). “The U.S. Department of Energy’s Combustion 2000 Program: Clean, EfficientElectricity from Coal.” Energy Conversion Management. Vol. 38, No. 10-13, pp. 1249-1257.
Schultz, S.C.; Kitto, J.B. (1992). STEAM Its Generation and Use. Barberton, Ohio: Babcock &Wilcox.
Schlesinger, W.H. (1991). Biogeochemistry: An Analysis of Global Change. San Diego: AcademicPress.
SETAC Foundation. (1991). A Technical Framework for Life-Cycle Assessment. Society ofEnvironmental Toxicology and Chemistry and SETAC Foundation for Environmental Education,Inc., Washington, D.C.
Shreir, L.L. (1978). Corrosion, Vol. 1: Metal/Environment Reactions. London: Newnes-Butterworths.
Sidney, K.; Hemingway, E.L.; Berkshire, L.H. (1976). Basic Estimated Capital Investment andOperating Costs for Coal Strip Mines. U.S. Department of the Interior. Bureau of MinedInformation Circular 8703.
Society for Environmental Toxicology and Chemistry. (1997). “Life-Cycle Impact Assessment: TheState-of-the-Art.” Report of the SETAC LCA Impact Assessment Workgroup, SETAC LCAAdvisory Group.
Spindler, D. (1998). Personal correspondence and reclamation plan. State of Illinois. IllinoisDepartment of Natural Resources. 524 South Second Street, Springfield, IL.
SRI International. (1996). Chemical Economics Handbook. Limestone. 214.1000A.
Swiss Agency for the Environment, Forests and Landscape. (1998). Life Cycle Inventories forPackagings. Volume I & II. Environmental Series No. 250/I & II. Berne Swiss PackagingInstitute, Berne.
97
The American Institute of Mining, Metallurgical, and Petroleum Engineers, Inc. (1968). CoalPreparation. Third edition. Baltimore, Maryland: Port City Press, Inc.
The American Institute of Mining, Metallurgical, and Petroleum Engineers, Inc. (1968). Surface Mining.First Edition. York, Pennsylvania: The Maple Press Company.
Tyson, P.E.; Blackstock, T. (March 1995). “Coal Combustion Byproducts (CCBs)--Overview ofApplications and Opportunities in the U.S.A.” Society of Mining Engineers Annual Meeting.Denver, Colorado.
Ullmann's Encyclopedia of Industrial Chemistry. (1986). Vol. A2, pp. 261-263; Vol. A5, pp.172–173; Vol. A7, pp. 570–571, Weinheim (Federal Replublic of Germany): VCH.
Ullmann’s Encyclopedia of Industrial Chemistry. (1985). Fifth Edition. Weinheim (Federal Republicof Germany): VCH.
U.S. Department of Energy. (July 1998). Annual Energy Review 1997. Energy InformationAdministration, Office of Energy Markets and End Use. DOE/EIA-0384(97). Washington, D.C.
U.S. Department of Energy. (September 1996). A Comprehensive Assessment of Toxic Emissions fromCoal-Fired Power Plants: Phase I Results from the U.S. Department of Energy Study. Workperformed by Energy & Environment Research Center. Prepared for the U.S. Department ofEnergy, Pittsburgh Energy Technology Center and Morgantown Energy Technology Center,contract no. DE-FC21-93MC30097.
U.S. Department of Energy. (1996). Methane Emissions from Coal Mining and Post-Mining Activities,1989-1996. Revision of data from Emissions of Greenhouse Gases in the United States 1995.Energy Information Administration. DOE/EIA-0573(95). Washington, D.C.
U.S. Department of Energy. (February 1995). Coal Data: A Reference. Energy InformationAdministration, Office of Coal, Nuclear, Electric and Alternative Fuels. DOE/EIA-0064(93).Washington, D.C.
U.S. Department of Energy, Assistant Secretary for Environmental Protection, Safety, and EmergencyPreparedness. (1983). Energy Technology Characterizations Handbook, EnvironmentalPollution and Control Factors. Third edition, DOE/EP-0093, Washington, D.C.
U.S. Environmental Protection Agency. (March 1998). Inventory of U.S. Greenhouse Gas Emissionsand Sinks: 1990-1996. EPA-236-R-98-006. Office of Policy, Planning, and Evaluation.Washington, D.C.
U.S. Environmental Protection Agency. (February 1996). A Guide for Methane Mitigation Projects.Gas-to-Energy at Coal Mines. Draft (6202 J). Office of Air & Radiation. Developed for theCoalbed Methane Outreach Program. Edited by D. Kruger and C. Schultz.
98
U.S. Environmental Protection Agency. (1995). Compilation of Air Pollutant Emission Factors. UnitedStates Environmental Protection Agency. AP-42. Vol. 1, parts 1, 2, and 3; Stationary Point andArea Sources. Ann Arbor, MI.
U.S. Environmental Protection Agency. (1995). Toxics Release Inventory. Office of PollutionPrevention. Washington, D.C.
U.S. Environmental Protection Agency. (September 1991). Toxics in the Community: National andLocal Perspectives. EPA Office of Toxic Substances. Washington, D.C.
U.S. Environmental Protection Agency. (1985). Compilation of Air Pollutant Emission Factors. UnitedStates Environmental Protection Agency. AP-42. Vol. 1, parts 1, 2, and 3; Stationary Point andArea Sources. Ann Arbor, MI.
Utility Data Institute. (1993). Scrubber Database, cost and performance. Utility Data Institute, 1700 KStreet N.W., Suite 400, Washington, D.C., 20006.
Utility Data Institute. (1993). U.S. Coal Plant Statistics, UDI-022-93, April. Utility Data Institute, 1700K Street N.W., Suite 400, Washington, D.C., 20006.
Utility Data Institute. (1996). UDI Environmental Database. Utility Data Institute, 1700 K Street N.W.,Suite 400, Washington, D.C., 20006.
Vattenfall. (1996). Life Cycle Assessment for Vattenfall’s Electricity Generation. Summary Report. S-16287 Stockholm, Sweden.
Waku, H.; Tamura, I.; Inque, M.; Akai, M. (1995). “Life Cycle Analysis of Fossil Power Plant with CO2
Recovery and Sequestering System.” Energy Conversion Management. Vol. 36, No. 6-9, pp.877-880.
Walas, S.M. (1988). Chemical Processes and Equipment: Selection and Design. ButterworthsMonographs in Chemical Engineering. Butterworth-Heinmann.
Warneck, P. (1988). Chemistry of the Natural Atmosphere. San Diego: Academic Press.
Watson, R.T.; Zinyowera, M.C.; Moss, R.H.; Dokken, D.J., ed. (1998). The Regional Impacts ofClimate Change: An Assessment of Vulnerability. Published for the Intergovernmental Panel onClimate Change. New York: Cambridge University Press.
Wayne, R.P. (1991). Chemistry of Atmospheres. Oxford: Oxford University Press.
World LNG Source Book. (1998). Zeus Development Corporation. Houston, Texas.
Zakrzewski, S.F. (1991). Principles of Environmental Toxicology. Washington, D.C.: AmericanChemical Society.

Appendix A: Graphical Representation of the LCA System in TEAM®
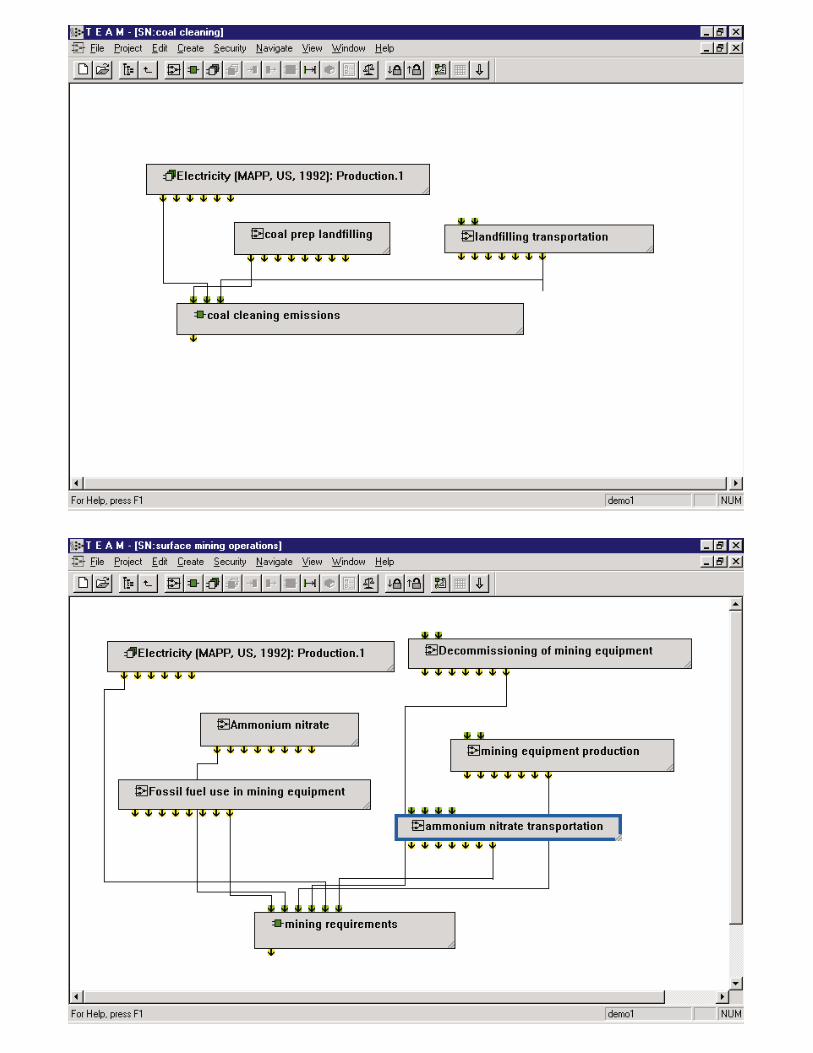
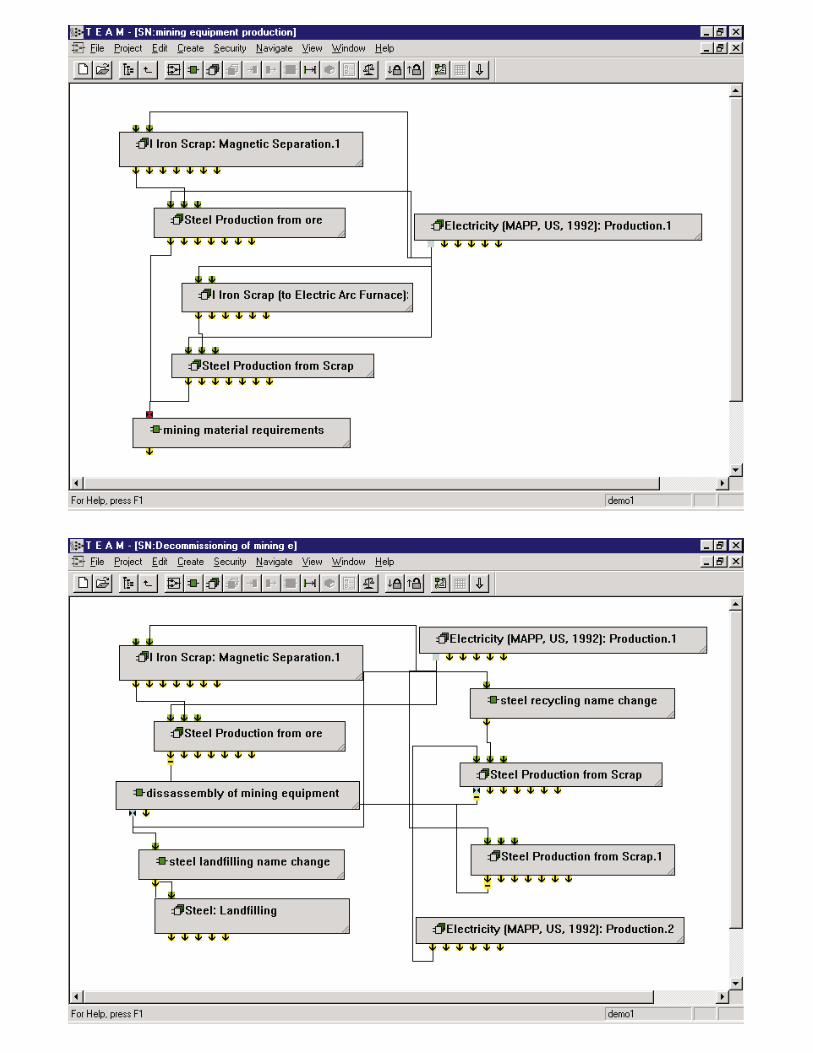
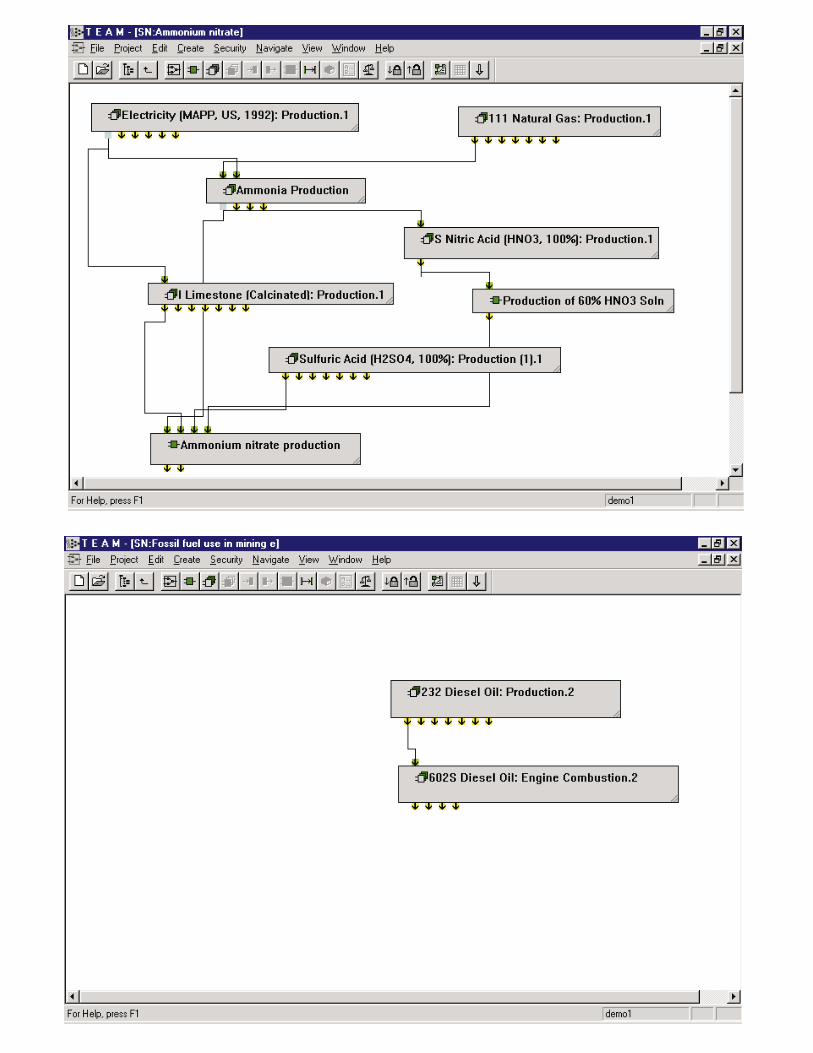
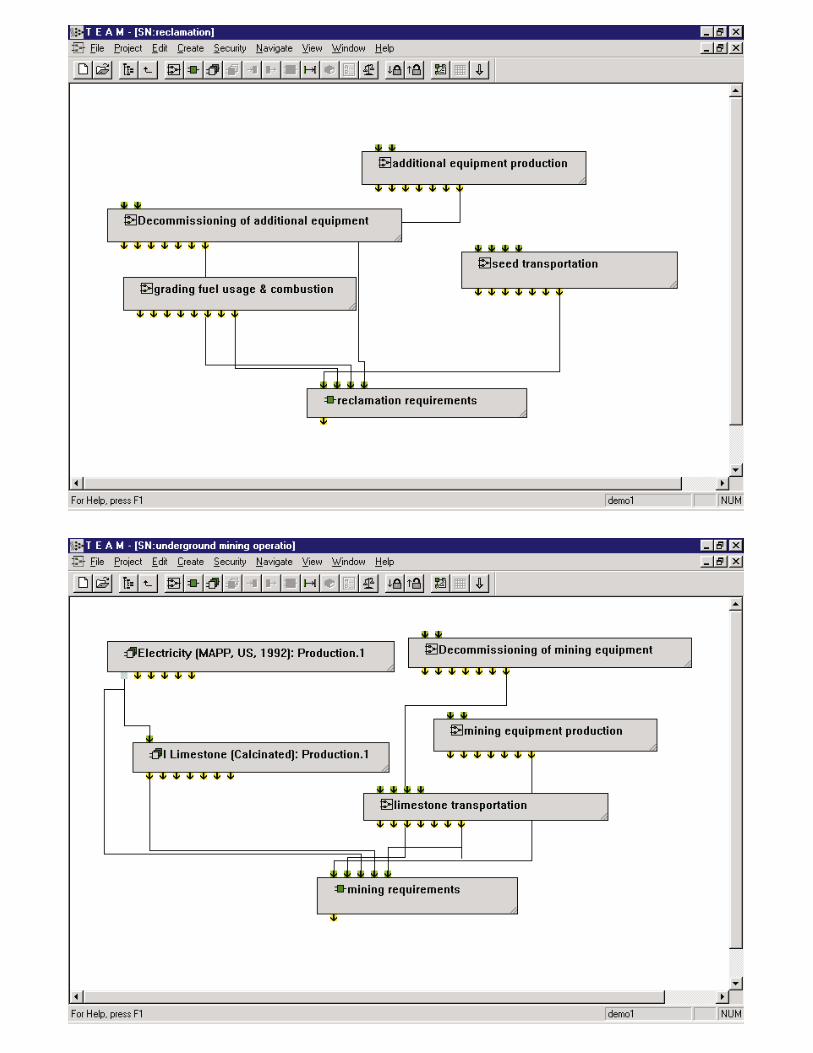
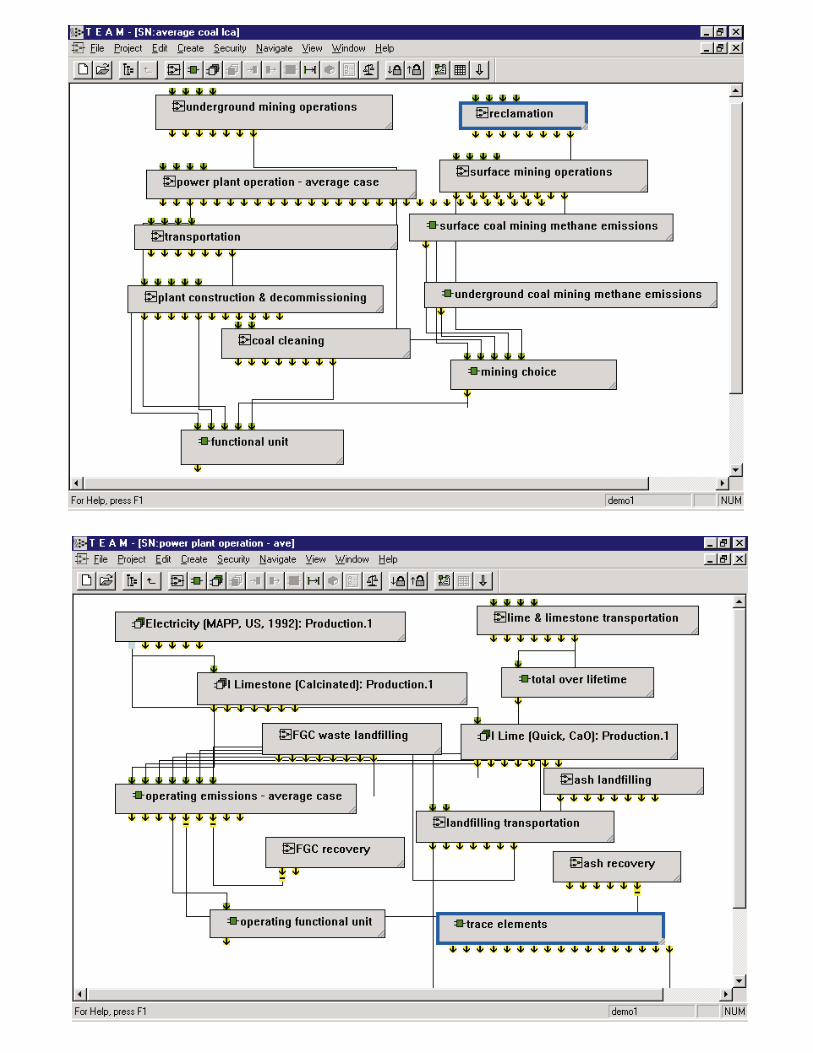
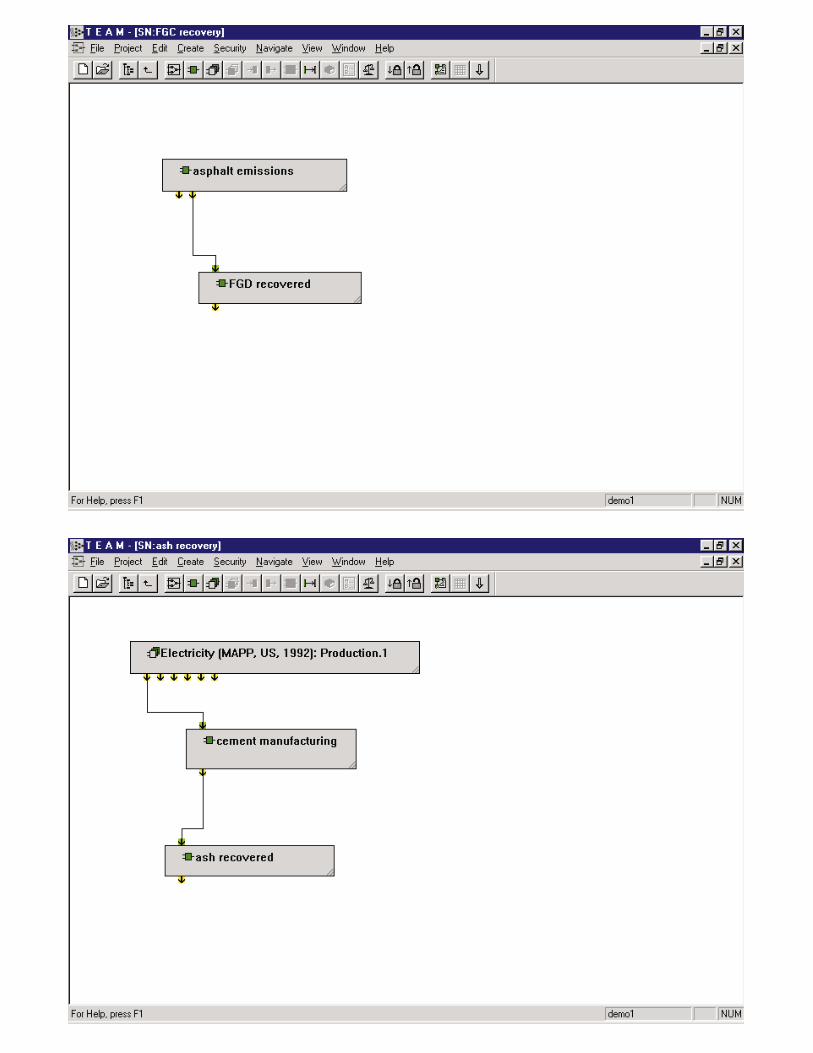
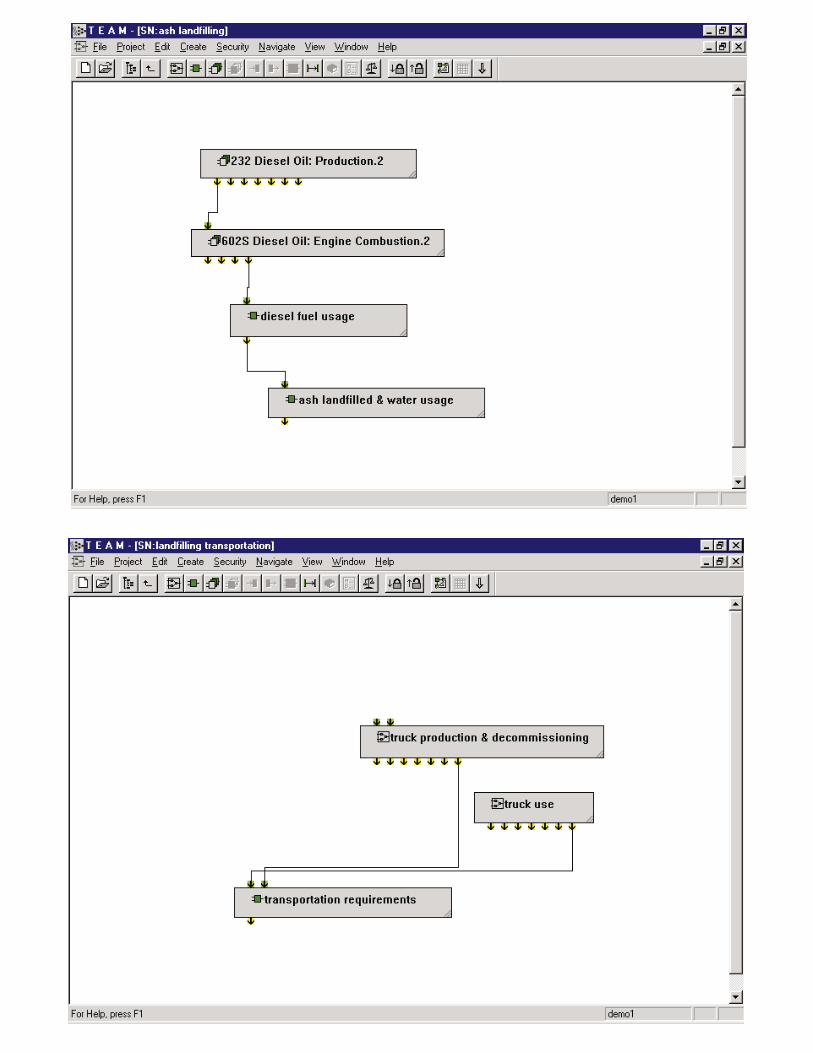
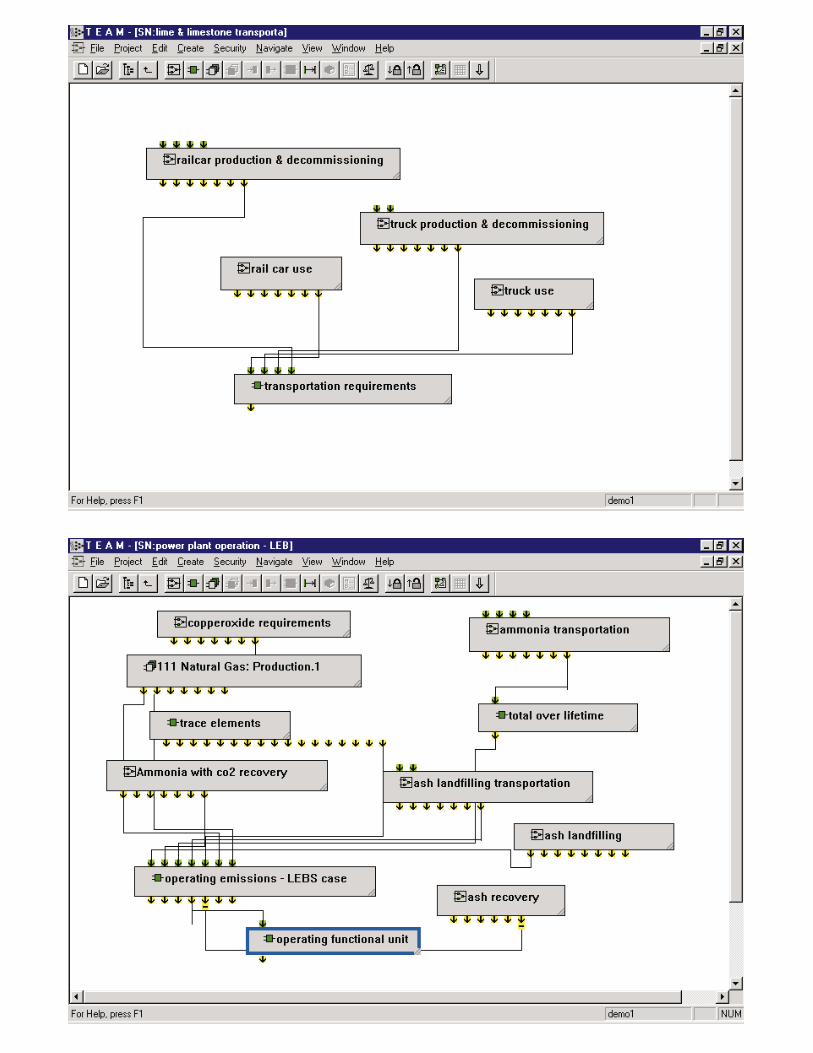
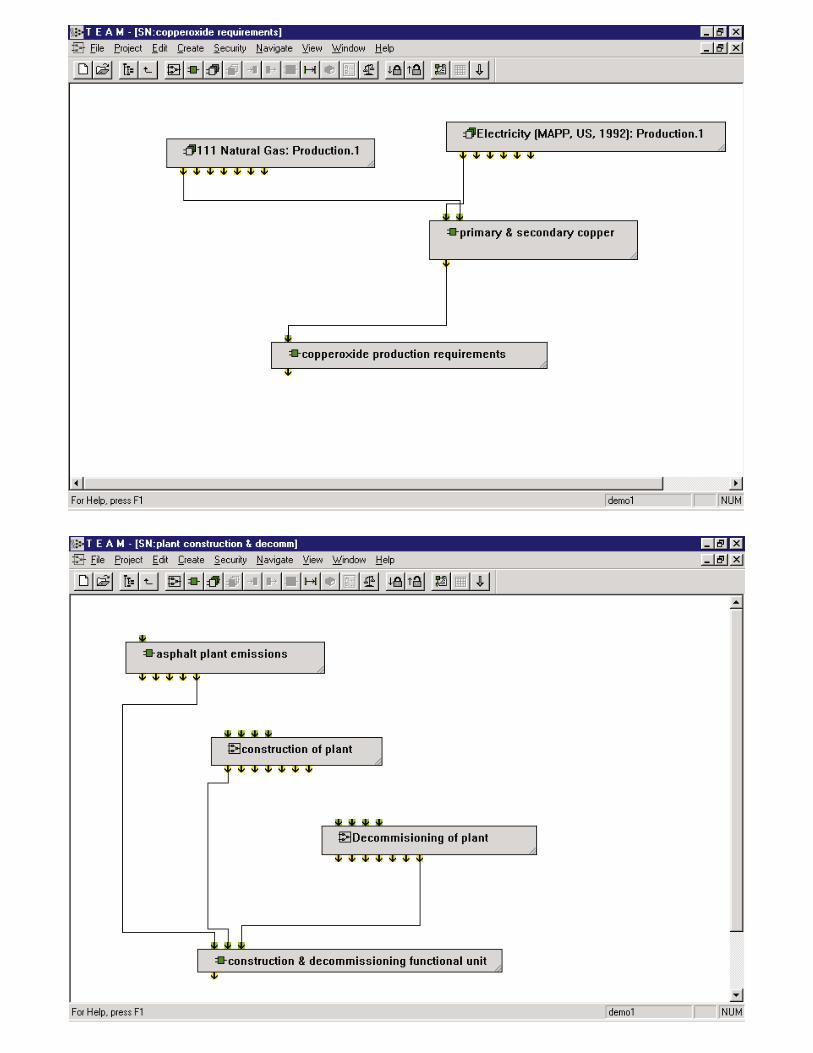
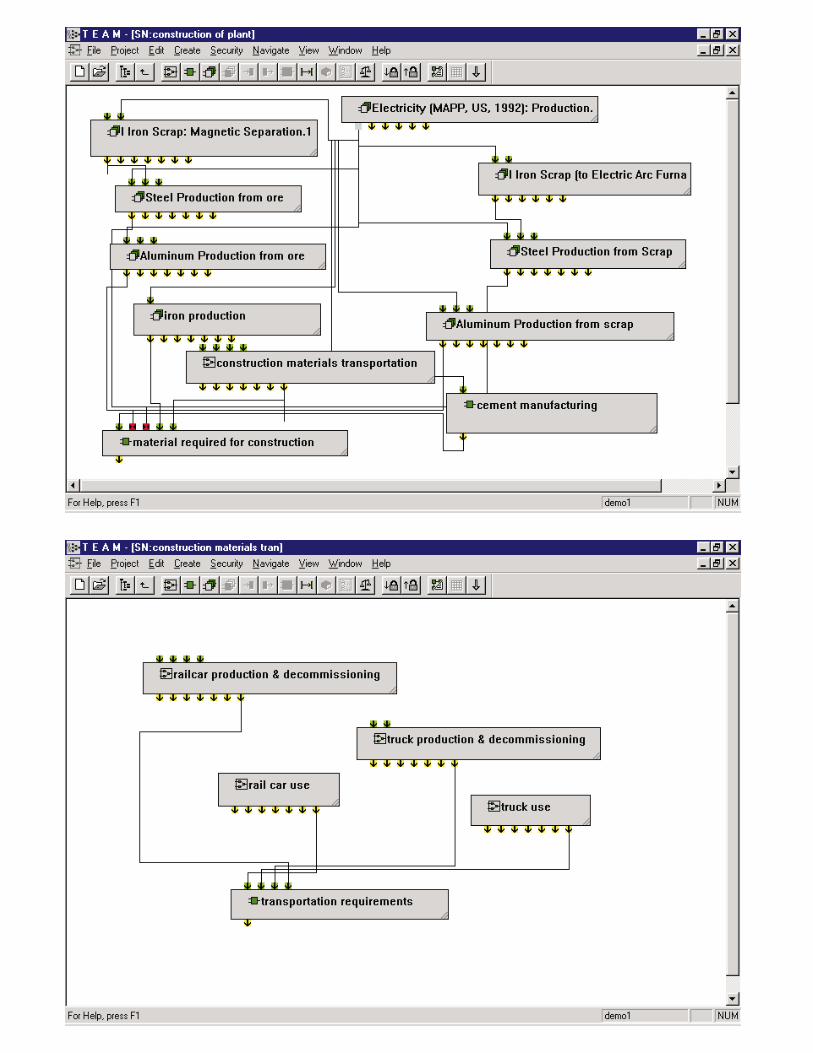
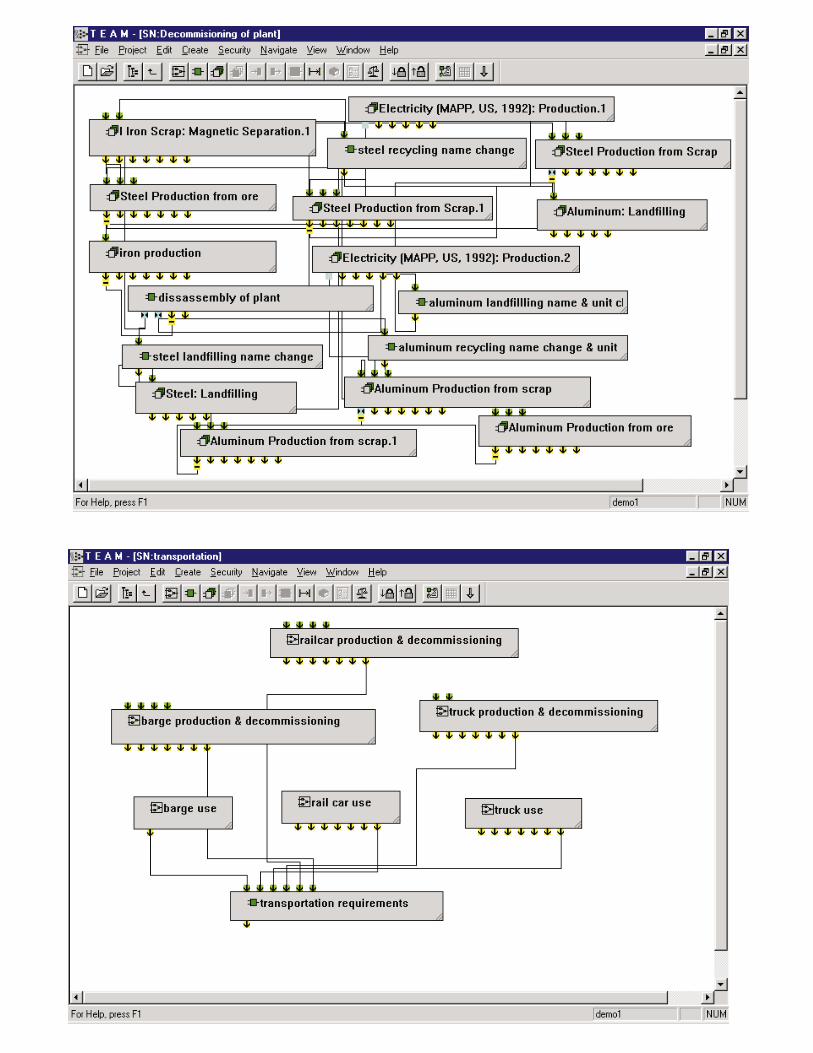
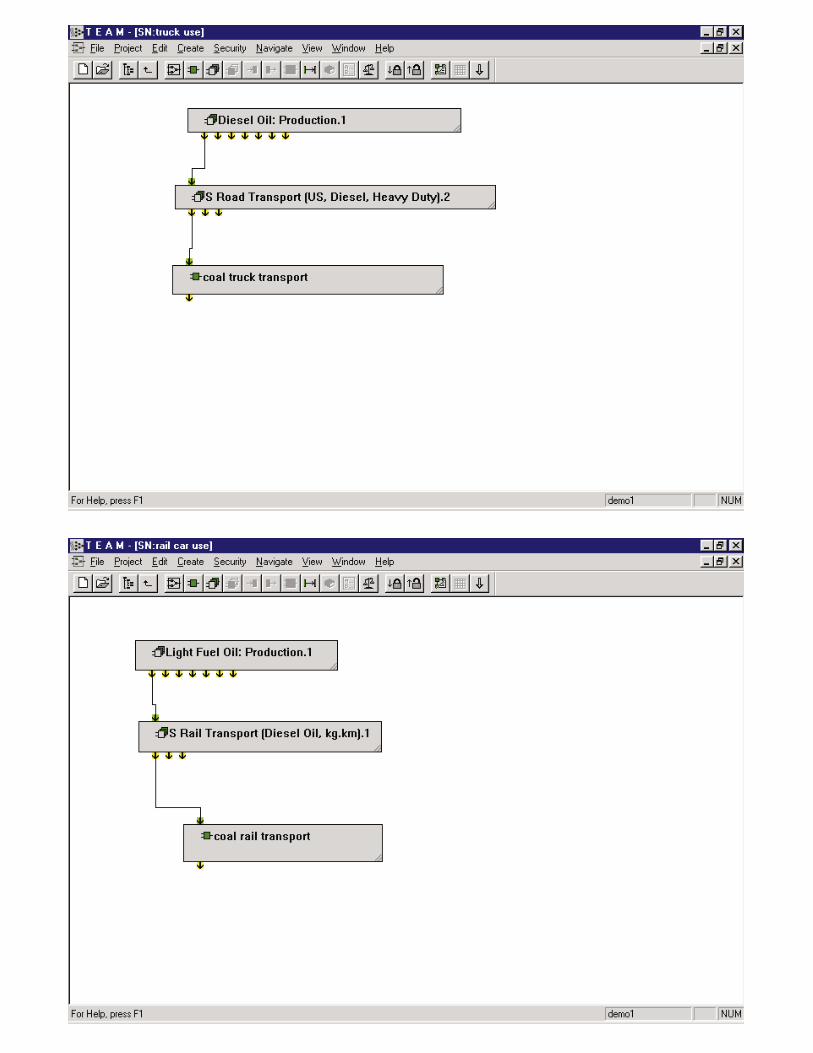
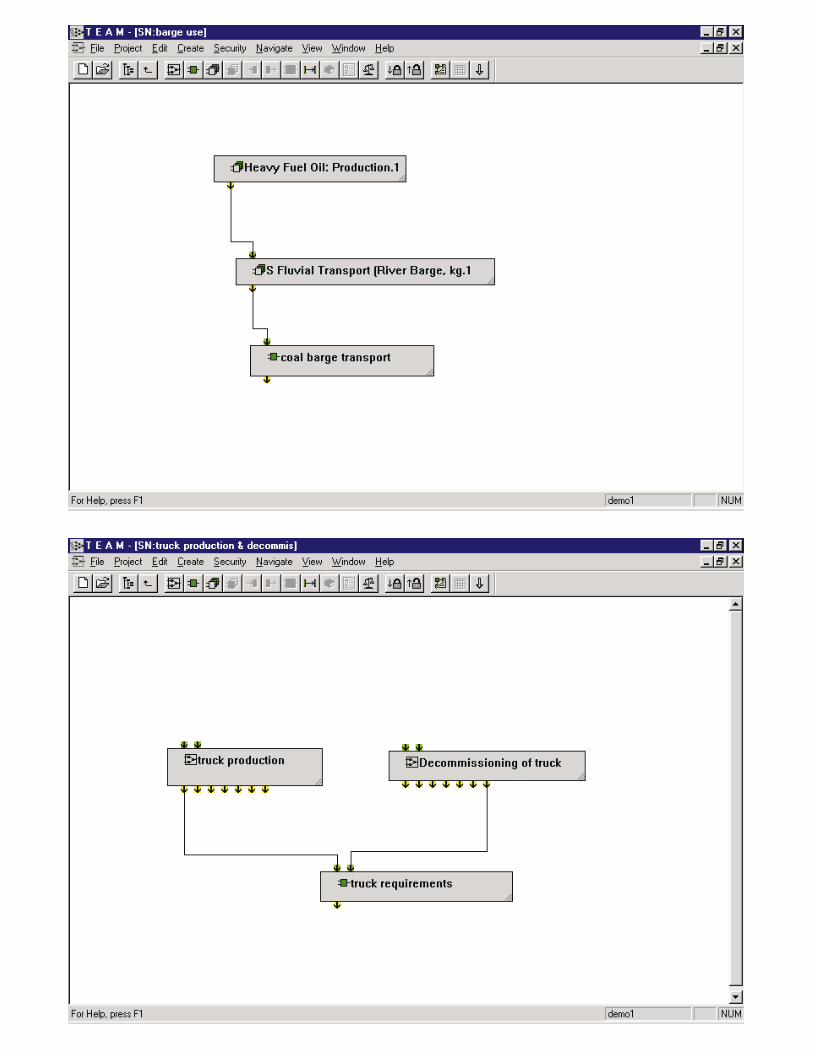
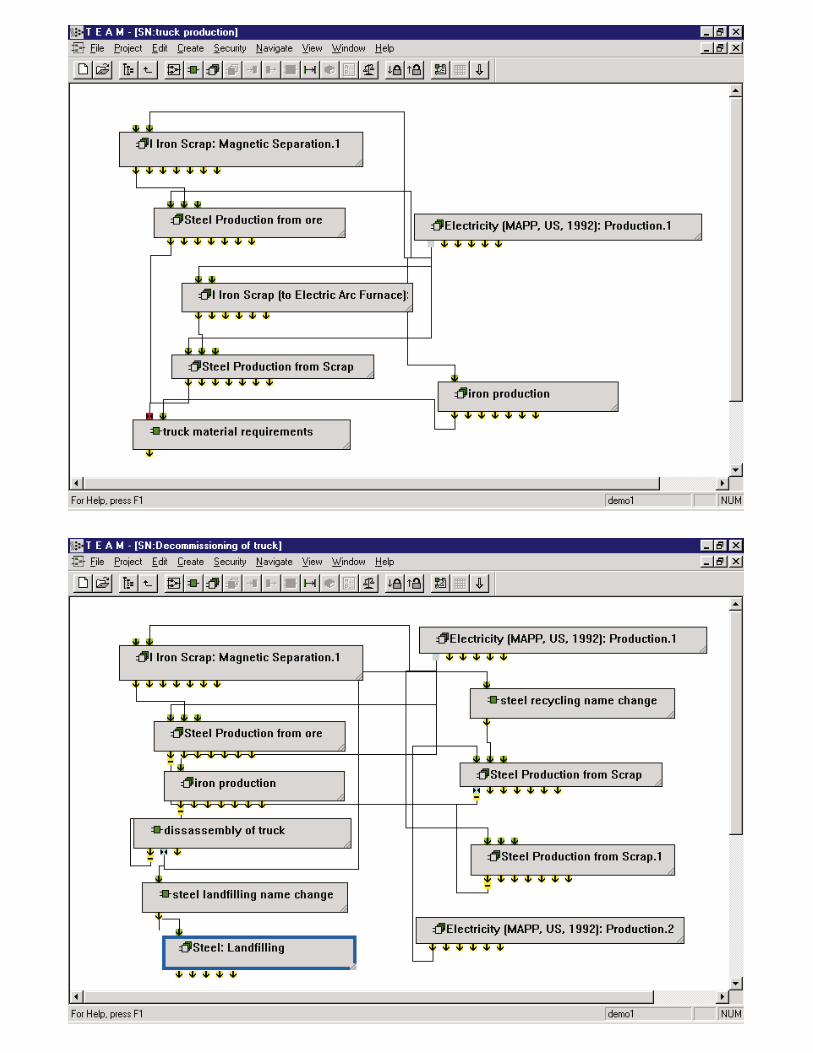
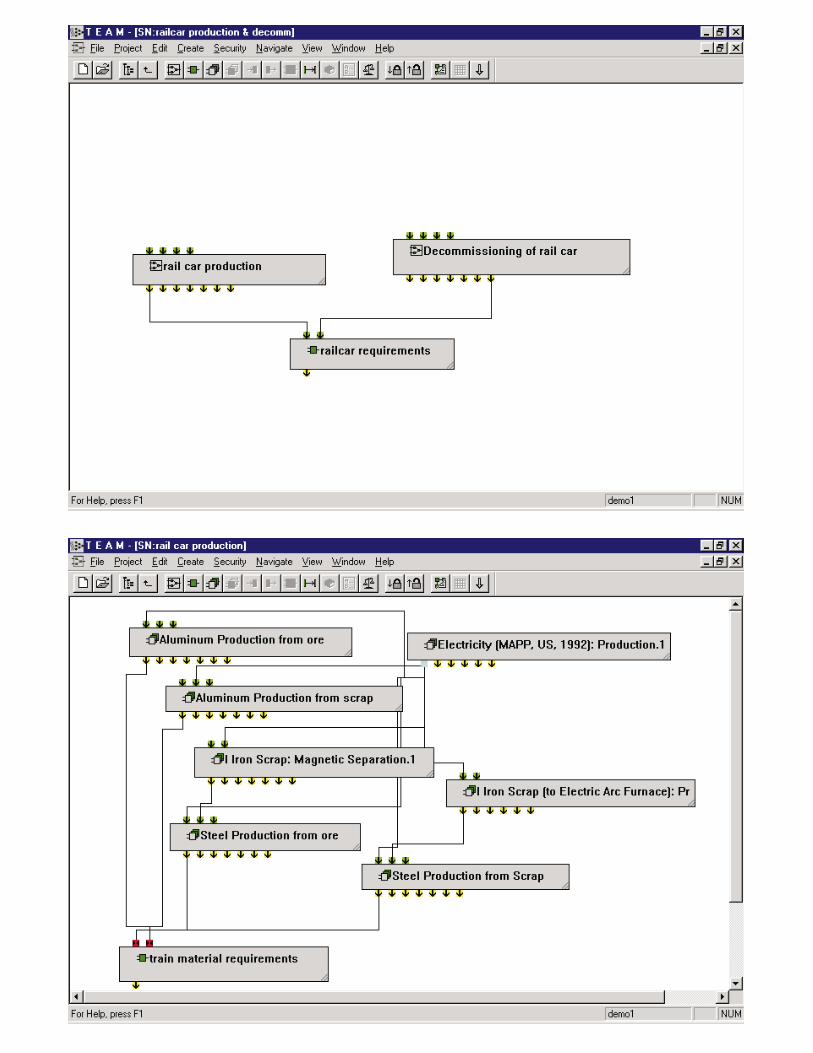
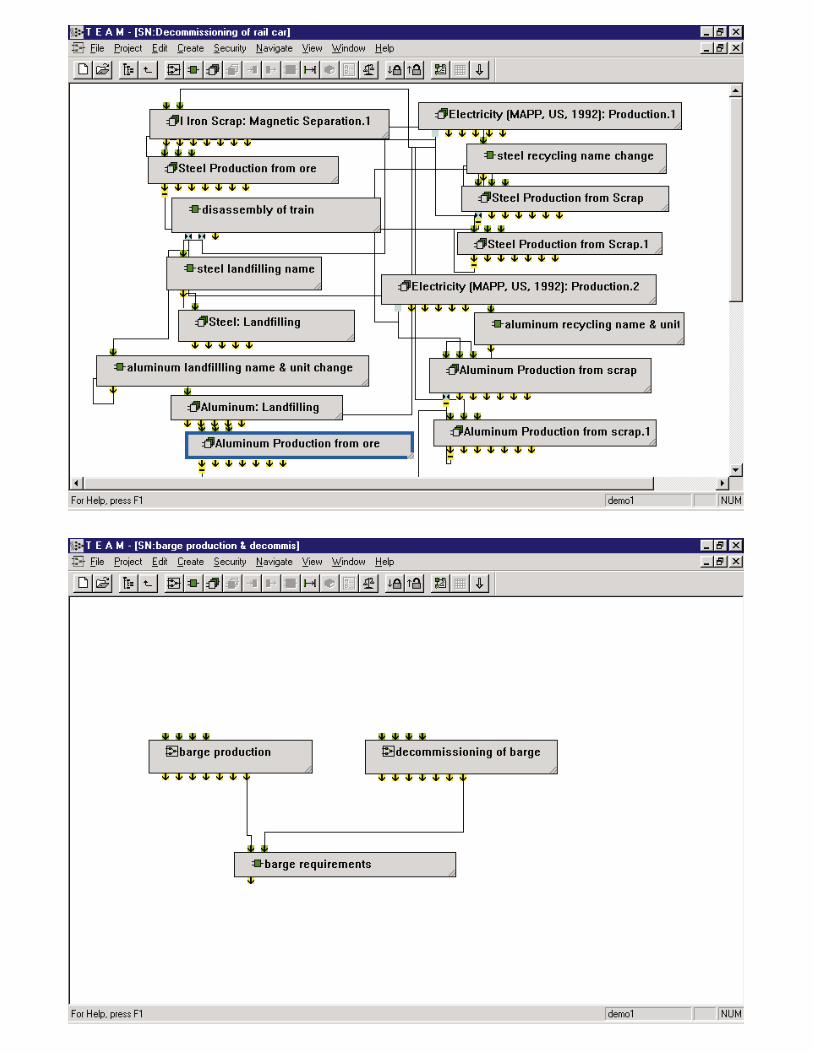
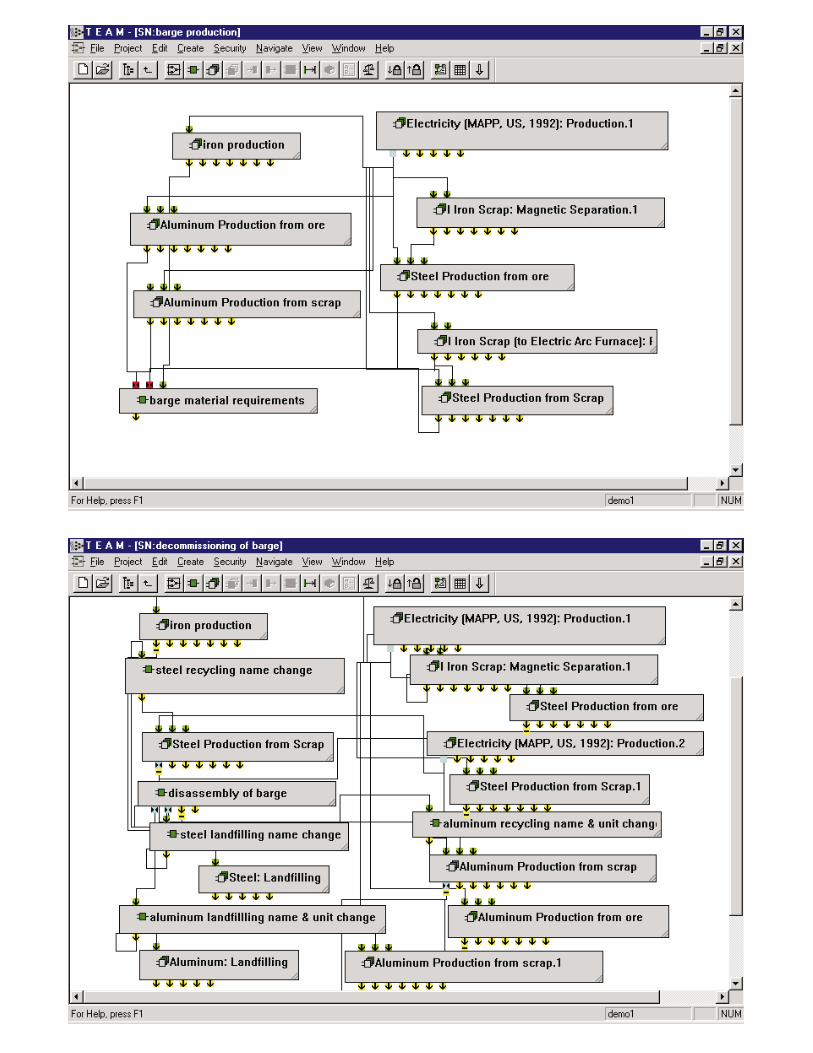

Appendix B: Additional Tables

Table B1: Average Resource Consumption per kWh of Net Electricity Produced - Average System (underground mining & average user by river)
% of Total in this Table Total (g/kWh)
% of Total from
Underground Coal Mining
% of Total from Transportation
% of Total from Electricity
Generation(r) Bauxite (Al2O3, ore) 0.00% 2.54E-03 0.01% 4.90% 95.09%(r) Clay (in ground) 0.00% 2.08E-08 11.81% 2.94% 85.25%(r) Coal (in ground) 79.05% 4.75E+02 0.67% 0.01% 99.33%(r) Iron (Fe, ore) 0.02% 9.62E-02 13.76% 2.61% 83.63%(r) Limestone (CaCO3, in ground) 18.82% 1.13E+02 9.12% 0.00% 90.88%(r) Natural Gas (in ground) 0.14% 8.53E-01 9.79% 2.53% 87.68%(r) Oil (in ground) 1.96% 1.18E+01 5.47% 46.80% 47.73%(r) Sand (in ground) 0.00% 2.27E-08 0.01% 4.90% 95.09%(r) Sodium Chloride (NaCl, in ground or in sea) 0.00% 7.26E-05 0.92% 4.75% 94.33%(r) Uranium (U, ore) 0.00% 4.02E-05 96.35% 0.10% 3.55%Aluminum Scrap 0.00% 6.22E-04 0.01% 4.90% 95.09%Iron Scrap 0.02% 1.02E-01 13.99% 2.58% 83.43%Lubricant 0.00% 1.74E-03 13.77% 2.60% 83.64%Trinitrotoluene (C6H3(NO2)3) 0.00% 4.53E-06 0.01% 4.90% 95.09%(r) = resource
Table B2: Average Air Emissions per kWh of Net Electricity Produced - Average System (underground mining & average user by river)
% of Total in this Table
% of Total in this Table
except CO2 Total (g/kWh)
% of Total from Underground Coal Mining
% of Total from Transportation
% of Total from
Electricity Generation
(a) Aldehydes 0.00% 0.00% 4.64E-04 11.28% 43.89% 44.84%(a) Ammonia (NH3) 0.00% 0.00% 2.22E-04 5.23% 46.03% 48.79%(a) antimony 0.00% 0.00% 4.11E-06 0.00% 0.00% 100.00%(a) arsenic 0.00% 0.00% 4.95E-05 0.00% 0.00% 100.00%(a) barium 0.00% 0.00% 1.28E-05 0.00% 0.00% 100.00%(a) beryllium 0.00% 0.00% 1.60E-06 0.00% 0.00% 100.00%(a) boron 0.00% 0.07% 1.70E-02 0.00% 0.00% 100.00%(a) cadmium 0.00% 0.00% 4.07E-06 0.00% 0.00% 100.00%(a) total Carbon Dioxide (CO2) 97.83% 1.02E+03 0.85% 1.72% 97.43%(a) Carbon Monoxide (CO) 0.02% 1.15% 2.61E-01 1.03% 38.96% 60.01%(a) Chlorides (Cl-) 0.00% 0.00% 5.70E-07 0.01% 3.48% 96.52%(a) chromium 0.00% 0.00% 5.92E-05 0.00% 0.00% 100.00%(a) cobalt 0.00% 0.00% 6.87E-06 0.00% 0.00% 100.00%(a) copper 0.00% 0.00% 2.34E-05 0.00% 0.00% 100.00%(a) Fluorides (F-) 0.00% 0.00% 2.66E-07 17.12% 3.40% 79.48%(a) non-methane Hydrocarbons (including VOCs) 0.02% 0.87% 1.98E-01 33.63% 29.67% 36.69%(a) Hydrogen Chloride (HCl) 0.00% 0.00% 1.83E-06 0.14% 3.19% 96.67%(a) Hydrogen Fluoride (HF) 0.00% 0.00% 1.65E-07 2.62% 4.47% 92.91%(a) Hydrogen Sulfide (H2S) 0.00% 0.00% 1.04E-08 11.81% 2.94% 85.25%(a) lead 0.00% 0.00% 3.00E-05 0.00% 0.00% 100.00%(a) manganese 0.00% 0.00% 4.30E-05 0.00% 0.00% 100.00%(a) mercury 0.00% 0.00% 3.66E-05 0.00% 0.00% 100.00%(a) Metals (unspecified) 0.00% 0.00% 1.27E-09 9.69% 3.29% 87.01%(a) Methane (CH4) 0.19% 8.82% 2.00E+00 99.53% 0.05% 0.43%(a) molybdenum 0.00% 0.00% 3.81E-05 0.00% 0.00% 100.00%(a) nickel 0.00% 0.00% 5.79E-05 0.00% 0.00% 100.00%(a) Nitrogen Oxides (NOx as NO2) 0.32% 14.75% 3.34E+00 1.10% 5.53% 93.37%(a) Nitrous Oxide (N2O) 0.00% 0.02% 4.30E-03 20.36% 5.72% 73.92%(a) Organic Matter (unspecified) 0.00% 0.00% 6.95E-04 13.51% 43.96% 42.53%(a) total Particulates (unspecified) 0.97% 44.72% 1.01E+01 9.22% 0.18% 90.60%(a) selenium 0.00% 0.00% 4.06E-04 0.00% 0.00% 100.00%(a) Sulfur Oxides (SOx as SO2) 0.64% 29.59% 6.70E+00 1.12% 1.42% 97.46%(a) Tars (unspecified) 0.00% 0.00% 3.65E-07 11.56% 2.98% 85.46%(a) vanadium 0.00% 0.00% 8.80E-05 0.00% 0.00% 100.00%(a) = air emission

Table B3: Average Water Emissions per kWh of Net Electricity Produced - Average System(underground mining & avg user by river)
% of Total in this Table Total (g/kWh)
% of Total from
Underground Coal Mining
% of Total from Transportation
% of Total from Electricity
Generation(w) Acids (H+) 0.00% 9.32E-08 7.91% 3.58% 88.37%(w) Ammonia (NH4+) 0.00% 0.00E+00 0.00% 0.00% 0.00%(w) Ammonia (NH4+, NH3, as N) 0.00% 3.31E-06 83.99% 0.48% 15.54%(w) TOTAL BOD5 (Biological Oxygen Demand) 0.04% 6.52E-05 5.05% 46.90% 48.05%(w) Chlorides (Cl-) 0.00% 3.42E-06 2.36% 4.76% 92.88%(w) COD (Chemical Oxygen Demand) 0.12% 1.94E-04 5.00% 47.15% 47.85%(w) Cyanides (CN-) 0.00% 7.29E-09 13.76% 2.61% 83.63%(w) Dissolved Matter (unspecified) 98.49% 1.57E-01 5.65% 41.23% 53.12%(w) Fluorides (F-) 0.00% 7.07E-06 84.69% 0.45% 14.85%(w) Inorganic Dissolved Matter (unspecified) 0.00% 5.26E-07 11.68% 2.96% 85.35%(w) Iron (Fe++, Fe3+) 0.00% 1.17E-08 96.35% 0.10% 3.55%(w) Metals (unspecified) 0.00% 3.20E-07 11.52% 2.99% 85.49%(w) Nitrates (NO3-) 0.00% 1.44E-06 96.35% 0.10% 3.55%(w) Nitric acid 0.00% 0.00E+00 0.00% 0.00% 0.00%(w) Nitrogenous Matter (unspecified, as N) 0.00% 1.04E-08 11.81% 2.94% 85.25%(w) Oils 1.17% 1.87E-03 5.59% 44.53% 49.88%(w) Oils (unspecified) 0.02% 2.63E-05 0.00% 0.00% 100.00%(w) Organic Dissolved Matter (unspecified) 0.00% 2.08E-08 11.81% 2.94% 85.25%(w) Phenol (C6H6O) 0.00% 2.29E-08 13.67% 2.62% 83.70%(w) Sodium (Na+) 0.00% 1.46E-06 65.65% 1.63% 32.72%(w) Sulfates (SO4--) 0.00% 1.73E-06 71.61% 1.33% 27.05%(w) Sulfides (S--) 0.00% 1.46E-08 13.76% 2.61% 83.63%(w) Suspended Matter (unspecified) 0.12% 1.91E-04 7.94% 16.98% 75.08%(w) Tars (unspecified) 0.00% 5.22E-09 11.56% 2.98% 85.46%(w) Water: Chemically Polluted 0.02% 3.11E-05 0.01% 3.79% 96.20%(w) = water emission
Table B4: Average Energy Requirements per kWh of Net Electricity Produced - Average System(underground mining & avg user by river)
Total (MJ/kWh)
% of Total from
Underground Coal Mining
% of Total from Transportation
% of Total from Electricity
GenerationNon-electric Energy Consumed by System (excluding coal energy) 0.6715 19.10% 34.51% 46.39%Electricity Consumed by System 0.0300 98.49% 2.35% -0.84%Total Non-coal Energy Consumed by System 0.7015 22.49% 33.14% 44.38%Energy in Coal to Power Plant 11.8508 N/A N/A N/ATotal Energy Consumed by System 12.5523 1.26% 1.85% 96.89%Note: The electricity produced and consumed by the power plant is not included in this table.The power plant energy and electricty requirements are from upstream processes, construction, and decommissioning.

Table B5: Average Solid Waste Generation per kWh of Net Electricity Produced - Average System(underground mining & avg user by river)
% of Total in this Table Total (g/kWh)
% of Total from
Underground Coal Mining
% of Total from Transportation
% of Total from Electricity
Generation(s) antimony 0.00% 1.49E-05 0.00% 0.00% 100.00%(s) arsenic 0.00% 1.30E-04 0.00% 0.00% 100.00%(s) barium 0.00% 4.37E-04 0.00% 0.00% 100.00%(s) beryllium 0.00% 1.41E-05 0.00% 0.00% 100.00%(s) boron 0.00% 7.19E-04 0.00% 0.00% 100.00%(s) cadmium 0.00% 9.83E-06 0.00% 0.00% 100.00%(s) chromium 0.00% 2.22E-04 0.00% 0.00% 100.00%(s) cobalt 0.00% 4.65E-05 0.00% 0.00% 100.00%(s) copper 0.00% 1.14E-04 0.00% 0.00% 100.00%(s) lead 0.00% 1.00E-04 0.00% 0.00% 100.00%(s) manganese 0.00% 2.73E-04 0.00% 0.00% 100.00%(s) mercury 0.00% 1.66E-07 0.00% 0.00% 100.00%(s) molybdenum 0.00% 3.89E-05 0.00% 0.00% 100.00%(s) nickel 0.00% 1.56E-04 0.00% 0.00% 100.00%(s) selenium 0.00% 1.03E-05 0.00% 0.00% 100.00%(s) vanadium 0.00% 3.17E-04 0.00% 0.00% 100.00%ash - landfilled (dry) 22.92% 2.57E+01 0.00% 0.00% 100.00%FGC waste (dry) - landfilled 57.75% 6.47E+01 0.00% 0.00% 100.00%Waste (hazardous) 0.00% 3.31E-09 3.72% 4.29% 92.00%Waste (municipal and industrial) 0.11% 1.24E-01 13.67% 2.44% 83.89%Waste (unspecified) 19.21% 2.15E+01 16.29% 0.05% 83.66%(s) = solid emission
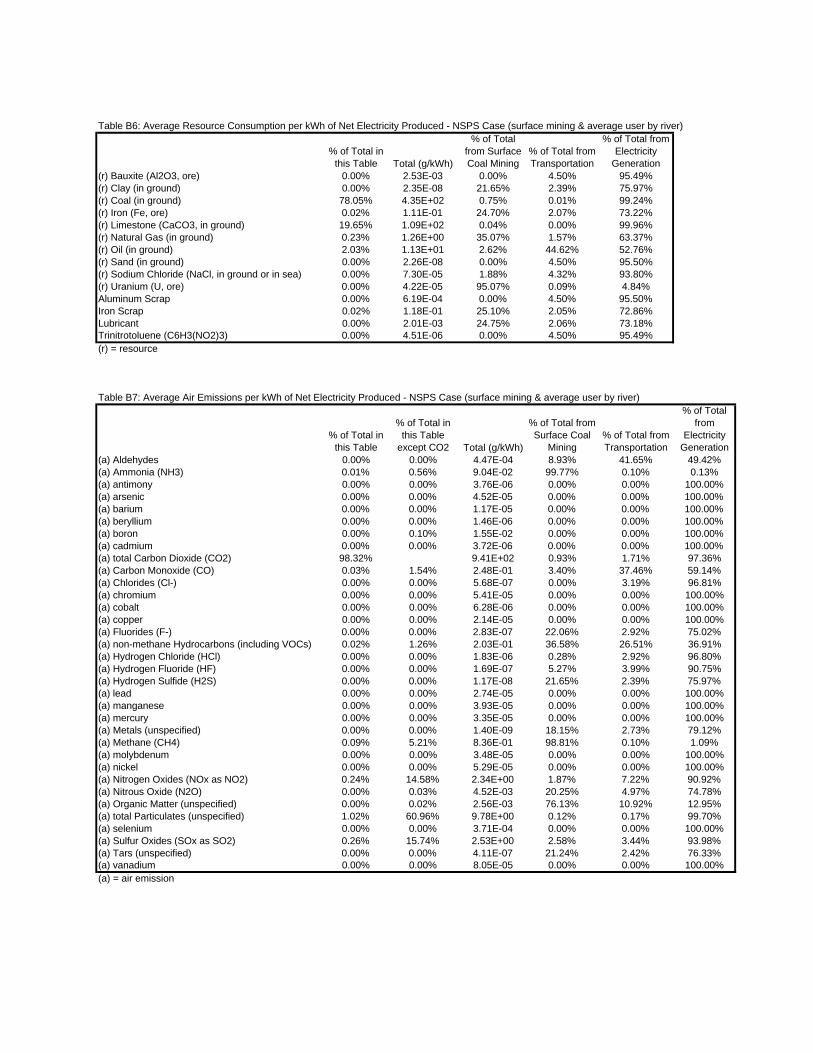
Table B6: Average Resource Consumption per kWh of Net Electricity Produced - NSPS Case (surface mining & average user by river)
% of Total in this Table Total (g/kWh)
% of Total from Surface Coal Mining
% of Total from Transportation
% of Total from Electricity
Generation(r) Bauxite (Al2O3, ore) 0.00% 2.53E-03 0.00% 4.50% 95.49%(r) Clay (in ground) 0.00% 2.35E-08 21.65% 2.39% 75.97%(r) Coal (in ground) 78.05% 4.35E+02 0.75% 0.01% 99.24%(r) Iron (Fe, ore) 0.02% 1.11E-01 24.70% 2.07% 73.22%(r) Limestone (CaCO3, in ground) 19.65% 1.09E+02 0.04% 0.00% 99.96%(r) Natural Gas (in ground) 0.23% 1.26E+00 35.07% 1.57% 63.37%(r) Oil (in ground) 2.03% 1.13E+01 2.62% 44.62% 52.76%(r) Sand (in ground) 0.00% 2.26E-08 0.00% 4.50% 95.50%(r) Sodium Chloride (NaCl, in ground or in sea) 0.00% 7.30E-05 1.88% 4.32% 93.80%(r) Uranium (U, ore) 0.00% 4.22E-05 95.07% 0.09% 4.84%Aluminum Scrap 0.00% 6.19E-04 0.00% 4.50% 95.50%Iron Scrap 0.02% 1.18E-01 25.10% 2.05% 72.86%Lubricant 0.00% 2.01E-03 24.75% 2.06% 73.18%Trinitrotoluene (C6H3(NO2)3) 0.00% 4.51E-06 0.00% 4.50% 95.49%(r) = resource
Table B7: Average Air Emissions per kWh of Net Electricity Produced - NSPS Case (surface mining & average user by river)
% of Total in this Table
% of Total in this Table
except CO2 Total (g/kWh)
% of Total from Surface Coal
Mining% of Total from Transportation
% of Total from
Electricity Generation
(a) Aldehydes 0.00% 0.00% 4.47E-04 8.93% 41.65% 49.42%(a) Ammonia (NH3) 0.01% 0.56% 9.04E-02 99.77% 0.10% 0.13%(a) antimony 0.00% 0.00% 3.76E-06 0.00% 0.00% 100.00%(a) arsenic 0.00% 0.00% 4.52E-05 0.00% 0.00% 100.00%(a) barium 0.00% 0.00% 1.17E-05 0.00% 0.00% 100.00%(a) beryllium 0.00% 0.00% 1.46E-06 0.00% 0.00% 100.00%(a) boron 0.00% 0.10% 1.55E-02 0.00% 0.00% 100.00%(a) cadmium 0.00% 0.00% 3.72E-06 0.00% 0.00% 100.00%(a) total Carbon Dioxide (CO2) 98.32% 9.41E+02 0.93% 1.71% 97.36%(a) Carbon Monoxide (CO) 0.03% 1.54% 2.48E-01 3.40% 37.46% 59.14%(a) Chlorides (Cl-) 0.00% 0.00% 5.68E-07 0.00% 3.19% 96.81%(a) chromium 0.00% 0.00% 5.41E-05 0.00% 0.00% 100.00%(a) cobalt 0.00% 0.00% 6.28E-06 0.00% 0.00% 100.00%(a) copper 0.00% 0.00% 2.14E-05 0.00% 0.00% 100.00%(a) Fluorides (F-) 0.00% 0.00% 2.83E-07 22.06% 2.92% 75.02%(a) non-methane Hydrocarbons (including VOCs) 0.02% 1.26% 2.03E-01 36.58% 26.51% 36.91%(a) Hydrogen Chloride (HCl) 0.00% 0.00% 1.83E-06 0.28% 2.92% 96.80%(a) Hydrogen Fluoride (HF) 0.00% 0.00% 1.69E-07 5.27% 3.99% 90.75%(a) Hydrogen Sulfide (H2S) 0.00% 0.00% 1.17E-08 21.65% 2.39% 75.97%(a) lead 0.00% 0.00% 2.74E-05 0.00% 0.00% 100.00%(a) manganese 0.00% 0.00% 3.93E-05 0.00% 0.00% 100.00%(a) mercury 0.00% 0.00% 3.35E-05 0.00% 0.00% 100.00%(a) Metals (unspecified) 0.00% 0.00% 1.40E-09 18.15% 2.73% 79.12%(a) Methane (CH4) 0.09% 5.21% 8.36E-01 98.81% 0.10% 1.09%(a) molybdenum 0.00% 0.00% 3.48E-05 0.00% 0.00% 100.00%(a) nickel 0.00% 0.00% 5.29E-05 0.00% 0.00% 100.00%(a) Nitrogen Oxides (NOx as NO2) 0.24% 14.58% 2.34E+00 1.87% 7.22% 90.92%(a) Nitrous Oxide (N2O) 0.00% 0.03% 4.52E-03 20.25% 4.97% 74.78%(a) Organic Matter (unspecified) 0.00% 0.02% 2.56E-03 76.13% 10.92% 12.95%(a) total Particulates (unspecified) 1.02% 60.96% 9.78E+00 0.12% 0.17% 99.70%(a) selenium 0.00% 0.00% 3.71E-04 0.00% 0.00% 100.00%(a) Sulfur Oxides (SOx as SO2) 0.26% 15.74% 2.53E+00 2.58% 3.44% 93.98%(a) Tars (unspecified) 0.00% 0.00% 4.11E-07 21.24% 2.42% 76.33%(a) vanadium 0.00% 0.00% 8.05E-05 0.00% 0.00% 100.00%(a) = air emission
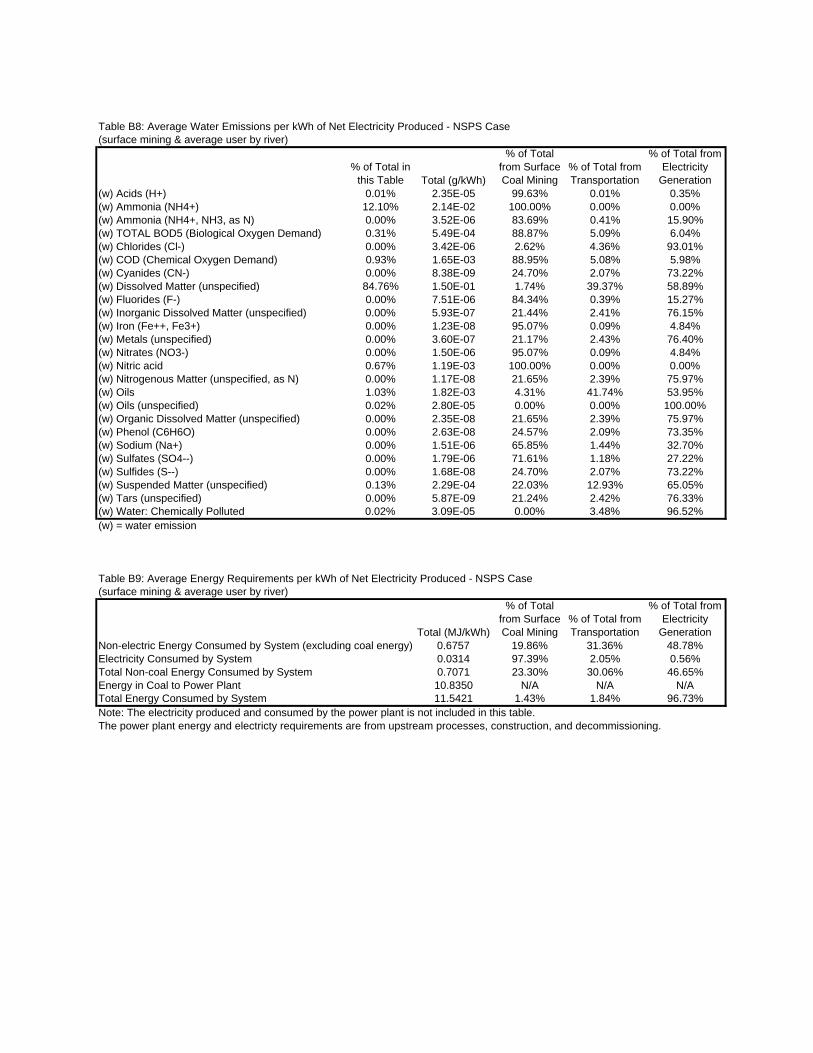
Table B8: Average Water Emissions per kWh of Net Electricity Produced - NSPS Case(surface mining & average user by river)
% of Total in this Table Total (g/kWh)
% of Total from Surface Coal Mining
% of Total from Transportation
% of Total from Electricity
Generation(w) Acids (H+) 0.01% 2.35E-05 99.63% 0.01% 0.35%(w) Ammonia (NH4+) 12.10% 2.14E-02 100.00% 0.00% 0.00%(w) Ammonia (NH4+, NH3, as N) 0.00% 3.52E-06 83.69% 0.41% 15.90%(w) TOTAL BOD5 (Biological Oxygen Demand) 0.31% 5.49E-04 88.87% 5.09% 6.04%(w) Chlorides (Cl-) 0.00% 3.42E-06 2.62% 4.36% 93.01%(w) COD (Chemical Oxygen Demand) 0.93% 1.65E-03 88.95% 5.08% 5.98%(w) Cyanides (CN-) 0.00% 8.38E-09 24.70% 2.07% 73.22%(w) Dissolved Matter (unspecified) 84.76% 1.50E-01 1.74% 39.37% 58.89%(w) Fluorides (F-) 0.00% 7.51E-06 84.34% 0.39% 15.27%(w) Inorganic Dissolved Matter (unspecified) 0.00% 5.93E-07 21.44% 2.41% 76.15%(w) Iron (Fe++, Fe3+) 0.00% 1.23E-08 95.07% 0.09% 4.84%(w) Metals (unspecified) 0.00% 3.60E-07 21.17% 2.43% 76.40%(w) Nitrates (NO3-) 0.00% 1.50E-06 95.07% 0.09% 4.84%(w) Nitric acid 0.67% 1.19E-03 100.00% 0.00% 0.00%(w) Nitrogenous Matter (unspecified, as N) 0.00% 1.17E-08 21.65% 2.39% 75.97%(w) Oils 1.03% 1.82E-03 4.31% 41.74% 53.95%(w) Oils (unspecified) 0.02% 2.80E-05 0.00% 0.00% 100.00%(w) Organic Dissolved Matter (unspecified) 0.00% 2.35E-08 21.65% 2.39% 75.97%(w) Phenol (C6H6O) 0.00% 2.63E-08 24.57% 2.09% 73.35%(w) Sodium (Na+) 0.00% 1.51E-06 65.85% 1.44% 32.70%(w) Sulfates (SO4--) 0.00% 1.79E-06 71.61% 1.18% 27.22%(w) Sulfides (S--) 0.00% 1.68E-08 24.70% 2.07% 73.22%(w) Suspended Matter (unspecified) 0.13% 2.29E-04 22.03% 12.93% 65.05%(w) Tars (unspecified) 0.00% 5.87E-09 21.24% 2.42% 76.33%(w) Water: Chemically Polluted 0.02% 3.09E-05 0.00% 3.48% 96.52%(w) = water emission
Table B9: Average Energy Requirements per kWh of Net Electricity Produced - NSPS Case(surface mining & average user by river)
Total (MJ/kWh)
% of Total from Surface Coal Mining
% of Total from Transportation
% of Total from Electricity
GenerationNon-electric Energy Consumed by System (excluding coal energy) 0.6757 19.86% 31.36% 48.78%Electricity Consumed by System 0.0314 97.39% 2.05% 0.56%Total Non-coal Energy Consumed by System 0.7071 23.30% 30.06% 46.65%Energy in Coal to Power Plant 10.8350 N/A N/A N/ATotal Energy Consumed by System 11.5421 1.43% 1.84% 96.73%Note: The electricity produced and consumed by the power plant is not included in this table.The power plant energy and electricty requirements are from upstream processes, construction, and decommissioning.
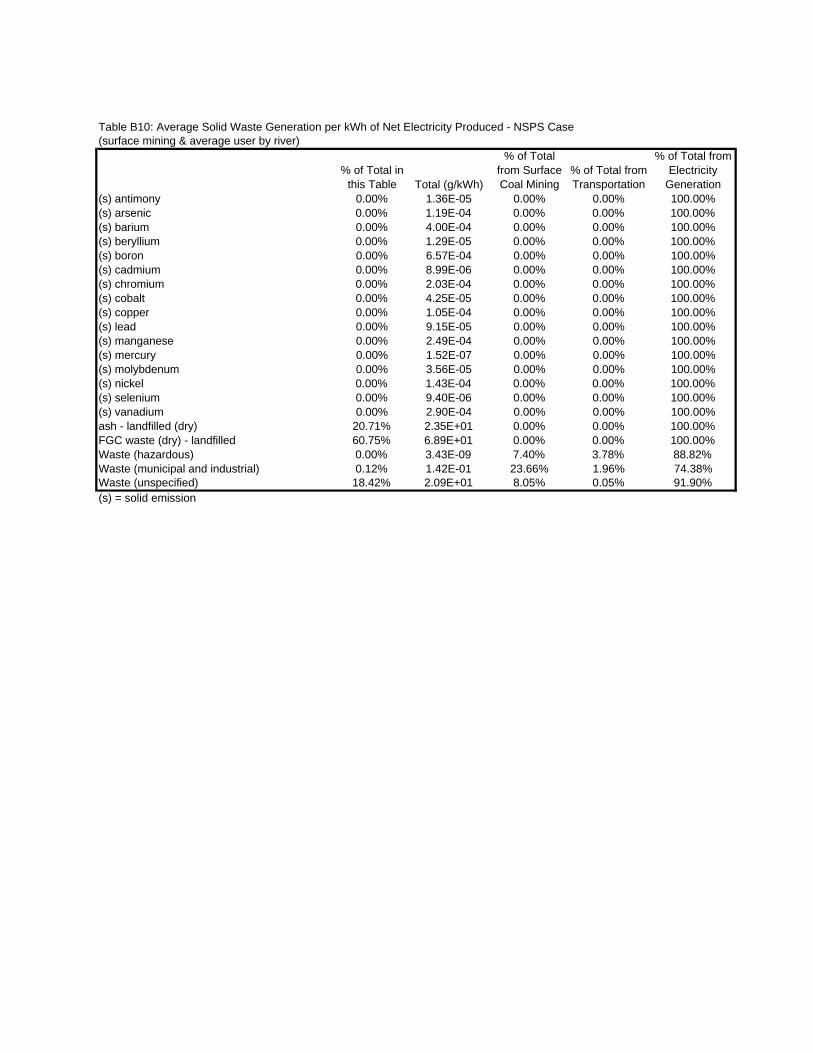
Table B10: Average Solid Waste Generation per kWh of Net Electricity Produced - NSPS Case(surface mining & average user by river)
% of Total in this Table Total (g/kWh)
% of Total from Surface Coal Mining
% of Total from Transportation
% of Total from Electricity
Generation(s) antimony 0.00% 1.36E-05 0.00% 0.00% 100.00%(s) arsenic 0.00% 1.19E-04 0.00% 0.00% 100.00%(s) barium 0.00% 4.00E-04 0.00% 0.00% 100.00%(s) beryllium 0.00% 1.29E-05 0.00% 0.00% 100.00%(s) boron 0.00% 6.57E-04 0.00% 0.00% 100.00%(s) cadmium 0.00% 8.99E-06 0.00% 0.00% 100.00%(s) chromium 0.00% 2.03E-04 0.00% 0.00% 100.00%(s) cobalt 0.00% 4.25E-05 0.00% 0.00% 100.00%(s) copper 0.00% 1.05E-04 0.00% 0.00% 100.00%(s) lead 0.00% 9.15E-05 0.00% 0.00% 100.00%(s) manganese 0.00% 2.49E-04 0.00% 0.00% 100.00%(s) mercury 0.00% 1.52E-07 0.00% 0.00% 100.00%(s) molybdenum 0.00% 3.56E-05 0.00% 0.00% 100.00%(s) nickel 0.00% 1.43E-04 0.00% 0.00% 100.00%(s) selenium 0.00% 9.40E-06 0.00% 0.00% 100.00%(s) vanadium 0.00% 2.90E-04 0.00% 0.00% 100.00%ash - landfilled (dry) 20.71% 2.35E+01 0.00% 0.00% 100.00%FGC waste (dry) - landfilled 60.75% 6.89E+01 0.00% 0.00% 100.00%Waste (hazardous) 0.00% 3.43E-09 7.40% 3.78% 88.82%Waste (municipal and industrial) 0.12% 1.42E-01 23.66% 1.96% 74.38%Waste (unspecified) 18.42% 2.09E+01 8.05% 0.05% 91.90%(s) = solid emission
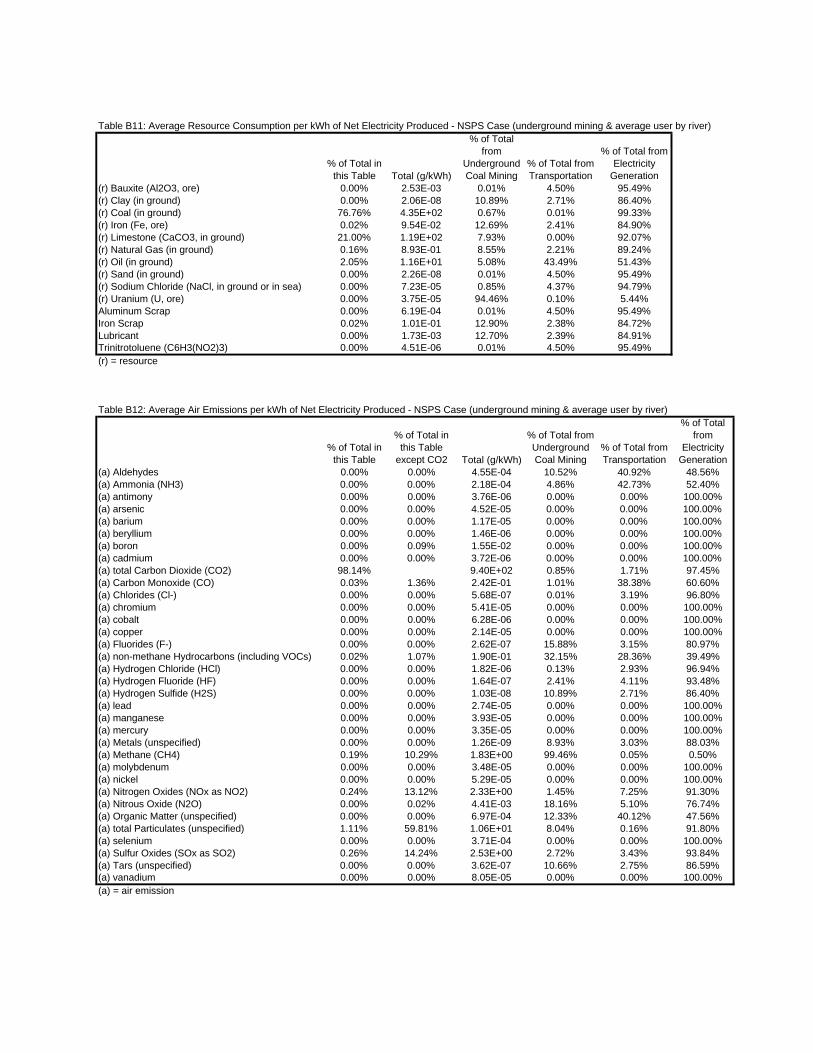
Table B11: Average Resource Consumption per kWh of Net Electricity Produced - NSPS Case (underground mining & average user by river)
% of Total in this Table Total (g/kWh)
% of Total from
Underground Coal Mining
% of Total from Transportation
% of Total from Electricity
Generation(r) Bauxite (Al2O3, ore) 0.00% 2.53E-03 0.01% 4.50% 95.49%(r) Clay (in ground) 0.00% 2.06E-08 10.89% 2.71% 86.40%(r) Coal (in ground) 76.76% 4.35E+02 0.67% 0.01% 99.33%(r) Iron (Fe, ore) 0.02% 9.54E-02 12.69% 2.41% 84.90%(r) Limestone (CaCO3, in ground) 21.00% 1.19E+02 7.93% 0.00% 92.07%(r) Natural Gas (in ground) 0.16% 8.93E-01 8.55% 2.21% 89.24%(r) Oil (in ground) 2.05% 1.16E+01 5.08% 43.49% 51.43%(r) Sand (in ground) 0.00% 2.26E-08 0.01% 4.50% 95.49%(r) Sodium Chloride (NaCl, in ground or in sea) 0.00% 7.23E-05 0.85% 4.37% 94.79%(r) Uranium (U, ore) 0.00% 3.75E-05 94.46% 0.10% 5.44%Aluminum Scrap 0.00% 6.19E-04 0.01% 4.50% 95.49%Iron Scrap 0.02% 1.01E-01 12.90% 2.38% 84.72%Lubricant 0.00% 1.73E-03 12.70% 2.39% 84.91%Trinitrotoluene (C6H3(NO2)3) 0.00% 4.51E-06 0.01% 4.50% 95.49%(r) = resource
Table B12: Average Air Emissions per kWh of Net Electricity Produced - NSPS Case (underground mining & average user by river)
% of Total in this Table
% of Total in this Table
except CO2 Total (g/kWh)
% of Total from Underground Coal Mining
% of Total from Transportation
% of Total from
Electricity Generation
(a) Aldehydes 0.00% 0.00% 4.55E-04 10.52% 40.92% 48.56%(a) Ammonia (NH3) 0.00% 0.00% 2.18E-04 4.86% 42.73% 52.40%(a) antimony 0.00% 0.00% 3.76E-06 0.00% 0.00% 100.00%(a) arsenic 0.00% 0.00% 4.52E-05 0.00% 0.00% 100.00%(a) barium 0.00% 0.00% 1.17E-05 0.00% 0.00% 100.00%(a) beryllium 0.00% 0.00% 1.46E-06 0.00% 0.00% 100.00%(a) boron 0.00% 0.09% 1.55E-02 0.00% 0.00% 100.00%(a) cadmium 0.00% 0.00% 3.72E-06 0.00% 0.00% 100.00%(a) total Carbon Dioxide (CO2) 98.14% 9.40E+02 0.85% 1.71% 97.45%(a) Carbon Monoxide (CO) 0.03% 1.36% 2.42E-01 1.01% 38.38% 60.60%(a) Chlorides (Cl-) 0.00% 0.00% 5.68E-07 0.01% 3.19% 96.80%(a) chromium 0.00% 0.00% 5.41E-05 0.00% 0.00% 100.00%(a) cobalt 0.00% 0.00% 6.28E-06 0.00% 0.00% 100.00%(a) copper 0.00% 0.00% 2.14E-05 0.00% 0.00% 100.00%(a) Fluorides (F-) 0.00% 0.00% 2.62E-07 15.88% 3.15% 80.97%(a) non-methane Hydrocarbons (including VOCs) 0.02% 1.07% 1.90E-01 32.15% 28.36% 39.49%(a) Hydrogen Chloride (HCl) 0.00% 0.00% 1.82E-06 0.13% 2.93% 96.94%(a) Hydrogen Fluoride (HF) 0.00% 0.00% 1.64E-07 2.41% 4.11% 93.48%(a) Hydrogen Sulfide (H2S) 0.00% 0.00% 1.03E-08 10.89% 2.71% 86.40%(a) lead 0.00% 0.00% 2.74E-05 0.00% 0.00% 100.00%(a) manganese 0.00% 0.00% 3.93E-05 0.00% 0.00% 100.00%(a) mercury 0.00% 0.00% 3.35E-05 0.00% 0.00% 100.00%(a) Metals (unspecified) 0.00% 0.00% 1.26E-09 8.93% 3.03% 88.03%(a) Methane (CH4) 0.19% 10.29% 1.83E+00 99.46% 0.05% 0.50%(a) molybdenum 0.00% 0.00% 3.48E-05 0.00% 0.00% 100.00%(a) nickel 0.00% 0.00% 5.29E-05 0.00% 0.00% 100.00%(a) Nitrogen Oxides (NOx as NO2) 0.24% 13.12% 2.33E+00 1.45% 7.25% 91.30%(a) Nitrous Oxide (N2O) 0.00% 0.02% 4.41E-03 18.16% 5.10% 76.74%(a) Organic Matter (unspecified) 0.00% 0.00% 6.97E-04 12.33% 40.12% 47.56%(a) total Particulates (unspecified) 1.11% 59.81% 1.06E+01 8.04% 0.16% 91.80%(a) selenium 0.00% 0.00% 3.71E-04 0.00% 0.00% 100.00%(a) Sulfur Oxides (SOx as SO2) 0.26% 14.24% 2.53E+00 2.72% 3.43% 93.84%(a) Tars (unspecified) 0.00% 0.00% 3.62E-07 10.66% 2.75% 86.59%(a) vanadium 0.00% 0.00% 8.05E-05 0.00% 0.00% 100.00%(a) = air emission
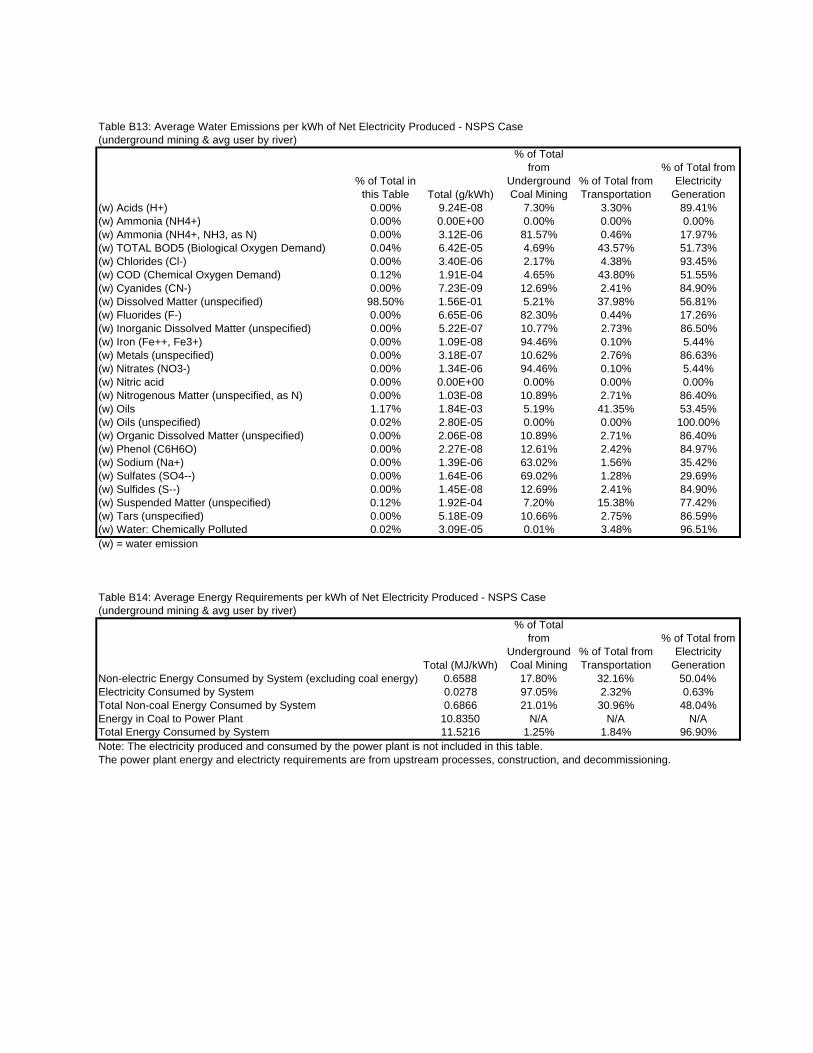
Table B13: Average Water Emissions per kWh of Net Electricity Produced - NSPS Case(underground mining & avg user by river)
% of Total in this Table Total (g/kWh)
% of Total from
Underground Coal Mining
% of Total from Transportation
% of Total from Electricity
Generation(w) Acids (H+) 0.00% 9.24E-08 7.30% 3.30% 89.41%(w) Ammonia (NH4+) 0.00% 0.00E+00 0.00% 0.00% 0.00%(w) Ammonia (NH4+, NH3, as N) 0.00% 3.12E-06 81.57% 0.46% 17.97%(w) TOTAL BOD5 (Biological Oxygen Demand) 0.04% 6.42E-05 4.69% 43.57% 51.73%(w) Chlorides (Cl-) 0.00% 3.40E-06 2.17% 4.38% 93.45%(w) COD (Chemical Oxygen Demand) 0.12% 1.91E-04 4.65% 43.80% 51.55%(w) Cyanides (CN-) 0.00% 7.23E-09 12.69% 2.41% 84.90%(w) Dissolved Matter (unspecified) 98.50% 1.56E-01 5.21% 37.98% 56.81%(w) Fluorides (F-) 0.00% 6.65E-06 82.30% 0.44% 17.26%(w) Inorganic Dissolved Matter (unspecified) 0.00% 5.22E-07 10.77% 2.73% 86.50%(w) Iron (Fe++, Fe3+) 0.00% 1.09E-08 94.46% 0.10% 5.44%(w) Metals (unspecified) 0.00% 3.18E-07 10.62% 2.76% 86.63%(w) Nitrates (NO3-) 0.00% 1.34E-06 94.46% 0.10% 5.44%(w) Nitric acid 0.00% 0.00E+00 0.00% 0.00% 0.00%(w) Nitrogenous Matter (unspecified, as N) 0.00% 1.03E-08 10.89% 2.71% 86.40%(w) Oils 1.17% 1.84E-03 5.19% 41.35% 53.45%(w) Oils (unspecified) 0.02% 2.80E-05 0.00% 0.00% 100.00%(w) Organic Dissolved Matter (unspecified) 0.00% 2.06E-08 10.89% 2.71% 86.40%(w) Phenol (C6H6O) 0.00% 2.27E-08 12.61% 2.42% 84.97%(w) Sodium (Na+) 0.00% 1.39E-06 63.02% 1.56% 35.42%(w) Sulfates (SO4--) 0.00% 1.64E-06 69.02% 1.28% 29.69%(w) Sulfides (S--) 0.00% 1.45E-08 12.69% 2.41% 84.90%(w) Suspended Matter (unspecified) 0.12% 1.92E-04 7.20% 15.38% 77.42%(w) Tars (unspecified) 0.00% 5.18E-09 10.66% 2.75% 86.59%(w) Water: Chemically Polluted 0.02% 3.09E-05 0.01% 3.48% 96.51%(w) = water emission
Table B14: Average Energy Requirements per kWh of Net Electricity Produced - NSPS Case(underground mining & avg user by river)
Total (MJ/kWh)
% of Total from
Underground Coal Mining
% of Total from Transportation
% of Total from Electricity
GenerationNon-electric Energy Consumed by System (excluding coal energy) 0.6588 17.80% 32.16% 50.04%Electricity Consumed by System 0.0278 97.05% 2.32% 0.63%Total Non-coal Energy Consumed by System 0.6866 21.01% 30.96% 48.04%Energy in Coal to Power Plant 10.8350 N/A N/A N/ATotal Energy Consumed by System 11.5216 1.25% 1.84% 96.90%Note: The electricity produced and consumed by the power plant is not included in this table.The power plant energy and electricty requirements are from upstream processes, construction, and decommissioning.

Table B15: Average Solid Waste Generation per kWh of Net Electricity Produced - NSPS Case(underground mining & avg user by river)
% of Total in this Table Total (g/kWh)
% of Total from
Underground Coal Mining
% of Total from Transportation
% of Total from Electricity
Generation(s) antimony 0.00% 1.36E-05 0.00% 0.00% 100.00%(s) arsenic 0.00% 1.19E-04 0.00% 0.00% 100.00%(s) barium 0.00% 4.00E-04 0.00% 0.00% 100.00%(s) beryllium 0.00% 1.29E-05 0.00% 0.00% 100.00%(s) boron 0.00% 6.57E-04 0.00% 0.00% 100.00%(s) cadmium 0.00% 8.99E-06 0.00% 0.00% 100.00%(s) chromium 0.00% 2.03E-04 0.00% 0.00% 100.00%(s) cobalt 0.00% 4.25E-05 0.00% 0.00% 100.00%(s) copper 0.00% 1.05E-04 0.00% 0.00% 100.00%(s) lead 0.00% 9.15E-05 0.00% 0.00% 100.00%(s) manganese 0.00% 2.49E-04 0.00% 0.00% 100.00%(s) mercury 0.00% 1.52E-07 0.00% 0.00% 100.00%(s) molybdenum 0.00% 3.56E-05 0.00% 0.00% 100.00%(s) nickel 0.00% 1.43E-04 0.00% 0.00% 100.00%(s) selenium 0.00% 9.40E-06 0.00% 0.00% 100.00%(s) vanadium 0.00% 2.90E-04 0.00% 0.00% 100.00%ash - landfilled (dry) 20.44% 2.35E+01 0.00% 0.00% 100.00%FGC waste (dry) - landfilled 59.95% 6.89E+01 0.00% 0.00% 100.00%Waste (hazardous) 0.00% 3.29E-09 3.42% 3.94% 92.64%Waste (municipal and industrial) 0.11% 1.24E-01 12.56% 2.24% 85.19%Waste (unspecified) 19.50% 2.24E+01 14.31% 0.05% 85.65%(s) = solid emission

Table B16: Average Resource Consumption per kWh of Net Electricity Produced - LEBS Case (surface mining & average user by river)
% of Total in this Table Total (g/kWh)
% of Total from Surface Coal Mining
% of Total from Transportation
% of Total from Electricity
Generation(r) Bauxite (Al2O3, ore) 0.00% 2.50E-03 0.00% 3.69% 96.30%(r) Clay (in ground) 0.00% 2.07E-08 19.99% 2.20% 77.81%(r) Coal (in ground) 97.34% 3.53E+02 0.75% 0.01% 99.24%(r) Iron (Fe, ore) 0.03% 9.54E-02 23.29% 1.96% 74.75%(r) Limestone (CaCO3, in ground) 0.01% 3.96E-02 81.38% 0.48% 18.14%(r) Natural Gas (in ground) 1.25% 4.53E+00 7.91% 0.35% 91.74%(r) Oil (in ground) 1.34% 4.88E+00 4.94% 84.18% 10.88%(r) Sand (in ground) 0.00% 2.24E-08 0.00% 3.69% 96.30%(r) Sodium Chloride (NaCl, in ground or in sea) 0.00% 7.17E-05 1.56% 3.58% 94.86%(r) Uranium (U, ore) 0.00% 3.23E-05 100.89% 0.09% -0.98%Aluminum Scrap 0.00% 6.13E-04 0.00% 3.69% 96.30%Iron Scrap 0.03% 1.02E-01 23.65% 1.93% 74.42%Lubricant 0.00% 1.73E-03 23.28% 1.94% 74.78%Trinitrotoluene (C6H3(NO2)3) 0.00% 4.47E-06 0.00% 3.69% 96.30%(r) = resource
Table B17: Average Air Emissions per kWh of Net Electricity Produced - LEBS Case (surface mining & average user by river)
% of Total in this Table
% of Total in this Table
except CO2 Total (g/kWh)
% of Total from Surface Coal
Mining% of Total from Transportation
% of Total from
Electricity Generation
(a) Aldehydes 0.00% 0.01% 1.97E-04 16.50% 76.96% 6.54%(a) Ammonia (NH3) 0.01% 2.87% 7.34E-02 99.88% 0.10% 0.01%(a) antimony 0.00% 0.00% 3.06E-06 0.00% 0.00% 100.00%(a) arsenic 0.00% 0.00% 3.68E-05 0.00% 0.00% 100.00%(a) barium 0.00% 0.00% 9.50E-06 0.00% 0.00% 100.00%(a) beryllium 0.00% 0.00% 1.19E-06 0.00% 0.00% 100.00%(a) boron 0.00% 0.49% 1.26E-02 0.00% 0.00% 100.00%(a) cadmium 0.00% 0.00% 3.02E-06 0.00% 0.00% 100.00%(a) total Carbon Dioxide (CO2) 99.66% 7.41E+02 0.96% 1.76% 97.28%(a) Carbon Monoxide (CO) 0.03% 7.47% 1.91E-01 3.58% 39.52% 56.89%(a) Chlorides (Cl-) 0.00% 0.00% 5.64E-07 0.00% 2.61% 97.39%(a) chromium 0.00% 0.00% 4.40E-05 0.00% 0.00% 100.00%(a) cobalt 0.00% 0.00% 5.11E-06 0.00% 0.00% 100.00%(a) copper 0.00% 0.00% 1.74E-05 0.00% 0.00% 100.00%(a) Fluorides (F-) 0.00% 0.00% 2.57E-07 19.72% 2.61% 77.66%(a) non-methane Hydrocarbons (including VOCs) 0.03% 7.48% 1.91E-01 31.53% 22.85% 45.62%(a) Hydrogen Chloride (HCl) 0.00% 0.00% 1.81E-06 0.23% 2.40% 97.38%(a) Hydrogen Fluoride (HF) 0.00% 0.00% 1.63E-07 4.44% 3.36% 92.19%(a) Hydrogen Sulfide (H2S) 0.00% 0.00% 1.03E-08 19.99% 2.20% 77.81%(a) lead 0.00% 0.00% 2.23E-05 0.00% 0.00% 100.00%(a) manganese 0.00% 0.00% 3.19E-05 0.00% 0.00% 100.00%(a) mercury 0.00% 0.00% 2.72E-05 0.00% 0.00% 100.00%(a) Metals (unspecified) 0.00% 0.00% 1.26E-09 16.43% 2.47% 81.10%(a) Methane (CH4) 0.10% 27.91% 7.14E-01 94.07% 0.10% 5.84%(a) molybdenum 0.00% 0.00% 2.83E-05 0.00% 0.00% 100.00%(a) nickel 0.00% 0.00% 4.30E-05 0.00% 0.00% 100.00%(a) Nitrogen Oxides (NOx as NO2) 0.07% 21.27% 5.44E-01 6.53% 25.24% 68.23%(a) Nitrous Oxide (N2O) 0.00% 0.05% 1.19E-03 62.34% 15.29% 22.38%(a) Organic Matter (unspecified) 0.00% 0.07% 1.86E-03 85.13% 12.21% 2.65%(a) total Particulates (unspecified) 0.02% 4.39% 1.12E-01 8.66% 12.24% 79.11%(a) selenium 0.00% 0.01% 3.01E-04 0.00% 0.00% 100.00%(a) Sulfur Oxides (SOx as SO2) 0.10% 27.97% 7.15E-01 7.41% 9.86% 82.72%(a) Tars (unspecified) 0.00% 0.00% 3.63E-07 19.57% 2.23% 78.19%(a) vanadium 0.00% 0.00% 6.54E-05 0.00% 0.00% 100.00%(a) = air emission
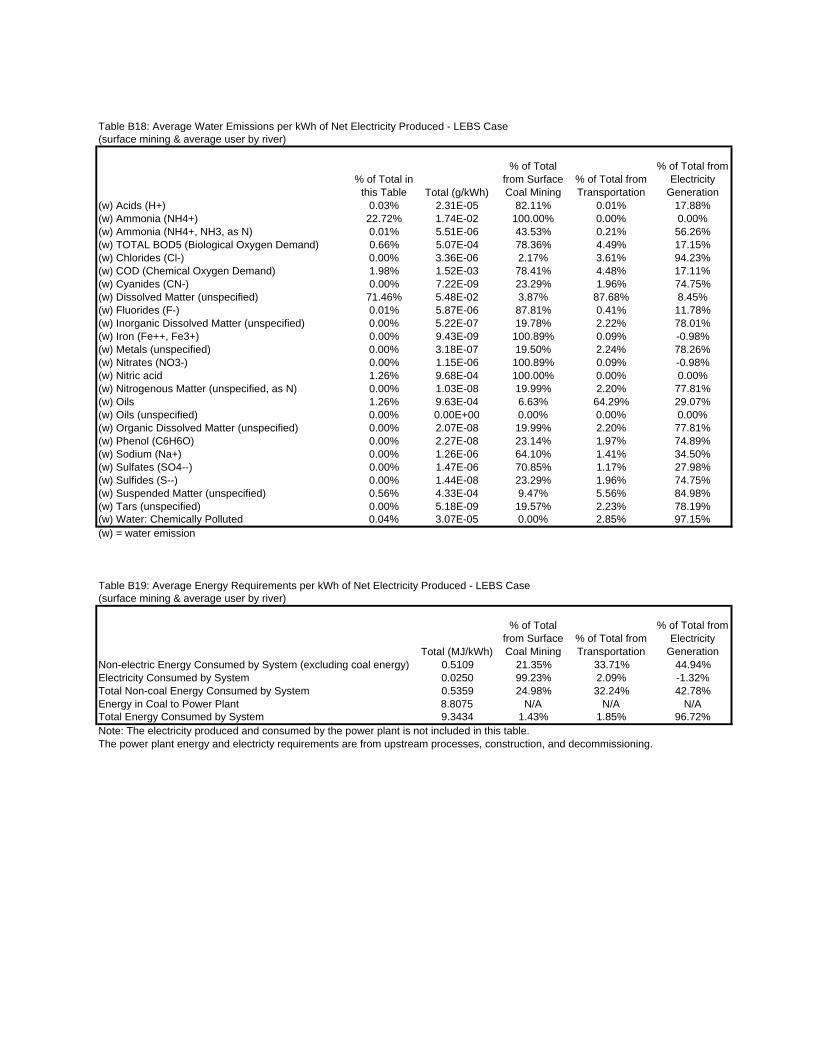
Table B18: Average Water Emissions per kWh of Net Electricity Produced - LEBS Case(surface mining & average user by river)
% of Total in this Table Total (g/kWh)
% of Total from Surface Coal Mining
% of Total from Transportation
% of Total from Electricity
Generation(w) Acids (H+) 0.03% 2.31E-05 82.11% 0.01% 17.88%(w) Ammonia (NH4+) 22.72% 1.74E-02 100.00% 0.00% 0.00%(w) Ammonia (NH4+, NH3, as N) 0.01% 5.51E-06 43.53% 0.21% 56.26%(w) TOTAL BOD5 (Biological Oxygen Demand) 0.66% 5.07E-04 78.36% 4.49% 17.15%(w) Chlorides (Cl-) 0.00% 3.36E-06 2.17% 3.61% 94.23%(w) COD (Chemical Oxygen Demand) 1.98% 1.52E-03 78.41% 4.48% 17.11%(w) Cyanides (CN-) 0.00% 7.22E-09 23.29% 1.96% 74.75%(w) Dissolved Matter (unspecified) 71.46% 5.48E-02 3.87% 87.68% 8.45%(w) Fluorides (F-) 0.01% 5.87E-06 87.81% 0.41% 11.78%(w) Inorganic Dissolved Matter (unspecified) 0.00% 5.22E-07 19.78% 2.22% 78.01%(w) Iron (Fe++, Fe3+) 0.00% 9.43E-09 100.89% 0.09% -0.98%(w) Metals (unspecified) 0.00% 3.18E-07 19.50% 2.24% 78.26%(w) Nitrates (NO3-) 0.00% 1.15E-06 100.89% 0.09% -0.98%(w) Nitric acid 1.26% 9.68E-04 100.00% 0.00% 0.00%(w) Nitrogenous Matter (unspecified, as N) 0.00% 1.03E-08 19.99% 2.20% 77.81%(w) Oils 1.26% 9.63E-04 6.63% 64.29% 29.07%(w) Oils (unspecified) 0.00% 0.00E+00 0.00% 0.00% 0.00%(w) Organic Dissolved Matter (unspecified) 0.00% 2.07E-08 19.99% 2.20% 77.81%(w) Phenol (C6H6O) 0.00% 2.27E-08 23.14% 1.97% 74.89%(w) Sodium (Na+) 0.00% 1.26E-06 64.10% 1.41% 34.50%(w) Sulfates (SO4--) 0.00% 1.47E-06 70.85% 1.17% 27.98%(w) Sulfides (S--) 0.00% 1.44E-08 23.29% 1.96% 74.75%(w) Suspended Matter (unspecified) 0.56% 4.33E-04 9.47% 5.56% 84.98%(w) Tars (unspecified) 0.00% 5.18E-09 19.57% 2.23% 78.19%(w) Water: Chemically Polluted 0.04% 3.07E-05 0.00% 2.85% 97.15%(w) = water emission
Table B19: Average Energy Requirements per kWh of Net Electricity Produced - LEBS Case(surface mining & average user by river)
Total (MJ/kWh)
% of Total from Surface Coal Mining
% of Total from Transportation
% of Total from Electricity
GenerationNon-electric Energy Consumed by System (excluding coal energy) 0.5109 21.35% 33.71% 44.94%Electricity Consumed by System 0.0250 99.23% 2.09% -1.32%Total Non-coal Energy Consumed by System 0.5359 24.98% 32.24% 42.78%Energy in Coal to Power Plant 8.8075 N/A N/A N/ATotal Energy Consumed by System 9.3434 1.43% 1.85% 96.72%Note: The electricity produced and consumed by the power plant is not included in this table.The power plant energy and electricty requirements are from upstream processes, construction, and decommissioning.
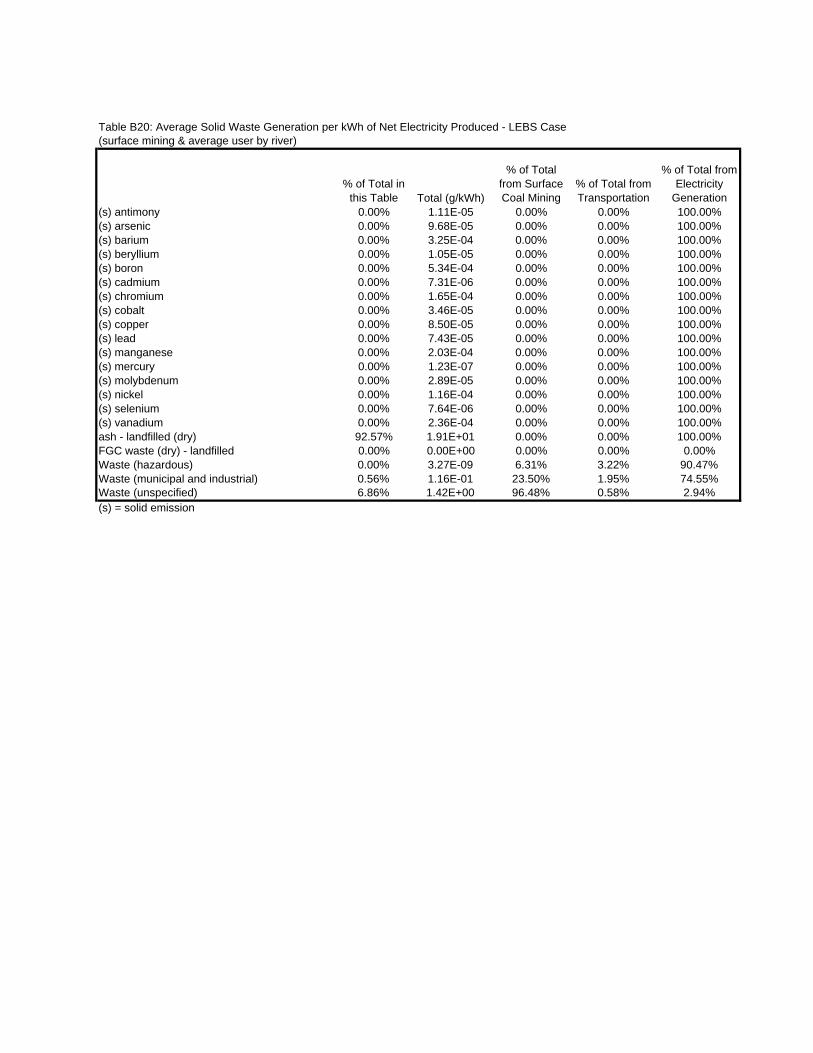
Table B20: Average Solid Waste Generation per kWh of Net Electricity Produced - LEBS Case(surface mining & average user by river)
% of Total in this Table Total (g/kWh)
% of Total from Surface Coal Mining
% of Total from Transportation
% of Total from Electricity
Generation(s) antimony 0.00% 1.11E-05 0.00% 0.00% 100.00%(s) arsenic 0.00% 9.68E-05 0.00% 0.00% 100.00%(s) barium 0.00% 3.25E-04 0.00% 0.00% 100.00%(s) beryllium 0.00% 1.05E-05 0.00% 0.00% 100.00%(s) boron 0.00% 5.34E-04 0.00% 0.00% 100.00%(s) cadmium 0.00% 7.31E-06 0.00% 0.00% 100.00%(s) chromium 0.00% 1.65E-04 0.00% 0.00% 100.00%(s) cobalt 0.00% 3.46E-05 0.00% 0.00% 100.00%(s) copper 0.00% 8.50E-05 0.00% 0.00% 100.00%(s) lead 0.00% 7.43E-05 0.00% 0.00% 100.00%(s) manganese 0.00% 2.03E-04 0.00% 0.00% 100.00%(s) mercury 0.00% 1.23E-07 0.00% 0.00% 100.00%(s) molybdenum 0.00% 2.89E-05 0.00% 0.00% 100.00%(s) nickel 0.00% 1.16E-04 0.00% 0.00% 100.00%(s) selenium 0.00% 7.64E-06 0.00% 0.00% 100.00%(s) vanadium 0.00% 2.36E-04 0.00% 0.00% 100.00%ash - landfilled (dry) 92.57% 1.91E+01 0.00% 0.00% 100.00%FGC waste (dry) - landfilled 0.00% 0.00E+00 0.00% 0.00% 0.00%Waste (hazardous) 0.00% 3.27E-09 6.31% 3.22% 90.47%Waste (municipal and industrial) 0.56% 1.16E-01 23.50% 1.95% 74.55%Waste (unspecified) 6.86% 1.42E+00 96.48% 0.58% 2.94%(s) = solid emission

Table B21: Average Resource Consumption per kWh of Net Electricity Produced - LEBS Case (underground mining & average user by river)
% of Total in this Table Total (g/kWh)
% of Total from
Underground Coal Mining
% of Total from Transportation
% of Total from Electricity
Generation(r) Bauxite (Al2O3, ore) 0.00% 2.50E-03 0.01% 3.69% 96.30%(r) Clay (in ground) 0.00% 1.84E-08 9.95% 2.48% 87.57%(r) Coal (in ground) 95.36% 3.53E+02 0.67% 0.01% 99.33%(r) Iron (Fe, ore) 0.02% 8.30E-02 11.86% 2.25% 85.89%(r) Limestone (CaCO3, in ground) 2.07% 7.67E+00 99.90% 0.00% 0.09%(r) Natural Gas (in ground) 1.14% 4.24E+00 1.47% 0.38% 98.16%(r) Oil (in ground) 1.38% 5.11E+00 9.38% 80.25% 10.37%(r) Sand (in ground) 0.00% 2.24E-08 0.01% 3.69% 96.30%(r) Sodium Chloride (NaCl, in ground or in sea) 0.00% 7.10E-05 0.70% 3.61% 95.69%(r) Uranium (U, ore) 0.00% 2.85E-05 101.01% 0.11% -1.11%Aluminum Scrap 0.00% 6.13E-04 0.01% 3.69% 96.30%Iron Scrap 0.02% 8.83E-02 12.04% 2.22% 85.73%Lubricant 0.00% 1.51E-03 11.83% 2.23% 85.94%Trinitrotoluene (C6H3(NO2)3) 0.00% 4.47E-06 0.01% 3.69% 96.30%(r) = resource
Table B22: Average Air Emissions per kWh of Net Electricity Produced - LEBS Case (underground mining & average user by river)
% of Total in this Table
% of Total in this Table
except CO2 Total (g/kWh)
% of Total from Underground Coal Mining
% of Total from Transportation
% of Total from
Electricity Generation
(a) Aldehydes 0.00% 0.01% 2.03E-04 19.15% 74.52% 6.33%(a) Ammonia (NH3) 0.00% 0.00% 9.52E-05 9.06% 79.68% 11.27%(a) antimony 0.00% 0.00% 3.06E-06 0.00% 0.00% 100.00%(a) arsenic 0.00% 0.00% 3.68E-05 0.00% 0.00% 100.00%(a) barium 0.00% 0.00% 9.50E-06 0.00% 0.00% 100.00%(a) beryllium 0.00% 0.00% 1.19E-06 0.00% 0.00% 100.00%(a) boron 0.00% 0.32% 1.26E-02 0.00% 0.00% 100.00%(a) cadmium 0.00% 0.00% 3.02E-06 0.00% 0.00% 100.00%(a) total Carbon Dioxide (CO2) 99.47% 7.41E+02 0.87% 1.76% 97.37%(a) Carbon Monoxide (CO) 0.02% 4.71% 1.86E-01 1.07% 40.55% 58.38%(a) Chlorides (Cl-) 0.00% 0.00% 5.64E-07 0.01% 2.61% 97.38%(a) chromium 0.00% 0.00% 4.40E-05 0.00% 0.00% 100.00%(a) cobalt 0.00% 0.00% 5.11E-06 0.00% 0.00% 100.00%(a) copper 0.00% 0.00% 1.74E-05 0.00% 0.00% 100.00%(a) Fluorides (F-) 0.00% 0.00% 2.40E-07 14.08% 2.80% 83.12%(a) non-methane Hydrocarbons (including VOCs) 0.02% 4.57% 1.80E-01 27.45% 24.21% 48.34%(a) Hydrogen Chloride (HCl) 0.00% 0.00% 1.81E-06 0.11% 2.40% 97.50%(a) Hydrogen Fluoride (HF) 0.00% 0.00% 1.59E-07 2.02% 3.45% 94.53%(a) Hydrogen Sulfide (H2S) 0.00% 0.00% 9.18E-09 9.95% 2.48% 87.57%(a) lead 0.00% 0.00% 2.23E-05 0.00% 0.00% 100.00%(a) manganese 0.00% 0.00% 3.19E-05 0.00% 0.00% 100.00%(a) mercury 0.00% 0.00% 2.72E-05 0.00% 0.00% 100.00%(a) Metals (unspecified) 0.00% 0.00% 1.14E-09 8.00% 2.72% 89.28%(a) Methane (CH4) 0.20% 38.47% 1.52E+00 97.21% 0.05% 2.74%(a) molybdenum 0.00% 0.00% 2.83E-05 0.00% 0.00% 100.00%(a) nickel 0.00% 0.00% 4.30E-05 0.00% 0.00% 100.00%(a) Nitrogen Oxides (NOx as NO2) 0.07% 13.56% 5.36E-01 5.12% 25.62% 69.26%(a) Nitrous Oxide (N2O) 0.00% 0.03% 1.10E-03 59.12% 16.59% 24.29%(a) Organic Matter (unspecified) 0.00% 0.01% 3.46E-04 20.16% 65.59% 14.25%(a) total Particulates (unspecified) 0.11% 20.16% 7.97E-01 87.12% 1.73% 11.16%(a) selenium 0.00% 0.01% 3.01E-04 0.00% 0.00% 100.00%(a) Sulfur Oxides (SOx as SO2) 0.10% 18.17% 7.18E-01 7.79% 9.82% 82.38%(a) Tars (unspecified) 0.00% 0.00% 3.23E-07 9.71% 2.51% 87.78%(a) vanadium 0.00% 0.00% 6.54E-05 0.00% 0.00% 100.00%(a) = air emission
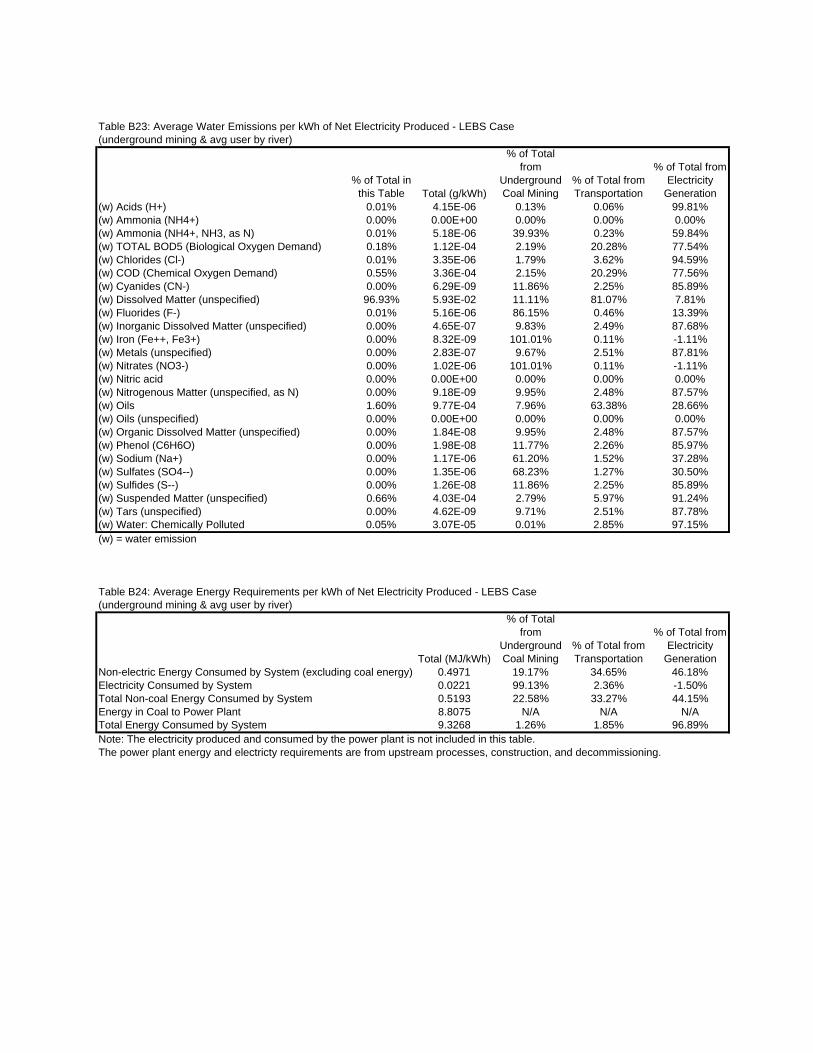
Table B23: Average Water Emissions per kWh of Net Electricity Produced - LEBS Case(underground mining & avg user by river)
% of Total in this Table Total (g/kWh)
% of Total from
Underground Coal Mining
% of Total from Transportation
% of Total from Electricity
Generation(w) Acids (H+) 0.01% 4.15E-06 0.13% 0.06% 99.81%(w) Ammonia (NH4+) 0.00% 0.00E+00 0.00% 0.00% 0.00%(w) Ammonia (NH4+, NH3, as N) 0.01% 5.18E-06 39.93% 0.23% 59.84%(w) TOTAL BOD5 (Biological Oxygen Demand) 0.18% 1.12E-04 2.19% 20.28% 77.54%(w) Chlorides (Cl-) 0.01% 3.35E-06 1.79% 3.62% 94.59%(w) COD (Chemical Oxygen Demand) 0.55% 3.36E-04 2.15% 20.29% 77.56%(w) Cyanides (CN-) 0.00% 6.29E-09 11.86% 2.25% 85.89%(w) Dissolved Matter (unspecified) 96.93% 5.93E-02 11.11% 81.07% 7.81%(w) Fluorides (F-) 0.01% 5.16E-06 86.15% 0.46% 13.39%(w) Inorganic Dissolved Matter (unspecified) 0.00% 4.65E-07 9.83% 2.49% 87.68%(w) Iron (Fe++, Fe3+) 0.00% 8.32E-09 101.01% 0.11% -1.11%(w) Metals (unspecified) 0.00% 2.83E-07 9.67% 2.51% 87.81%(w) Nitrates (NO3-) 0.00% 1.02E-06 101.01% 0.11% -1.11%(w) Nitric acid 0.00% 0.00E+00 0.00% 0.00% 0.00%(w) Nitrogenous Matter (unspecified, as N) 0.00% 9.18E-09 9.95% 2.48% 87.57%(w) Oils 1.60% 9.77E-04 7.96% 63.38% 28.66%(w) Oils (unspecified) 0.00% 0.00E+00 0.00% 0.00% 0.00%(w) Organic Dissolved Matter (unspecified) 0.00% 1.84E-08 9.95% 2.48% 87.57%(w) Phenol (C6H6O) 0.00% 1.98E-08 11.77% 2.26% 85.97%(w) Sodium (Na+) 0.00% 1.17E-06 61.20% 1.52% 37.28%(w) Sulfates (SO4--) 0.00% 1.35E-06 68.23% 1.27% 30.50%(w) Sulfides (S--) 0.00% 1.26E-08 11.86% 2.25% 85.89%(w) Suspended Matter (unspecified) 0.66% 4.03E-04 2.79% 5.97% 91.24%(w) Tars (unspecified) 0.00% 4.62E-09 9.71% 2.51% 87.78%(w) Water: Chemically Polluted 0.05% 3.07E-05 0.01% 2.85% 97.15%(w) = water emission
Table B24: Average Energy Requirements per kWh of Net Electricity Produced - LEBS Case(underground mining & avg user by river)
Total (MJ/kWh)
% of Total from
Underground Coal Mining
% of Total from Transportation
% of Total from Electricity
GenerationNon-electric Energy Consumed by System (excluding coal energy) 0.4971 19.17% 34.65% 46.18%Electricity Consumed by System 0.0221 99.13% 2.36% -1.50%Total Non-coal Energy Consumed by System 0.5193 22.58% 33.27% 44.15%Energy in Coal to Power Plant 8.8075 N/A N/A N/ATotal Energy Consumed by System 9.3268 1.26% 1.85% 96.89%Note: The electricity produced and consumed by the power plant is not included in this table.The power plant energy and electricty requirements are from upstream processes, construction, and decommissioning.

Table B25: Average Solid Waste Generation per kWh of Net Electricity Produced - LEBS Case(underground mining & avg user by river)
% of Total in this Table Total (g/kWh)
% of Total from
Underground Coal Mining
% of Total from Transportation
% of Total from Electricity
Generation(s) antimony 0.00% 1.11E-05 0.00% 0.00% 100.00%(s) arsenic 0.00% 9.68E-05 0.00% 0.00% 100.00%(s) barium 0.00% 3.25E-04 0.00% 0.00% 100.00%(s) beryllium 0.00% 1.05E-05 0.00% 0.00% 100.00%(s) boron 0.00% 5.34E-04 0.00% 0.00% 100.00%(s) cadmium 0.00% 7.31E-06 0.00% 0.00% 100.00%(s) chromium 0.00% 1.65E-04 0.00% 0.00% 100.00%(s) cobalt 0.00% 3.46E-05 0.00% 0.00% 100.00%(s) copper 0.00% 8.50E-05 0.00% 0.00% 100.00%(s) lead 0.00% 7.43E-05 0.00% 0.00% 100.00%(s) manganese 0.00% 2.03E-04 0.00% 0.00% 100.00%(s) mercury 0.00% 1.23E-07 0.00% 0.00% 100.00%(s) molybdenum 0.00% 2.89E-05 0.00% 0.00% 100.00%(s) nickel 0.00% 1.16E-04 0.00% 0.00% 100.00%(s) selenium 0.00% 7.64E-06 0.00% 0.00% 100.00%(s) vanadium 0.00% 2.36E-04 0.00% 0.00% 100.00%ash - landfilled (dry) 87.39% 1.91E+01 0.00% 0.00% 100.00%FGC waste (dry) - landfilled 0.00% 0.00E+00 0.00% 0.00% 0.00%Waste (hazardous) 0.00% 3.16E-09 2.90% 3.34% 93.76%Waste (municipal and industrial) 0.46% 1.01E-01 12.47% 2.23% 85.31%Waste (unspecified) 12.13% 2.66E+00 98.12% 0.31% 1.57%(s) = solid emission
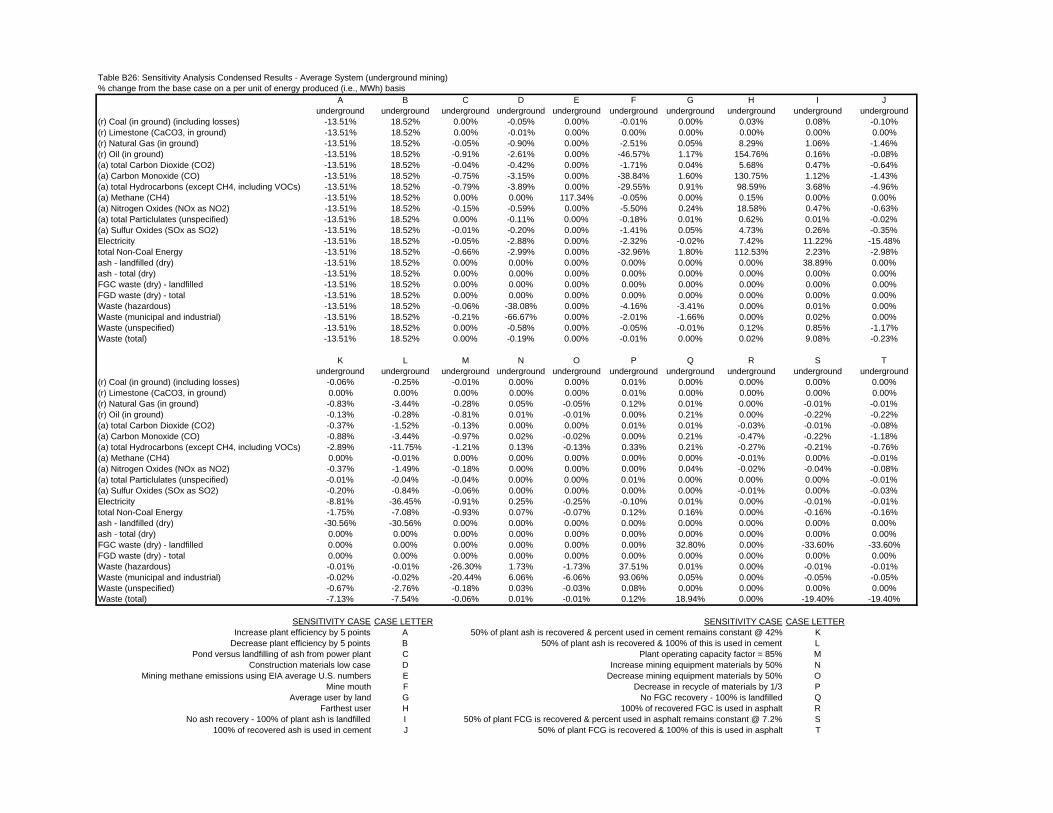
Table B26: Sensitivity Analysis Condensed Results - Average System (underground mining)% change from the base case on a per unit of energy produced (i.e., MWh) basis
A B C D E F G H I Junderground underground underground underground underground underground underground underground underground underground
(r) Coal (in ground) (including losses) -13.51% 18.52% 0.00% -0.05% 0.00% -0.01% 0.00% 0.03% 0.08% -0.10%(r) Limestone (CaCO3, in ground) -13.51% 18.52% 0.00% -0.01% 0.00% 0.00% 0.00% 0.00% 0.00% 0.00%(r) Natural Gas (in ground) -13.51% 18.52% -0.05% -0.90% 0.00% -2.51% 0.05% 8.29% 1.06% -1.46%(r) Oil (in ground) -13.51% 18.52% -0.91% -2.61% 0.00% -46.57% 1.17% 154.76% 0.16% -0.08%(a) total Carbon Dioxide (CO2) -13.51% 18.52% -0.04% -0.42% 0.00% -1.71% 0.04% 5.68% 0.47% -0.64%(a) Carbon Monoxide (CO) -13.51% 18.52% -0.75% -3.15% 0.00% -38.84% 1.60% 130.75% 1.12% -1.43%(a) total Hydrocarbons (except CH4, including VOCs) -13.51% 18.52% -0.79% -3.89% 0.00% -29.55% 0.91% 98.59% 3.68% -4.96%(a) Methane (CH4) -13.51% 18.52% 0.00% 0.00% 117.34% -0.05% 0.00% 0.15% 0.00% 0.00%(a) Nitrogen Oxides (NOx as NO2) -13.51% 18.52% -0.15% -0.59% 0.00% -5.50% 0.24% 18.58% 0.47% -0.63%(a) total Particlulates (unspecified) -13.51% 18.52% 0.00% -0.11% 0.00% -0.18% 0.01% 0.62% 0.01% -0.02%(a) Sulfur Oxides (SOx as SO2) -13.51% 18.52% -0.01% -0.20% 0.00% -1.41% 0.05% 4.73% 0.26% -0.35%Electricity -13.51% 18.52% -0.05% -2.88% 0.00% -2.32% -0.02% 7.42% 11.22% -15.48%total Non-Coal Energy -13.51% 18.52% -0.66% -2.99% 0.00% -32.96% 1.80% 112.53% 2.23% -2.98%ash - landfilled (dry) -13.51% 18.52% 0.00% 0.00% 0.00% 0.00% 0.00% 0.00% 38.89% 0.00%ash - total (dry) -13.51% 18.52% 0.00% 0.00% 0.00% 0.00% 0.00% 0.00% 0.00% 0.00%FGC waste (dry) - landfilled -13.51% 18.52% 0.00% 0.00% 0.00% 0.00% 0.00% 0.00% 0.00% 0.00%FGD waste (dry) - total -13.51% 18.52% 0.00% 0.00% 0.00% 0.00% 0.00% 0.00% 0.00% 0.00%Waste (hazardous) -13.51% 18.52% -0.06% -38.08% 0.00% -4.16% -3.41% 0.00% 0.01% 0.00%Waste (municipal and industrial) -13.51% 18.52% -0.21% -66.67% 0.00% -2.01% -1.66% 0.00% 0.02% 0.00%Waste (unspecified) -13.51% 18.52% 0.00% -0.58% 0.00% -0.05% -0.01% 0.12% 0.85% -1.17%Waste (total) -13.51% 18.52% 0.00% -0.19% 0.00% -0.01% 0.00% 0.02% 9.08% -0.23%
K L M N O P Q R S Tunderground underground underground underground underground underground underground underground underground underground
(r) Coal (in ground) (including losses) -0.06% -0.25% -0.01% 0.00% 0.00% 0.01% 0.00% 0.00% 0.00% 0.00%(r) Limestone (CaCO3, in ground) 0.00% 0.00% 0.00% 0.00% 0.00% 0.01% 0.00% 0.00% 0.00% 0.00%(r) Natural Gas (in ground) -0.83% -3.44% -0.28% 0.05% -0.05% 0.12% 0.01% 0.00% -0.01% -0.01%(r) Oil (in ground) -0.13% -0.28% -0.81% 0.01% -0.01% 0.00% 0.21% 0.00% -0.22% -0.22%(a) total Carbon Dioxide (CO2) -0.37% -1.52% -0.13% 0.00% 0.00% 0.01% 0.01% -0.03% -0.01% -0.08%(a) Carbon Monoxide (CO) -0.88% -3.44% -0.97% 0.02% -0.02% 0.00% 0.21% -0.47% -0.22% -1.18%(a) total Hydrocarbons (except CH4, including VOCs) -2.89% -11.75% -1.21% 0.13% -0.13% 0.33% 0.21% -0.27% -0.21% -0.76%(a) Methane (CH4) 0.00% -0.01% 0.00% 0.00% 0.00% 0.00% 0.00% -0.01% 0.00% -0.01%(a) Nitrogen Oxides (NOx as NO2) -0.37% -1.49% -0.18% 0.00% 0.00% 0.00% 0.04% -0.02% -0.04% -0.08%(a) total Particlulates (unspecified) -0.01% -0.04% -0.04% 0.00% 0.00% 0.01% 0.00% 0.00% 0.00% -0.01%(a) Sulfur Oxides (SOx as SO2) -0.20% -0.84% -0.06% 0.00% 0.00% 0.00% 0.00% -0.01% 0.00% -0.03%Electricity -8.81% -36.45% -0.91% 0.25% -0.25% -0.10% 0.01% 0.00% -0.01% -0.01%total Non-Coal Energy -1.75% -7.08% -0.93% 0.07% -0.07% 0.12% 0.16% 0.00% -0.16% -0.16%ash - landfilled (dry) -30.56% -30.56% 0.00% 0.00% 0.00% 0.00% 0.00% 0.00% 0.00% 0.00%ash - total (dry) 0.00% 0.00% 0.00% 0.00% 0.00% 0.00% 0.00% 0.00% 0.00% 0.00%FGC waste (dry) - landfilled 0.00% 0.00% 0.00% 0.00% 0.00% 0.00% 32.80% 0.00% -33.60% -33.60%FGD waste (dry) - total 0.00% 0.00% 0.00% 0.00% 0.00% 0.00% 0.00% 0.00% 0.00% 0.00%Waste (hazardous) -0.01% -0.01% -26.30% 1.73% -1.73% 37.51% 0.01% 0.00% -0.01% -0.01%Waste (municipal and industrial) -0.02% -0.02% -20.44% 6.06% -6.06% 93.06% 0.05% 0.00% -0.05% -0.05%Waste (unspecified) -0.67% -2.76% -0.18% 0.03% -0.03% 0.08% 0.00% 0.00% 0.00% 0.00%Waste (total) -7.13% -7.54% -0.06% 0.01% -0.01% 0.12% 18.94% 0.00% -19.40% -19.40%
SENSITIVITY CASE CASE LETTER SENSITIVITY CASE CASE LETTERIncrease plant efficiency by 5 points A 50% of plant ash is recovered & percent used in cement remains constant @ 42% K
Decrease plant efficiency by 5 points B 50% of plant ash is recovered & 100% of this is used in cement LPond versus landfilling of ash from power plant C Plant operating capacity factor = 85% M
Construction materials low case D Increase mining equipment materials by 50% NMining methane emissions using EIA average U.S. numbers E Decrease mining equipment materials by 50% O
Mine mouth F Decrease in recycle of materials by 1/3 PAverage user by land G No FGC recovery - 100% is landfilled Q
Farthest user H 100% of recovered FGC is used in asphalt RNo ash recovery - 100% of plant ash is landfilled I 50% of plant FCG is recovered & percent used in asphalt remains constant @ 7.2% S
100% of recovered ash is used in cement J 50% of plant FCG is recovered & 100% of this is used in asphalt T
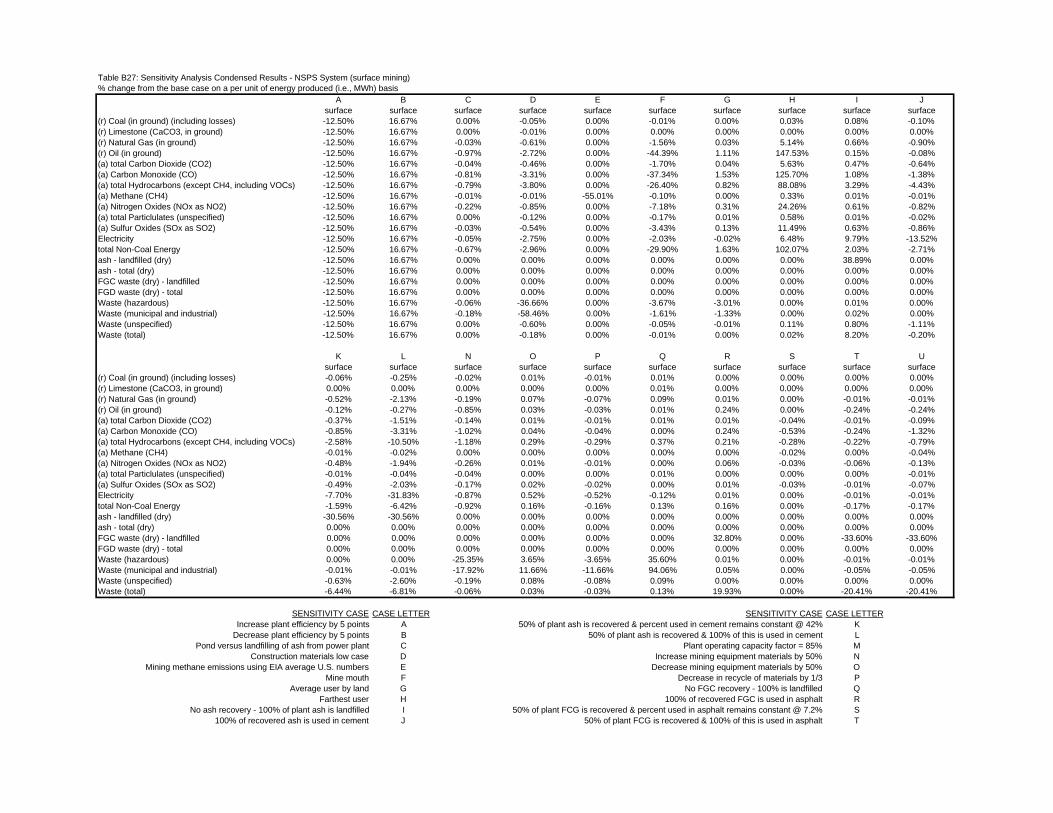
Table B27: Sensitivity Analysis Condensed Results - NSPS System (surface mining)% change from the base case on a per unit of energy produced (i.e., MWh) basis
A B C D E F G H I Jsurface surface surface surface surface surface surface surface surface surface
(r) Coal (in ground) (including losses) -12.50% 16.67% 0.00% -0.05% 0.00% -0.01% 0.00% 0.03% 0.08% -0.10%(r) Limestone (CaCO3, in ground) -12.50% 16.67% 0.00% -0.01% 0.00% 0.00% 0.00% 0.00% 0.00% 0.00%(r) Natural Gas (in ground) -12.50% 16.67% -0.03% -0.61% 0.00% -1.56% 0.03% 5.14% 0.66% -0.90%(r) Oil (in ground) -12.50% 16.67% -0.97% -2.72% 0.00% -44.39% 1.11% 147.53% 0.15% -0.08%(a) total Carbon Dioxide (CO2) -12.50% 16.67% -0.04% -0.46% 0.00% -1.70% 0.04% 5.63% 0.47% -0.64%(a) Carbon Monoxide (CO) -12.50% 16.67% -0.81% -3.31% 0.00% -37.34% 1.53% 125.70% 1.08% -1.38%(a) total Hydrocarbons (except CH4, including VOCs) -12.50% 16.67% -0.79% -3.80% 0.00% -26.40% 0.82% 88.08% 3.29% -4.43%(a) Methane (CH4) -12.50% 16.67% -0.01% -0.01% -55.01% -0.10% 0.00% 0.33% 0.01% -0.01%(a) Nitrogen Oxides (NOx as NO2) -12.50% 16.67% -0.22% -0.85% 0.00% -7.18% 0.31% 24.26% 0.61% -0.82%(a) total Particlulates (unspecified) -12.50% 16.67% 0.00% -0.12% 0.00% -0.17% 0.01% 0.58% 0.01% -0.02%(a) Sulfur Oxides (SOx as SO2) -12.50% 16.67% -0.03% -0.54% 0.00% -3.43% 0.13% 11.49% 0.63% -0.86%Electricity -12.50% 16.67% -0.05% -2.75% 0.00% -2.03% -0.02% 6.48% 9.79% -13.52%total Non-Coal Energy -12.50% 16.67% -0.67% -2.96% 0.00% -29.90% 1.63% 102.07% 2.03% -2.71%ash - landfilled (dry) -12.50% 16.67% 0.00% 0.00% 0.00% 0.00% 0.00% 0.00% 38.89% 0.00%ash - total (dry) -12.50% 16.67% 0.00% 0.00% 0.00% 0.00% 0.00% 0.00% 0.00% 0.00%FGC waste (dry) - landfilled -12.50% 16.67% 0.00% 0.00% 0.00% 0.00% 0.00% 0.00% 0.00% 0.00%FGD waste (dry) - total -12.50% 16.67% 0.00% 0.00% 0.00% 0.00% 0.00% 0.00% 0.00% 0.00%Waste (hazardous) -12.50% 16.67% -0.06% -36.66% 0.00% -3.67% -3.01% 0.00% 0.01% 0.00%Waste (municipal and industrial) -12.50% 16.67% -0.18% -58.46% 0.00% -1.61% -1.33% 0.00% 0.02% 0.00%Waste (unspecified) -12.50% 16.67% 0.00% -0.60% 0.00% -0.05% -0.01% 0.11% 0.80% -1.11%Waste (total) -12.50% 16.67% 0.00% -0.18% 0.00% -0.01% 0.00% 0.02% 8.20% -0.20%
K L N O P Q R S T Usurface surface surface surface surface surface surface surface surface surface
(r) Coal (in ground) (including losses) -0.06% -0.25% -0.02% 0.01% -0.01% 0.01% 0.00% 0.00% 0.00% 0.00%(r) Limestone (CaCO3, in ground) 0.00% 0.00% 0.00% 0.00% 0.00% 0.01% 0.00% 0.00% 0.00% 0.00%(r) Natural Gas (in ground) -0.52% -2.13% -0.19% 0.07% -0.07% 0.09% 0.01% 0.00% -0.01% -0.01%(r) Oil (in ground) -0.12% -0.27% -0.85% 0.03% -0.03% 0.01% 0.24% 0.00% -0.24% -0.24%(a) total Carbon Dioxide (CO2) -0.37% -1.51% -0.14% 0.01% -0.01% 0.01% 0.01% -0.04% -0.01% -0.09%(a) Carbon Monoxide (CO) -0.85% -3.31% -1.02% 0.04% -0.04% 0.00% 0.24% -0.53% -0.24% -1.32%(a) total Hydrocarbons (except CH4, including VOCs) -2.58% -10.50% -1.18% 0.29% -0.29% 0.37% 0.21% -0.28% -0.22% -0.79%(a) Methane (CH4) -0.01% -0.02% 0.00% 0.00% 0.00% 0.00% 0.00% -0.02% 0.00% -0.04%(a) Nitrogen Oxides (NOx as NO2) -0.48% -1.94% -0.26% 0.01% -0.01% 0.00% 0.06% -0.03% -0.06% -0.13%(a) total Particlulates (unspecified) -0.01% -0.04% -0.04% 0.00% 0.00% 0.01% 0.00% 0.00% 0.00% -0.01%(a) Sulfur Oxides (SOx as SO2) -0.49% -2.03% -0.17% 0.02% -0.02% 0.00% 0.01% -0.03% -0.01% -0.07%Electricity -7.70% -31.83% -0.87% 0.52% -0.52% -0.12% 0.01% 0.00% -0.01% -0.01%total Non-Coal Energy -1.59% -6.42% -0.92% 0.16% -0.16% 0.13% 0.16% 0.00% -0.17% -0.17%ash - landfilled (dry) -30.56% -30.56% 0.00% 0.00% 0.00% 0.00% 0.00% 0.00% 0.00% 0.00%ash - total (dry) 0.00% 0.00% 0.00% 0.00% 0.00% 0.00% 0.00% 0.00% 0.00% 0.00%FGC waste (dry) - landfilled 0.00% 0.00% 0.00% 0.00% 0.00% 0.00% 32.80% 0.00% -33.60% -33.60%FGD waste (dry) - total 0.00% 0.00% 0.00% 0.00% 0.00% 0.00% 0.00% 0.00% 0.00% 0.00%Waste (hazardous) 0.00% 0.00% -25.35% 3.65% -3.65% 35.60% 0.01% 0.00% -0.01% -0.01%Waste (municipal and industrial) -0.01% -0.01% -17.92% 11.66% -11.66% 94.06% 0.05% 0.00% -0.05% -0.05%Waste (unspecified) -0.63% -2.60% -0.19% 0.08% -0.08% 0.09% 0.00% 0.00% 0.00% 0.00%Waste (total) -6.44% -6.81% -0.06% 0.03% -0.03% 0.13% 19.93% 0.00% -20.41% -20.41%
SENSITIVITY CASE CASE LETTER SENSITIVITY CASE CASE LETTERIncrease plant efficiency by 5 points A 50% of plant ash is recovered & percent used in cement remains constant @ 42% K
Decrease plant efficiency by 5 points B 50% of plant ash is recovered & 100% of this is used in cement LPond versus landfilling of ash from power plant C Plant operating capacity factor = 85% M
Construction materials low case D Increase mining equipment materials by 50% NMining methane emissions using EIA average U.S. numbers E Decrease mining equipment materials by 50% O
Mine mouth F Decrease in recycle of materials by 1/3 PAverage user by land G No FGC recovery - 100% is landfilled Q
Farthest user H 100% of recovered FGC is used in asphalt RNo ash recovery - 100% of plant ash is landfilled I 50% of plant FCG is recovered & percent used in asphalt remains constant @ 7.2% S
100% of recovered ash is used in cement J 50% of plant FCG is recovered & 100% of this is used in asphalt T
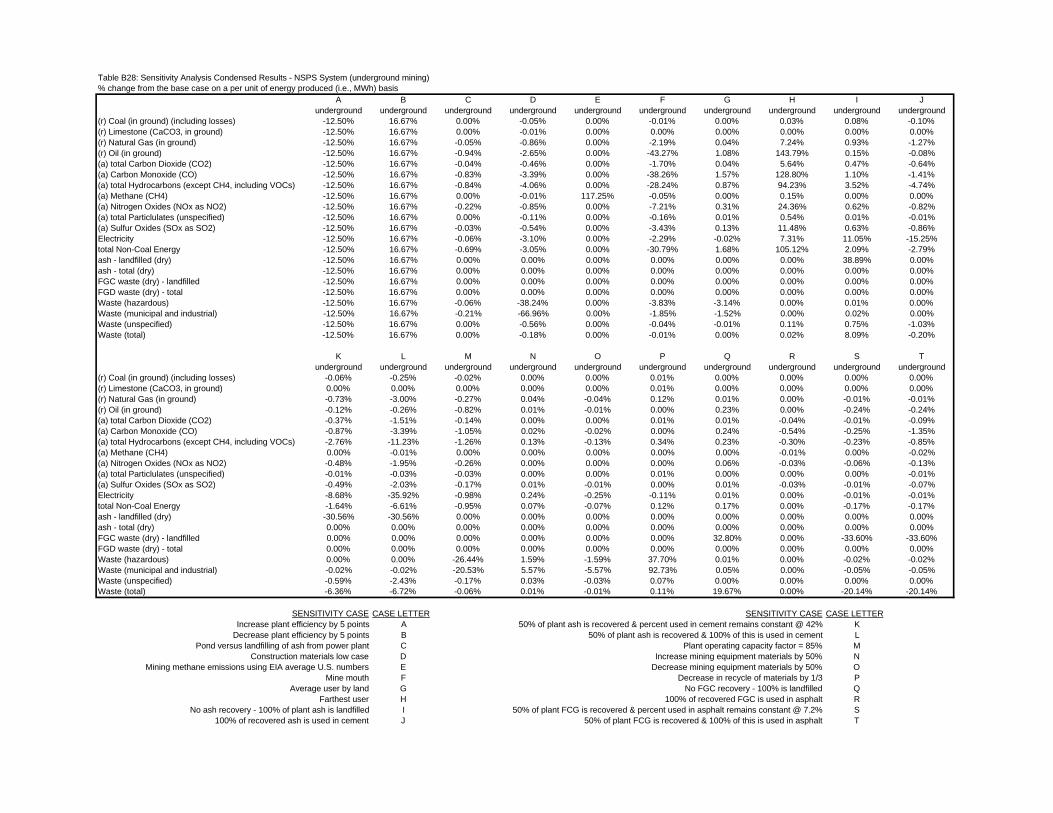
Table B28: Sensitivity Analysis Condensed Results - NSPS System (underground mining)% change from the base case on a per unit of energy produced (i.e., MWh) basis
A B C D E F G H I Junderground underground underground underground underground underground underground underground underground underground
(r) Coal (in ground) (including losses) -12.50% 16.67% 0.00% -0.05% 0.00% -0.01% 0.00% 0.03% 0.08% -0.10%(r) Limestone (CaCO3, in ground) -12.50% 16.67% 0.00% -0.01% 0.00% 0.00% 0.00% 0.00% 0.00% 0.00%(r) Natural Gas (in ground) -12.50% 16.67% -0.05% -0.86% 0.00% -2.19% 0.04% 7.24% 0.93% -1.27%(r) Oil (in ground) -12.50% 16.67% -0.94% -2.65% 0.00% -43.27% 1.08% 143.79% 0.15% -0.08%(a) total Carbon Dioxide (CO2) -12.50% 16.67% -0.04% -0.46% 0.00% -1.70% 0.04% 5.64% 0.47% -0.64%(a) Carbon Monoxide (CO) -12.50% 16.67% -0.83% -3.39% 0.00% -38.26% 1.57% 128.80% 1.10% -1.41%(a) total Hydrocarbons (except CH4, including VOCs) -12.50% 16.67% -0.84% -4.06% 0.00% -28.24% 0.87% 94.23% 3.52% -4.74%(a) Methane (CH4) -12.50% 16.67% 0.00% -0.01% 117.25% -0.05% 0.00% 0.15% 0.00% 0.00%(a) Nitrogen Oxides (NOx as NO2) -12.50% 16.67% -0.22% -0.85% 0.00% -7.21% 0.31% 24.36% 0.62% -0.82%(a) total Particlulates (unspecified) -12.50% 16.67% 0.00% -0.11% 0.00% -0.16% 0.01% 0.54% 0.01% -0.01%(a) Sulfur Oxides (SOx as SO2) -12.50% 16.67% -0.03% -0.54% 0.00% -3.43% 0.13% 11.48% 0.63% -0.86%Electricity -12.50% 16.67% -0.06% -3.10% 0.00% -2.29% -0.02% 7.31% 11.05% -15.25%total Non-Coal Energy -12.50% 16.67% -0.69% -3.05% 0.00% -30.79% 1.68% 105.12% 2.09% -2.79%ash - landfilled (dry) -12.50% 16.67% 0.00% 0.00% 0.00% 0.00% 0.00% 0.00% 38.89% 0.00%ash - total (dry) -12.50% 16.67% 0.00% 0.00% 0.00% 0.00% 0.00% 0.00% 0.00% 0.00%FGC waste (dry) - landfilled -12.50% 16.67% 0.00% 0.00% 0.00% 0.00% 0.00% 0.00% 0.00% 0.00%FGD waste (dry) - total -12.50% 16.67% 0.00% 0.00% 0.00% 0.00% 0.00% 0.00% 0.00% 0.00%Waste (hazardous) -12.50% 16.67% -0.06% -38.24% 0.00% -3.83% -3.14% 0.00% 0.01% 0.00%Waste (municipal and industrial) -12.50% 16.67% -0.21% -66.96% 0.00% -1.85% -1.52% 0.00% 0.02% 0.00%Waste (unspecified) -12.50% 16.67% 0.00% -0.56% 0.00% -0.04% -0.01% 0.11% 0.75% -1.03%Waste (total) -12.50% 16.67% 0.00% -0.18% 0.00% -0.01% 0.00% 0.02% 8.09% -0.20%
K L M N O P Q R S Tunderground underground underground underground underground underground underground underground underground underground
(r) Coal (in ground) (including losses) -0.06% -0.25% -0.02% 0.00% 0.00% 0.01% 0.00% 0.00% 0.00% 0.00%(r) Limestone (CaCO3, in ground) 0.00% 0.00% 0.00% 0.00% 0.00% 0.01% 0.00% 0.00% 0.00% 0.00%(r) Natural Gas (in ground) -0.73% -3.00% -0.27% 0.04% -0.04% 0.12% 0.01% 0.00% -0.01% -0.01%(r) Oil (in ground) -0.12% -0.26% -0.82% 0.01% -0.01% 0.00% 0.23% 0.00% -0.24% -0.24%(a) total Carbon Dioxide (CO2) -0.37% -1.51% -0.14% 0.00% 0.00% 0.01% 0.01% -0.04% -0.01% -0.09%(a) Carbon Monoxide (CO) -0.87% -3.39% -1.05% 0.02% -0.02% 0.00% 0.24% -0.54% -0.25% -1.35%(a) total Hydrocarbons (except CH4, including VOCs) -2.76% -11.23% -1.26% 0.13% -0.13% 0.34% 0.23% -0.30% -0.23% -0.85%(a) Methane (CH4) 0.00% -0.01% 0.00% 0.00% 0.00% 0.00% 0.00% -0.01% 0.00% -0.02%(a) Nitrogen Oxides (NOx as NO2) -0.48% -1.95% -0.26% 0.00% 0.00% 0.00% 0.06% -0.03% -0.06% -0.13%(a) total Particlulates (unspecified) -0.01% -0.03% -0.03% 0.00% 0.00% 0.01% 0.00% 0.00% 0.00% -0.01%(a) Sulfur Oxides (SOx as SO2) -0.49% -2.03% -0.17% 0.01% -0.01% 0.00% 0.01% -0.03% -0.01% -0.07%Electricity -8.68% -35.92% -0.98% 0.24% -0.25% -0.11% 0.01% 0.00% -0.01% -0.01%total Non-Coal Energy -1.64% -6.61% -0.95% 0.07% -0.07% 0.12% 0.17% 0.00% -0.17% -0.17%ash - landfilled (dry) -30.56% -30.56% 0.00% 0.00% 0.00% 0.00% 0.00% 0.00% 0.00% 0.00%ash - total (dry) 0.00% 0.00% 0.00% 0.00% 0.00% 0.00% 0.00% 0.00% 0.00% 0.00%FGC waste (dry) - landfilled 0.00% 0.00% 0.00% 0.00% 0.00% 0.00% 32.80% 0.00% -33.60% -33.60%FGD waste (dry) - total 0.00% 0.00% 0.00% 0.00% 0.00% 0.00% 0.00% 0.00% 0.00% 0.00%Waste (hazardous) 0.00% 0.00% -26.44% 1.59% -1.59% 37.70% 0.01% 0.00% -0.02% -0.02%Waste (municipal and industrial) -0.02% -0.02% -20.53% 5.57% -5.57% 92.73% 0.05% 0.00% -0.05% -0.05%Waste (unspecified) -0.59% -2.43% -0.17% 0.03% -0.03% 0.07% 0.00% 0.00% 0.00% 0.00%Waste (total) -6.36% -6.72% -0.06% 0.01% -0.01% 0.11% 19.67% 0.00% -20.14% -20.14%
SENSITIVITY CASE CASE LETTER SENSITIVITY CASE CASE LETTERIncrease plant efficiency by 5 points A 50% of plant ash is recovered & percent used in cement remains constant @ 42% K
Decrease plant efficiency by 5 points B 50% of plant ash is recovered & 100% of this is used in cement LPond versus landfilling of ash from power plant C Plant operating capacity factor = 85% M
Construction materials low case D Increase mining equipment materials by 50% NMining methane emissions using EIA average U.S. numbers E Decrease mining equipment materials by 50% O
Mine mouth F Decrease in recycle of materials by 1/3 PAverage user by land G No FGC recovery - 100% is landfilled Q
Farthest user H 100% of recovered FGC is used in asphalt RNo ash recovery - 100% of plant ash is landfilled I 50% of plant FCG is recovered & percent used in asphalt remains constant @ 7.2% S
100% of recovered ash is used in cement J 50% of plant FCG is recovered & 100% of this is used in asphalt T

Table B29: Sensitivity Analysis Condensed Results - LEBS System (surface mining)% change from the base case on a per unit of energy produced (i.e., MWh) basis
A B C D E F G Hsurface surface surface surface surface surface surface surface
(r) Coal (in ground) (including losses) -10.64% 13.51% 0.00% -0.06% 0.00% -0.01% 0.00% 0.03%(r) Limestone (CaCO3, in ground) -10.65% 13.49% -0.04% -17.11% 0.00% -0.41% -0.33% 0.00%(r) Natural Gas (in ground) -10.64% 13.51% 0.00% -0.17% 0.00% -0.35% 0.01% 1.16%(r) Oil (in ground) -10.64% 13.51% -0.47% -6.32% 0.00% -83.75% 2.10% 278.34%(a) total Carbon Dioxide (CO2) -10.64% 13.51% -0.01% -0.58% 0.00% -1.75% 0.04% 5.81%(a) Carbon Monoxide (CO) -10.64% 13.51% -0.22% -4.30% 0.00% -39.40% 1.62% 132.62%(a) total Hydrocarbons (except CH4, including VOCs) -10.64% 13.51% -0.17% -4.03% 0.00% -22.75% 0.70% 75.93%(a) Methane (CH4) -10.64% 13.51% 0.00% -0.01% -52.37% -0.10% 0.00% 0.32%(a) Nitrogen Oxides (NOx as NO2) -10.64% 13.51% -0.20% -3.64% 0.00% -25.12% 1.08% 84.84%(a) total Particlulates (unspecified) -10.64% 13.51% -0.08% -10.32% 0.00% -12.16% 0.61% 41.36%(a) Sulfur Oxides (SOx as SO2) -10.64% 13.51% -0.02% -1.91% 0.00% -9.85% 0.37% 32.98%Electricity -10.64% 13.51% -0.01% -3.45% 0.00% -2.06% -0.02% 6.60%total Non-Coal Energy -10.64% 13.51% -0.18% -3.91% 0.00% -32.07% 1.75% 109.47%ash - landfilled (dry) -10.64% 13.51% 0.00% 0.00% 0.00% 0.00% 0.00% 0.00%ash - total (dry) -10.64% 13.51% 0.00% 0.00% 0.00% 0.00% 0.00% 0.00%Waste (hazardous) -10.64% 13.51% -0.01% -38.48% 0.00% -3.13% -2.57% 0.00%Waste (municipal and industrial) -10.64% 13.51% -0.05% -71.46% 0.00% -1.60% -1.32% 0.00%Waste (unspecified) -10.64% 13.51% -0.01% -8.87% 0.00% -0.55% -0.10% 1.38%Waste (total) -10.64% 13.51% 0.00% -1.01% 0.00% -0.05% -0.01% 0.09%
I J K L M N O Psurface surface surface surface surface surface surface surface
(r) Coal (in ground) (including losses) 0.08% 0.00% -0.06% -0.25% -0.02% 0.01% -0.01% 0.01%(r) Limestone (CaCO3, in ground) 0.00% 0.00% 0.00% 0.00% -5.34% 2.75% -2.80% 15.73%(r) Natural Gas (in ground) 0.15% 0.00% -0.12% -0.48% -0.05% 0.02% -0.02% 0.02%(r) Oil (in ground) 0.29% 0.00% -0.23% -0.50% -1.96% 0.05% -0.05% 0.01%(a) total Carbon Dioxide (CO2) 0.48% 0.00% -0.38% -1.56% -0.18% 0.01% -0.01% 0.01%(a) Carbon Monoxide (CO) 1.14% 0.00% -0.90% -3.50% -1.33% 0.04% -0.04% 0.00%(a) total Hydrocarbons (except CH4, including VOCs) 2.84% 0.00% -2.23% -9.07% -1.25% 0.25% -0.25% 0.34%(a) Methane (CH4) 0.00% 0.00% 0.00% -0.02% 0.00% 0.00% 0.00% 0.00%(a) Nitrogen Oxides (NOx as NO2) 2.15% 0.00% -1.69% -6.81% -1.13% 0.03% -0.03% 0.00%(a) total Particlulates (unspecified) 0.82% 0.00% -0.64% -2.59% -3.18% 0.18% -0.18% 0.85%(a) Sulfur Oxides (SOx as SO2) 1.80% 0.00% -1.42% -5.84% -0.59% 0.05% -0.05% 0.01%Electricity 10.00% 0.00% -7.86% -32.51% -1.09% 0.53% -0.53% -0.12%total Non-Coal Energy 2.18% 0.00% -1.71% -6.90% -1.22% 0.17% -0.17% 0.15%ash - landfilled (dry) 38.89% 0.00% -30.56% -30.56% 0.00% 0.00% 0.00% 0.00%ash - total (dry) 0.00% 0.00% 0.00% 0.00% 0.00% 0.00% 0.00% 0.00%Waste (hazardous) 0.00% 0.00% 0.00% 0.00% -26.60% 3.11% -3.11% 37.82%Waste (municipal and industrial) 0.02% 0.00% -0.01% -0.01% -21.91% 11.59% -11.59% 99.23%Waste (unspecified) 9.61% 0.00% -7.55% -31.25% -2.76% 0.93% -0.93% 1.18%Waste (total) 36.66% 0.00% -28.81% -30.43% -0.31% 0.13% -0.13% 0.64%
SENSITIVITY CASE CASE LETTER SENSITIVITY CASE CASE LETTERIncrease plant efficiency by 5 points A No ash recovery - 100% of plant ash is landfilled I
Decrease plant efficiency by 5 points B 100% of recovered ash is used in cement JPond versus landfilling of ash from power plant C 50% of plant ash is recovered & percent used in cement remains constant @ 42% K
Construction materials low case D 50% of plant ash is recovered & 100% of this is used in cement LMining methane emissions using EIA average U.S. numbers E Plant operating capacity factor = 85% M
Mine mouth F Increase mining equipment materials by 50% NAverage user by land G Decrease mining equipment materials by 50% O
Farthest user H Decrease in recycle of materials by 1/3 P
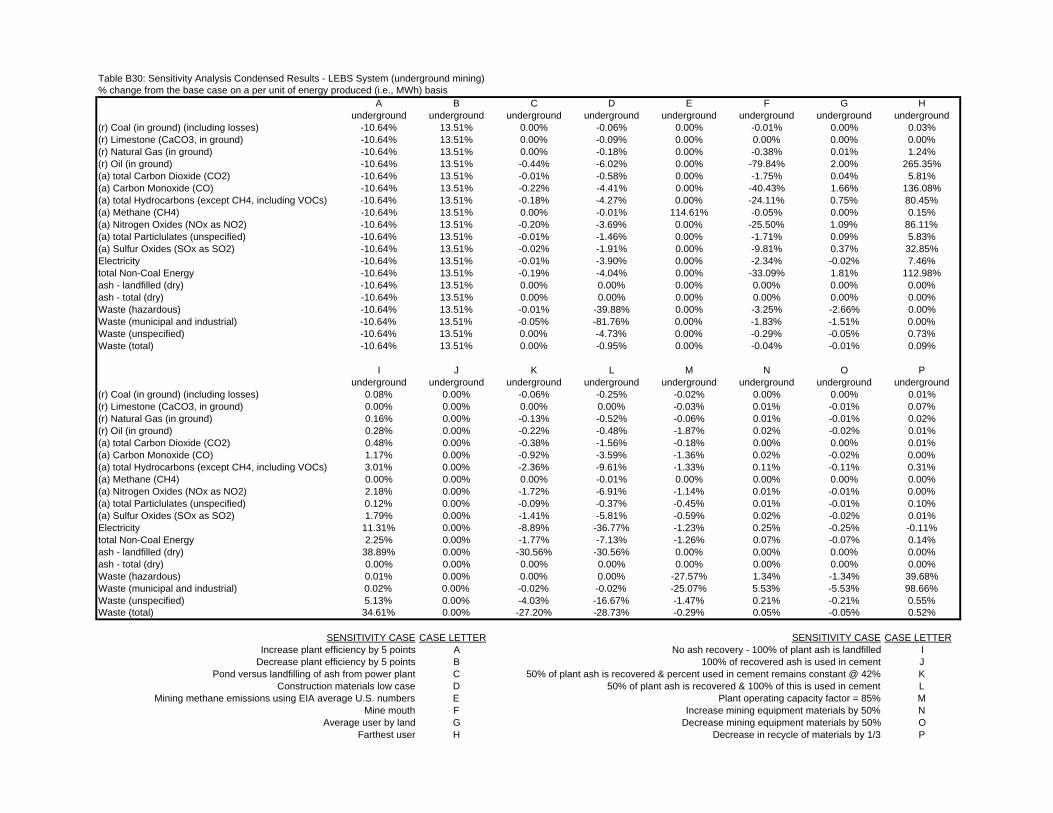
Table B30: Sensitivity Analysis Condensed Results - LEBS System (underground mining)% change from the base case on a per unit of energy produced (i.e., MWh) basis
A B C D E F G Hunderground underground underground underground underground underground underground underground
(r) Coal (in ground) (including losses) -10.64% 13.51% 0.00% -0.06% 0.00% -0.01% 0.00% 0.03%(r) Limestone (CaCO3, in ground) -10.64% 13.51% 0.00% -0.09% 0.00% 0.00% 0.00% 0.00%(r) Natural Gas (in ground) -10.64% 13.51% 0.00% -0.18% 0.00% -0.38% 0.01% 1.24%(r) Oil (in ground) -10.64% 13.51% -0.44% -6.02% 0.00% -79.84% 2.00% 265.35%(a) total Carbon Dioxide (CO2) -10.64% 13.51% -0.01% -0.58% 0.00% -1.75% 0.04% 5.81%(a) Carbon Monoxide (CO) -10.64% 13.51% -0.22% -4.41% 0.00% -40.43% 1.66% 136.08%(a) total Hydrocarbons (except CH4, including VOCs) -10.64% 13.51% -0.18% -4.27% 0.00% -24.11% 0.75% 80.45%(a) Methane (CH4) -10.64% 13.51% 0.00% -0.01% 114.61% -0.05% 0.00% 0.15%(a) Nitrogen Oxides (NOx as NO2) -10.64% 13.51% -0.20% -3.69% 0.00% -25.50% 1.09% 86.11%(a) total Particlulates (unspecified) -10.64% 13.51% -0.01% -1.46% 0.00% -1.71% 0.09% 5.83%(a) Sulfur Oxides (SOx as SO2) -10.64% 13.51% -0.02% -1.91% 0.00% -9.81% 0.37% 32.85%Electricity -10.64% 13.51% -0.01% -3.90% 0.00% -2.34% -0.02% 7.46%total Non-Coal Energy -10.64% 13.51% -0.19% -4.04% 0.00% -33.09% 1.81% 112.98%ash - landfilled (dry) -10.64% 13.51% 0.00% 0.00% 0.00% 0.00% 0.00% 0.00%ash - total (dry) -10.64% 13.51% 0.00% 0.00% 0.00% 0.00% 0.00% 0.00%Waste (hazardous) -10.64% 13.51% -0.01% -39.88% 0.00% -3.25% -2.66% 0.00%Waste (municipal and industrial) -10.64% 13.51% -0.05% -81.76% 0.00% -1.83% -1.51% 0.00%Waste (unspecified) -10.64% 13.51% 0.00% -4.73% 0.00% -0.29% -0.05% 0.73%Waste (total) -10.64% 13.51% 0.00% -0.95% 0.00% -0.04% -0.01% 0.09%
I J K L M N O Punderground underground underground underground underground underground underground underground
(r) Coal (in ground) (including losses) 0.08% 0.00% -0.06% -0.25% -0.02% 0.00% 0.00% 0.01%(r) Limestone (CaCO3, in ground) 0.00% 0.00% 0.00% 0.00% -0.03% 0.01% -0.01% 0.07%(r) Natural Gas (in ground) 0.16% 0.00% -0.13% -0.52% -0.06% 0.01% -0.01% 0.02%(r) Oil (in ground) 0.28% 0.00% -0.22% -0.48% -1.87% 0.02% -0.02% 0.01%(a) total Carbon Dioxide (CO2) 0.48% 0.00% -0.38% -1.56% -0.18% 0.00% 0.00% 0.01%(a) Carbon Monoxide (CO) 1.17% 0.00% -0.92% -3.59% -1.36% 0.02% -0.02% 0.00%(a) total Hydrocarbons (except CH4, including VOCs) 3.01% 0.00% -2.36% -9.61% -1.33% 0.11% -0.11% 0.31%(a) Methane (CH4) 0.00% 0.00% 0.00% -0.01% 0.00% 0.00% 0.00% 0.00%(a) Nitrogen Oxides (NOx as NO2) 2.18% 0.00% -1.72% -6.91% -1.14% 0.01% -0.01% 0.00%(a) total Particlulates (unspecified) 0.12% 0.00% -0.09% -0.37% -0.45% 0.01% -0.01% 0.10%(a) Sulfur Oxides (SOx as SO2) 1.79% 0.00% -1.41% -5.81% -0.59% 0.02% -0.02% 0.01%Electricity 11.31% 0.00% -8.89% -36.77% -1.23% 0.25% -0.25% -0.11%total Non-Coal Energy 2.25% 0.00% -1.77% -7.13% -1.26% 0.07% -0.07% 0.14%ash - landfilled (dry) 38.89% 0.00% -30.56% -30.56% 0.00% 0.00% 0.00% 0.00%ash - total (dry) 0.00% 0.00% 0.00% 0.00% 0.00% 0.00% 0.00% 0.00%Waste (hazardous) 0.01% 0.00% 0.00% 0.00% -27.57% 1.34% -1.34% 39.68%Waste (municipal and industrial) 0.02% 0.00% -0.02% -0.02% -25.07% 5.53% -5.53% 98.66%Waste (unspecified) 5.13% 0.00% -4.03% -16.67% -1.47% 0.21% -0.21% 0.55%Waste (total) 34.61% 0.00% -27.20% -28.73% -0.29% 0.05% -0.05% 0.52%
SENSITIVITY CASE CASE LETTER SENSITIVITY CASE CASE LETTERIncrease plant efficiency by 5 points A No ash recovery - 100% of plant ash is landfilled I
Decrease plant efficiency by 5 points B 100% of recovered ash is used in cement JPond versus landfilling of ash from power plant C 50% of plant ash is recovered & percent used in cement remains constant @ 42% K
Construction materials low case D 50% of plant ash is recovered & 100% of this is used in cement LMining methane emissions using EIA average U.S. numbers E Plant operating capacity factor = 85% M
Mine mouth F Increase mining equipment materials by 50% NAverage user by land G Decrease mining equipment materials by 50% O
Farthest user H Decrease in recycle of materials by 1/3 P
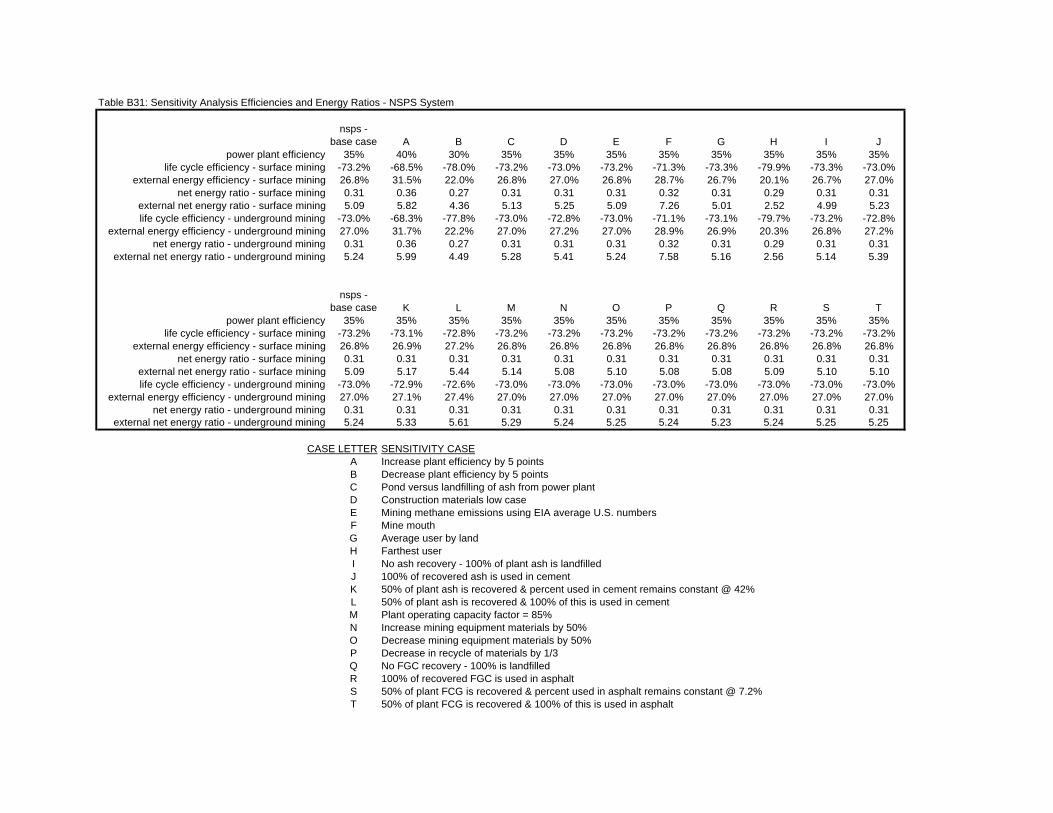
Table B31: Sensitivity Analysis Efficiencies and Energy Ratios - NSPS System
nsps - base case A B C D E F G H I J
power plant efficiency 35% 40% 30% 35% 35% 35% 35% 35% 35% 35% 35%life cycle efficiency - surface mining -73.2% -68.5% -78.0% -73.2% -73.0% -73.2% -71.3% -73.3% -79.9% -73.3% -73.0%
external energy efficiency - surface mining 26.8% 31.5% 22.0% 26.8% 27.0% 26.8% 28.7% 26.7% 20.1% 26.7% 27.0%net energy ratio - surface mining 0.31 0.36 0.27 0.31 0.31 0.31 0.32 0.31 0.29 0.31 0.31
external net energy ratio - surface mining 5.09 5.82 4.36 5.13 5.25 5.09 7.26 5.01 2.52 4.99 5.23life cycle efficiency - underground mining -73.0% -68.3% -77.8% -73.0% -72.8% -73.0% -71.1% -73.1% -79.7% -73.2% -72.8%
external energy efficiency - underground mining 27.0% 31.7% 22.2% 27.0% 27.2% 27.0% 28.9% 26.9% 20.3% 26.8% 27.2%net energy ratio - underground mining 0.31 0.36 0.27 0.31 0.31 0.31 0.32 0.31 0.29 0.31 0.31
external net energy ratio - underground mining 5.24 5.99 4.49 5.28 5.41 5.24 7.58 5.16 2.56 5.14 5.39
nsps - base case K L M N O P Q R S T
power plant efficiency 35% 35% 35% 35% 35% 35% 35% 35% 35% 35% 35%life cycle efficiency - surface mining -73.2% -73.1% -72.8% -73.2% -73.2% -73.2% -73.2% -73.2% -73.2% -73.2% -73.2%
external energy efficiency - surface mining 26.8% 26.9% 27.2% 26.8% 26.8% 26.8% 26.8% 26.8% 26.8% 26.8% 26.8%net energy ratio - surface mining 0.31 0.31 0.31 0.31 0.31 0.31 0.31 0.31 0.31 0.31 0.31
external net energy ratio - surface mining 5.09 5.17 5.44 5.14 5.08 5.10 5.08 5.08 5.09 5.10 5.10life cycle efficiency - underground mining -73.0% -72.9% -72.6% -73.0% -73.0% -73.0% -73.0% -73.0% -73.0% -73.0% -73.0%
external energy efficiency - underground mining 27.0% 27.1% 27.4% 27.0% 27.0% 27.0% 27.0% 27.0% 27.0% 27.0% 27.0%net energy ratio - underground mining 0.31 0.31 0.31 0.31 0.31 0.31 0.31 0.31 0.31 0.31 0.31
external net energy ratio - underground mining 5.24 5.33 5.61 5.29 5.24 5.25 5.24 5.23 5.24 5.25 5.25
CASE LETTER SENSITIVITY CASEA Increase plant efficiency by 5 pointsB Decrease plant efficiency by 5 pointsC Pond versus landfilling of ash from power plantD Construction materials low caseE Mining methane emissions using EIA average U.S. numbersF Mine mouthG Average user by landH Farthest userI No ash recovery - 100% of plant ash is landfilledJ 100% of recovered ash is used in cementK 50% of plant ash is recovered & percent used in cement remains constant @ 42%L 50% of plant ash is recovered & 100% of this is used in cementM Plant operating capacity factor = 85%N Increase mining equipment materials by 50%O Decrease mining equipment materials by 50%P Decrease in recycle of materials by 1/3Q No FGC recovery - 100% is landfilledR 100% of recovered FGC is used in asphaltS 50% of plant FCG is recovered & percent used in asphalt remains constant @ 7.2%T 50% of plant FCG is recovered & 100% of this is used in asphalt
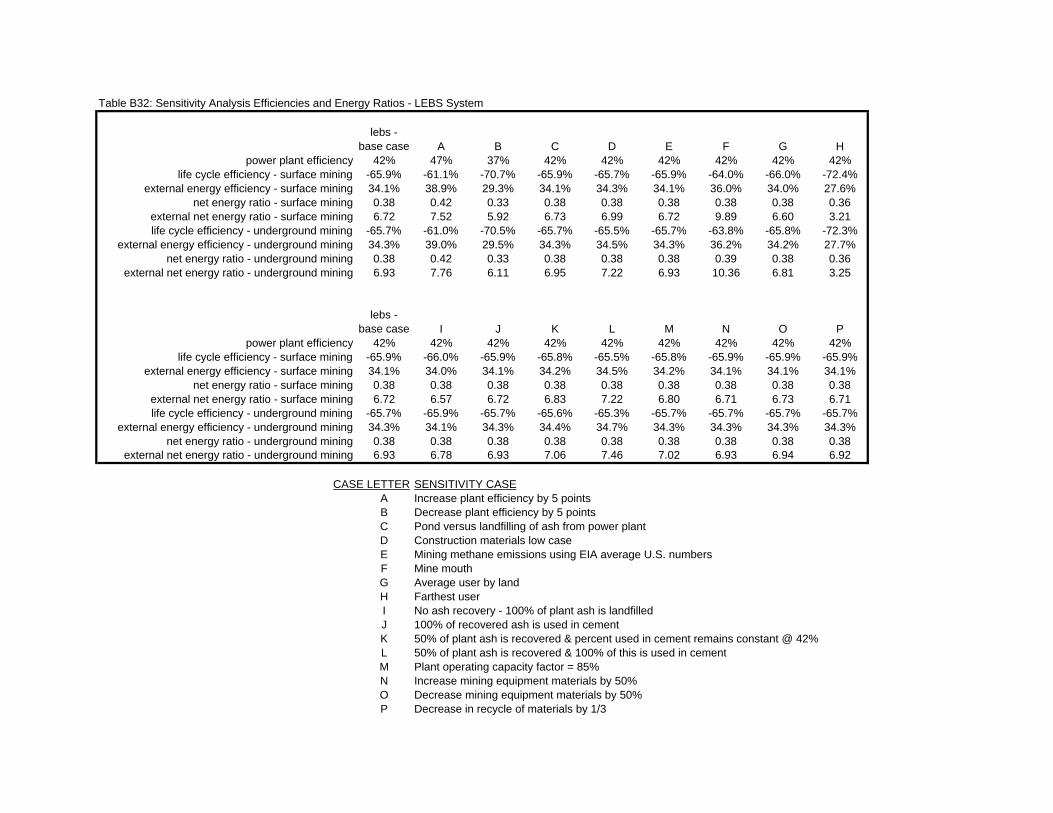
Table B32: Sensitivity Analysis Efficiencies and Energy Ratios - LEBS System
lebs - base case A B C D E F G H
power plant efficiency 42% 47% 37% 42% 42% 42% 42% 42% 42%life cycle efficiency - surface mining -65.9% -61.1% -70.7% -65.9% -65.7% -65.9% -64.0% -66.0% -72.4%
external energy efficiency - surface mining 34.1% 38.9% 29.3% 34.1% 34.3% 34.1% 36.0% 34.0% 27.6%net energy ratio - surface mining 0.38 0.42 0.33 0.38 0.38 0.38 0.38 0.38 0.36
external net energy ratio - surface mining 6.72 7.52 5.92 6.73 6.99 6.72 9.89 6.60 3.21life cycle efficiency - underground mining -65.7% -61.0% -70.5% -65.7% -65.5% -65.7% -63.8% -65.8% -72.3%
external energy efficiency - underground mining 34.3% 39.0% 29.5% 34.3% 34.5% 34.3% 36.2% 34.2% 27.7%net energy ratio - underground mining 0.38 0.42 0.33 0.38 0.38 0.38 0.39 0.38 0.36
external net energy ratio - underground mining 6.93 7.76 6.11 6.95 7.22 6.93 10.36 6.81 3.25
lebs - base case I J K L M N O P
power plant efficiency 42% 42% 42% 42% 42% 42% 42% 42% 42%life cycle efficiency - surface mining -65.9% -66.0% -65.9% -65.8% -65.5% -65.8% -65.9% -65.9% -65.9%
external energy efficiency - surface mining 34.1% 34.0% 34.1% 34.2% 34.5% 34.2% 34.1% 34.1% 34.1%net energy ratio - surface mining 0.38 0.38 0.38 0.38 0.38 0.38 0.38 0.38 0.38
external net energy ratio - surface mining 6.72 6.57 6.72 6.83 7.22 6.80 6.71 6.73 6.71life cycle efficiency - underground mining -65.7% -65.9% -65.7% -65.6% -65.3% -65.7% -65.7% -65.7% -65.7%
external energy efficiency - underground mining 34.3% 34.1% 34.3% 34.4% 34.7% 34.3% 34.3% 34.3% 34.3%net energy ratio - underground mining 0.38 0.38 0.38 0.38 0.38 0.38 0.38 0.38 0.38
external net energy ratio - underground mining 6.93 6.78 6.93 7.06 7.46 7.02 6.93 6.94 6.92
CASE LETTER SENSITIVITY CASEA Increase plant efficiency by 5 pointsB Decrease plant efficiency by 5 pointsC Pond versus landfilling of ash from power plantD Construction materials low caseE Mining methane emissions using EIA average U.S. numbersF Mine mouthG Average user by landH Farthest userI No ash recovery - 100% of plant ash is landfilledJ 100% of recovered ash is used in cementK 50% of plant ash is recovered & percent used in cement remains constant @ 42%L 50% of plant ash is recovered & 100% of this is used in cementM Plant operating capacity factor = 85%N Increase mining equipment materials by 50%O Decrease mining equipment materials by 50%P Decrease in recycle of materials by 1/3

Appendix C: Additional Figures
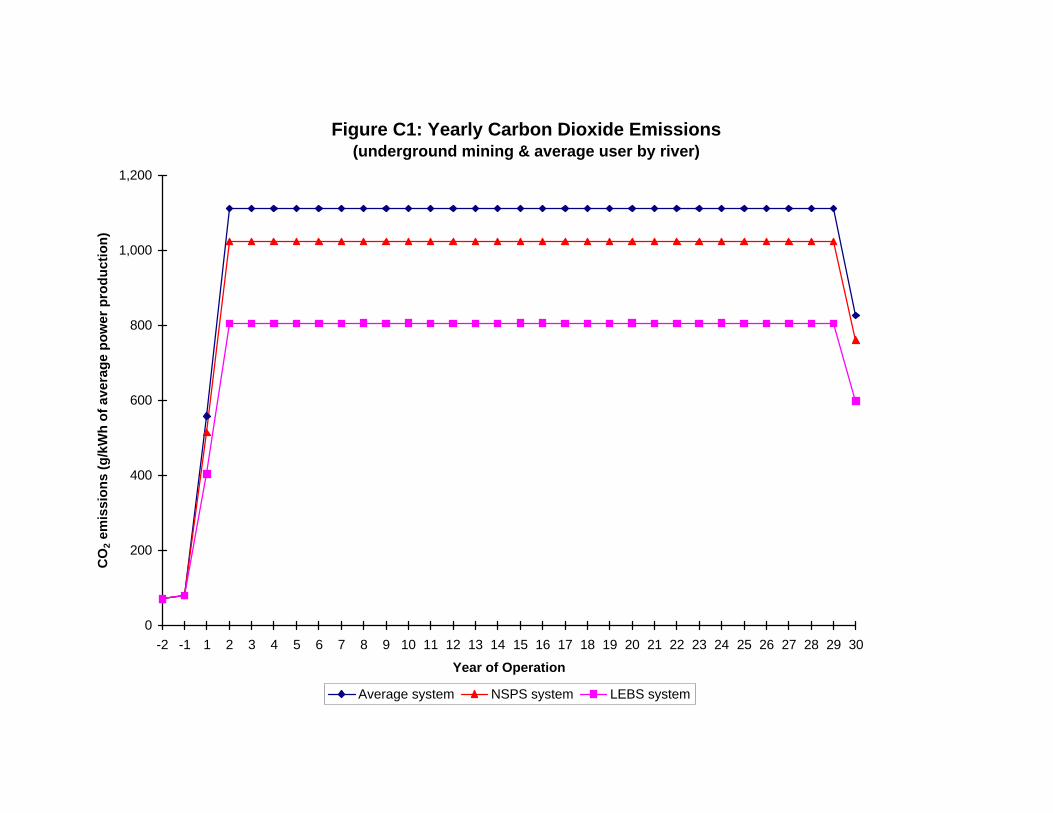
Figure C1: Yearly Carbon Dioxide Emissions(underground mining & average user by river)
0
200
400
600
800
1,000
1,200
-2 -1 1 2 3 4 5 6 7 8 9 10 11 12 13 14 15 16 17 18 19 20 21 22 23 24 25 26 27 28 29 30
Year of Operation
CO
2 em
issi
ons
(g/k
Wh
of a
vera
ge p
ower
pro
duct
ion)
Average system NSPS system LEBS system
Figure C2: Yearly Sulfur Oxide Emissions (SO x as SO2)(underground mining & average user by river)
0
1
2
3
4
5
6
7
8
-2 -1 1 2 3 4 5 6 7 8 9 10 11 12 13 14 15 16 17 18 19 20 21 22 23 24 25 26 27 28 29 30
Year of Operation
SO
x em
issi
ons
(g/k
Wh
of a
vera
ge p
ower
pro
duct
ion)
Average system NSPS system LEBS system
Figure C3: Yearly Nitrogen Oxide Emissions (NO x as NO2)(underground mining & average user by river)
0
0.5
1
1.5
2
2.5
3
3.5
4
-2 -1 1 2 3 4 5 6 7 8 9 10 11 12 13 14 15 16 17 18 19 20 21 22 23 24 25 26 27 28 29 30
Year of Operation
NO
x em
issi
on (
g/kW
h of
ave
rage
pow
er p
rodu
ctio
n)
Average system NSPS system LEBS system
Figure C4: Yearly Methane Emissions(underground mining & average user by river)
0
0.5
1
1.5
2
2.5
-2 -1 1 2 3 4 5 6 7 8 9 10 11 12 13 14 15 16 17 18 19 20 21 22 23 24 25 26 27 28 29 30
Year of Operation
CH
4 em
issi
ons
(g/k
Wh
of a
vera
ge p
ower
pro
duct
ion)
Average system NSPS system LEBS system
Figure C5: Yearly Total Non-Coal Energy Consumption(underground mining & average user by river)
(Note: Electricity produced and consumed by the power plant not included)
0
0.1
0.2
0.3
0.4
0.5
0.6
0.7
0.8
-2 -1 1 2 3 4 5 6 7 8 9 10 11 12 13 14 15 16 17 18 19 20 21 22 23 24 25 26 27 28 29 30
Year of Operation
Ene
rgy
(MJ/
kWh
of a
vera
ge p
ower
pro
duct
ion)
Average system NSPS system LEBS system
Case CaseLetter Sensitivity Case Letter Sensitivity Case
A Increase plant efficiency by 5 points K 50% of plant ash is recovered & percent used in cement remains constant @ 42%B Decrease plant efficiency by 5 points L 50% of plant ash is recvovered & 100% of this is used in cementC Pond versus landfilling of ash from power plant M Plant operating capacity factor = 85%D Construction materials low case N Increase mining equipment materials by 50%E Mining methane emissions using EIA average U.S. numbers O Decrease mining equipment materials by 50%F Mine mouth P Decrease in recycle of materials by 1/3G Average user by land Q No FGC recovery - 100% is landfilledH Farthest user R 100% of recovered FGC is used in asphaltI No ash recover - 100% of plant ash is landfilled S 50% of plant FGC is recovered & percent used in asphalt remains constant @ 7.2%J 100% of recovered ash is used in cement T 50% of plant FGC is recovered & 100% of this is used in asphalt
Key for Sensitivity Cases
Figure C6: Sensitivity results for Life Cycle Efficiency - NSPS System,Surface Mining Case
-84%
-82%
-80%
-78%
-76%
-74%
-72%
-70%
-68%
-66%
-64%
-62%
-60%
A B C D E F G H I J K L M N O P Q R S T
Sensitivity Case(Refer to the key located before Figure C6)
Per
cent
basecase
Figure C7: Sensitivity Results for External Energy Efficiency - NSPS System,Surface Mining Case
16%
18%
20%
22%
24%
26%
28%
30%
32%
34%
36%
38%
40%
A B C D E F G H I J K L M N O P Q R S T
Sensitivity Case(Refer to the key located before Figure C6)
Per
cent
basecase
Figure C8: Sensitivity Results for Net Energy Ratio - NSPS System,Surface Mining Case
0
0.05
0.1
0.15
0.2
0.25
0.3
0.35
0.4
0.45
A B C D E F G H I J K L M N O P Q R S T
Sensitivity Case(Refer to the key located before Figure C6)
basecase
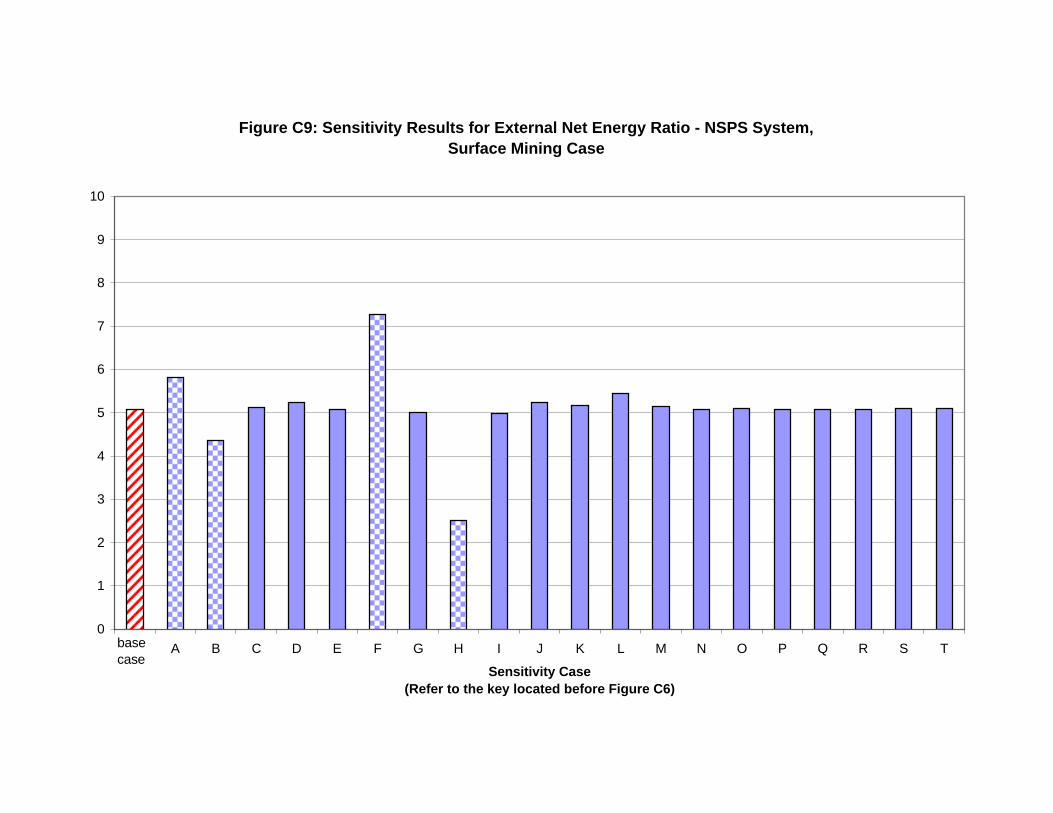
Figure C9: Sensitivity Results for External Net Energy Ratio - NSPS System,Surface Mining Case
0
1
2
3
4
5
6
7
8
9
10
A B C D E F G H I J K L M N O P Q R S T
Sensitivity Case(Refer to the key located before Figure C6)
basecase
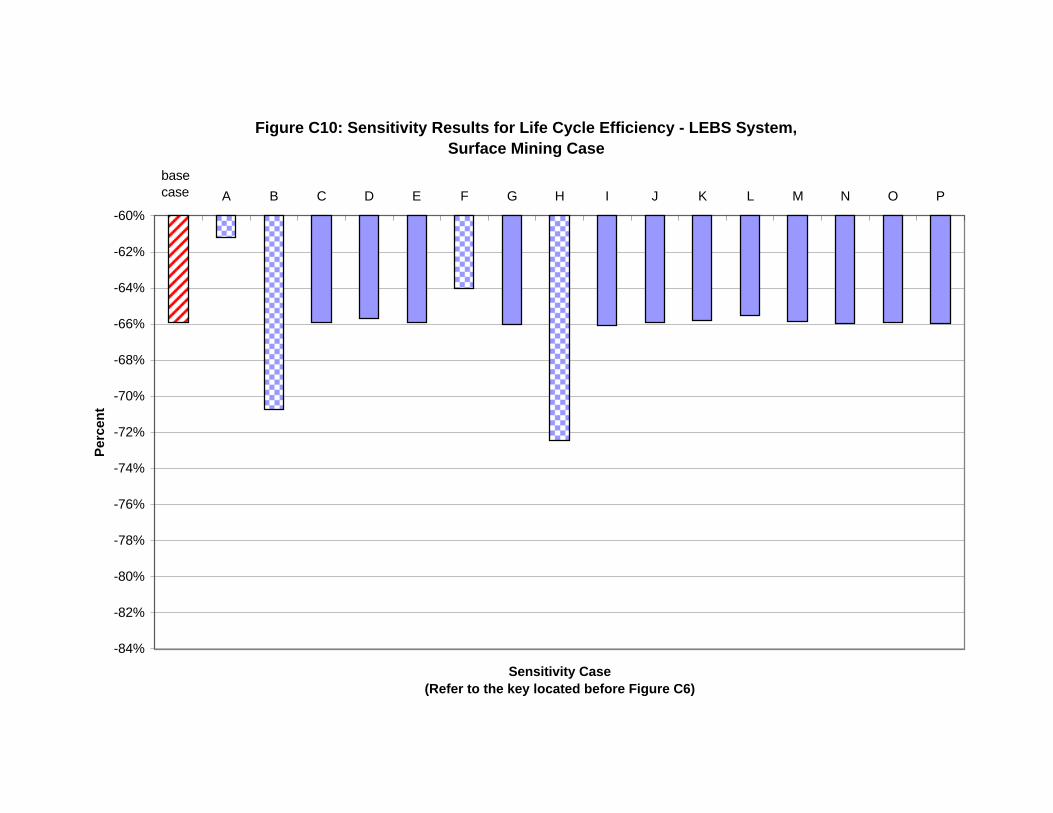
Figure C10: Sensitivity Results for Life Cycle Efficiency - LEBS System,Surface Mining Case
-84%
-82%
-80%
-78%
-76%
-74%
-72%
-70%
-68%
-66%
-64%
-62%
-60%
A B C D E F G H I J K L M N O P
Sensitivity Case(Refer to the key located before Figure C6)
Per
cent
basecase
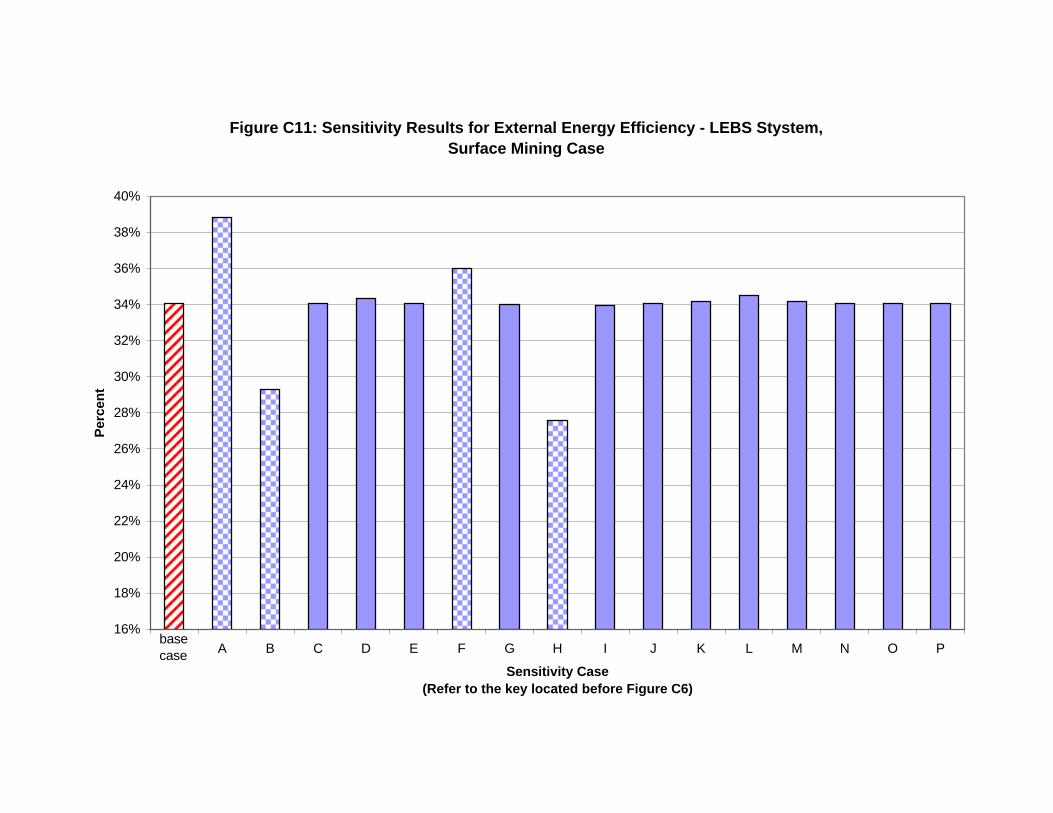
Figure C11: Sensitivity Results for External Energy Efficiency - LEBS Stystem,Surface Mining Case
16%
18%
20%
22%
24%
26%
28%
30%
32%
34%
36%
38%
40%
A B C D E F G H I J K L M N O P
Sensitivity Case(Refer to the key located before Figure C6)
Per
cent
basecase
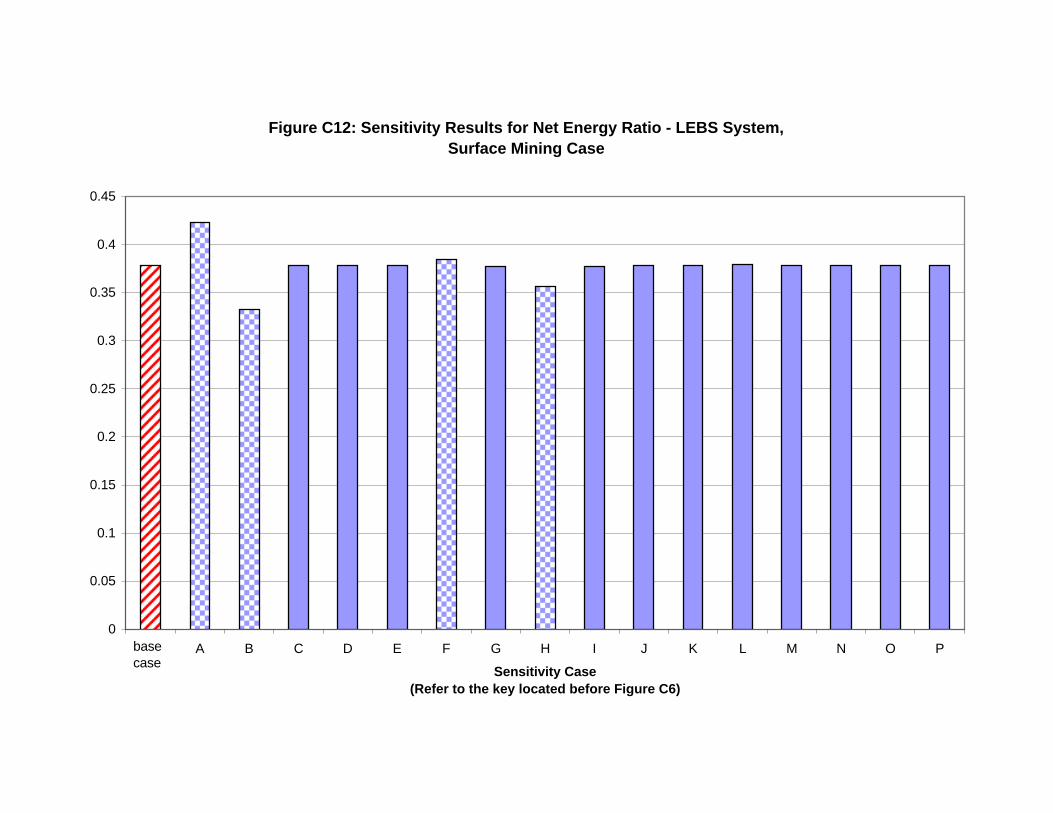
Figure C12: Sensitivity Results for Net Energy Ratio - LEBS System,Surface Mining Case
0
0.05
0.1
0.15
0.2
0.25
0.3
0.35
0.4
0.45
A B C D E F G H I J K L M N O P
Sensitivity Case(Refer to the key located before Figure C6)
basecase
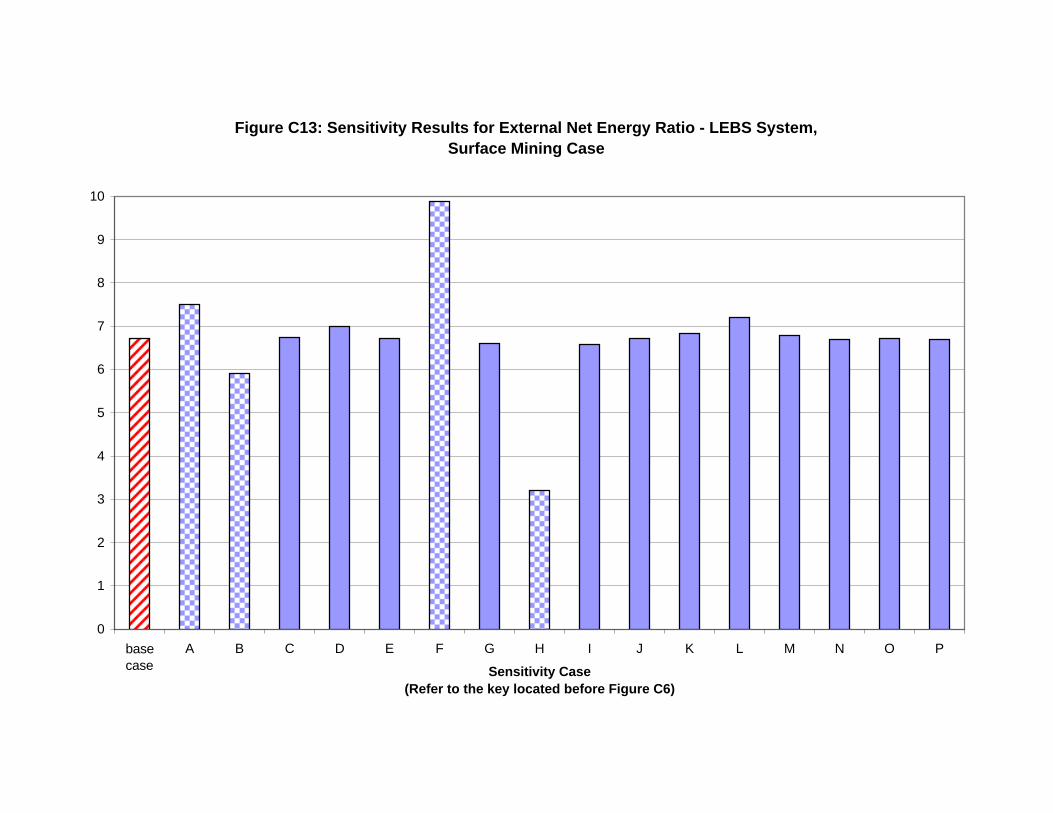
Figure C13: Sensitivity Results for External Net Energy Ratio - LEBS System,Surface Mining Case
0
1
2
3
4
5
6
7
8
9
10
A B C D E F G H I J K L M N O P
Sensitivity Case(Refer to the key located before Figure C6)
basecase

REPORT DOCUMENTATION PAGE Form ApprovedOMB NO. 0704-0188
Public reporting burden for this collection of information is estimated to average 1 hour per response, including the time for reviewing instructions, searching existing datasources, gathering and maintaining the data needed, and completing and reviewing the collection of information. Send comments regarding this burden estimate or any otheraspect of this collection of information, including suggestions for reducing this burden, to Washington Headquarters Services, Directorate for Information Operations andReports, 1215 Jefferson Davis Highway, Suite 1204, Arlington, VA 22202-4302, and to the Office of Management and Budget, Paperwork Reduction Project (0704-0188),Washington, DC 20503.
1. AGENCY USE ONLY (Leave blank) 2. REPORT DATEJune 1999
3. REPORT TYPE AND DATES COVERED1998-1999
4. TITLE AND SUBTITLE
Life Cycle Assessment of Coal-fired Power Production6. AUTHOR(S)Pamela L. Spath, Margaret K. Mann, Dawn R. Kerr
5. FUNDING NUMBERS
BP91.1030
7. PERFORMING ORGANIZATION NAME(S) AND ADDRESS(ES) 8. PERFORMING ORGANIZATIONREPORT NUMBER
9. SPONSORING/MONITORING AGENCY NAME(S) AND ADDRESS(ES)National Renewable Energy Laboratory1617 Cole Blvd.Golden, CO 80401-3393
10. SPONSORING/MONITORINGAGENCY REPORT NUMBER
TP-570-25119
11. SUPPLEMENTARY NOTES
NREL Technical Monitor:
12a. DISTRIBUTION/AVAILABILITY STATEMENTNational Technical Information ServiceU.S. Department of Commerce5285 Port Royal RoadSpringfield, VA 22161
12b. DISTRIBUTION CODE
13. ABSTRACT (Maximum 200 words)
Coal has the largest share of utility power generation in the United States, accounting for approximately 56% of all utility-producedelectricity (U.S. DOE, 1998). Therefore, understanding the environmental implications of producing electricity from coal is an importantcomponent of any plan to reduce total emissions and resource consumption. A life cycle assessment (LCA) on the production ofelectricity from coal was performed in order to examine the environmental aspects of current and future pulverized coal boiler systems.Three systems were examined: 1) a plant that represents the average emissions and efficiency of currently operating coal-fired powerplants in the U.S. (this tells us about the status quo), 2) a new coal-fired power plant that meets the New Source Performance Standards(NSPS), and 3) a highly advanced coal-fired power plant utilizing a low emission boiler system (LEBS).
14. NUMBER OF PAGES
14. SUBJECT TERMS
16. PRICE CODE
17. SECURITY CLASSIFICATIONOF REPORT
18. SECURITY CLASSIFICATIONOF THIS PAGE
19. SECURITY CLASSIFICATIONOF ABSTRACT
20. LIMITATION OF ABSTRACT
NSN 7540-01-280-5500 Standard Form 298 (Rev. 2-89)Prescribed by ANSI Std. Z39-18
298-102

June 1999 NREL/TP-570-25119
National Renewable Energy Laboratory1617 Cole Boulevard
Golden, Colorado 80401-3393NREL is a U.S. Department of Energy Laboratory
Operated by Midwest Research Institute • Battelle • BechtelContract No. DE-AC36-98-GO10337