life cycle analysis results of fuel cell ships - netinform.de · 3.1 case ship 1 ... 41 5 cost...
TRANSCRIPT

Life Cycle Analysis results of fuel cell ships
Recommendations for improving cost effectiveness andreducing environmental impacts
Study carried out in the framework of the projectFCSHIP – Fuel Cell Technology in Ships
Final ReportJuly 2004
L-B-Systemtechnik GmbH, 85521 Ottobrunn, www.lbst.deMatthias Altmann, Werner Weindorf
MTU Friedrichshafen GmbH, 88045 Friedrichshafen, www.mtu-online.comMartin Weinberger
DisclaimerThe staff of L-B-Systemtechnik GmbH and MTU Friedrichshafen GmbH prepared this report.The views and conclusions expressed in this document are those of the staff of L-B-Systemtechnik GmbH and of MTUFriedrichshafen GmbH. Neither L-B-Systemtechnik GmbH, nor MTU Friedrichshafen GmbH, nor any of their employees,contractors or subcontractors, makes any warranty, expressed or implied, or assumes any legal liability or responsibility for theaccuracy, completeness, or usefulness of any information, product, or process enclosed, or represents that its use would notinfringe on privately owned rights.

FCSHIP G3RD-CT-2002-00823DTR-4.5-LBST-05.2004 Rev. 2
Page 2
FCSHIP
Fuel Cell Technology in Ships
Contract No. G3RD-CT-2002-00823
Document title: Life Cycle Analysis results of fuel cell shipsRecommendations for improving cost effectiveness and
reducing environmental impacts
Doc. status: Open
Author(s): M. Altmann, M. Weinberger, W. Weindorf
Organisation: L-B-Systemtechnik, MTU Friedrichshafen
Doc. Ident. Code: DTR-4.5-LBST-05.2004
Distribution list: Norwegian Shipowners Association (NSA)Germanischer Lloyd AG (GL)University of Applied Sciences Hamburg (UASHH)University of Strathclyde (SU)Norwegian Marine Technology Research Institute (MT)MTU Friedrichshafen GmbH (MTU)Delft University of Technolgy (DUT)D’Appolonia S.p.A (DAP)L-B-Systemtechnik GmbH (LBST)Fincantieri Cantieri Navali Italiani S.p.A. (FC)Wärtsilä Corporation Oy (WM)Lloyd’s Register (LR)Det Norske Veritas AS (DNV)Rina S.p.A. (RINA)University of Genova (DINAV)Ansaldo Fuel Cells S.p.A. (ARI)Norsk Hydro ASA (NH)Netherlands Organisation for Applied Scientific Research TNO (TNO)Imtech Marine & Industry, R&H Systems B.V. (IMTECH)Knutsen OAS Shipping AS (KOAS)Color Line Marine AS (CL)
No part of this document may be reproduced or transmitted in any form or by any means, not stored in any information retrievalsystem of any kind, nor communicated to any other person without the written approval of the Project Steering Committee ofGRD1-2000-25383
3
2 Final 21 July 2004
1 Rev. 1 28 May 2004 all partners
0 Draft 14 May 2004 WP4 partners
Revision No. Status Date Checked

FCSHIP G3RD-CT-2002-00823DTR-4.5-LBST-05.2004 Rev. 2
Page 3
Contents
Acronyms ..................................................................................................................................5
Abbreviations used for fuel paths ..........................................................................................6
Objectives .................................................................................................................................9
Executive Summary.................................................................................................................9
1 Goal, Scope and Limitations of Analysis ...................................................................11
2 Basics..............................................................................................................................15
2.1 Efficiencies..................................................................................................................15
2.1.1 Case ship 1 .........................................................................................................15
2.1.2 Case ship 2 .........................................................................................................15
2.2 Emissions during ship operation .............................................................................16
2.2.1 Case ship1..........................................................................................................16
2.2.2 Case ship 2 .........................................................................................................17
2.3 Fuel supply..................................................................................................................17
2.4 Manufacturing of propulsion systems.....................................................................21
2.4.1 Case ship 1 .........................................................................................................21
2.4.2 Case ship 2 .........................................................................................................26
3 Life Cycle Inventory Analysis.......................................................................................29
3.1 Case ship 1 .................................................................................................................29
3.2 Case ship 2 .................................................................................................................33
4 Life Cycle Impact Analysis ...........................................................................................37
4.1 Case ship 1 .................................................................................................................37
4.2 Case ship 2 .................................................................................................................41
5 Cost Analysis of Fuels...................................................................................................45
6 Portfolio Presentation of Costs and Greenhouse Gas Emissions .........................49
7 Life Cycle Interpretation................................................................................................51
7.1 Limitations and open issues.....................................................................................51

FCSHIP G3RD-CT-2002-00823DTR-4.5-LBST-05.2004 Rev. 2
Page 4
7.2 Conclusions ................................................................................................................52
7.2.1 Emissions............................................................................................................52
7.2.2 Economics ..........................................................................................................53
7.3 Recommendations.....................................................................................................54
8 References......................................................................................................................57

FCSHIP G3RD-CT-2002-00823DTR-4.5-LBST-05.2004 Rev. 2
Page 5
ACRONYMS
CCR Central Committee for Rhine Shipping
CGH2 Compressed Gaseous Hydrogen
CH4 Methane
CO2 Carbon Dioxide
CO Carbon Monoxide
EUR Euro
FAME Fatty Acid Methyl Esters
FC Fuel Cell
FCSHIP Fuel Cell Technology in Ships Project
GHG Greenhouse Gases
GWP Global Warming Potential
H2 Hydrogen
HFO Heavy Fuel Oil
IMO International Maritime Organization
LCA Life Cycle Analysis
LH2 Liquid Hydrogen
LNG Liquefied Natural Gas
MCFC Molten Carbonate Fuel Cell
MGO Marine Gas Oil
N2O Nitrous Oxide
NG Natural Gas
NMVOC Non-Methane Volatile Organic Compounds

FCSHIP G3RD-CT-2002-00823DTR-4.5-LBST-05.2004 Rev. 2
Page 6
NOx Nitrogen Oxide (calculated as NO2)
PEMFC Proton Exchange Membrane Fuel Cell
PO43- Phosphate
POX Partial Oxidation
PM Particulate Matter
SO2 Sulfur Oxide
SOFC Solid Oxide Fuel Cell
ABBREVIATIONS USED FOR FUEL PATHS
Case ship 1
HFO 3,5% S Heavy Fuel Oil, 3.5% sulfur content
HFO 1,0% S Heavy Fuel Oil, 1.0% sulfur content
Diesel 10 ppm car diesel, 10 ppm sulfur content
LNG import Liquefied natural gas imported by ship from remotelocations (distance: 5000-6000 nautical miles)
LNG Norway Liquefied natural gas from Norwegian natural gasfields
LNG onsite (Stirling) Onsite liquefaction of natural gas (European mixfrom pipeline) at port using Stirling engines
LH2-NG (2,78 t/d) Liquid hydrogen produced from natural gas;hydrogen generation and liquefaction plant capacity2.78 tons per day
LH2-NG (216 t/d) Liquid hydrogen produced from natural gas;hydrogen generation and liquefaction plant capacity216 tons per day
LH2-HFO (216 t/d) Liquid hydrogen produced from heavy fuel oil;hydrogen generation and liquefaction plant capacity216 tons per day

FCSHIP G3RD-CT-2002-00823DTR-4.5-LBST-05.2004 Rev. 2
Page 7
LH2 wind (2,78 t/d) liquid hydrogen from offshore wind power; hydrogenliquefaction plant capacity 2.78 tons per day
LH2 wind (216 t/d) liquid hydrogen from offshore wind power; hydrogenliquefaction plant capacity 216 tons per day
LH2 hydro (2,78 t/d) liquid hydrogen from hydro power; hydrogenliquefaction plant capacity 2.78 tons per day
LH2 hydro (216 t/d) liquid hydrogen from hydro power; hydrogenliquefaction plant capacity 216 tons per day
Case ship 2
MGO < 0,2% S Marine Gas Oil, 0.2% sulfur content
CGH2 wind offshore compressed gaseous hydrogen produced onsitefrom offshore wind power
CGH2-NG-onsite (ATR)compressed gaseous hydrogen produced onsitefrom natural gas using an autothermal reformer
CGH2-NG-onsite (SR) compressed gaseous hydrogen produced onsitefrom natural gas using a steam reformer
CGH2-WW 2,5 MWth compressed gaseous hydrogen produced onsitefrom waste wood in a gasification unit with a thermalcapacity of 2.5 MW
CGH2-WF 2,5 MWth compressed gaseous hydrogen produced onsitefrom wood farming in a gasification unit with athermal capacity of 2.5 MW
CGH2-WW 10 MWth compressed gaseous hydrogen produced onsitefrom waste wood in a gasification unit with a thermalcapacity of 10 MW
CGH2-WF 10 MWth compressed gaseous hydrogen produced onsitefrom wood farming in a gasification unit with athermal capacity of 10 MW

FCSHIP G3RD-CT-2002-00823DTR-4.5-LBST-05.2004 Rev. 2
Page 8

FCSHIP G3RD-CT-2002-00823DTR-4.5-LBST-05.2004 Rev. 2
Page 9
OBJECTIVES
The objective of the present report is to integrate the results of several sub-studies into one comprehensive Life Cycle Analysis of the use of fuel cells inships. Additionally, the report includes a fuel cost analysis.
Based on the Life Cycle Analysis and cost analysis results severalrecommendations for improving cost effectiveness and further reduction ofthe environmental impacts of fuel cell ships are made.
EXECUTIVE SUMMARY
This Life Cycle Analysis of fuel cell ships includes fuel production, supply anduse, fuel cell manufacturing and end-of-life as well as ship operation. WithinFCSHIP, two case ship designs have been developed, a 140 m Ro-Ro FastFerry with a fuel cell for onboard power supply and a 30 m Ferry with fuel cellpropulsion. Suitable fuels have been identified, and their possible productionand supply options have been analyzed. Fuel cell types considered hereinclude MCFC, SOFC and PEMFC.
Greenhouse gas and pollutant emissions related to various production,supply and use options of hydrogen, natural gas and conventional oradvanced conventional ship fuels based on fossil (mineral oil, natural gas)and renewable sources of primary energy (wind power, hydro power,biomass) are assessed. A cost analysis for these fuel paths is conducted.
The analysis comes to the conclusion that fuel cells offer the potential forsignificant environmental improvements both in terms of air quality andclimate protection. Local pollutant emissions and greenhouse gas emissionscan be eliminated almost entirely over the full life cycle using renewableprimary energies. The direct use of natural gas in high temperature fuel cellsemployed in large ships and the use of natural gas derived hydrogen in PEMfuel cells installed in small ships allows for a greenhouse gas emissionreduction of 20%-40%. Fuel cells have the potential for further efficiencyimprovements over the values assumed here, which would translate intofurther reductions of greenhouse gas emissions for fossil based fuels.
Economically, natural gas fuel can compete with conventional fuels, whichare untaxed, at oil prices above 25 US-$ per barrel. Fossil hydrogen is still

FCSHIP G3RD-CT-2002-00823DTR-4.5-LBST-05.2004 Rev. 2
Page 10
more expensive with future competitiveness depending on the developmentof the oil price. The cheapest renewable hydrogen option is comparable tohydrogen from natural gas.
From an environmental perspective, the development of fuel cell technologyfor marine applications is strongly recommendable. Dedicated developmentsof marine fuel cells will allow to exploit the full potential of the technology.Important synergies with stationary applications (large ships) and automotiveapplications (small ships and boats) should be used.

FCSHIP G3RD-CT-2002-00823DTR-4.5-LBST-05.2004 Rev. 2
Page 11
1 GOAL, SCOPE AND LIMITATIONS OF ANALYSIS
This Life Cycle Analysis evaluates the environmental impacts of the wholesystem of fuel cell applications on ships including fuel cell production,operation and end of life as well as fuel production and supply including therequired infrastructure. The analysis does not include the construction andend of life of the ship itself. The same evaluation is carried out forconventional technologies in the same applications for comparison.
Additionally, a cost analysis has been carried out for fuel production andsupply.
The evaluation relies on the technological status of today, but assumestechnological advances until the time frame of 2010 to 2020.
Fuel cell technologies analyzed are Molten Carbonate Fuel Cells (MCFC),Solid Oxide Fuel Cells (SOFC) and Proton Exchange Membrane Fuel Cells(PEMFC). The conventional benchmark are diesel cycle internal combustionengines.
Fuels chosen include low sulfur car diesel (10 ppm sulfur content), liquefiednatural gas, liquid and compressed gaseous hydrogen, respectively, as wellas heavy fuel oil (3.5% and 1.0% sulfur content, respectively) and marine gasoil as conventional benchmarks. Primary energies used for fuel productionare crude oil (heavy fuel oil, marine gas oil, car diesel, liquid hydrogen),natural gas (liquefied natural gas, liquid hydrogen, compressed gaseoushydrogen), renewable electricity (liquid and compressed gaseous hydrogen),biomass (compressed gaseous hydrogen).
For the analysis two case ships have been defined. Case ship 1 is a largepassenger ferry operating between the Norwegian port of Oslo and theGerman port of Kiel. Based on this ship, a case ship analysis has beencarried out using high or low temperature fuel cells for the supply of auxiliarypower onboard the ship; the main propulsion is supplied by conventional shipengines. Three different fuels are considered for the fuel cells of case ship 1:low sulfur diesel (car diesel), liquefied natural gas (LNG) and liquid hydrogen(LH2). Hydrogen will be used in a low-temperature PEM fuel cell, car dieseland LNG will be used in high-temperature fuel cells (MCFC – moltencarbonate fuel cell or SOFC – solid oxide fuel cell). The electricity output for

FCSHIP G3RD-CT-2002-00823DTR-4.5-LBST-05.2004 Rev. 2
Page 12
auxiliary power in case ship 1 is about 2 MW (2 generator sets with 1,080 kWeach).
Figure 1. Case ship 1 (left) and case ship 2 (right)
Case ship 2 is a small commuter ferry operating in the Dutch city ofAmsterdam. In the case ship 2 analysis PEM fuel cells supply the power forpropulsion and for the auxiliary electricity consumption. Compressedgaseous hydrogen (CGH2) is stored onboard the ship for the supply of thefuel cell. The total installed power of case ship 2 (two engines) which has tobe replaced by the PEMFC power train is approximately 400 kW.
The Life Cycle Analysis is limited to gaseous emissions as here majoradvances by fuel cells and applicable fuels are to be expected and on theother hand major environmental problems related to conventional shiptechnology exist. Major impacts to be studied are emissions having a climatechanging potential (mainly CO2, CH4 and N2O), emissions contributing toacidification (SO2, NOx, NH3) and emissions contributing to a eutrophicationof waters (NOx, NH3).
The analysis of photochemical oxidation, an additional impact of majorconcern, requires information about the detailed composition of hydrocarbonemissions. As it was not possible in this project to go into such detail ananalysis of photochemical oxidation improvements by fuel cells could not beperformed.
Data for all stages of the Life Cycle Analysis have been compiled from alarge variety of sources, including literature and direct contacts tomanufacturers to name the most important.
Available data on fuel cell manufacturing are rather limited, restrictingexactness and the reliability of this analysis of this stage. In addition, theassessment of future technology advances is difficult as fuel cells in generalare not yet in a stage of commercial availability. Commercial MCFCprototypes for stationary applications are available, but not suitable for

FCSHIP G3RD-CT-2002-00823DTR-4.5-LBST-05.2004 Rev. 2
Page 13
marine applications due to excessive weight and volume. SOFC technologyis some years behind, being developed for stationary applications mainly.PEM fuel cells being developed mainly for automotive applications and smallstationary applications. First fleets of demonstration fuel cell vehicles areemerging at present.
The reliability of fuel production and supply data and of ship operation data isvery high.

FCSHIP G3RD-CT-2002-00823DTR-4.5-LBST-05.2004 Rev. 2
Page 14

FCSHIP G3RD-CT-2002-00823DTR-4.5-LBST-05.2004 Rev. 2
Page 15
2 BASICS
2.1 Efficiencies
2.1.1 Case ship 1
The efficiency of the natural gas fueled FC system (SOFC or MCFC) isassumed to be 47.8%. The efficiency of the diesel fueled FC system isassumed to be 41.8%.
Table 2-1: Efficiency of different electricity generation technologies
Efficiency[%]
Reference
Diesel engine 43.3 [Bazari 2004]
Diesel MCFC 41.8 [Bazari 2004]
LNG MCFC or SOFC 47.8 [Bazari 2004]; [MT 2004],[WM 2003]; [DNV 2003];[MTU 2003]
LH2 PEMFC 50.0 [GM 2003]
2.1.2 Case ship 2
In contrast to case ship 1 the efficiencies of fuel cells in case ship 2 aresignificantly higher than those of conventional ship engines. This is due to thefact that case ship 2 largely operates in part load where internal combustionengines have lower efficiencies and fuel cells have higher efficiencies than atfull load.
The efficiency of the diesel engine is indicated with about 26.8% whereas theoverall efficiency of the fuel cell is approximately 50% [DUT 2003].

FCSHIP G3RD-CT-2002-00823DTR-4.5-LBST-05.2004 Rev. 2
Page 16
2.2 Emissions during ship operation
2.2.1 Case ship1
Table 2-2: Air pollutant emissions of a typical heavy fuel oil fueleddiesel engine [Bazari 2004]
g/kgHFO g/kWhHFO g/kWhe
NOx 57.0 5.11 11.80
PM (3.5% S) 1) 7.6 0.68 1.57
PM (1.0% S) 1.8 0.16 0.37
NMVOC 2.4 0.21 0.49
CO 7.4 0.66 1.531) in the Lloyd’s Register’s Marine Exhaust Emission Research Programme Report fromwhere the data used in [Bazari 2004] are derived the 7.6 g per kg of heavy fuel oil have beenmeasured at a sulfur content of 3% which is close to the 3.5% assumed here.
The NOx, particulate matter (PM), non-methane volotile organic compounds(NMVOC) and CO emissions are derived from [Bazari 2004].
Table 2-3: Air pollutant emissions of a fuel cell with fuel processor[Bazari 2004]
FC reformerg/kWhin
Natural gasFC g/kWhe
Diesel FCg/kWhe
NOx 0.0068 0.0141 0.0161
PM 0.0000 0.0000 0.0000
NMVOC 0.0033 0.0069 0.0079
CO 0.0135 0.0282 0.0323
CH4 0.0304 0.0637 0.0728
The emissions are derived from [Barari 2004] using the efficiencies asdiscussed above.
FCSHIP G3RD-CT-2002-00823DTR-4.5-LBST-05.2004 Rev. 2
Page 17
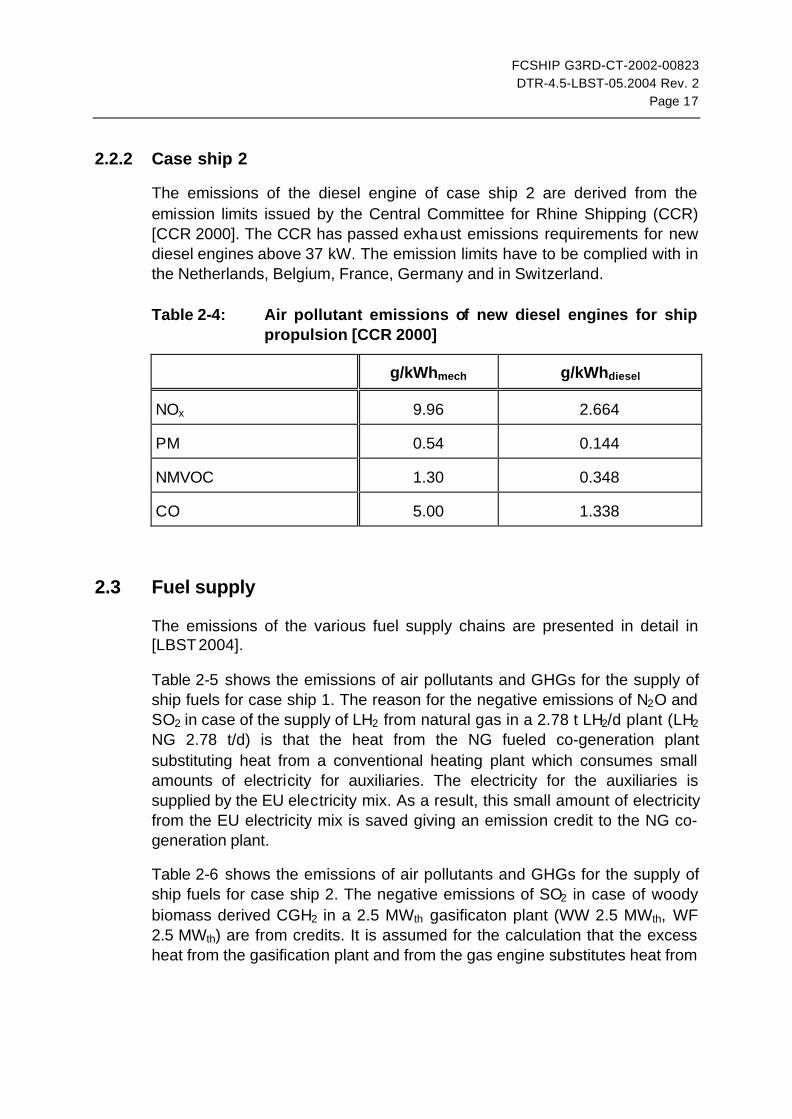
2.2.2 Case ship 2
The emissions of the diesel engine of case ship 2 are derived from theemission limits issued by the Central Committee for Rhine Shipping (CCR)[CCR 2000]. The CCR has passed exhaust emissions requirements for newdiesel engines above 37 kW. The emission limits have to be complied with inthe Netherlands, Belgium, France, Germany and in Switzerland.
Table 2-4: Air pollutant emissions of new diesel engines for shippropulsion [CCR 2000]
g/kWhmech g/kWhdiesel
NOx 9.96 2.664
PM 0.54 0.144
NMVOC 1.30 0.348
CO 5.00 1.338
2.3 Fuel supply
The emissions of the various fuel supply chains are presented in detail in[LBST 2004].
Table 2-5 shows the emissions of air pollutants and GHGs for the supply ofship fuels for case ship 1. The reason for the negative emissions of N2O andSO2 in case of the supply of LH2 from natural gas in a 2.78 t LH2/d plant (LH2
NG 2.78 t/d) is that the heat from the NG fueled co-generation plantsubstituting heat from a conventional heating plant which consumes smallamounts of electricity for auxiliaries. The electricity for the auxiliaries issupplied by the EU electricity mix. As a result, this small amount of electricityfrom the EU electricity mix is saved giving an emission credit to the NG co-generation plant.
Table 2-6 shows the emissions of air pollutants and GHGs for the supply ofship fuels for case ship 2. The negative emissions of SO2 in case of woodybiomass derived CGH2 in a 2.5 MWth gasificaton plant (WW 2.5 MWth, WF2.5 MWth) are from credits. It is assumed for the calculation that the excessheat from the gasification plant and from the gas engine substitutes heat from
FCSHIP G3RD-CT-2002-00823DTR-4.5-LBST-05.2004 Rev. 2
Page 18
a biomass fueled heating plant. There is a large uncertainty concerning theemissions of SO2 from the combustion of solid wood because a part of thesulfur is bound in the ash. The share of sulfur bound in the ash ranges from40% to 90%. However, the emissions of SO2 from the combustion of woodare low compared to the SO2 emitted from the combustion of fossil fuels suchas coal or high sulfur heavy fuel oil.
The negative NMVOC emissions in case of the woody biomass derivedCGH2 (WW 2.5 MWth, WF 2.5 MWth, WW 10 MWth, WF 10 MWth) are fromcredits. It is assumed for the calculation that the excess heat from thegasification plant and from the gas engine replaces heat from a biomassfueled heating plant. The emissions of NMVOC per kWh of heat from thewood fueled boiler are higher than those from the combustion of the formedwood coke in the gasification plant and the combustion of the tail gas of thePSA in the gas engine.
The relatively high SO2 emissions of natural gas based hydrogen mainlystem from electricity consumption for natural gas reforming and hydrogencompression. The EU electricity mix is used here with SO2 emissions morethan a factor of two higher than those of the German electricity mix (eventhough the nuclear energy share is roughly the same).

FCSHIP G3RD-CT-2002-00823DTR-4.5-LBST-05.2004 Rev. 2
Page 19
Table 2-5: GHG and air pollutant emissions fuel supply or case ship 1 [g/kWh of ship fuel]
HFO3,5% S
HFO1,0% S
Diesel 10ppm
LNGimport
LNGNorway
LNGonsite
LH2
NG(2,78 t/d)
LH2
NG (216 t/d)
LH2
HFO (216 t/d)
LH2
wind(2,78 t/d)
LH2
wind(216 t/d)
LH2
hydro(2,78 t/d)
LH2
hydro(216 t/d)
GHGs
CO2 22.0 29.1 45.6 51.2 6.2 31.6 402.3 402.2 660.1 25.1 24.3 20.4 19.9
CH4 0.199 0.207 0.209 1.207 0.847 0.827 0.912 0.879 0.485 0.063 0.060 0.031 0.030
N2O 0.001 0.001 0.000 0.001 0.000 0.000 -0.001 0.005 0.000 0.001 0.000 0.000 0.000
CO2 equiv. 26.9 34.2 50.5 79.3 25.7 50.6 423.0 423.8 671.4 26.7 25.8 21.2 20.7
Air pollutants
SO2 0.097 0.103 0.108 0.120 0.003 0.006 -0.001 0.011 0.163 0.023 0.022 0.009 0.008
NOx 0.395 0.403 0.160 0.104 0.020 0.135 0.552 0.316 0.379 0.057 0.055 0.044 0.043
Dust/PM 0.029 0.030 0.008 0.011 0.002 0.002 0.002 0.004 0.016 0.016 0.015 0.009 0.009
NMVOC 0.083 0.085 0.130 0.006 0.002 0.043 0.143 0.010 0.180 0.004 0.004 0.001 0.001
CO 0.104 0.108 0.065 0.062 0.026 0.147 0.416 0.258 0.224 0.134 0.127 0.039 0.037
SO2 equiv. 0.374 0.385 0.220 0.193 0.016 0.100 0.385 0.232 0.428 0.063 0.061 0.040 0.039
PO43- equiv. 0.051 0.052 0.021 0.014 0.003 0.018 0.072 0.041 0.049 0.007 0.007 0.006 0.006

FCSHIP G3RD-CT-2002-00823DTR-4.5-LBST-05.2004 Rev. 2
Page 20
Table 2-6: GHG and air pollutant emissions fuel supply or case ship 2 [g/kWh of ship fuel]
MGO< 0,2% S
CGH2
wind offshoreCGH2
NG-onsite (ATR)CGH2
NG-onsite (SR)CGH2
WW 2,5 MW th
CGH2
WF 2,5 MW th
CGH2
WW 10 MW th
CGH2
WF 10 MW th
GHGs
CO2 29 25 424 419 7 16 7 18
CH4 0.206 0.071 0.886 0.874 0.007 0.023 0.019 0.037
N2O 0.001 0.000 0.003 0.003 0.021 0.126 0.014 0.136
CO2 equiv. 34 27 445 440 14 54 12 59
Air pollutants
SO2 0.093 0.026 0.205 0.187 -0.017 -0.005 0.002 0.016
NOx 0.394 0.057 0.262 0.341 0.412 0.467 0.444 0.508
Dust/PM 0.029 0.018 0.052 0.072 0.125 0.129 0.105 0.110
NMVOC 0.086 0.004 0.040 0.062 -0.092 -0.092 -0.039 -0.038
CO 0.109 0.165 0.129 0.151 0.270 0.282 0.298 0.312
SO2 equiv. 0.369 0.066 0.388 0.426 0.271 0.321 0.313 0.371
PO43- equiv. 0.051 0.007 0.034 0.044 0.054 0.061 0.058 0.066

FCSHIP G3RD-CT-2002-00823DTR-4.5-LBST-05.2004 Rev. 2
Page 21
2.4 Manufacturing of propulsion systems
2.4.1 Case ship 1
The energy requirement and emissions of greenhouse gases and airpollutants for the manufacture of the diesel fueled MCFC and the dieselengine are derived from [Alkaner 2004]. The lifetime of the MCFC stack is40,000 full load hours and the lifetime of the balance of plant is 160,000 fullload hours. Four MCFC stacks are used over the lifetime of 160,000 full loadhours which are reached after 20 years. The emissions and energyrequirements for the manufacture of the diesel engine is based on a life cycleof 20 years and 160,000 hours of full load operation.
The energy requirement and emissions of greenhouse gases and airpollutants for the manufacture of the LNG fueled SOFC are derived from[DNV 2004]. The lifetime of the LNG fueled SOFC unit is assumed to be40,000 full load hours.
The energy requirement and emissions of greenhouse gases and airpollutants for the manufacture of the hydrogen fueled PEMFC system arederived from a stationary natural gas fueled PEMFC co-generation powerplant with an electricity output of 250 kW as described in [Pehnt 2002]. Thelifetime of the PEMFC plant is indicated with 40,000 full load hours. Theplatinum loading is 1 mg/cm2. The bipolar plates are made from graphitecomposite material. After 40,000 full load hours the graphite containingbipolar plates (graphite composite) are re-used during recycling. Themanufacture of graphite is rather energy intensive. In [Pehnt 2002] it hasbeen assumed that the bipolar plants can be re-used 4 times leading to atotal lifetime of 160,000 full load hours.
The energy requirement and emission data for the PEMFC co-generationplant indicated in [Pehnt 2002] include the balance of plant. Since thePEMFC co-generation plant in [Pehnt 2002] is fueled with natural gas thebalance of plant includes the natural gas reformer system including two-stageCO shift and selective CO oxidation for final clean up. For the LH2 fueledPEMFC in case ship 1 no reformer system is required. The reformer systemconsisting of four reactors and several heat exchangers mainly consist ofsteel. As a result there is an overestimate of the energy demand for themanufacture of the LH2 fueled PEMFC system and the associated emissions.On the other hand the energy requirement for the manufacture of the LH2

FCSHIP G3RD-CT-2002-00823DTR-4.5-LBST-05.2004 Rev. 2
Page 22
storage is not taken into account. However the data derived from [Pehnt2002] can be considered as a conservative estimate.
Table 2-7: Energy requirements for the manufacture of differentelectricity generation technologies [Alkaner 2004], [DNV2004], calculations based on [Pehnt 2002]
Unit Dieselengine
DieselMCFC
NGSOFC
H2
PEMFC
Energy MJ/kWe 579 6,993 6,361 6,170
Equivalent fullload period
h/yr 8,000 8,000 8,000 8,000
Time yr 20 20 5 5
Specific energy kWh/kWhe 0.001 0.012 0.044 0.043
Table 2-8 shows the emissions of air pollutants from the manufacture of thedifferent onboard electricity generation technologies per kW of installedcapacity.
Table 2-8: GHG emissions from the manufacture of differentelectricity generation technologies [Alkaner 2004], [DNV2004], calculations based on [Pehnt 2002]
Unit Dieselengine
DieselMCFC
NGSOFC
H2
PEMFC
CO2 kg/kWe 53.44 460.56 356.86
CH4 kg/kWe 0.17 0.83 0.72
N2O kg/kWe 0 0.02 0.03
CO2 equivalent kg/kWe 57.35 485.57 382.00 382.05
The combination of the lifetime indicated in Table 2-7 with the GHGemissions per kW of installed capacity in Table 2-8 leads to the specific GHGemissions shown in Table 2-9. The GHG emissions in Table 2-8 are related
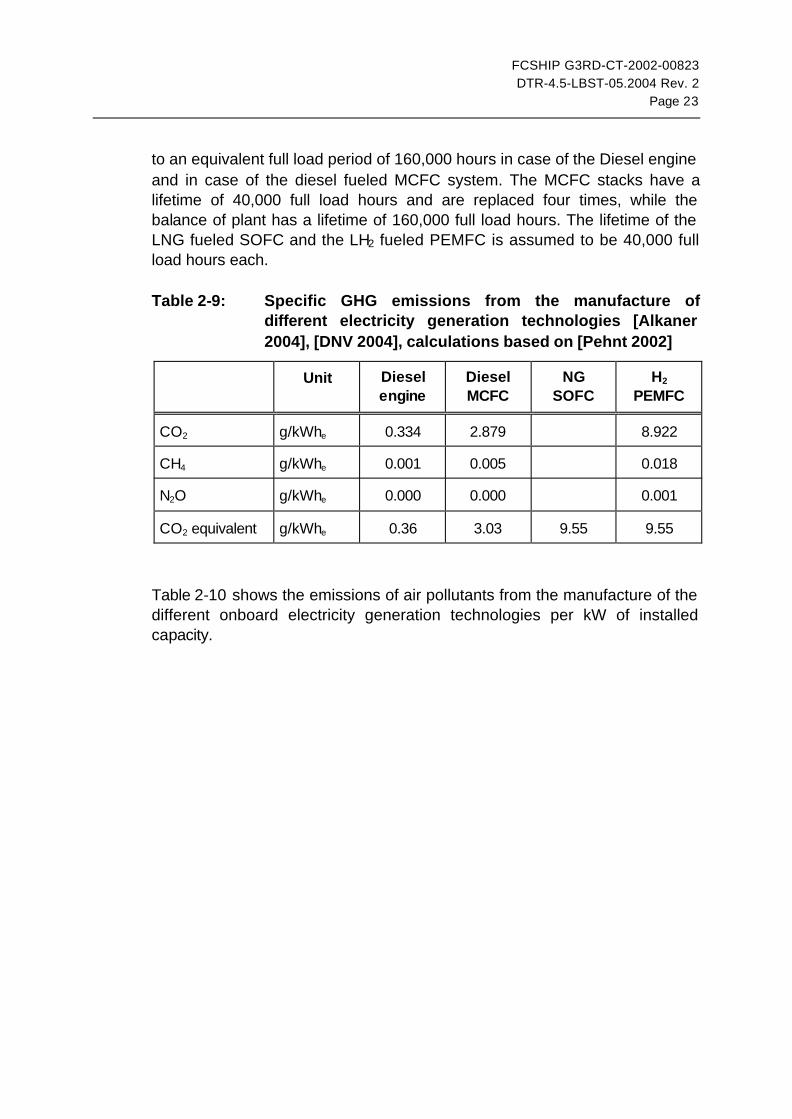
FCSHIP G3RD-CT-2002-00823DTR-4.5-LBST-05.2004 Rev. 2
Page 23
to an equivalent full load period of 160,000 hours in case of the Diesel engineand in case of the diesel fueled MCFC system. The MCFC stacks have alifetime of 40,000 full load hours and are replaced four times, while thebalance of plant has a lifetime of 160,000 full load hours. The lifetime of theLNG fueled SOFC and the LH2 fueled PEMFC is assumed to be 40,000 fullload hours each.
Table 2-9: Specific GHG emissions from the manufacture ofdifferent electricity generation technologies [Alkaner2004], [DNV 2004], calculations based on [Pehnt 2002]
Unit Dieselengine
DieselMCFC
NGSOFC
H2
PEMFC
CO2 g/kWhe 0.334 2.879 8.922
CH4 g/kWhe 0.001 0.005 0.018
N2O g/kWhe 0.000 0.000 0.001
CO2 equivalent g/kWhe 0.36 3.03 9.55 9.55
Table 2-10 shows the emissions of air pollutants from the manufacture of thedifferent onboard electricity generation technologies per kW of installedcapacity.

FCSHIP G3RD-CT-2002-00823DTR-4.5-LBST-05.2004 Rev. 2
Page 24
Table 2-10: Air pollutant emissions from the manufacture of differentelectricity generation technologies [Alkaner 2004], [DNV2004], calculations based on [Pehnt 2002]
Unit Dieselengine
DieselMCFC
NGSOFC
H2
PEMFC
CO kg/kWe 0.280 1.590 0.374 1.197
NOx kg/kWe 0.260 1.500 0.742 0.679
SO2 kg/kWe 0.130 9.200 2.970 1.319
NMVOC kg/kWe 0.030 5.570 0.002 0.236
Dust/PM kg/kWe 0.030 1.930 0.647 0.216
The combination of the lifetime indicated in Table 2-7 with Table 2-10 leadsto the specific GHG emissions shown in Table 2-11. The lifetime of the Dieselengine and the diesel fueled MCFC is 160,000 full load hours (stack replacedfour times). The lifetime of the LNG fueled SOFC and the LH2 fueled PEMFCis assumed to be 40,000 full load hours each.
Table 2-11: Specific air pollutant emissions from the manufacture ofdifferent electricity generation technologies [Alkaner2004], [DNV 2004], calculations based on [Pehnt 2002]
Unit Dieselengine
DieselMCFC
NGSOFC
H2
PEMFC
CO g/kWhe 0.002 0.010 0.009 0.030
NOx g/kWhe 0.002 0.009 0.019 0.017
SO2 g/kWhe 0.001 0.058 0.074 0.033
NMVOC g/kWhe 0.000 0.035 0.000 0.006
Dust/PM g/kWhe 0.000 0.012 0.016 0.005

FCSHIP G3RD-CT-2002-00823DTR-4.5-LBST-05.2004 Rev. 2
Page 25
Figure 2-1: Share of different PEMFC stack components on GHGemissions from the manufacture of a PEMFC stack forvehicles (platinum recycling considered); calculationsbased on [Pehnt 2002]
platinum group metals16%
gas diffusion layer13%
membrane2%
membrane electrode assembly
16%
bipolar plates43%
other stack components
10%
A major contribution to the GHG emissions and to the energy requirement forthe manufacture of the PEMFC stack stems from the supply of graphite forthe bipolar plates.
Figure 2-1 presents the breakdown of GHG gas emissions by PEMFC stackcomponents.
The choice of material for bipolar plates is crucial to the performance andlifetime of a PEMFC stack. Graphite has a good electronic conductivity andan excellent corrosion resistance. But pure graphite bipolar plates whichwere used in early PEMFC stacks are bulky, heavy and sensitive toconcussion and the manufacturing process is expensive. Meanwhile PEMFCbipolar plates are made from composites which are fabricated from acombination of graphite or carbon powder and a polymer resin. Compositesgenerally have lower electrical properties than metallic bipolar plates but theyoffer low-cost material and manufacturing costs together with good corrosionstability [Mepsted 2003]. For the 250 kWe PEMFC plant used as basis for thisstudy bipolar plates are made from graphite containing composite.
For the use in passenger vehicles alternative materials bipolar plates madefrom metals such as titanium, aluminum and stainless steel are underdevelopment. Metal made bipolar plates are lightweight and have a goodelectronic and a good heat conductivity which is important for the application

FCSHIP G3RD-CT-2002-00823DTR-4.5-LBST-05.2004 Rev. 2
Page 26
in passenger vehicles. Titanium offers excellent electrical performance andpower density (volumetric and gravimetric) but is expensive and requiresprecious metal coatings to avoid corrosion. Stainless steel offers reasonableelectrical performance, low material and production cost but may requireapplication of coating [Mepsted 2003]. The corrosion stability of metals canbe improved by using alloys, e.g the corrosion stability of titanium can beenhanced by alloying with vanadium and zirconium. The non-renewableenergy requirement for the supply of graphite ranges between 160 and 180MJ per kg which is slightly below of the non-renewable energy required forthe production of primary aluminum [Pehnt 2002]. The energy demand for thesupply of stainless steel amounts to some 60 MJ per kg.
2.4.2 Case ship 2
The energy requirement and emissions of greenhouse gases and airpollutants for the manufacture of the diesel engine are derived from thediesel engine of a passenger vehicle as described in [Pehnt 2002]. Theefficiency of the diesel engine over the driving cycle is indicated with 26%which is approximately equivalent to the efficiency of the diesel engine usedin case ship 2 (≈ 27%).
The energy requirement and emissions of greenhouse gases and airpollutants for the manufacture of the hydrogen fueled PEMFC system arederived from a PEMFC system designed for passenger vehicles as describedin [Pehnt 2002]. The platinum loading is 0.3 mg/cm2. The bipolar plates aremade from graphite.
The lifetime of the passenger vehicle is indicated with 150,000 km, thehydrogen fuel consumption is 1.03 MJ/km. Propulsion systems for city buseshave to achieve a lifetime of 1,000,000 km. The propulsive power of busesranges between 150 and 300 kW, similar to that of case ship 2. Therefore, alifetime related to a driving distance of 1,000,000 km has been assumed forthe propulsion system in case ship 2. The 150,000 km for the passenger carare equivalent to an operating time of approximately 3,000 hours. The1,000,000 km for the bus are equivalent to an operating time of 20,000 hours,which is still below the 40,000 full load hours used for the onboard electricitygeneration unit in case ship 1.
Table 2-12 shows the energy requirements for the manufacture of propulsionsystems for case ship 2 related to the fuel input (diesel and hydrogen,

FCSHIP G3RD-CT-2002-00823DTR-4.5-LBST-05.2004 Rev. 2
Page 27
respectively). The energy requirements for the PEMFC system includes thehydrogen storage and the electric motor.
Table 2-12: Energy requirements for the manufacture of differentship propulsion technologies; calculations for PEMFCbased on [Pehnt 2002]
Unit Dieselengine
H2
PEMFC
Specific energy kWh/kWhin 0.022 0.073
Table 2-13: Specific GHG emissions from the manufacture ofdifferent ship propulsion technologies; calculations forPEMFC based on [Pehnt 2002]
Unit Dieselengine
H2
PEMFC
CO2 g/kWhin 3.207 13.184
CH4 g/kWhin 0.009 0.027
N2O g/kWhin 0.000 0.001
CO2 equivalent g/kWhin 3.44 14.16

FCSHIP G3RD-CT-2002-00823DTR-4.5-LBST-05.2004 Rev. 2
Page 28
Table 2-14: Air pollutant emissions from the manufacture of differentship propulsion technologies; calculations for PEMFCbased on [Pehnt 2002]
Unit Dieselengine
H2
PEMFC
CO g/kWhin 0.013 0.017
NOx g/kWhin 0.006 0.023
SO2 g/kWhin 0.013 0.037
NMVOC g/kWhin 0.001 0.006
PM g/kWhin 0.005 0.004

FCSHIP G3RD-CT-2002-00823DTR-4.5-LBST-05.2004 Rev. 2
Page 29
3 LIFE CYCLE INVENTORY ANALYSIS
This chapter presents the combined inventory analyses carried out in thedifferent reports of the FCSHIP project.
3.1 Case ship 1
Figure 3-1 shows the total primary energy input for the different fuel/propulsion system combinations split into fuel supply, fuel use duringonboard electricity generation and primary energy demand for themanufacture of the diesel engine or the fuel cell system.
Figure 3-1: Life cycle energy use of case ship 1
0
1
2
3
4
5
6
HFO
3,5%
S
HFO
1,0%
S
Dies
el 10
ppm
LNG
impo
rtLN
G No
rway
LNG
onsit
e (St
irling
)LH
2-NG
(2,7
8 t/d
)LH
2-NG
(216
t/d)
LH2-
HFO
(216
t/d)
LH2 w
ind (2
,78 t/a
)LH
2 wind
(216
t/a)
LH2
hydr
o (2
,78 t/a
)LH
2 hyd
ro (2
16 t/a
)
[kW
h PE/k
Wh e
l]
ManufacturingFuel useFuel supply
ICE SOFC/MCFC PEMFC
Figure 3-2 shows the life cycle CO2, CH4 and N2O emissions for onboardelectricity generation in terms of CO2 equivalent including fuel supply,operation and manufacture of the fuel cell system or the diesel generator.
Figure 3-3, Figure 3-4, Figure 3-5, Figure 3-6 and Figure 3-7 show the lifecycle emissions of air pollutants of onboard electricity generation.

FCSHIP G3RD-CT-2002-00823DTR-4.5-LBST-05.2004 Rev. 2
Page 30
Figure 3-2: Life cycle CO2, CH4 and N2O emissions of onboard powersupply in terms of CO2 equivalent of case ship 1
0
200
400
600
800
1000
1200
1400HF
O 3,
5% S
HFO
1,0%
S
Dies
el 10
ppm
LNG
impo
rtLN
G No
rway
LNG
onsit
e (St
irling
)LH
2-NG
(2,78
t/d)
LH2-
NG (2
16 t/d
)LH
2-HF
O (2
16 t/d
)LH
2 wind
(2,78
t/a)
LH2
wind
(216
t/a)
LH2 h
ydro
(2,78
t/a)
LH2 h
ydro
(216
t/a)
[g C
O2 e
quiv
alen
t/kW
h el]
N2O
CH4
CO2
ηel (diesel engine) 43.3%
ηel (diesel SOFC/MCFC) 41.8%ηel (LNG SOFC/MCFC) 47.8%
ηel (H2 PEMFC) 50.0%
ICE SOFC/MCFC PEMFC
Figure 3-3: Life cycle SO2 emissions of onboard power supply of caseship 1
0
2
4
6
8
10
12
14
16
HFO
3,5%
S
HFO
1,0%
SDi
esel
10 p
pm
LNG
impo
rtLN
G No
rway
LNG
onsit
e (St
irling
)LH
2-NG
(2,78
t/d)
LH2-
NG (2
16 t/d
)LH
2-HF
O (2
16 t/d
)LH
2 wind
(2,78
t/a)
LH2
wind
(216
t/a)
LH2 h
ydro
(2,78
t/a)
LH2 h
ydro
(216
t/a)
[g S
O2/k
Wh
el]
Manufacture ICE/FC system
Combustion
Fuel supply
ηel (diesel engine) 43.3%
ηel (diesel SOFC/MCFC) 41.8%ηel (LNG SOFC/MCFC) 47.8%
ηel (H2 PEMFC) 50.0%
ICE SOFC/MCFC PEMFC

FCSHIP G3RD-CT-2002-00823DTR-4.5-LBST-05.2004 Rev. 2
Page 31
Figure 3-4: Life Cycle NOx emissions of onboard power supply of caseship 1
0
2
4
6
8
10
12
14
HFO
3,5%
SHF
O 1,0
% S
Dies
el 10
ppm
LNG
impo
rtLN
G No
rway
LNG
onsit
e (St
irling
)LH
2-NG
(2,78
t/d)
LH2-
NG (2
16 t/d
)LH
2-HF
O (2
16 t/d
)LH
2 wind
(2,78
t/a)
LH2
wind
(216
t/a)
LH2 h
ydro
(2,78
t/a)
LH2 h
ydro
(216
t/a)
[g N
O x/k
Wh e
l]
Manufacture ICE/FC system
Combustion
Fuel supply
ηel (diesel engine) 43.3%
ηel (diesel SOFC/MCFC) 41.8%
ηel (LNG SOFC/MCFC) 47.8%
ηel (H2 PEMFC) 50.0%
ICE SOFC/MCFC PEMFC
Figure 3-5: Life Cycle dust and particulate matter (PM) emissions ofonboard power supply of case ship 1
0
0.2
0.4
0.6
0.8
1
1.2
1.4
1.6
1.8
HFO
3,5%
SHF
O 1,
0% S
Dies
el 10
ppm
LNG
impo
rtLN
G No
rway
LNG
onsit
e (St
irling
)LH
2-NG
(2,78
t/d)
LH2-
NG (2
16 t/d
)LH
2-HF
O (2
16 t/d
)LH
2 wi
nd (2
,78 t/d
)LH
2 wi
nd (2
16 t/
d)LH
2 hy
dro
(2,78
t/d)
LH2 h
ydro
(216
t/d)
[g D
ust &
PM
/kW
h el]
Manufacture ICE/FC system
CombustionFuel supply
ηel (diesel engine) 43.3%
ηel (diesel SOFC/MCFC) 41.8%
ηel (LNG SOFC/MCFC) 47.8%
ηel (H2 PEMFC) 50.0%
ICE SOFC/MCFC PEMFC

FCSHIP G3RD-CT-2002-00823DTR-4.5-LBST-05.2004 Rev. 2
Page 32
Figure 3-6: Life Cycle NMVOC emissions of onboard power supplyof case ship 1
0
0.1
0.2
0.3
0.4
0.5
0.6
0.7
0.8
HFO
3,5%
SHF
O 1,
0% S
Dies
el 10
ppm
LNG
impo
rtLN
G No
rway
LNG
onsit
e (St
irling
)LH
2-NG
(2,78
t/d)
LH2-
NG (2
16 t/d
)LH
2-HF
O (2
16 t/d
)LH
2 wind
(2,78
t/a)
LH2
wind
(216
t/a)
LH2 h
ydro
(2,78
t/a)
LH2 h
ydro
(216
t/a)
[g N
MVO
C/kW
h el]
Manufacture ICE/FC system
CombustionFuel supply
ηel (diesel engine) 43.3%ηel (diesel SOFC/MCFC) 41.8%
ηel (LNG SOFC/MCFC) 47.8%ηel (H2 PEMFC) 50.0%
ICE SOFC/MCFC PEMFC
Figure 3-7: Life Cycle CO emissions of onboard power supply of caseship 1
0
0.5
1
1.5
2
HFO
3,5%
SHF
O 1,0
% S
Dies
el 10
ppm
LNG
impo
rtLN
G No
rway
LNG
onsit
e (S
tirling
)LH
2-NG
(2,78
t/d)
LH2-
NG (2
16 t/d
)LH
2-HF
O (2
16 t/d
)LH
2 wi
nd (2
,78 t/a
)LH
2 wi
nd (2
16 t/a
)LH
2 hyd
ro (2
,78 t/a
)LH
2 hy
dro
(216
t/a)
[g C
O/k
Wh e
l]
Manufacture ICE/FC systemCombustionFuel supply
ηel (diesel engine) 43.3%
ηel (diesel SOFC/MCFC) 41.8%
ηel (LNG SOFC/MCFC) 47.8%
ηel (H2 PEMFC) 50.0%
ICE SOFC/MCFC PEMFC

FCSHIP G3RD-CT-2002-00823DTR-4.5-LBST-05.2004 Rev. 2
Page 33
3.2 Case ship 2
Figure 3-8 shows the total primary energy input for the different fuel/propulsion system combinations split into fuel supply, fuel use duringonboard ship operation and primary energy demand for the manufacture ofthe diesel engine or the fuel cell system.
Figure 3-9 shows the annual CO2, CH4 and N2O emissions from theoperation of one ship.
The emissions of air pollutants are shown in Figure 3-10 (SO2), Figure 3-11(NOx), Figure 3-12 (dust and particulate matter (PM)), Figure 3-13 (NMVOC)and Figure 3-14 (CO). The acidification (expressed as SO2 equivalents) andeutrophication (expressed as PO4
3- equivalents) from the different pathwaysare shown in Figure 4-5 and Figure 4-6.
Figure 3-8: Annual life cycle energy use of case ship 2
0
200,000
400,000
600,000
800,000
1,000,000
1,200,000
1,400,000
MGO
< 0,
2% S
CGH2
wind
offsh
ore
CGH2
-NG-
onsit
e (AT
R)
CGH2
-NG-
onsit
e (S
R)
CGH2
-WW
2,5
MW
th
CGH2
-WF 2
,5 M
Wth
CGH2
-WW
10 M
Wth
CGH2
-WF
10 M
Wth
[kW
h PE/y
r]
Manufacturing ICE/FC systemFuel useFuel supply
ICE PEMFC

FCSHIP G3RD-CT-2002-00823DTR-4.5-LBST-05.2004 Rev. 2
Page 34
Figure 3-9: Annual life cycle CO2, CH4 and N2O emissions in termsof CO2 equivalent from the operation of case ship 2
0
50
100
150
200
250
300
350M
GO <
0,2%
S
CGH2
wind
offs
hore
CGH2
-NG-
onsit
e (AT
R)
CGH2
-NG-
onsit
e (SR
)
CGH2
-WW
2,5 M
Wth
CGH2
-WF 2
,5 M
Wth
CGH2
-WW
10 M
Wth
CGH2
-WF
10 M
Wth
[t CO
2 equ
ival
ent/a
]
N2O
CH4
CO2
Fuel consumptionDiesel ship: 991,000 kWh/aH2-FC ship: 530,000 kWh/a
ICE PEMFC
Figure 3-10: Annual life cycle SO2 emissions from the operation ofcase ship 2
-0.02
0
0.02
0.04
0.06
0.08
0.1
0.12
0.14
0.16
MGO
< 0,
2% S
CGH2
wind
offs
hore
CGH2
-NG-
onsit
e (A
TR)
CGH2
-NG-
onsit
e (SR
)
CGH2
-WW
2,5 M
Wth
CGH2
-WF
2,5 M
Wth
CGH2
-WW
10 M
Wth
CGH2
-WF
10 M
Wth
[t SO
2/a]
Manufacture ICE/FC system
Fuel combustion
Fuel supply
Fuel consumptionDiesel ship: 991,000 kWh/aH2-FC ship: 530,000 kWh/a
ICE PEMFC

FCSHIP G3RD-CT-2002-00823DTR-4.5-LBST-05.2004 Rev. 2
Page 35
Figure 3-11: Annual life cycle NOx emissions from the operation ofcase ship 2
0
0.5
1
1.5
2
2.5
3
3.5M
GO <
0,2%
S
CGH2
wind
offs
hore
CGH2
-NG-
onsit
e (A
TR)
CGH2
-NG-
onsit
e (SR
)
CGH2
-WW
2,5 M
Wth
CGH2
-WF
2,5 M
Wth
CGH2
-WW
10 M
Wth
CGH2
-WF
10 M
Wth
[t NO
x/a]
Manufacture ICE/FC system
Fuel combustion
Fuel supply
Fuel consumptionDiesel ship: 991,000 kWh/aH2-FC ship: 530,000 kWh/a
ICE PEMFC
Figure 3-12: Annual life cycle emissions of dust and particulatematter (PM) from the operation of case ship 2
0
0.02
0.04
0.06
0.08
0.1
0.12
0.14
0.16
0.18
0.2
MGO
< 0,
2% S
CGH2
wind
offsh
ore
CGH2
-NG-
onsit
e (A
TR)
CGH2
-NG-
onsit
e (SR
)
CGH2
-WW
2,5
MW
th
CGH2
-WF
2,5 M
Wth
CGH2
-WW
10 M
Wth
CGH2
-WF
10 M
Wth
[t Du
st/P
M/a
]
Manufacture ICE/FC system
Fuel combustionFuel supply
Fuel consumptionDiesel ship: 991,000 kWh/aH2-FC ship: 530,000 kWh/a
ICE PEMFC

FCSHIP G3RD-CT-2002-00823DTR-4.5-LBST-05.2004 Rev. 2
Page 36
Figure 3-13: Annual life cycle NMVOC emissions from the operationof case ship 2
-0.1
0
0.1
0.2
0.3
0.4
0.5MG
O <
0,2%
S
CGH2
wind
offsh
ore
CGH2
-NG-
onsit
e (AT
R)
CGH2
-NG-
onsit
e (SR
)
CGH2
-WW
2,5 M
Wth
CGH2
-WF 2
,5 M
Wth
CGH2
-WW
10 M
Wth
CGH2
-WF
10 M
Wth
[t NM
VOC/
a]
Manufacture ICE/FC system
Fuel combustion
Fuel supply
Fuel consumptionDiesel ship: 991,000 kWh/aH2-FC ship: 530,000 kWh/a
ICE PEMFC
Figure 3-14: Annual life cycle CO emissions from the operation ofcase ship 2
0
0.2
0.4
0.6
0.8
1
1.2
1.4
1.6
MGO
< 0,
2% S
CGH2
wind
offsh
ore
CGH2
-NG-
onsit
e (AT
R)
CGH2
-NG-
onsit
e (S
R)
CGH2
-WW
2,5 M
Wth
CGH2
-WF 2
,5 M
Wth
CGH2
-WW
10 M
Wth
CGH2
-WF
10 M
Wth
[t CO
/a]
Manufacture ICE/FC system
Fuel combustion
Fuel supply
Fuel consumptionDiesel ship: 991,000 kWh/aH2-FC ship: 530,000 kWh/a
ICE PEMFC
FCSHIP G3RD-CT-2002-00823DTR-4.5-LBST-05.2004 Rev. 2
Page 37
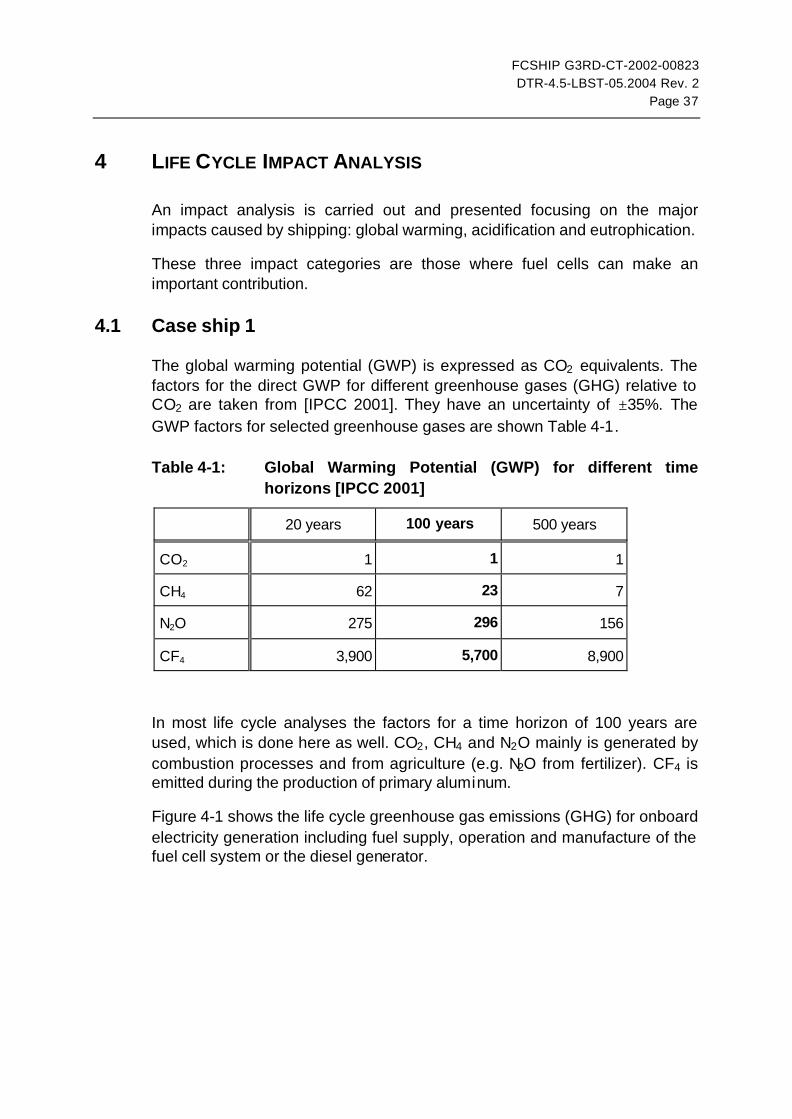
4 LIFE CYCLE IMPACT ANALYSIS
An impact analysis is carried out and presented focusing on the majorimpacts caused by shipping: global warming, acidification and eutrophication.
These three impact categories are those where fuel cells can make animportant contribution.
4.1 Case ship 1
The global warming potential (GWP) is expressed as CO2 equivalents. Thefactors for the direct GWP for different greenhouse gases (GHG) relative toCO2 are taken from [IPCC 2001]. They have an uncertainty of ±35%. TheGWP factors for selected greenhouse gases are shown Table 4-1.
Table 4-1: Global Warming Potential (GWP) for different timehorizons [IPCC 2001]
20 years 100 years 500 years
CO2 1 1 1
CH4 62 23 7
N2O 275 296 156
CF4 3,900 5,700 8,900
In most life cycle analyses the factors for a time horizon of 100 years areused, which is done here as well. CO2, CH4 and N2O mainly is generated bycombustion processes and from agriculture (e.g. N2O from fertilizer). CF4 isemitted during the production of primary aluminum.
Figure 4-1 shows the life cycle greenhouse gas emissions (GHG) for onboardelectricity generation including fuel supply, operation and manufacture of thefuel cell system or the diesel generator.

FCSHIP G3RD-CT-2002-00823DTR-4.5-LBST-05.2004 Rev. 2
Page 38
Figure 4-1: Life cycle GHG emissions of onboard power supply of caseship 1
0
200
400
600
800
1000
1200
1400
HFO
3,5%
S
HFO
1,0%
SDi
esel
10 pp
m
LNG
impo
rtLN
G No
rway
LNG
onsit
e (S
tirling
)LH
2-NG
(2,78
t/d)
LH2-
NG (2
16 t/d
)LH
2-HF
O (2
16 t/d
)LH
2 wi
nd (2
,78 t/a
)LH
2 wi
nd (2
16 t/a
)LH
2 hyd
ro (2
,78 t/a
)LH
2 hyd
ro (2
16 t/a
)
[g C
O 2 e
quiv
alen
t/kW
h el]
Manufacture ICE/FC systemCombustion
Fuel supplyηel (diesel engine) 43.3%ηel (diesel SOFC/MCFC) 41.8%
ηel (LNG SOFC/MCFC) 47.8%ηel (H2 PEMFC) 50.0%
ICE SOFC/MCFC PEMFC
For the conventional heavy fuel oil (HFO) and the reduced-sulfur HFOgreenhouse gases are essentially the same as additional energyrequirements for mild desulfurization are low compared to the CO2 emissionsof fuel combustion.
Sulfur-free car diesel production at the refinery has higher energyrequirements than heavy fuel oil because it is a higher-value productrequiring more efforts and because desulfurization to below 10 ppm is energyintensive. On the other hand, diesel has a lower carbon content per energycontent than heavy fuel oil. This compensates for the higher GHG emissionsis production and the slightly lower efficiency of the diesel SOFC systemonboard the ship.
Liquefied natural gas (LNG) has a 29% lower carbon content per energycontent than HFO. Additionally, the LNG powered MCFC fuel cell system ismore efficient than the combustion engine. These two effects combine to a22%-37% reduction in overall GHG emissions over the conventionalbenchmark.
LNG from Norway transported to Oslo the variant with the lowest GHGemissions because of the short transport distance. Onsite liquefaction of

FCSHIP G3RD-CT-2002-00823DTR-4.5-LBST-05.2004 Rev. 2
Page 39
pipeline natural gas is higher in GHG emissions because of the lowerefficiency of small-scale liquefaction machines. LNG import from “longdistance”, which in the concrete case is assumed to be from Algeria, NorthAfrica, is the highest GHG emission variant because of the long transportdistance translating into higher energy requirements and higher CH4 losses.
In spite of the fact that the efficiency of the liquid hydrogen (LH2) poweredPEM fuel cell is the highest of all systems considered here, natural gasderived hydrogen induces slightly higher GHG emissions than HFO poweredsystems and significantly higher GHG emissions than LNG poweredsystems. This is due to the energy requirements of hydrogen generation fromnatural gas and of hydrogen liquefaction. Hydrogen generation from HFO atthe refinery has the highest GHG emissions of all variants considered herestemming from the higher carbon content of HFO and the less efficientgeneration process compared to natural gas steam reforming.
Hydrogen generation from renewable electricity (wind, hydro power etc.) hasextremely low GHG emissions stemming from the construction of the facilitiesand the infrastructures.
Overall, the contribution to the GHG emissions stemming from themanufacturing of the combustion engine or fuel cell systems is negligiblecompared to all other contributions, even in the case of renewably producedhydrogen.
The emissions of SO2, NOx and NH3 lead to the acidification of waters andsoils. The acidification potential is indicated as SO2 equivalents. No separateNH3 balance has been made for the single steps of the life cycle. Therefore,NH3 is not included here in the calculation of the acidification potential. Theerror induced by this should be small as the processes relevant here havezero or small NH3 emissions. Major contributions to global NH3 emissionsstem from livestock farming. The acidification potential factors indicated in[Pehnt 2002] are used here (SO2: 1; NOx: 0.7). The results are shown inFigure 4-2.
The emissions of NOx and NH3 lead to a eutrophication of waters. Asdescribed in the above paragraph, NH3 is not taken into account here. Again,the error induced by this should be small. The eutrophication potential isindicated as PO4
3- equivalent. The eutrophication potential factor of NOx is0.13 [Pehnt 2002]. The results are shown Figure 4-3.

FCSHIP G3RD-CT-2002-00823DTR-4.5-LBST-05.2004 Rev. 2
Page 40
Figure 4-2: Life cycle acidification (SO2 equivalent) of onboardpower supply of case ship 1
0
5
10
15
20
25
HFO
3,5%
SHF
O 1,0
% S
Dies
el 10
ppm
LNG
impo
rtLN
G No
rway
LNG
onsit
e (S
tirling
)LH
2-NG
(2,78
t/d)
LH2-
NG (2
16 t/d
)LH
2-HF
O (2
16 t/d
)LH
2 wi
nd (2
,78 t/a
)LH
2 wi
nd (2
16 t/a
)LH
2 hyd
ro (2
,78 t/a
)LH
2 hyd
ro (2
16 t/a
)
[g S
O 2 e
quiv
alen
t/kW
h el]
Manufacture ICE/FC system
Combustion
Fuel supply
ηel (diesel engine ) 43.3%ηel (diesel SOFC/MCFC) 41.8%
ηel (LNG SOFC/MCFC) 47.8%ηel (H2 PEMFC) 50.0%
ICE SOFC/MCFC PEMFC
Figure 4-3: Life cycle eutrophication (PO43- equivalent) of onboard
power supply of case ship 1
0
0.2
0.4
0.6
0.8
1
1.2
1.4
1.6
1.8
HFO
3,5%
SHF
O 1,
0% S
Dies
el 10
ppm
LNG
impo
rtLN
G No
rway
LNG
onsit
e (St
irling
)LH
2-NG
(2,78
t/d)
LH2-
NG (2
16 t/d
)LH
2-HF
O (2
16 t/d
)LH
2 wind
(2,78
t/a)
LH2 w
ind (2
16 t/a
)LH
2 hy
dro
(2,78
t/a)
LH2 h
ydro
(216
t/a)
[g P
O43-
equ
ival
ent/k
Wh e
l]
Manufacture ICE/FC system
Combustion
Fuel supply
ηel (diesel engine) 43.3%
ηel (diesel SOFC/MCFC) 41.8%
ηel (LNG SOFC/MCFC) 47.8%
ηel (H2 PEMFC) 50.0%
ICE SOFC/MCFC PEMFC

FCSHIP G3RD-CT-2002-00823DTR-4.5-LBST-05.2004 Rev. 2
Page 41
Over 90% of the acidification potential and of the eutrophication potentialstem from fuel combustion in conventional engines. Impacts of fuelproduction and supply and of system manufacturing are very low. This is dueto the high sulfur content of conventional ship fuels and the high NOx
emissions in conventional fuel combustion.
For fuel cell systems, sulfur emissions from system operation are zerobecause of essentially zero sulfur content in fuels used. NOx emissions fromsystem operation is also essentially zero because of the low operatingtemperatures of fuel reformers for high temperature fuel cells. Low-temperature hydrogen powered PEM fuel cells are truly zero emission. Themain contribution to full fuel cycle sulfur and NOx emissions stems fromauxiliary electricity consumption in fuel production and supply.
4.2 Case ship 2
Figure 4-4 shows the annual GHG emissions of case ship 2 in terms of CO2
equivalent.
Figure 4-4: Annual life cycle GHG emissions from the operation ofcase ship 2
0
50
100
150
200
250
300
350
MGO
< 0,
2% S
CGH2
wind
offs
hore
CGH2
-NG-
onsit
e (A
TR)
CGH2
-NG-
onsit
e (SR
)
CGH2
-WW
2,5 M
Wth
CGH2
-WF
2,5 M
Wth
CGH2
-WW
10 M
Wth
CGH2
-WF
10 M
Wth
[t CO
2 equ
ival
ent/a
]
Manufacture ICE/FC system
Combustion
Fuel supply
Fuel consumptionDiesel ship: 991,000 kWh/aH2-FC ship: 530,000 kWh/a
ICE PEMFC
A major difference between case ship 1 and case ship 2 is the differingoperating profile of the two ship types. While in case ship 1 the onboard

FCSHIP G3RD-CT-2002-00823DTR-4.5-LBST-05.2004 Rev. 2
Page 42
electricity generation is always operated close to 100% rated power, thepropulsion of case ship 2 often operates at part load. While the efficiency ofcombustion engines is maximal at rated power and decreases towards partload, the efficiency of fuel cells is higher at part-load than at full load.Therefore, operating profiles with high part-load shares favor fuel cells.
This effect can be observed in Figure 4-4: Overall GHG emissions for naturalgas derived hydrogen powering PEM fuel cells are around 20% lower thanthose of the conventional combustion engine powered by marine gas oil(MGO) in spite of the energy requirements of hydrogen generation fromnatural gas and of hydrogen compression. This is further enhanced by thelower carbon content per energy content of natural gas compared to MGO.
Figure 4-5 shows the acidification potential of case ship 2 in terms of SO2
equivalent.
Figure 4-5: Acidification: annual life cycle SO2 equivalent emissionsfrom the operation of one ship (case ship 2)
0
0.5
1
1.5
2
2.5
MGO
< 0,
2% S
CGH2
wind
offsh
ore
CGH2
-NG-
onsit
e (AT
R)
CGH2
-NG-
onsit
e (S
R)
CGH2
-WW
2,5 M
Wth
CGH2
-WF 2
,5 M
Wth
CGH2
-WW
10 M
Wth
CGH2
-WF
10 M
Wth
[t SO
2 equ
ival
ent/a
]
Manufacture ICE/FC system
Fuel combustion
Fuel supply
Fuel consumptionDiesel ship: 991,000 kWh/aH2-FC ship: 530,000 kWh/a
ICE PEMFC
Figure 4-6 shows the eutrophication potential of case ship 2 in terms of PO43-
equivalent.

FCSHIP G3RD-CT-2002-00823DTR-4.5-LBST-05.2004 Rev. 2
Page 43
Figure 4-6: Eutrophication: annual life cycle PO43- equivalent
emissions from the operation of one ship (case ship 2)
0
0.05
0.1
0.15
0.2
0.25
0.3
0.35
0.4
0.45M
GO <
0,2%
S
CGH2
wind
offsh
ore
CGH2
-NG-
onsit
e (AT
R)
CGH2
-NG-
onsit
e (S
R)
CGH2
-WW
2,5 M
Wth
CGH2
-WF 2
,5 M
Wth
CGH2
-WW
10 M
Wth
CGH2
-WF
10 M
Wth
[t PO
43- e
quiv
alen
t/a]
Manufacture ICE/FC system
Fuel combustion
Fuel supply
Fuel consumptionDiesel ship: 991,000 kWh/aH2-FC ship: 530,000 kWh/a
ICE PEMFC
The giant share of the acidification potential and of the eutrophicationpotential stem from fuel combustion in conventional engines. Impacts of fuelproduction and supply and of system manufacturing are low. To a certainextent this is due to the sulfur content of the conventional ship fuel and to alarge extent to the high NOx emissions in conventional fuel combustion.
For fuel cell systems, sulfur and NOx emissions from system operation arezero. The main contribution to full fuel cycle sulfur and NOx emissions stemsfrom auxiliary electricity consumption in fuel production and supply.

FCSHIP G3RD-CT-2002-00823DTR-4.5-LBST-05.2004 Rev. 2
Page 44

FCSHIP G3RD-CT-2002-00823DTR-4.5-LBST-05.2004 Rev. 2
Page 45
5 COST ANALYSIS OF FUELS
Fuel production and supply costs depend on various factors, not the leastimportant being the industrial context. The conventional fuels are well-established and available at all ports. The same will be true for advancedconventional fuels such as reduced-sulfur HFO or sulfur-free car diesel,which will be introduced to the road transport markets on a broad scale inEurope starting in 2005 and which will therefore be in principle also availablefor ships. Natural gas is also widely available, though not in all parts ofEurope. It is definitely not available at all ports, and in liquefied form it is onlyavailable at selected spots of Europe. Hydrogen is available at few locationsin Europe. Both LNG and LH2 can be made available to ships, but they aredefinitely not established ship fuels.
At present, hydrogen is a chemical commodity, not a transport fuel. Theindustrial context of hydrogen fuel does not exist and consequently all costprojections have to be based on a future industrial scenario. Assuming nichemarkets for hydrogen only, production and supply costs will not besignificantly different from today’s high prices of this chemical commoditysupplied by industrial gas companies to the various small industrialconsumers.
In a scenario of large scale introduction of hydrogen as transport fuel, costswill be significantly lower than today for applications such as passenger cars,as the commercial and logistic structures will be entirely different. For largeship applications infrastructures will be similar to today’s structures of captivehydrogen production and consumption. Very large amounts of hydrogen willbe produced near the point of consumption. Today these are refineries orammonia plants, in the future these may include ports.
For the present analysis, the following assumptions have been made for thecost estimates for a time frame of 2010 and beyond:
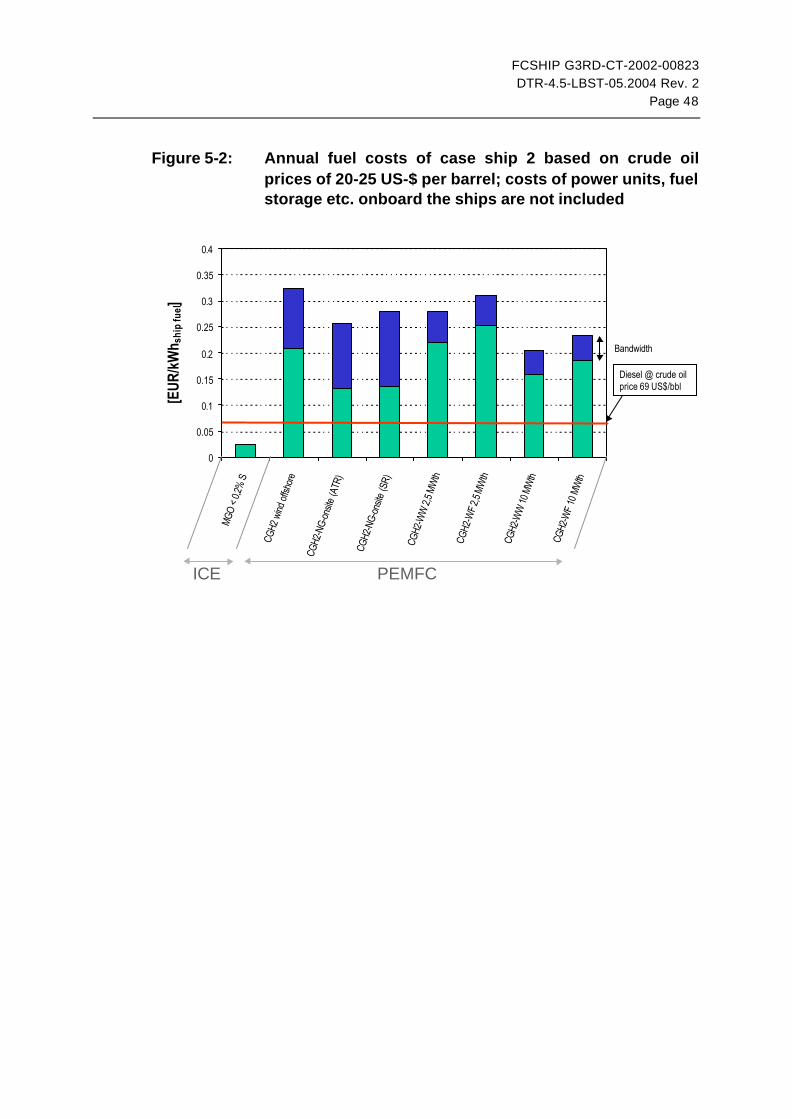
• For conventional HFO market prices have been used as the benchmarkbased on crude oil prices of 20-25 US-$ per barrel.
• For reduced-sulfur HFO additional costs for desulfurization based on[Beicip 2002] have been applied to HFO market prices.

FCSHIP G3RD-CT-2002-00823DTR-4.5-LBST-05.2004 Rev. 2
Page 46
• For sulfur-free car diesel market prices have been assumed based oncrude oil prices of 20-25 US-$ per barrel. In order to span the historicalcrude oil prices, a red line indicating diesel costs calculated on the basis ofa crude oil prices of 69 US-$/bbl, the annual average price in 1981 in realterms of 1995, are included in Figure 7.
• For LNG, different pathways have been analyzed. For LNG from remotelocations and from Norway, market prices at import terminals have beenused. These were cross-checked by full cost calculations for newinstallations giving consistent results. Onsite natural gas liquefaction wasbased on natural gas prices in Germany. For the rest of the supply chains(transport, storage etc.), cost calculations were made.
• For LH2 from heavy fuel oil at the refinery and for LH2/ CGH2 from naturalgas full cost calculations have been made based on low price assumptionsfor HFO and based on German gas prices, respectively.
• For LH2/ CGH2 from renewable electricity, full cost calculations have beenmade based on industry electricity prices in Iceland for hydro power andbased on a full cost calculation for offshore wind power, respectively.
• For CGH2 from biomass, full cost calculations have been made based onwaste wood prices and wood farming costs from various literaturesources.
As a result of the cost analysis production and specific supply costs relativeto the energy content of the fuel have been calculated. As there are,however, relatively strong differences in the fuel consumption of the varioussystems, costs have been translated into electricity production costs. Figure5-1 and Figure 5-2 present costs of electricity supply induced by the fuel;costs of power units, fuel storage etc. onboard the ships are not included.
For many of the fuel production and supply paths several variants have beencalculated resulting in the bandwidths presented in Figure 5-1 and Figure 5-2[LBST 2004]. Hydrogen liquefaction costs for example depend heavily on thesize of the liquefaction plant. The upper end of the costs results from smallinstallations only supplying one ship of the case ship 1 type. The lower end isachieved assuming large plants supporting several ships or one ship and anumber of other large-scale customers.

FCSHIP G3RD-CT-2002-00823DTR-4.5-LBST-05.2004 Rev. 2
Page 47
Figure 5-1: Costs of electricity supply onboard case ship 1 based oncrude oil prices of 20-25 US-$ per barrel; costs of powerunits, fuel storage etc. onboard the ships are notincluded
0
0.1
0.2
0.3
0.4
0.5
0.6
HFO
3,5%
S
HFO
1,0%
S
Dies
el 10
ppm
LNG
impo
rt
LNG
Norw
ayLN
G on
site (
Stirli
ng)
LH2-
NG (2
,78 t/d
)LH
2-NG
(216
t/d)
LH2-
HFO
(216
t/d)
LH2
wind
(2,78
-7,41
t/a)
LH2 w
ind (2
16 t/a
)
LH2
hydr
o
[EUR
/kW
h el]
Diesel @ crude oil price 69 US$/bbl
ηel (diesel engine) 43.3%
ηel (diesel SOFC/MCFC) 41.8%
ηel (LNG SOFC/MCFC) 47.8%ηel (H2 PEMFC) 50.0%
ICE SOFC/MCFC PEMFC
Bandwidth
For case ship 2, synergies with hydrogen filling stations for road transporthave been assumed for the lower end of the costs. Here, learning curveeffects for the construction of 1,000 hydrogen filling stations are taken intoaccount, while the upper values assume the costs of the “first” filling station.For offshore wind power, installation costs and electricity transport costshave been varied. For the biomass gasification units of different sizes, the“first” unit has been assumed for the higher end of the costs, and the 20thunit has been assumed for the lower end.
FCSHIP G3RD-CT-2002-00823DTR-4.5-LBST-05.2004 Rev. 2
Page 48
Figure 5-2: Annual fuel costs of case ship 2 based on crude oilprices of 20-25 US-$ per barrel; costs of power units, fuelstorage etc. onboard the ships are not included
0
0.05
0.1
0.15
0.2
0.25
0.3
0.35
0.4
MGO
< 0,2
% S
CGH2
wind
offs
hore
CGH2
-NG-
onsit
e (A
TR)
CGH2
-NG-
onsit
e (S
R)
CGH2
-WW
2,5 M
Wth
CGH2
-WF 2
,5 M
Wth
CGH2
-WW
10 M
Wth
CGH2
-WF
10 M
Wth
[EUR
/kW
h shi
p fu
el]
Diesel @ crude oil price 69 US$/bbl
Bandwidth
ICE PEMFC

FCSHIP G3RD-CT-2002-00823DTR-4.5-LBST-05.2004 Rev. 2
Page 49
6 PORTFOLIO PRESENTATION OF COSTS AND GREENHOUSE
GAS EMISSIONS
A portfolio presentation of the main results of the present analysis includescosts and GHG emissions of all options in one graph. This allows to easilyjudge each option compared to the benchmark with respect to the two majoraspects.
Figure 6-1 presents this portfolio presentation for case ship 1, Figure 6-2 forcase ship 2. In order to span the historical crude oil prices, diesel costscalculated on the basis of a crude oil prices of 69 US-$/bbl, the annualaverage price in 1981 in real terms of 1995, are included in the figures.
Figure 6-1: Portfolio presentation of fuel costs (based on crude oilprices of 20-25 US-$ per barrel with indicative dieselprice based on 69 US-$/bbl) versus greenhouse gasemissions of the various fuel/ electric generating systemoptions for case ship 1
0
200
400
600
800
1000
1200
1400
1600
0.0 0.1 0.2 0.3 0.4 0.5
Costs [EUR/kWhel]
CO
2 eq
uiv
alen
t [g
/kW
h el]
HFO ICE3.5% S - 1.0% S
Diesel MCFC (S < 10 ppm) 20 - 69 US-$/bbl
LNG SOFC
LH2 [HFO] PEMFC
LH2 [NG] PEMFC216 - 2.78 t/d LH2 plant
LH2 [Hydro] PEMFC LH2 [Wind] PEMFC

FCSHIP G3RD-CT-2002-00823DTR-4.5-LBST-05.2004 Rev. 2
Page 50
Figure 6-2: Portfolio presentation of annual fuel costs (based oncrude oil prices of 20-25 US-$ per barrel with indicativediesel price based on 69 US-$/bbl) versus greenhousegas emissions of the various fuel/ propulsion systemoptions for case ship 2
0
50
100
150
200
250
300
350
0 30,000 60,000 90,000 120,000 150,000 180,000
Costs [EUR/a]
CO
2 eq
uiv
alen
t [t/
a]
MGO ICE (0.2% S)
CGH2 [Waste Wood] PEMFC
CGH2 [Wood Farming] PEMFC
CGH2 [NG] PEMFC
CGH2 [Wind]PEMFC
Diesel ICE (10 ppm S) @ crude oil price 69 US$/bbl

FCSHIP G3RD-CT-2002-00823DTR-4.5-LBST-05.2004 Rev. 2
Page 51
7 LIFE CYCLE INTERPRETATION
7.1 Limitations and open issues
This study integrating the results of several sub-studies in the FCSHIPproject is the first Life Cycle Analysis including all stages of fuel cells onboardships.
It has several limitations and shortcomings, which limit its explanatory powerand at the same time indicate areas of further studies.
• Some potential alternative fuels for fuel cells have not been consideredhere. Most prominent examples are ethanol, plant oil, fatty acid methylesters (FAME), synthetic fuels (e.g. Fischer-Tropsch diesel from naturalgas or biomass) and methanol.
• Availability potentials have not been analyzed, neither for fossil fuels norfor renewable fuels. For strategic decisions of future fuel options, thisaspect may prove essential for some fuel options.
• Available data on fuel cell manufacturing are rather limited, restrictingexactness and the reliability of this analysis of this stage. In addition, theassessment of future technology advances is difficult as fuel cells ingeneral are not yet in a stage of commercial availability. CommercialMCFC prototypes for stationary applications are available, but not suitablefor marine applications due to excessive weight and volume. SOFCtechnology is some years behind, being developed for stationaryapplications mainly. PEM fuel cells being developed mainly for automotiveapplications and small stationary applications. First fleets ofdemonstration fuel cell vehicles are emerging at present.
• Development activities of fuel cells for marine applications are very limitedthus far in Europe. Significant assumptions on technology adaptations formarine applications had to be made. This includes assumptions on weightand volume as well as on performance (efficiency, capability of followingpower demand etc.).
• The analysis is limited to two case ship types (large passenger ferry,small commuter ferry) and two applications (hotel load, propulsion). Eventhough this should span a large portion of the entire spectrum with

FCSHIP G3RD-CT-2002-00823DTR-4.5-LBST-05.2004 Rev. 2
Page 52
respect to environmental impacts, there a large number of other shiptypes and potentially further applications, which might be more promisingcommercially. Environmental impacts and cost issues of other ship typesand applications cannot easily be derived from the present analysis.
• The cost analysis should be extended to include a sensitivity analysis,especially in view of highly volatile and potentially further rising fossil fuelprices.
7.2 Conclusions
The conclusions drawn here have to be seen in the light of the limitationsdiscussed above.
It has to be emphasized that only a full Life Cycle Analysis, including fuelsupply and ship operation, gives meaningful results. Supply-only results givemisleading conclusions as emissions of fuel supply and fuel use have to beadded, and because differences in the efficiencies of the onboard conversiontechnology (engine versus fuel cell) give different weight to fuel supplyemissions even if the same fuel is chosen.
Because of the operational profile, the rated power and the difference inefficiency between the conventional engine and the fuel cell, case ship 2 issimilar to a city bus. Not astonishingly, GHG emission and cost estimates aresimilar for both applications.
Case ship 1 on the other hand is rather similar to a long-haul truck: Powerrequirements are close to 100% over long periods of time, and the efficiencyat rated power of the conventional engine and the fuel cell are comparable.
Fuel cell efficiencies assumed here are rather conservative values whichhave already been demonstrated in prototype systems. Fuel cells have thepotential for further efficiency improvements, which would translate intofurther reductions of greenhouse gas emissions for fossil based fuels. Theefficiency improvement potential is especially high for hybrid systemscombining fuel cells with gas turbines.
7.2.1 Emissions
Fuel cells reduce pollutant emissions (SO2, NOx, particulate matter etc.) andrelated environmental impacts (acidification, eutrophication) drasticallyindependent of the fuel chosen. Only SO2 emissions of a small ship (case

FCSHIP G3RD-CT-2002-00823DTR-4.5-LBST-05.2004 Rev. 2
Page 53
ship 2) are not reduced by natural gas derived hydrogen if the Europeanelectricity mix is used for auxiliary power and for hydrogen compression asassumed here. Using for example the German electricity mix would reduceSO2 emissions by more than a factor of two.
Greenhouse gas emissions can be reduced using natural gas fuel for hightemperature fuel cells by 25% to 40% in the onboard power supply of a largeship (case ship 1). In this application, natural gas derived hydrogen does notreduce GHG emissions. Tapping the full fuel cell efficiency potential in thefuture would result in greenhouse gas emission reduction also through theuse of natural gas derived hydrogen. GHG emissions are reduced to almostzero by using renewable hydrogen.
Because of the significantly higher efficiency of the fuel cell compared to theconventional engine in a small ship (case ship 2), even natural gas derivedhydrogen reduces GHG emissions by 20%. GHG emissions are reduced toalmost zero by using renewable hydrogen.
7.2.2 Economics
Ship fuels are exempt from taxes. Therefore, conventional ship fuels areextremely sensitive to variations in crude oil prices. In real terms of 1995,annual average crude oil prices over the last three decades have rangedfrom 12 to 69 US-$ per barrel [WETO 2003].
Reducing the sulfur content of heavy fuel oil from the average 2.5% in the EUto 1.0% would entail additional costs of 50 to 90 EUR per ton; in 2002, pricesfor high sulfur heavy fuel oil were around 140 to 145 EUR/t.
At oil prices of 20-25$/bbl (current prices are around 40$/bbl), only liquefiednatural gas supplied to a large ship (case ship 1) is in the range of costcompetitiveness to conventional or reduced-sulfur ship fuels. At historicallyhigh oil prices, fossil-based hydrogen and eventually renewable hydrogenbecome cost competitive.
Liquefied natural gas fuel is close to competitiveness with conventional fuelsat oil prices of 20-25 $/bbl, depending on the LNG supply path. Depending onthe efficiency advantage of fuel cells compared to conventional engines, LNGbecomes competitive.
Fossil hydrogen based on natural gas or heavy fuel oil is more expensive atcurrent oil prices, but becomes competitive in large ships (case ship 1) at

FCSHIP G3RD-CT-2002-00823DTR-4.5-LBST-05.2004 Rev. 2
Page 54
historically high oil prices. Natural gas based hydrogen supplied to a smallship (case ship 2) comes close to competitiveness at historically high oilprices. Here, further cost reductions are required. These may be achieved bysupplying multiple ships on the same spot leading to economies of scale inthe hydrogen production and supply facility.
Renewable hydrogen is significantly more expensive at oil prices assumedhere, but comes close to competitiveness in a large-scale scenario athistorically high oil prices in large ships (case ship 1). Renewable hydrogensupplied to a small ship (case ship 2) comes close to competitiveness athistorically high oil prices. Here, further cost reductions are required. Thesemay be achieved by supplying multiple ships on the same spot leading toeconomies of scale in the hydrogen production and supply facility, andeliminating/ reducing the need for expensive hydrogen pipelines.
7.3 Recommendations
Based on the Life Cycle Analysis and cost analysis results severalrecommendations for improving cost effectiveness and further reduction ofthe environmental impacts of fuel cell ships are made.
Reductions of sulfur emissions with related acidification impacts are reducedby using reduced-sulfur or sulfur-free fuels independent of the conversiontechnology considered (combustion engine or fuel cell). Fuel cells requiresulfur-free fuels for direct use or for reforming into hydrogen-rich gases.Using sulfur-containing fuels for reforming would require a technicalcomplexity onboard the ship which seems prohibitive. The first and most costeffective step, which to a certain extent is done by the European commissionand by IMO at present, is the drastic reduction of sulfur levels in conventionalmarine fuels.
Reforming systems have extremely low NOx emission levels with related lowacidification and eutrophication impacts. In general, fuel production andsupply also has very low NOx emission levels. Even though options for thereduction of NOx emissions of conventional ship propulsion and electricitygenerating systems have not been studied here a conclusion by analogyfrom stationary and automotive applications is that advanced conventionaltechnology (exhaust gas treatment, internal measures) is the first and mostcost effective means of NOx emission reduction. For some fuel supply pathsusing relatively large amounts of auxiliary electricity (e.g. compressedhydrogen from natural gas or wood) NOx emissions stemming from

FCSHIP G3RD-CT-2002-00823DTR-4.5-LBST-05.2004 Rev. 2
Page 55
combustion processes for electricity generation are relatively high, eventhough still factors smaller than current NOx emissions from ship operation.
For large ship applications greenhouse gas emission reductions can only beachieved through natural gas fuel or renewable energy derived hydrogen asship fuel at the fuel cell efficiencies assumed here. As large ship engines arevery efficient, both fuel cells and internal combustion engines powered bynatural gas probably allow for similar GHG emission reductions (natural gaspowered combustion engines have not been analyzed here). Potential futureefficiency improvements of fuel cells would result in further greenhouse gasemission reductions using fossil based fuels. Depending on the crude oilprices, costs of LNG are similar to slightly higher. Consequently, a costefficient means of reducing GHG emissions from large ships would be theestablishment of liquefied natural gas as marine fuel.
In small ships and boats, greenhouse gas reductions can be achieved bynatural gas or renewable energy derived hydrogen powered fuel cells. Costsof hydrogen are high as long as single ships are supplied. Providinghydrogen fuel to a fleet of ships or to additional consumers such as fuel cellroad vehicles (e.g. city buses) will most probably allow for significant costreductions.
The above listed issues show that fuel cells are not the most immediatesolution to environmental impacts of ship activities. It has to be emphasized,though, that fuel cells have the potential to intrinsically eliminate allenvironmental impacts caused by gaseous emissions at the same time.Therefore, from an environmental perspective, the development of fuel celltechnology for marine applications is strongly recommendable. Dedicateddevelopments of marine fuel cells will allow to exploit the full potential of thetechnology. Important synergies with stationary applications (large ships) andautomotive applications (small ships and boats) should be used.

FCSHIP G3RD-CT-2002-00823DTR-4.5-LBST-05.2004 Rev. 2
Page 56

FCSHIP G3RD-CT-2002-00823DTR-4.5-LBST-05.2004 Rev. 2
Page 57
8 REFERENCES
[Alkaner 2004] Alkaner, S., Zhou, P.; University of Strathclyde, UK:Establishment of life cycle assessment (LCA) model for molten carbonatefuel cell (MCFC); FCSHIP report DTR-4.4.2-SU-04.04; 20 April 2004;unpublished
[Bazari 2004] Bazari, Z., Lloyd’s Register of Shipping (LR): Evaluation of FuelCell Ship Efficiency and Emissions; FCSHIP report DTR-4.3-LR-02.2004;unpublished
[Beicip 2002] Advice on the costs of fuel producers and price premia likely toresult from a reduction in the level of sulphur in marine fuels marketed in theEU; Study C.1/01/2002 carried out by Beicip-Franlab for the EuropeanCommission, Directorate General Environment (DGE), ContractENV.C1/SER/2001/0063; Final Report, April 2002
[CCR 2000] Abgasvorschriften für neue Motoren in der Rheinschifffahrt:Beschluss der Zentralkommission vom 11.05.2000 – 2000 – I-19 Ergänzungder RheinSchUO; Anlage 1 zu Protokoll 19: Kapitel 8a: Emissionen vongasförmigen Schadstoffen und luftverunreinigenden Partikeln vonDieselmotoren.
[DNV 2003] Pretlove, B.; Garmann, Chr.; Tronstad, T.; Det Norske Veritas(DNV), Høvik, Norway: Life cycle assessment of maritime fuel cellapplications; Technical report No. 2003-1544; 2003; unpublished
[DNV 2004] Tronstad, T.; Pretlove, B.; Garman, C.; Det Norske Veritas(DNV), Høvik, Norway: Environmental Inventory of SOFC Manufacture;FCSHIP report DTR-4.4.3-DNV-04.2004; 19 April 2004; unpublished
[DUT 3/2003] Huisman, J., M., Delft University of Technology (DUT):Conceptual design of a FC system for power supply on a harbour ferry;FCSHIP report DTR-3.2-DUT-10.2003; unpublished
[GM 2003] Masten, D., A.; Bosco, A., D., General Motors, Global AlternativePropulsion Center, Honeoye Falls, New York, USA: System design forvehicle applications: GM/Opel; Chapter 53; Handbook of Fuel Cells –Fundamentals, Technoloy and Applications, Volume 4: Fuel Cell Technology

FCSHIP G3RD-CT-2002-00823DTR-4.5-LBST-05.2004 Rev. 2
Page 58
and Applications; John Wiley & Sons, Ltd, 2003; ISBN: 0-471-49926-9; page714-724
[IPCC 2001] Houghton, J., T.; Ding, Y.; Griggs, D., J.; Noguer, M.; van derLinden, P., J.; Dai, X.; Maskell, K.; Johnson, C., A.: Climate Change 2001,The Scientific Basis; published for the Intergovernmental Panel on ClimateChange (IPCC), Cambridge University Press; page 388-391
[LBST 2004] Mostad, H., B., Norsk Hydro, Oslo, Norway; Weinberger, M.,MTU, Friedrichshafen, Germany; Altmann, M.; Weindorf, W.; LBST,Ottobrunn, Germany: Life Cycle Analysis: Energy use, emissions and costsof fuel supply to fuel cell ships; FCSHIP report DTR-4.4.1-LBST-04.2004;unpublished
[Mepsted 2003] Mepsted, G., O., QinetiQ, Gosport, UK; Moore, ., M.,Intelligent Energy, Loughborough, U: Performance and durability of bipolarplate materials; Handbook of Fuel Cells – Fundamentals, Technology andApplications; Volume 3: Fuel Cell Technology and Applications; Wiley 2003;page 286-293
[MT 2004] Brevik, D., A., Norwegian Marine Technology Research Institute(MT): Simulation of high temperature fuel cells as auxiliary generators inRo/Ro passenger ferries; FCSHIP report DTR-3.3-MT-02.2004; unpublished
[MTU 2003] Das MTU HotModule – Brennstoffzellenprogramm; MTUDecember 2003
[Pehnt 2002] Pehnt, M., Deutsches Zentrum für Luft- und Raumfahrt e.V.(DLR), Institut für Thermodynamik, Stuttgart: Ganzheitliche Bilanzierung vonBrennstoffzellen in der Energie- und Verkehrstechnik, VDI Verlag, Düsseldorf2002; ISSN 0178-9414; ISBN 3-18-347606-1
[WETO 2003] World Energy, Technology and Climate Policy Outlook 2030 –WETO, European Commission, Directorate General for research, 2003,europa.eu.int/comm/research/energy/pdf/weto_final_report.pdf
[WM 2003] Levander, O., Wärtsilä Corporation Oy (WM): LNG fuelled FCRoPax vessel; FCSHIP report DTR - 3.2 - WM - 07.2003; unpublished