liens code de la propriété intellectuelle. articles l 122....
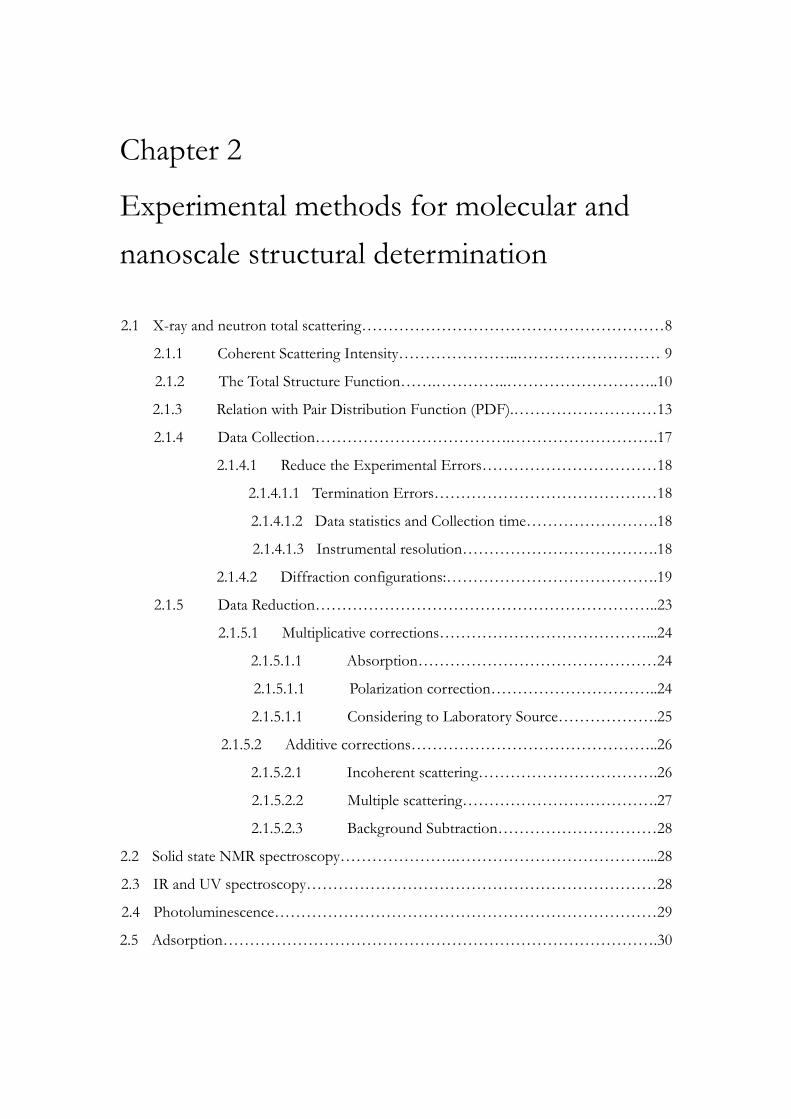
TRANSCRIPT

AVERTISSEMENT
Ce document est le fruit d'un long travail approuvé par le jury de soutenance et mis à disposition de l'ensemble de la communauté universitaire élargie. Il est soumis à la propriété intellectuelle de l'auteur. Ceci implique une obligation de citation et de référencement lors de l’utilisation de ce document. D'autre part, toute contrefaçon, plagiat, reproduction illicite encourt une poursuite pénale. Contact : [email protected]
LIENS Code de la Propriété Intellectuelle. articles L 122. 4 Code de la Propriété Intellectuelle. articles L 335.2- L 335.10 http://www.cfcopies.com/V2/leg/leg_droi.php http://www.culture.gouv.fr/culture/infos-pratiques/droits/protection.htm

___________________________________________________________________________ Collegium Sciences et Technologies École Doctorale SESAMES
THÈSE
Présentée pour l’obtention du titre de Docteur de l’Université de Lorraine
en Physique
par
Kuan-Ying HSIEH
Étude multi-échelle des changements structuraux et leur influence sur les propriétés optiques de complexes photoactifs encapsulés
dans des matrices mésoporeuses
Soutenance publique prévue le 28 octobre 2013 Membres du Jury : Rapporteurs :
R.B. Neder Professeur, University of Erlangen (Germany) J. Schefer Leader Neutron Diffraction group, Paul Scherrer Institut (Switzerland) Examinateurs:
T. Woike Professeur, University of Dresden (Germany) H. Rinnert Professeur, IJL, Université de Lorraine E. Elkaïm Chargé de recherche, CNRS, Synchrotron Soleil E.-E. Bendeif Maître de Conférences, CRM2, Université de Lorraine D. Schaniel Professeur, CRM2, Université de Lorraine Invité : S. Pillet Chargé de recherche CNRS, CRM2, Université de Lorraine
___________________________________________________________________________
Laboratoire de Cristallographie, Résonance Magnétique et Modélisations CRM2, UMR CNRS 7036


Acknowlegments
This thesis was completed at the Laboratoire de Cristallographie, Résonance Magnétique et Modélisations (CRM2), UMR CNRS 7036, at Université de Lorraine, with financial support from the Ministère de l’Éducation Nationale, de l’Enseignement Supérieur et de la Recherche. First and foremost, my greatest appreciation and respect to Prof. Claude Lecomte, former director of laboratory, the past three years spent in his group has been invaluable and extremely beneficial. I would also like to acknowledge all the members of the laboratory, directly or indirectly, helped me get to where I am today.
My deepest gratitude is to my advisors: Prof. Dominik Schaniel whose guidance, encourage and patience over the last three years in every sense of the word, and the enthusiasm and curiosity of science, and Dr. El-Eulmi Bendeif kindly offers his unreserved help and guidance and led me to finish my thesis step by step.
I would like to special thanks to Dr. Sébastien Pillet, who always kindly answers my questions and doubts. I also want to acknowledge Dr. Pierrick Durand and Wenger Emmanuel for the useful help on X-ray diffraction equipments, and Dr. Axel Gansmüller guided me the interest of the solid state NMR analysis. I am grateful to Dr. H. El Hamzaoui at university of Lille, for the collaboration in synthesizing such beautiful silica monoliths.
I am full of gratitude to my thesis committee members, Prof. Reinhard Neder, Dr. Jürg Schefer, Prof. Theo Woike, Prof. Herve Rinnert, and Dr. Erik Elkaïm for their devoted supervision.
I acknowledge the SLS and PSI (Villigen) for provision of synchrotron radiation facilities, Dr: Antonio Cervellino, for assistance in using MS beamline and guiding the prelude of Debussy software. I owe thanks to Dr: Lukas Keller and Dr: Balog Sandor for the neutron experiment at PSI. Additionally, a special thanks to Mirijam Zobel for the help in facilitating PDF data collection and shared her beamtime. In particularly, I want to thank Prof. Wolfgang Schmahl for his inspiration and enthusiasm of crystallography since many years.
I also want to thank my wonderful office mates, Isabella Pignatelli ; Maxime Deutsch ; Mariya Brezgunova, and Bastien Mussard have provided constant support, advice and friendship over the years. I am grateful to Zakaria Tahri and Pascal Parois for

shearing their scientific opinions. I want to acknowledge all of the wonderful friends that I have made over the last three years. There are too many to list them all here.
Finally, I want to thank my family and especially my parent, the gentle love is always around me and gives me strength. I want to give a very special acknowledgement to Yi-Syuan Jhuang. Her support has kept me on the right path and moves on life’s next opportunity with her companionship.

Table of Contents Chapter 1 Introduction…………………………………………………1
Chapter 2 Experimental methods for molecular and nanoscale structural determination
2.1 X-ray and neutron total scattering…………………………………………………8 2.1.1 Coherent Scattering Intensity…………………..……………………… 9 2.1.2 The Total Structure Function………………..………………………...10 2.1.3 Relation with Pair Distribution Function (PDF)…………………….…13 2.1.4 Data Collection………………………………………………………..17
2.1.4.1 Reduce the Experimental Errors……………………………18 2.1.4.1.1 Termination Errors……………………………………18 2.1.4.1.2 Data statistics and Collection time..…...……………….18 2.1.4.1.3 Instrumental resolution ……………………………….18
2.1.4.2 Diffraction configurations :………………………………... 19 2.1.5 Data Reduction……………………………………………………..... 23
2.1.5.1 Multiplicative corrections…………………………………..24 2.1.5.1.1 Absorption………………………………………24 2.1.5.1.1 Polarization correction…………………………..24 2.1.5.1.1 Considering to Laboratory Source……………….25
2.1.5.2 Additive corrections………………………………………..26 2.1.5.2.1 Incoherent scattering…………………………….26 2.1.5.2.2 Multiple scattering……………………………….27 2.1.5.2.3 Background Subtraction…………………………28
2.2 Solid state NMR spectroscopy….……………………….………………………. 28 2.3 IR and UV spectroscopy…………………………………………………………28 2.4 Photoluminescence……………………………………………………………... 29 2.5 Adsorption……………….………………………………………………………30
Chapter 3 Structural Modeling
3.1 The Debye Function analysis (DFA)……………………………………………..33 3.2 Pair distribution function (PDF)…………………………………………………36
3.2.1 Calculating PDF from a model………………………………………...36

3.2.2 Consider finite Q-range………………………………………………..37 3.2.3 Thermal motion……………………………………………………….37 3.2.4 Instrumental resolution………………………………………………..39 3.2.5 PDF of nanoparticles…………………………………………………41 3.2.6 Related functions……………………………………………………...43
3.3 The reverse Monte Carlo Method………………………………………………..44
Chapter 4 Synthesis and multiscale structural analysis of photoswitchable molecular hybrid materials
4.1 Sample preparation………………………………………………………………51 4.1.1 Post-doping….……………………………………………………..….51 4.1.2 Pre-doping…………………………………………………………….52
4.2 Average crystal structure of the bulk material Na2[Fe(CN)5NO]·2H2O......……….53 4.3 Evidence of photoswitchable properties…………………………………………56 4.4 The PDF and d-PDF experiments for the bulk and SNP@1nm SiO2 monolith….61
4.4.1 PDFs of bulk SNP……………………………………………………61 4.4.2 PDFs of amorphous SiO2 matrix……………………………………...68 4.4.3 Fingerprint of SNP@SiO2 hybrids……………………………………74
4.5 The Solid State NMR….…………………………………………………………79 4.5.1 Structure of amorphous SiO2 host……………………………………80 4.5.2 Structure and dynamics of the SNP guest……………………………..81 4.5.3 Hydration of the nanocomposite SNP@SiO2 xerogel………….……...85
4.6 Multiscale structural analysis of SNP@SiO2 (1nm, 5nm, 11nm): the structural aspect-pore size and organisation relationship……………………………………86 4.6.1 Problems of SNP crystallized on monolith surface……………………86 4.6.2 SNP@SiO2 (5nm) .……………………………………………………90 4.6.3 Pre-doping SNP@SiO2 nanocomposites…….………………………...96
4.7 Conclusion..……………………………………………………………………...99 Annex…………………………………………………………………..……………101
Chapter 5 Structural investigation and photoluminescent properties of embedded neodymium complex
5.1 Sample preparation……………………………………………………………..109 5.2 Average crystal structure of the bulk material [NdCl2(H2O)6]Cl-………………...109 5.3 Optical properties………………………………………………………………114
5.3.1 UV-visible spectroscopy……………………………………………...114

5.3.2 IR spectroscopy……………………………………………………...115 5.3.3 Photoluminescence…………………………………………………..116
5.4 Total scattering methods………………………………………………………..118 5.4.1 Differential pattern…………………………………………………..120 5.4.2 Structure of embedded Nd3+ complexes……………………………..123 5.4.3 Debye function analysis……………………………………………...128
5.5 Conclusion……………………………………………………………………...130 Annex………………………………………………………………………………..131
General conclusion and perspectives ……...……………………………......….135
List of publications related to this work


Chapter 1
Introduction
Tremendous efforts are currently related to the conception and fabrication of functional molecular materials and devices with fine-tuned optical and magnetic behaviour, in which the individual entities and their spatial arrangement are engineered down to the nanometer scale [1–6]. In this context, thermo- and photo-switchable molecules, which can be reversibly switched between different structural configurations with different physical properties, are interesting candidates for optical applications [7,8], e.g. ultrafast holography, magneto-optical storage devices or medical pharmacology. However, the processing of such materials is not a mature technology as molecular crystals very often do not sustain the demanding conditions in applications (heat load, power density, etc.). Consequently, different methods of incorporating the molecular functionality in mesoporous silica matrices have been developed in recent years, leading to hybrid organic-inorganic nanocomposite materials [9–23]. The properties of mesoporous silica inorganic supports, namely a large surface area, a robust framework with easily accessible pore architectures with narrow and tunable entrances giving free ingress and egress to the guest species, tunable pore size, make them suitable to host small molecules and nanoparticles. In addition, the incorporation of specific functionality within the inner surface of the channels to provide anchoring points for the guest species can prevent leaching. In such nanocomposites, the silica matrix provides mechanical and chemical stability, in addition to optical transparency, and can be used at the same time to arrange the spatial distribution of the molecular objects, and to tune their concentration, and separation distance. The design of nanocomposites with optical or photonic properties is a very mature field of research [24–26]. Numerous organic dyes, with photochromic, photorefractive, second-order non-linear optic functionalities have been elaborated and fully characterized. Magnetic nanocomposite materials have also gained increasing interest, mostly for medical applications, the silica matrix providing
1

non-toxicity, bio-compatibility, and stability in physiological environments. Among others, Fe2O3@SiO2, Fe3O4@SiO2, and CoFe2O4@SiO2 magnetic composites were reported [11,27,28]. Molecular magnetic clusters, such as the heptanuclear [Cu6Gd] high spin magnetic cluster, have also been immobilized in mesoporous silica [29]. Photoluminescent and photocatalytic [Pt(tpy)Cl]Cl complexes were anchored within functionalized mesoporous silica materials [30]. These series of results demonstrate that isolated molecules, clusters, or nanoparticles can be indeed inserted by wet impregnation methods preserving the molecule integrity inside the nanocavities of mesoporous silica matrices, sometimes functionalized to favour a strong anchoring of the guest molecules. The confined growth of size controlled nanoparticles inside the nanocavities of amorphous or mesostructured silica matrices is a very promising strategy to design nanocomposites with a high monodispersity in nanoparticle size. The templating effect of the host silica matrix confines the supramolecular self-assembly process, and consequently restricts the nanocrystal growth. A careful control of the ageing procedure could allow producing the desired silica xerogels with tailored textural properties and adjustable pore size, thus affording the possibility of assembling and isolating nanoscale objects with tunable sizes, ranging from molecules to molecular aggregates and to crystalline nanoparticles. It is noteworthy that a perfect monodispersity is hardly reachable with alternative synthetic approaches used in the literature to elaborate molecular nanoparticles, such as fast precipitation with a counter solvent, or using water/oil microemulsion, organic polymers, or biomolecular templates.
In order to establish the structure-property relationships of these different nanoscale materials one needs at first a reliable structure description. However, there are currently no robust broadly applicable quantitative methods for solving structures at the nanoscale. Accordingly, deriving the structural organisation and dynamics of nanoparticles in nanocomposites is a very delicate and challenging task. There exist imaging tools (scanning probe microscopies, transmission electron microscopies) which do not yield quantitative 3D structures. Owing to the reduced size of the objects, characterized by a loss of long range translational symmetry and possibly severe structural relaxation, standard crystallographic techniques become inappropriate for studying nanoparticles. New approaches and new experimental tools have to be developed for such nano-crystallographic problems.
One very valuable approach is total scattering and the atomic pair distribution function (PDF) analysis of X-ray and neutron scattering data. Especially, high energy (short wavelength) diffraction data yield short and intermediate range structural information [31]. Total scattering refers to the fact that all (structure-relevant) scattering from a sample is collected, including both Bragg and diffuse components, over a wide
2

range of reciprocal space where coherent scattering exists. The PDF is obtained when the scattering signal is Fourier-transformed to real-space. The data may be modelled quantitatively without any crystallographic assumption to obtain structural information as a function of the length-scale on the nanoscale. Alternatively, the scattering data may be directly fitted using the Debye equation, a sum of the scattering over all pairs of atoms in the particle, allowing the comparison with a structural model. The PDF approach provides more extensive and accurate structural properties compared, for example, to Extended X-ray Absorption Fine Structure spectroscopy (EXAFS). Although EXAFS is a powerful tool for probing local structure, it provides information only about intermediate atomic ordering (near neighbour pairs), while longer-ranged structural features remain hidden and, consequently, the information available about the relative motion of far neighbour pairs is very limited, uncorrelated thermal parameters are not available as well.
The PDF analysis has been used since the early days of X-ray and neutron crystallography to investigate the framework structure of silica. More recently, structural information on nanoparticles, such as manganese ferrite MnFe2O4, iron hydroxyoxide FeOOH, or ammonia borane NH3BH3, embedded in mesoporous silica have been derived through the atomic PDF analysis of synchrotron X-ray diffraction data [28,32,33]. Variable temperature analysis for ammonia borane demonstrates that the embedded nanophase does not undergo the structural phase transition at 225 K, as it was observed for the neat molecular crystal. Rather, the tetragonal phase is preserved to higher temperature, and starts to lose structural correlation above 240 K.
The CRM2 laboratory has initiated some years ago the investigation of molecular nanoparticles and nanocomposites using the PDF analysis. In this context the recent development of an approach based on the Debye formalism which allows studying the structure of isolated molecules in amorphous hosts is of particular interest [34], as the Debye Function analysis is performed in reciprocal space contrary to the PDF which is performed in real space.
The aim of this thesis work was to contribute to this fundamental crystallographic problem of analysing nanoscale structures by a systematic investigation of mesoporous hosts loaded with functional molecules, thereby addressing the following scientific and methodological questions
What is the structure of isolated molecules in a porous or nanostructured environment?
How does the local environment and the particle size influence the functional properties of the embedded molecule/particle?
3

Can we use laboratory X-ray diffractometers to obtain the structural informations (in comparison to synchrotron)?
What are the limits of the total scattering approach and how do the two analysis methods PDF and Debye compare?
The molecular materials used for the study are photoswitchable mononitrosyl compounds and luminescent rare earth complexes embedded in mesoporous hosts such as silica matrices. Due to their photofunctionality – switching of single ligand groups by light, leading to photochromic changes or luminescence – the structure-property relationship can be studied using diffraction (x-ray and neutron) and optical techniques (absorption, infrared and fluorescence spectroscopy). Further experimental methods to be used are adsorption and TEM (determination of pore size and microsctructure), as well as NMR (local structure and dynamics).
The manuscript is organized in 5 chapters. In chapter two the experimental methods for the molecular and nanoscale structural determination are outlined. Chapter three addresses the important details of the different modelling approaches used in this work: PDF, Debye and reverse Monte Carlo. In chapter four the first of the two applications is presented: the structural study of Na2[Fe(CN)5NO].2H2O (Sodium Nitroprusside, SNP) embedded in porous amorphous silica matrices. Thes example is also used for a thorough comparison of the results obtained from synchrotron and laboratory data. In chapter five the results of the structural study on the second example – a luminescent Nd3+ complex embedded in silica matrices – is presented. On this example the PDF and Debye analysis will be compared.
4

Bibliography
[1] A. P. Alivisatos, J. Phys. Chem. 100, 13226 (1996). [2] G. Hodes, Adv. Mater. 19, 639 (2007). [3] A. M. Spokoyny, D. Kim, A. Sumrein, and C. A. Mirkin, Chem. Soc. Rev. 38, 1218
(2009). [4] A. Patra, C. G. Chandaluri, and T. P. Radhakrishnan, Nanoscale 4, 343 (2012). [5] W. Lin, W. J. Rieter, and K. M. L. Taylor, Angew. Chem. Int. Ed Engl. 48, 650
(2009). [6] A. Carné, C. Carbonell, I. Imaz, and D. Maspoch, Chem. Soc. Rev. 40, 291 (2011). [7] O. Sato, J. Tao, and Y.-Z. Zhang, Angew. Chem. Int. Ed Engl. 46, 2152 (2007). [8] M. Goulkov, D. Schaniel, and T. Woike, J. Opt. Soc. Am. B 27, 927 (2010). [9] T. Gacoin, S. Besson, and J. P. Boilot, J. Phys. Condens. Matter 18, S85 (2006). [10] A.-H. Lu and F. Schüth, Adv. Mater. 18, 1793 (2006). [11] A. Parma, I. Freris, P. Riello, D. Cristofori, C. de Julián Fernández, V. Amendola,
M. Meneghetti, and A. Benedetti, J. Mater. Chem. 22, 19276 (2012). [12] A. Tissot, J.-F. Bardeau, E. Rivière, F. Brisset, and M.-L. Boillot, Dalton Trans.
Camb. Engl. 2003 39, 7806 (2010). [13] S. Titos-Padilla, J. M. Herrera, X.-W. Chen, J. J. Delgado, and E. Colacio, Angew.
Chem. Int. Ed. 50, 3290 (2011). [14] C. Faulmann, J. Chahine, I. Malfant, D. de Caro, B. Cormary, and L. Valade, Dalton
Trans. 40, 2480 (2011). [15] J. G. Moore, E. J. Lochner, and A. E. Stiegman, Angew. Chem. Int. Ed Engl. 46,
8653 (2007). [16] J. G. Moore, E. J. Lochner, C. Ramsey, N. S. Dalal, and A. E. Stiegman, Angew.
Chem. Int. Ed. 42, 2741 (2003). [17] G. Clavel, Y. Guari, J. Larionova, and C. Guérin, New J. Chem. 29, 275 (2005). [18] B. Folch, Y. Guari, J. Larionova, C. Luna, C. Sangregorio, C. Innocenti, A.
Caneschi, and C. Guérin, New J. Chem. 32, 273 (2008). [19] G. Fornasieri and A. Bleuzen, Angew. Chem. Int. Ed. 47, 7750 (2008). [20] P. Durand, G. Fornasieri, C. Baumier, P. Beaunier, D. Durand, E. Rivière, and A.
Bleuzen, J. Mater. Chem. 20, 9348 (2010). [21] G. Fornasieri, M. Aouadi, P. Durand, P. Beaunier, E. Rivière, and A. Bleuzen,
Chem. Commun. 46, 8061 (2010). [22] V. Monnier, N. Sanz, E. Botzung-Appert, M. Bacia, and A. Ibanez, J. Mater. Chem.
16, 1401 (2006).
5

6
[23] N. Sanz, P. Terech, D. Djurado, B. Demé, and A. Ibanez, Langmuir 19, 3493 (2003).
[24] B. Lebeau and P. Innocenzi, Chem. Soc. Rev. 40, 886 (2011). [25] R. Pardo, M. Zayat, and D. Levy, Chem. Soc. Rev. 40, 672 (2011). [26] C. Sanchez, B. Lebeau, F. Chaput, and J.-P. Boilot, Adv. Mater. 15, 1969 (2003). [27] R. P. Hodgkins, A. Ahniyaz, K. Parekh, L. M. Belova, and L. Bergström, Langmuir
23, 8838 (2007). [28] D. Carta, A. Corrias, and G. Navarra, J. Non-Cryst. Solids 357, 2600 (2011). [29] I. Kornarakis, G. Sopasis, C. J. Milios, and G. S. Armatas, RSC Adv. 2, 9809 (2012). [30] K. Mori, K. Watanabe, Y. Terai, Y. Fujiwara, and H. Yamashita, Chem. – Eur. J. 18,
11371 (2012). [31] T. Egami and S. J. L. Billinge, Underneath the Bragg Peaks: Structural Analysis of Complex
Materials, 2nd ed. (Pergamon, 2012). [32] H. Kim, A. Karkamkar, T. Autrey, P. Chupas, and T. Proffen, J. Am. Chem. Soc.
131, 13749 (2009). [33] G. Ennas, M. F. Casula, S. Marras, G. Navarra, A. Scano, and G. Marongiu, J.
Nanomater. 2008, (2008). [34] A. Cervellino, J. Schefer, L. Keller, T. Woike, and D. Schaniel, J. Appl. Crystallogr.
43, 1040 (2010)
Chapter 2
Experimental methods for molecular and
nanoscale structural determination
2.1 X-ray and neutron total scattering…………………………………………………8
2.1.1 Coherent Scattering Intensity…………………..……………………… 9
2.1.2 The Total Structure Function…….…………..………………………..10
2.1.3 Relation with Pair Distribution Function (PDF).………………………13
2.1.4 Data Collection……………………………….……………………….17
2.1.4.1 Reduce the Experimental Errors……………………………18
2.1.4.1.1 Termination Errors……………………………………18
2.1.4.1.2 Data statistics and Collection time…………………….18
2.1.4.1.3 Instrumental resolution……………………………….18
2.1.4.2 Diffraction configurations:………………………………….19
2.1.5 Data Reduction………………………………………………………..23
2.1.5.1 Multiplicative corrections…………………………………...24
2.1.5.1.1 Absorption………………………………………24
2.1.5.1.1 Polarization correction…………………………..24
2.1.5.1.1 Considering to Laboratory Source……………….25
2.1.5.2 Additive corrections………………………………………..26
2.1.5.2.1 Incoherent scattering…………………………….26
2.1.5.2.2 Multiple scattering……………………………….27
2.1.5.2.3 Background Subtraction…………………………28
2.2 Solid state NMR spectroscopy………………….………………………………...28
2.3 IR and UV spectroscopy…………………………………………………………28
2.4 Photoluminescence………………………………………………………………29
2.5 Adsorption……………………………………………………………………….30


7
Chapter 2
Experimental methods for molecular and
nanoscale structural determination
Nowadays, functional materials are often built using units structured on the
nanoscale. Due to this limitation of the atomic order to the nanoscale [1,2], as found for
example in nanoparticles [3], species encapsulated in mesoporous hosts [4], and bulk
crystals with defects/dopants or intrinsic nanoscale order [5,6], the structure
determination of such materials is quite challenging. However, a quantitative knowledge
of the atomic structure within these materials is a prerequisite to understanding their
physical properties.
A century ago, the physicist Lawrence Bragg announced an equation that lead to the
well-known success-story of X-ray crystallography [7]. It provides a powerful tool for
studying long-range ordered crystalline structures, but breaks down for structures that
extend only over a few nanometers. For the crystalline material, the diffraction pattern
can be calculated if the unit cell size, symmetry, atom types and their fractional
coordinates are known using the structure factor Fhkl. When dealing with scattering from
nano-objects or objects with only partial crystallinity, the Bragg peaks do not contain the
whole structural information. Diffuse scattering, which is present in every diffraction
pattern but which is usually ignored and considered as a “background correction” in a
Rietveld refinement [8–10], needs to be taken into account. The measurement of the
complete diffraction pattern, including both the Bragg and diffuse components, is
referred to as a total scattering measurement [11–13].

8
There exist several techniques for probing nanostructure materials. Some are
inherently local, such as TEM and scanning probe microscopy. Others are bulk average
probes that are sensitive to the local structure, e.g., EXAFS or NMR. In general, none of
these techniques contains sufficient information to obtain a unique structural resolution.
A coherent strategy is then required combining input from multiple experimental
methods as well as theory in a self-consistent global optimization scheme: sometimes that
we refer to as “complex modelling”. [2]
2.1 X-ray and Neutron total scattering
Rather than collecting all the Bragg peaks at discrete angles as is done in
single-crystal structure determination, in a total scattering measurement the scattered
intensity is measured as continuous function of the scattering angle. This is most
conveniently expressed in terms of the wavevector Q that is defined, for elastic scattering,
as:
(2.1)
Where θ is the scattering angle and λ is the wavelength of radiation used. For elastic
scattering, is the difference between the incident wavevector and the scattered
wavevector as (
) (Figure 2.1).
Figure 2.1 Primary layout of x-ray and neutron diffractometer.

9
2.1.1 Coherent Scattering Intensity
X-ray and neutron total scattering measurements have been used for a long time to
study the isotropic scattering for a variety of materials from powder, liquid or glass. As
usual, in diffraction experiments we measure only the scattered intensity and not the
sample scattering amplitude directly. It is important, however, that the measured sample
is truly isotropic to avoid texture and preferential powder orientation problems. In this
case, the scattered intensity depends only on the amplitude of Q and not on its direction
and is described by the standard scattering equation [11].
(2.2)
Where f denotes the Q-dependent atomic form factor for X-ray scattering, and the
constant scattering length (b) for neutron scattering. Defining rij = ri-rj as the length of
interatomic vector between the atoms i and j, the well-known Debye equation [14] is
obtained by performing the powder average:
(2.3)
Note that the sum in this equation is divided into two parts, namely terms for which i=j,
the so-called “self-scattering” terms and terms for which i≠j, the “distinct” or
“interference” terms. The self-scattering terms will carry no information on the relative
distribution of atoms because it incorporates only the zero distances of an atom whose
Q-dependence is due to its form factor f.
Figure 2.2 shows Icoh(Q) of amorphous SiO2 gel measured by X-ray diffraction and
the corresponding “self-scattering” contribution. One can clearly observe that the
intensity of the diffracted beam falls off with increasing Q. This is a typical feature for
X-ray measurements where the atomic scattering amplitude depends fairly strongly on Q
and is usually denoted as f(Q).

10
Figure 2.2 Coherent scattering Icoh(Q) (blue) and corresponding
‘self-scattering” component (red) in the total scattering intensity of
amorphous SiO2.
2.1.2 The Total Scattering Structure Function
When the measured scattering intensity Icoh(Q) is properly normalized by dividing
by the total number of scattering centers in the sample, N, and the average scattering
factor over all atoms in the sample,〈f〉2, it yields the total scattering structure function
S(Q) as described in the following. Equation (2.4) can be easily deduced from equation
(2.2):
(2.4)
By dividing first by N and then by〈f〉2 we obtain:

11
(2.5)
(2.6)
(2.7)
We define the quantity in Equation (2.7) as S(Q)-1 where S(Q) is the total scattering
structure function*. Substituting this into Equation (2.7)
(2.8)
(2.9)
Finally, we pull out N by defining I(Q)=Icoh(Q)/N, so equation (2.9) is simplified to
(2.10)
The S(Q) includes both Bragg peaks and diffuse scattering and is directly related to
the total scattering amplitude of the sample. The Fourier transform of S(Q), is the
density-density correlation function that allows for the structure refinement in real space
as we discuss in detail later. In general, we assume that scattering from a powder is
isotropic, due to the random grain orientation in powders, and it depends on the
magnitude of wavevector, not on the direction as we have described above. We will thus
* Total scattering structure function is defined theoretically in terms of correlation function according to different researchers, frequently leading to confusion in the literature [15]. In this thesis, we use the notation described by Billinge & Egami (1993) [13].

12
in the following no longer use the vector notation for Q. As an example S(Q) created
from the measured I(Q) of SiO2 (Fig. 2.2) is shown in Figure 2.3.
Figure 2.3 Total scattering structure function, S(Q), (the interference part of
scattering) created from the Icoh(Q) data in Figure 2.2. Note the Bragg
scattering at low to medium range Q, and the diffuse scattering is more
pronounced at high Q region.
The structure function S(Q) has a few interesting features that we would like to
briefly touch on using Figure 2.3 as a reference. First, we note that the function oscillates
around the average value 〈S(Q)〉= 1. We note that the intensity of peaks decreases at
higher values of Q. This is due to the atomic thermal motions, which reduce the Bragg
scattering intensities. Furthermore, we note that the S(Q) function contains both Bragg
intensities, in the form of relatively sharp peaks in the low to middle Q-range, and diffuse
scattering intensities much visible in the high Q-range. Usually the measurement of the
scattered intensity up to a high value of Q, in general referred to as Qmax, with good
statistics is required for obtaining an accurate quantitative structural analysis. Such high
quality data are obtainable by using X-ray synchrotron and/or pulsed spallation neutron

13
sources that provide high intensity and short-wavelength. The Qmax value is a very
important parameter in data processing and is not arbitrarily chosen. More details on this
parameter are given in the next section. However, we need to be aware of the fact that
noise in the data collection has a strong effect on the data quality at high Q because the
〈f〉2 (parameter used in the normalization process of the measured Icoh(Q)) amplifies
oscillations in the signal since it approaches 0 at high Q. Therefore, long collection times
or high X-ray flux are needed to ensure a good signal-to-noise ratio.
In practice, we use the reduced structure function, F(Q)=Q[S(Q)-1] instead of the
total structure function S(Q). The structural information present in S(Q) and F(Q) are
the same, but the value of F(Q) is centred around 0 and we observe the diffuse scattering
features more clearly than in S(Q) as shown on figure 2.4.
Figure 2.4 Reduced total structure factor F(Q)=Q[S(Q)-1] corresponding to
Figure 2.3. Note the F(Q) is centered around 0 and 〈F(Q)〉=0.
2.1.3 Relation with Pair Distribution Function (PDF)
A conceptually simple way to examine the underlying atomic arrangement from the
diffraction data is to take the sine Fourier transform of the reduced total structure factor

14
F(Q) which yields the atomic pair distribution function (PDF) [13]. The mathematical
definition of the PDF, G(r), is:
(2.11)
Where ρ(r) and ρ0 are the local number density and average number density, respectively,
and r is the radial distance. From Equation 2.11 we see that, as r→0, G(r)→-4πρ0. In
general, G(r) has a baseline of slope -4πρ0 at low r. (Figure 2.5).
G(r) can be considered as a histogram of the atom-atom distances in a material. It
gives the probability of finding two atoms separated by the distance r inside the sample.
The peaks in the PDF diagram occur thus at values of r that correspond to the average
interatomic distances in a material and since (r) oscillates around o , G(r) should
oscillate around zero. The relative intensities of the peaks are related to the number of
such interatomic distances in the sample. Thus in principal the PDF contains all the
information about the structure of the material. It is noteworthy to mention that the
PDF is radially averaged and is a one dimensional function. The PDF is similar to a
Patterson map, the difference being that the former takes into account the total
scattering (both the Bragg peaks and the diffuse scattering intensities), while the latter
only considers the Bragg scattering and so a Patterson map only yields interatomic
vectors within a unit cell. While the Bragg scattering yields only the average structure, the
PDF method is thus capable of probing both the local and average structure. This
combination of local and average structural analysis from the same scattering data
represents a clear advantage for a wide range of applications.

15
Figure 2.5 Example of a G(r) of amorphous SiO2, Fourier transformed
from the S(Q) data in Figure 2.2. The dashed lined represents the baseline
of slope -4πρ0.
The importance of the atomic pair distribution function, G(r), is due to the fact that
PDF is related in a simple way to the scattering intensity in X-ray or neutron diffraction
experiments and can be directly obtained by Fourier transforming the measured total
scattering data. As is clear from equation (2.11) the sine Fourier transform is over all Q
space from zero to infinity. Unfortunately, this is not achievable in practice and there will
be always a limitation on the accessible Qmin and Qmax values due to the experimental
setup. The termination of the diffraction pattern at a finite value of Qmax produces
termination ripples, which manifest as false oscillations in the PDF beside the real peaks,
increasing therefore the error especially in the low-r region (Figure 2.6). The higher the
Qmax used in the Fourier transform, the less noticeable the termination ripples. Similarly,
the small angle part of the total scattering patterns, delimited by Qmin, provides
information of shapes and size distributions of particles. This information can be lost in

16
the case of limited low-Q values and leads to biased structural description of the studied
materials.
Figure 2.6 Example of experimental PDFs of SNP complex. Black line
corresponds to data collected up to Qmax = 25 Å -1 and pink line for the
same data terminated at Qmax = 17 Å -1.
Frequently for a laboratory source (long wavelength leading to limited Qmax) or in
the case of measurements of amorphous materials (weak scattering power at high Q), it is
common to use a modification function, M(Q), to help reduce the termination ripples
that would otherwise occur as a result of the finite Q-range and the limited counting
statistics of the scattering data. Alternatively, the step-function describing the
experimental Q-range, can be Fourier-transformed to produce the r-space modification
function with which theoretical r-space functions should be convoluted before
comparison or fitting to Fourier-transformed total scattering data [16]. One of the most
common functions employed was proposed by Lorch (1969) [17,18]. Equation (2.11) can
then be rewritten as:

17
(2.12)
Where Qmin and Qmax represent the finite range in reciprocal space over which the
experimental data have been collected. Furthermore, a shape function γ(r) can be
introduced to handle the missing structural information in the small angle scattering
region [18]. An example of the application of a modification function used in the Fourier
transformation of the reduced structure factor F(Q) is shown in Figure 2.7.
Figure 2.7 Comparison of X-ray G(r) Fourier transformed from a finite Q
range (Qmax =24 Å -1), and G(r) convoluted with a modification function.
2. 1.4 Data Collection
The objective of total scattering experiments is to measure extended Q range data
with high accuracy. In general these experiments are based on similar data collection
strategy as conventional powder diffraction measurement [10,19,20]. However, additional
requirements are mandatory for accurate PDF measurements [13,21]. It is noteworthy

18
that the accuracy in determining Q values and in measuring the intensity is of high
importance in a PDF analysis. The accurate Q values defining the Bragg peak positions
determine the derived lattice parameters, whereas the determination of the measured
intensities gives information about the atomic positions and atomic type within the unit
cell. Thus one has to pay attention to the following details.
2.1.4.1 Reduce the Experimental Errors
2.1.4.1.1 Termination Errors
According to Eq. 2.11, getting high Qmax with good statistics is crucial for obtaining
accurate PDF with minimized termination ripples and a high r-resolution, which may be
approximately given by (δr~π/Qmax) [13]. For the highest resolution and accurate
measurements the use of synchrotron radiation is preferred, however, perfectly
acceptable PDFs can be obtained from laboratory measurements as we discuss in chapter
4. For example, using X-ray laboratory sources such as Molybdenum or Silver, scattering
data can be collected up to Qmax~17 Å -1 and ~21 Å -1, respectively corresponding to
maximum real space resolution δr of ~0.18 Å and ~0.15 Å respectively. However, the
real space resolution is significantly reduced to ~0.39 Å when the Cu K radiation is used
as a consequence of a finite Qmax of ~8 Å -1. From these examples it can be seen that the
Qmax termination effects can be significantly reduced by using available in-house sources
with shorter wavelength giving access to a higher Qmax. However, care must be taken
since on going from Mo to Ag the diffraction power significantly drops in intensity. A
good compromise between the resolution and higher diffracted intensities has therefore
to be found for PDF measurements depending on the sample characteristics.
2.1.4.1.2 Data statistics and Collection time
The intensity of the diffracted beam falls off with increasing Q. As a result the
signal becomes progressively dominated by noise at higher Q-values, which limits the
accessible range of data that can be used for the sample characterization. The
signal-to-noise ratio can be improved by using appropriate data collection strategy as we
will discuss in the following.
2.1.4.1.3 Instrumental resolution
Ideally the experimental measurements would involve a diffractometer that can
resolve all the details of the scattered intensity Icoh(Q). However, real equipments have a
limited resolution which, depending on the samples, may have a major effect on the

19
PDF [21]. The effect of the instrumental resolution is equivalent to multiplying the PDF
by a function such as a Gaussian, which causes the PDF to decay at high-r values. For
amorphous materials the effect of this damping is negligible, because these materials are
dominated by short range order such that their PDF at high r is negligible before the
Q-resolution starts to take effect. For crystalline materials, where theoretically the PDF
extends to infinity, this issue becomes important, especially when investigating the high-r
region. The same applies for the materials that are composed of domain sizes of limited
structural coherence. In these cases it becomes crucial to determine if the decay in the
PDF is due to the structure (domain size) or due to the instrument resolution. This
requires a high resolution PDF experiment from which we can specify the coherent
domain sizes for the material under study.
2.1.4.2 Diffraction configurations:
The total scattering measurement can be carried out from different powder
diffractometer geometries such as a flat-plate symmetric reflection geometry or
transmission geometry. The details on these experimental set ups are well documented in
the literature [22]. The choice between reflection and transmission configuration depends
on the studied sample. In the case of absorbing samples, reflection geometry has the
benefit that the absorption and active volume corrections can be derived fairly
straightforward for the approximation of a parallel incident beam. However, care must
be taken when making the flat plate samples, they should have very uniform thickness
and density and the surface should also be as flat and smooth as possible. Another
important consideration is that the beam footprint does not extend over the edge of the
sample surface area. This will result in an angle dependent drop off in the intensity of the
sample especially at low angles which is very difficult to correct. If the studied samples
are significantly transparent, then the transmission geometry provides stronger scattering
particularly at high angles. This configuration is also more robust than reflection
geometry against alignment errors, especially at low angles. For these considerations, the
transmission geometry is often used at high energy scattering beamlines.
In PDF measurements it is crucial to collect enough points that the step size is
always smaller than the instrument resolution, so all of the Q-space is probed. Adequate
collimation before and after the sample is also important to minimize background from
air scattering and sample environments. Furthermore, care must be taken to ensure that
the focused beam corresponds to the center of the diffractometer and the sample is well
aligned.

20
The total scattering data sets used in this thesis have been collected with
Debye-Scherrer transmission set up by using the radiation of a Molybden tube on a
laboratory diffractometer (figure 2.8) and synchrotron radiation on the powder station of
the Materials Science Beamline at the Swiss Light Source (Figure 2.10). The samples have
been prepared in Kapton capillaries of diameter 1 mm. The unwanted signals due to air
scattering and the experimental set up (empty capillaries) were measured independently
under exactly the same conditions as the sample and are included in the data reduction
procedure.
Laboratory X-ray diffraction measurements were performed on a PANalytical
X’Pert PRO system equipped with a focusing mirror that acts also as a broad-band
monochromator for Mo Kα radiation ( = 0.71073 Å ) (Figure 2.8). Different optical
components can be used on the incident and diffracted beam, e.g. the divergence slit of
0.02 mm and additional shielding were applied to the optical path in order to achieve a
feature-free background. Data sets have been collected up to an 2 angle of 150 degrees
corresponding to a maximum scattering vector Q of ~17 Å -1.
Figure 2.8 The PANalytical X’Pert PRO powder diffractometer at CRM2.

21
Using this setup the data collection time is often quite long, typically more than 24
hours per sample. The optimization of the measurements strategy is therefore necessary
to improve the data quality especially at high Q values. Variable counting time (VCT)
strategies [17,23] can be applied to spend longer counting times at high scattering angles
where the intensity of the signal falls-off significantly due to atomic form factor. Figure
2.9 shows an example of the schematic redistribution of measurement times that we have
used in our experiments: 1s per step in the region 0-50 degrees, 5 s per step in the region
50-100 degrees and 9 s per step in the region 100-150 degrees.
Figure 2.9 Data collection strategy uses constant counting time (left)
and variable counting time (right) as a function of 2 theta.
We also used the synchrotron radiation for the PDF studies. The experiments were
carried out on the powder diffractometer of the Material Science beamline of the Swiss
Light Source (SLS) at the Paul Scherrer Institut (Villigen, Switzerland). Data were
collected using a monochromatic beam of wavelength = 0.4962 Å (E = 24.9866 keV).
The second generation microstrip detector Mythen II covering 120° with 0.0037°
resolution was mounted on Debye-Scherrer transmission set up as shown in Figure 2.10.
The used photon energy enables data to be recorded up to Qmax~25 Å -1 to provide the
necessary resolution in real-space for quantitative structural analysis to be attempted.
It is clear that PDF measurements using synchrotron radiation provide improved
angular resolution and higher intensities. Furthermore, synchrotron sources produce high
flux X-rays with tunable wavelengths, which is very helpful in the case of highly
absorbing samples and/or materials with large amount of fluorescence radiation when
irradiated with conventional laboratory sources. However, one should be aware that
problems may be encountered during synchrotron measurements such as position shifts
of the X-ray beam, a sometimes reduced beam stability and harmonic contamination.

22
Figure 2.10 The Debye-Scherrer transmission set up on MS-beamline (SLS), Paul
Scherrer Institut.
2.1.5 Data Reduction
In a real experiment, a number of corrections must be applied to the measured
intensity in order to obtain the coherent scattering intensity, Icoh(Q). In principle, the data
corrections are well known and established by number of approximations to obtain a
reliable normalized S(Q). If data reduction is not carried out properly nonphysical
features may appear in the G(r) function. Frequently, an expert eye is needed to minimize
errors in the S(Q) in order to ensure that one studies the physics of the system and not
experimental artefacts [24].
The experimental intensity of scattered X-rays or neutrons, IT, is actually composed
of several parts [13,25]:
(2.13)
Where A denotes the absorption correction, P the Polarization of the incident beam, IInc
the incoherent scattering intensity, IMS the multiple-scattering intensity, and IBG the
background intensity. The structural information is in the coherent scattering intensity,
Icoh(Q). Therefore, before we can use experimental data for analysis, we must correct the
IT(Q) by removing unwanted scattering.

23
The incoherent scattering occurs when there is no phase relationship between the
scattered waves, meaning that it does not contain structural information. Multiple
scattering occurs when X-rays are re-scattered within the sample [26]. Also, the sample
container (i.e. a capillary), can contribute to the multiple scattering. Background
scattering can be due to the sample container and the environment.
From equations 2.13, there are five main corrections we consider, these corrections
can be divided into two groups. The first group contains the additive corrections, such as
incoherent scattering, multiple scattering, and background scattering. The second group
comprises the multiplicative corrections such as absorption and polarization. There are
other corrections that can be applied, such as fluorescence, detector efficiency, etc., but
since the goal of this chapter is to be a survey, not a technical manual, they will not be
considered here.
There are several programs for processing the proper coherent scattering from raw
data, and Fourier transform to PDF: PDFgetX2 [27], PDFgetX3 [28], RAD [29], and
GudrunX [25] for X-rays and PDFgetN [30] for time of flight neutrons.
2.1.5.1 Multiplicative corrections
2.1.5.1.1 Absorption
The absorption correction is used to account for the X-rays that are absorbed by
the sample. To calculate the absorption correction, one needs to know the geometry of
the experiment, the energy of the x-rays, the mass absorption coefficient, μ(E) [31], of
the sample, the chemical composition, and its thickness.
Most of these necessary parameters for the absorption calculation are reasonably
easy to obtain. The energy of the X-rays used in an experiment should be known ahead
of time. The total mass absorption coefficient of a material is a linear addition of the
absorption coefficients of each element weighted by the ratio of the elements in the
compound. μ(E) of most elements has been tabulated as a function of X-ray energy by
Hubbell [32]. We usually express the mass absorption coefficient of each element divided
by its density, μ(E)/ρ. Fortunately, the densities of the elements have also been
tabulated [22]. We multiply the total mass absorption coefficient by the thickness of the
sample, t, to obtain the value μt, which is an important variable in the absorption
calculation.

24
Finally, the geometry of the experiment also has an effect on the absorption [13].
The capillary geometry has a complicated correction dependent on the diameter of the
capillary. The final absorption correction is tabulated by software using several
complicated equations and then applied to the experimental data [13].
2.1.5.1.2 Polarization correction
The Thompson scattering process polarizes the scattered x-ray beam [13,25] such
that the electric field vector lies in a direction perpendicular to the scattering plane. This
affects the measured intensities as a function of the scattering angle. Unlike the other
corrections which rely on complicated functions with tabulated values, the polarization
correction to account for this angle dependence can be expressed relatively easily as a
function of scattering angle and degree of polarization of the incident beam:
θ
(2.14)
Where A is a term that depends on the degree of polarization of the incident beam and
2θ is the scattering angle. A, not to be confused with the absorption correction, can take
on values between 0 and 1.0, where A = 0 means that the incident beam is unpolarized,
while A = 1.0 means that the incident beam is fully polarized.
Synchrotron radiation is theoretically fully plane polarized perpendicular to the
scattering plane, and therefore does not need to be corrected for polarization. However,
in reality, the beam is not completely polarized and some small corrections might be
necessary. On the other hand, Laboratory sources have an essentially unpolarized beam
when no monochromator is installed.
There are two special geometries that are worth mentioning [13]. In the first
geometry, a monochromator crystal is placed in the unpolarized incident beam (i.e.
placed in the beam before it hits the sample). In this case, A = cos2(2α), where 2α is the
scattering angle of the monochromator, in Equation 2.14. In the other geometry, the
monochromator crystal is placed in the diffracted beam (i.e. after the beam hits the
sample, this is also known as an analyzer). In this case, we use the equation:

25
θ
(2.15)
Instead of Equation 2.14.
2.1.5.1.3 Considering to Laboratory Source
Laboratory X-ray sources produce a general background Bremsstrahlung radiation
caused by the incident electrons being slowed down in the anode materials. This has a
characteristic spectrum whose maximum energy corresponds to electron bombardment
energy [25]. Furthermore, it is important to reduce or eliminate the unwanted effects,
such as usually place an absorbing foil or a monochromator to stop the Kβ radiation.

26
2.1.5.2 Additive corrections
2.1.5.2.1 Incoherent scattering
Incoherently scattering waves do not interfere when those are diffracted off the
sample, meaning that there is no phase relationship between the waves. Since structural
information in scattering comes from the interference effects of scattered waves,
incoherently scattered waves do not contain any structural information. As incoherent
scattering mainly consists of Compton scattering, we devote our discussion exclusively to
it. Compton scattering is an inelastic incoherent type of scattering that occurs when an
incident X-ray photon collides with an electron in the sample and transfers some of its
energy to the electron. Thus the scattered photon has a different energy than the incident
one.
We correct for Compton scattering by subtracting Compton intensities from the
data. These intensities have been calculated as a function of Q from tabulated data of the
Compton scattering cross section [33,34]. A proper correction for Compton scattering is
very important in high-energy total scattering analysis because the Compton signal can be
larger than the coherent scattering intensity at high Q values. This is due to the fact that
the elastic scattering cross section decreases while the Compton scattering cross section
increases. This also leads to a problem because, as we see in Figure 2.11, at high Q values
(~ 20 Å -1 in this case) subtracting the Compton scattering (green) from the experimental
scattering intensities (blue, mean-square atomic scattering factor, <f>2) will result in a
negative intensity. We solve this problem by applying a smooth attenuation function to
the Compton intensities as suggested by Ruland [35] (red in Figure 2.11) and then
subtracting the attenuated intensities from those that were collected experimentally.

27
Figure 2.11 Typical Compton correction profile. The blue line is the
mean-square scattering factor, 〈f〉2, the green line is the tabulated
Compton scattering intensity, and the red line is the Compton modified
by Ruland attenuation function [13].
2.1.5.2.2 Multiple scattering
Multiple scattering occurs when the primary beam is scattered twice or more by the
sample and container before reaching the detector. In our analysis, we consider only
double scattering because it represents the majority of the contribution of multiple
scattering to the data and higher orders are much more difficult to calculate. We also
assume that the double differential cross section is isotropic, which is not the case in
reality; however the assumption does simplify the math and has been found to work. We
further simplify the calculation by separating out the incoherent scattering (i.e. Compton
scattering), as done in equation (2.11) so that only completely elastic multiple scattering
events need to be considered for this correction. The multiple scattering correction
depend on sample thickness, transparency, absorption, experiment geometry, and a
complicated function that is dependent on Q, sample absorption, thickness, density, and
other parameters. Fortunately, values of this function have been tabulated [36] so that
they could be used in computer assisted calculations. Multiple scattering contributions
increase with sample thickness and with higher energy X-rays and therefore the

28
correction is important in PDF experiments where X-ray energies are generally high and
the data in the high-Q region contain important information. Finally, multiple scattering
is far larger in transmission geometry than reflection geometry.
2.1.5.2.3 Background Subtraction
Background scattering intensities is scattering that is not due to the sample. For
instance, the sample container (e.g. a capillary) contributes to the background scattering,
as does air, and the instrument itself can have a background signal. We want to minimize
the contribution of background scattering intensities to the total intensity. This can be
done in two ways, first by optimizing the experimental set-up and second by subtracting
the background. We optimize the experiment by, for example, using a poorly diffracting
sample container (i.e. a Kapton capillary rather than glass) and collecting a dark current
on the detector between measurements. To properly subtract the background, we collect
three data sets [13]: (1) the sample and container together; (2) an empty container; and (3)
the air. The scattering of the container and the air are then subtracted from the total
measurement.
2.2 Solid state NMR spectroscopy
The main interactions that dominate the NMR lineshape in the solid state include
the nuclear dipolar interaction, giving information on the distance between magnetic
nuclei, chemical shielding, giving information on the electronic structure, and the
quadrupolar interaction, which is determined by the interaction of the nuclear electric
quadrupole with the electric field gradient at the nucleus [37].
All experiments were carried out on a high-field Bruker NMR Avance III
spectrometer operating at 14T (1H NMR frequency of 600 MHz), installed in CRM2. 29Si
MAS experiments were carried out on a Bruker 4 mm MAS triple-resonance probe. 13C
MAS experiments were carried out on a Bruker 4 mm MAS triple-resonance probe. The
MAS spinning speed was set to 12.5 kHz. 23Na MAS experiments were carried out on a
Bruker 2.5 mm MAS double-resonance probe. 1H MAS experiments were carried out on
a Bruker 2.5 mm MAS double-resonance probe.
2.3 UV-vis and Infrared Spectroscopy
UV/Vis and Infrared absorption spectroscopy allow the identification of electronic
transitions and molecular vibrations in the studied samples. In the context of this thesis
the methods are used as a first quick characterization tool of the hybrid materials and to

29
verify that the embedded photoswitchable molecules still exhibit their interesting optical
properties. UV-Vis absorption spectra were recorded using a Cary 4000
spectrophotometer with a transmission setup.
Infrared spectra have been collected with a Nicolet 5700 FTIR-spectrometer and a
resolution of 2 cm-1. Fine powder of our samples were mixed with KBr and pressed to
pellets. The pellet was fixed on a copper coldfinger with silver conductive paste to
provide a uniform cooling of the sample. The cooling down to 80 K was carried out with
liquid nitrogen at a pressure of 10-6 mbar. KBr windows allowed the measurement in the
spectral range of 4000-400 cm-1 and the irradiation of the sample with laser light of
different wavelengths. The population of the metastable state can be determined by the
decrease of the band area of υ(NO)-vibration of the GS.
2.4 Photoluminescence
Photoluminescence (PL) describes light-emitting phenomenon from a material
under optical excitation. When the studied material is excited with light of sufficient
energy, photons are absorbed and electronic excitations are created. Eventually, the
electrons return to the ground state: if this relaxation is radiative, the emitted light is the
photoluminescence signal. The intensity of this signal gives a measure of the relative rates
of radiative and non-radiative recombinations. Therefore, the PL spectroscopy is a
suitable tool for quantitative characterization of luminescent materials. A noticeable
advantage of PL analysis is that it is a simple, versatile, and non-destructive technique
and one can derive much information on the emitting material from the analysis of the
PL signal.
Since the PL properties are dependent on the concentration of the respective
chemical species or on the variation of the physical and chemical properties of the
material, we used the PL technique to investigate the size reduction effect on the
spectroscopic properties of the neodymium complex, [NdCl2(H2O)6]Cl, embedded in
silica matrix with different pores size. Combining the results of such experiments with
the derived structural parameters are of high interest for gaining better insight into the
structure-property relationship.
The PL measurements were performed in collaboration with the Nanomaterial team
of the P2M department (Institut Jean Lamour, Université de Lorraine). The PL spectra were
obtained using a He–Cd laser (=325 nm) and a photomultiplier operating in the range
800–1500 nm.

30
2.5 Adsorption
Brunauer-Emmett-Teller (BET) measurement aims to explain the physical
adsorption of gas molecules on a solid surface and serves as the basis for an important
analysis technique for the specific surface of loaded and unloaded SiO2 xerogel matrix.
The N2 adsorption isotherms of milled samples were taken on laboratory PhLAM
(Université Lille). Specific surfaces were determined using multi-point BET analysis in
the P/P0 range of 0.05–0.2. The total pore volume was examined using P/P0 of 0.9 and
the micro-pore volume was calculated using P/P0 of 0.2 considering only pores with a
radius smaller than 1 nm. Pore size distributions were calculated using the adsorption
branch with the Barret–Joyner– Halenda (BJH) theory. Fractal analysis of the adsorption
isotherms were applied using the Frenkel–Halsey–Hill (FHH) model [38]. The surface
fractal dimension is accessible through a regression of the linear range in a ln(N/Nm)
versus ln[ln(P/P0)] plot, where N is the number of moles of nitrogen adsorbed at a
certain P/P0 and Nm is the number of moles of nitrogen in a monolayer Nitrogen
adsorption isotherms were obtained.

31
Bibliography
[1] S. J. L. Billinge, Physics 3, 25 (2010). [2] S. J. L. Billinge and I. Levin, Science 316, 561 (2007). [3] R. B. Neder and V. I. Korsunskiy, J. Phys. Condens. Matter 17, S125 (2005). [4] S. J. L. Billinge, J. Solid State Chem. 181, 1695 (2008). [5] C. A. Young and A. L. Goodwin, J. Mater. Chem. 21, 6464 (2011). [6] L. Malavasi, Dalton Trans. 40, 3777 (2011). [7] J. M. Thomas, Nature 491, 186 (2012). [8] T. R. Welberry, Diffuse X-Ray Scattering and Models of Disorder (OUP Oxford,
2010). [9] C. Giacovazzo, H. L. Monaco, G. Artioli, D. Viterbo, M. Milanesio, G. Gilli, P.
Gilli, G. Zanotti, and G. Ferraris, Fundamentals of Crystallography, 3rd ed. (Oxford University Press, USA, 2011).
[10] V. Pecharsky and P. Zavalij, Fundamentals of Powder Diffraction and Structural Characterization of Materials (Springer, 2005).
[11] A. Guinier, X-Ray Diffraction: In Crystals, Imperfect Crystals, and Amorphous Bodies, New edition (Dover Publications Inc., 1994).
[12] B. E. Warren, X-Ray Diffraction, New edition (Dover Publications Inc., 1991). [13] T. Egami and S. J. L. Billinge, Underneath the Bragg Peaks: Structural
Analysis of Complex Materials, 2nd ed. (Pergamon, 2012). [14] P. Debye, Ann. Phys. 351, 809 (1915). [15] D. A. Keen, J. Appl. Crystallogr. 34, 172 (2001). [16] H. E. Fischer, A. C. Barnes, and P. S. Salmon, Reports Prog. Phys. 69, 233
(2006). [17] E. Lorch, J. Phys. C Solid State Phys. 2, 229 (1969). [18] A. K. Soper and E. R. Barney, J. Appl. Crystallogr. 45, 1314 (2012). [19] P. G. Bruce, Powder Diffraction: Theory and Practice, 1st ed. (Royal Society
of Chemistry, 2008). [20] R. Guinebretière, Diffraction Des Rayons X Sur Échantillons Polycristallins :
Instrumentation et Étude de La Microstructure, 2e édition revue et augmentée (Hermes Science Publications, 2006).
[21] X. Qiu, E. S. Božin, P. Juhas, T. Proffen, and S. J. L. Billinge, J. Appl. Crystallogr. 37, 110 (2004).

32
[22] H. P. Klug and L. E. Alexander, X-ray Diffraction Procedures for Polycrystalline and Amorphous Materials (Wiley, New York, 1974).
[23] J. te Nijenhuis, M. Gateshki, and M. J. Fransen, Z. Für Krist. Suppl. 2009, 163 (2009).
[24] P. F. Peterson, E. S. Božin, T. Proffen, and S. J. L. Billinge, J. Appl. Crystallogr. 36, 53 (2003).
[25] A. K. Soper and E. R. Barney, J. Appl. Crystallogr. 44, 714 (2011). [26] B. E. Warren and R. L. Mozzi, Acta Crystallogr. 21, 459 (1966). [27] X. Qiu, J. W. Thompson, and S. J. L. Billinge, J. Appl. Crystallogr. 37, 678
(2004). [28] P. Juhás, T. Davis, C. L. Farrow, and S. J. L. Billinge, J. Appl. Crystallogr. 46,
560 (2013). [29] V. Petkov, J. Appl. Crystallogr. 22, 387 (1989). [30] P. F. Peterson, M. Gutmann, T. Proffen, and S. J. L. Billinge, J. Appl.
Crystallogr. 33, 1192 (2000). [31] C. T. Chantler, J. Phys. Chem. Ref. Data 24, 71 (1995). [32] N. US Department of Commerce, (n.d.). [33] D. T. Cromer and J. B. Mann, J. Chem. Phys. 47, 1892 (1967). [34] H. H. M. Balyuzi, Acta Crystallogr. A 31, 600 (1975). [35] W. Ruland, Br. J. Appl. Phys. 15, 1301 (1964). [36] C. W. Dwiggins and D. A. Park, Acta Crystallogr. Sect. 27, 264 (1971). [37] J. A. Ripmeester and C. I. Ratcliffe, in Mod. Magn. Reson., edited by G. A.
Webb (Springer Netherlands, 2006), pp. 147–154. [38] D. Avnir and M. Jaroniec, Langmuir 5, 1431 (1989).

Chapter 3
Structural Modeling
3.1 The Debye Function analysis (DFA)……………………………………………..33
3.2 Pair distribution function (PDF)…………………………………………………36
3.2.1 Calculating PDF from a model………………………………………...36
3.2.2 Consider finite Q-range………………………………………………..37
3.2.3 Thermal motion……………………………………………………….37
3.2.4 Instrumental resolution……………………………………………….39
3.2.5 PDF of nanoparticles…………………………………………………41
3.2.6 Related functions……………….……………………………………..43
3.3 The reverse Monte Carlo Method………………………………………………..44


33
Chapter 3
Structural Modelling
The detailed structural characterization of materials is a prerequisite to the
understanding of their physical properties. In chapter 2 we outlined how to obtain the
coherent scattering intensity Icoh and the corresponding experimental PDF, G(r), from
total scattering data. Here we describe the two different approaches that we used to
model the total scattering data: (i) the Debye Function Analysis (DFA) which is based on
the Debye formula (Eq. 2.3) and is done in reciprocal space by direct modelling of the
measured Icoh, (ii) the analysis of the atomic pair distribution function in real space which
models the experimental PDF G(r) that is obtained by the Fourier transform of the total
scattering data (Eq. 2.11). Furthermore, a short description of the Reverse Monte Carlo
(RMC) approach is given, since it has been applied to obtain a structural model for the
SiO2 gel.
3.1 Debye Function Analysis (DFA)
A rather robust and intuitive method that allows the calculation of the coherent
scattering intensity as a continuous function of Q is based on the Debye equation [1]. It
describes the scattered intensity from orientationally isotropic systems (e.g. gas, liquid, or
powders):

34
(3.1)
Where fi and fj are the atomic form factors (or neutron scattering lengths, b), rij the length
of the interatomic distances between atoms i and j. The scattering power is dependent on
Q for X-rays and independent of Q for neutrons, whereas the contribution from thermal
vibrations is strongly dependent on Q in both cases.
Since the formula (3.1) takes into account all atoms present in the sample, it quickly
becomes very time consuming to calculate the contributions of all atom pairs (the
number of terms in the sum in Eq. 3.1 increases with the square of the number of atoms).
However, in the past 20 years, the Debye function analysis (DFA) has been reviewed and
turned into an efficient tool for characterizing nanocrystalline materials via powder
diffraction data [2,3]. Several new approaches have been implemented using faster
algorithms for the calculation by Hall [4], Cervellino [5], and Proffen & Neder [6]. The
DFA has thus become a reliable tool to study larger systems, and was successfully applied
to study both the size and shape of nanoparticles [7,8] as well as to identify embedded
species within guest-host systems from neutron [9] and X-ray powder total scattering
measurements [10,11].
Figure 3.1 illustrates the effect of the different size and shape of SNP nanoparticles
on the coherent scattering intensity calculated using the Debye formula:

35
Figure 3.1 Calculations of the Debye equation for different size and
shape of SNP nanoparticles.
For judging the quality of fit we used the weighted R-value:
(3.2)
Where wj is the weighting, Iobs,j and Icalc,j are observed and calculated intensities,
respectively, for each point of j of the diffraction pattern.
A big advantage of the DFA is that it does not rely on high-Q data. In principle it is
thus possible to perform a total scattering analysis using a limited Q-range which renders
this approach very interesting for laboratory diffractometers or neutron powder
diffractometers at thermal or cold sources [5]. However, one has to be aware of this
limitation in Q-space resolution and in general one needs to have already a reasonable
idea of the structure of the compound one is studying. For the molecular compounds
embedded in porous hosts, that we are interested in, a few general considerations have

36
been proven useful, as explained on the following example. Depending on the average
size of the isolated atomic cluster of the embedded substance, an experimental Q-range
can be determined. For small clusters of one or two SNP molecules with a diameter of
about 10-15 Å (1 -1.5 nm), it is best to choose Qmin ~ 2/D and Qmax ~ 2/d, where D
is the cluster diameter and d the nearest-neighbour atomic distance. For SNP, Qmin ~ 0.5
and Qmax ~ 6 Å -1. However, the range Q<Qmin contains also valuable information on the
substrate pore size, while it can be convenient to restrict Qmax in order to neglect the
substrate-guest chemical bonds. So Qmin ~ 0.1 and Qmax ~ 3 Å -1 is - in this case - a valid
choice [9].
3.2 Pair Distribution Function
3.2.1 Calculating PDF from a model
The PDF diagram contains the weighted bond-length distribution of every pair of
atoms within a given material. It can be calculated from a three dimensional structural
model by adding up all the weighted atom-atom distances [12] according to:
(3.3)
Here fi,, fj, are the scattering power of atoms i and j respectively, 〈f〉 is the average
scattering power of all atoms in the model, and ρ0 is the average number density. For
X-rays the scattering power is the Q-dependent atomic form factor f(Q) and for neutron
it is the coherent neutron scattering length b. From equation 3.3 follows that δ functions
are generated at every position r corresponding to an interatomic interaction in the
structural model. Thus, the PDF, G(r), is directly related to structure of a material. It
should be noted that the details and accuracy of the structural information that can be
obtained from the PDF analysis depend essentially on the quality of the collected data.
The main difference between the PDF method and conventional average structure
analysis of powder diffraction data is how to treat the diffuse scattering intensities
in-between and underneath the Bragg peaks. We will discuss in the following, the
different relevant parameters that have to be taken into consideration to properly extract
the structural information from the PDF analysis.

37
3.2.2 Consider finite Q-range
As we have seen in the previous chapter, the observed PDF is obtained by Fourier
transforming the measured coherent diffraction intensity over all Q space. However, the
accessible range in Q is in practice limited to a finite value of Qmax. This truncation of
data can be accounted for by multiplication of the structure factor (which extends up to
infinity) with a step function cutting off at Qmax resulting in the convolution of the PDF
with the Fourier transform S(r) of the step function. We calculate thus the model for a
finite Q-range by convoluting the Gcalc(r) function (Equation 3.3) with S(r):
(3.4)
3.2.3 Thermal Motion
The experimental PDF peaks have a certain peak width as a result of displacement
of atoms from their average position. This peak broadening can be handled by using a
method based on the convolution of the function δ(r-rij) in equation 3.3 with a Gaussian,
Tij(Q):
(3.5)
The first term in Tij(r) is a simple Gaussian, which is multiplied by a modification
function taking into account anisotropic averaging [12]. The width of the function Tij(r) is
given by the parameter σij(r) that represents the deviation of atoms i and j from their
average position and thus is correlated to atomic displacement parameters B.
Furthermore the σij(r) shows an r-dependence to account for correlated motion [13,14].
The peaks at small r in experimental PDFs are sharper because of correlated motion of
atoms; therefore the r dependence of peak widths is modeled by using equation:

38
(3.6)
Here σ’ij is the peak width given by the atomic displacement parameters [15], δ and γ
determine the sharpening of near neighbor PDF peaks due to correlated motion, in other
words the tendency to move in phase [13,14]. It is noteworthy that the term (δ/rij2) is
used to describe the low temperature case and the term (γ/rij) describes the high
temperature behaviour. Note also that these two parameters are highly correlated,
therefore in practice only one is refined.
Finally the parameter α (or so called Qbroad in the software PDFgui [16]) determines
the PDF peak broadening at high distances r due to the instrument resolution. Another
method to sharpen the first peaks in the PDF is to define a certain cutoff value in r (rcut)
and to use a factor (srat) to sharpen the PDF peaks below that defined value. Given that
these parameters are used to describe the intramolecular interactions, the values of the
(rcut) parameter correspond generally to the diameter of the studied molecule.
Fig 3.2 illustrates the simulated PDF of SNP crystalline with different effects which
are described above. First, the PDFs were calculated according to Equ. 3.3 thus distribute
as a series of sharp δ(r) functions. Secondly, an experimental finite Q range is considered
by convoluting the δ(r) distribution with a step function, S(r) (Equ 3.4), and results in
spurious ripples which come from the Fourier transform. Finally, thermal motions (Equ
3.5) are taken into account and lead to broaden the peak width in PDFs.
The methods described above are standard procedures of simulation from a model.
However, when dealing with different systems, e.g. molecular compounds, modeling of
displacements from the average position and correlated motion is more complicated [17].
There are a variety of interactions with very different properties and depend on the
materials studied. These interactions include, for example, covalent bonds, electrostatic
or ionic interactions (e.g. hydrogen bonds), and van der Waals interactions. Further, in
the case of nanoparticles, the PDFs will describe the effect of shape and sizes which we
will discuss later.

39
Figure 3.2 Calculating PDF of crystalline SNP according to: (a) equation 3.3
with simple δ(r) function, (b) Convolute a finite value Qmax=30 Å -1 from
equation 3.4, (c) peak broadening caused by thermal motion, convolute δ(r)
by Tij(r) in equation 3.5.
3.2.4 Instrumental resolution
The limited resolution of the experiment in Q-space leads to decrease of the
amplitude of the PDF peak with increasing r. This can be modeled by a Gaussian
damping envelop according to the relation [18] :

40
(3.7)
Where σQ is also called Qdamp value in pdfGUI software [16]. This parameter is
characteristic for every experimental setup and can thus be determined experimentally
using a reference substance. As an example, standard Silicon powder (NIST SRM 640d, a
= 5.43123 Å ) was collected to obtain σQ in this thesis, as illustrated in Figure 3.3. The
value of ~0.017 Å -1 was obtained for the transmission setup on the PANalytical powder
diffractometer (Qmax ~17 Å -1), and a value of ~0.0072 Å -1 for the setup used at SLS-MS
beamline (Qmax ~25 Å -1).
In general, structural studies on nanocrystalline or amorphous materials do not
require experimental set-ups with very high reciprocal space resolution. However, care
should be taken if we want to refine crystalline materials.

41
Figure 3.3 (a) Experimental powder patterns for Si standard collected at
SLS-MS beamline (solid red line) and in-house PANalytical powder
diffractometer at CRM2 (black symbols). The corresponding PDFs are
shown in (b), while different Q-space resolution results in differential
dampening values in PDFs.
3.2.5 PDF of nanoparticles
For a crystal, periodic boundary conditions can be applied to calculate the PDF out
to long interatomic distances and the baseline corresponds to a line given by the average
number density -4πρ0r as in equation 3.3. However, no interatomic distances exist

42
beyond the diameter of a finite nanoparticle, and the average number of interatomic
distances does not increase linearly with r, but forms a polynominal bell shaped function
that is zero beyond the nanoparticle diameter [12]. The exact form of this function
depends on the particle shape, as has been shown, e.g. for spheres [19,20], rods and
tubes [19], or more complicate core-shell particles [21]. In order to take into account the
shape of the nanoparticles, the PDF is multiplied by a shape function, according to
equation 3.7:
(3.8)
Where fe(r,d) is the shape function, and d is the diameter of nanoparticles. Figure 3.4
shows as an example the simulated PDF for spherical 3nm nanoparticles of SNP and its
corresponding shape function.
Figure 3.4 Simulated PDF for spherical 3nm nanoparticles of SNP. Two lines are
scaled up for comparison: a decreasing line -4πρ0r represents the average number of
density of SNP, and its corresponding spherical shape function fe(r,d).

43
3.2.6 Related functions
Finally, we describe the radial distribution function (RDF), R(r) given by:
(3.9)
Which is related to G(r) by:
(3.10)
The R(r) function is important because it is closely related to the physical structure since
R(r)dr gives the number of atoms in a spherical shell of thickness dr at distance r from
another atom. For example, the coordination number, Nc, is given by:
(3.11)
Where r1 and r2 define the beginning and ending positions of the RDF peaks, and dr is
corresponding to the coordination shell in the equation.
It should be noted that for a material comprising m atomic species, a single
diffraction experiment yields a total G(r), which is the weighted sum of m(m+1)/2 partial
PDFs [22]. We can define a partial pair distribution function, Gαβ(r), that is equivalent to
G(r) but gives the distribution of atom pairs in the material only coming from atoms of
type β around atoms of type α. The total PDF is the weighted sum of all the partial
PDFs:
(3.12)
The wij are the weighting factors which depend on the concentration and scattering
power of the atomic species.

44
3.3 Reverse Monte Carlo (RMC) method
The Reverse Monte Carlo (RMC) method was first developed by McGreevy and
Pusztai (1988) [23] as an approach for building atomic models based on diffraction data
rather than interatomic potentials. It was primarily designed for the study of liquids and
amorphous materials because of lack of other routes to obtain structural information in
such cases. Recently it has become a powerful tool for modelling disorder in crystalline
systems as well [24].
In this thesis, the host structure of the SiO2 gel has been simulated by the RMC
approach using the EPSR code [25] without applying any empirical potential scheme.
3.3.1 Description of the method
In the general approach, a starting configuration of atoms is produced with periodic
boundaries, using either a random arrangement of atoms or the crystal structure. This
starting configuration must have the correct density and contain the correct ratio of
atoms, e.g. 1:2 for SiO2. The RMC simulation then proceeds by moving an atom selected
at random within certain constraints. Standard Monte Carlo procedures [26] are used to
test whether to accept or reject the move, through calculation of a change in an
appropriate “energy” function. In the general approach, the energy function can be
associated with the following residuals:
(3.13)
Where the sum is over all n experimental data points, and σ is a weight variable that may
be taken to be the error of the particular point. If χ2 following the proposed move is
lower than the one determined with the atom in the previous position, χnew2<χold
2, the
move is accepted. Any move that increases χ2 is by the amount Δχ2 is accepted only with
probability exp(-Δχ2/2). This sequence is continued until convergence is reached when
the atomic configuration is said to describe the data satisfactorily and to be a valid three
dimensional representation of the structure (see Figure 3.5).

45
Figure 3.5 Schematic diagram of RMC algorithm [12].
The definition of χ2 may be generalised to incorporate extra data sets, e.g. joint x-ray
and neutron total structure factor, EXAFS measurement, etc. [27] to improve reality of
refinement. In this thesis, we generate a three dimensional amorphous silica
configuration via this method.

46

47
Bibliography
[1] P. Debye, Ann. Phys. 351, 809 (1915).
[2] N. Pinna, in Scatt. Methods Prop. Polym. Mater. (Springer Berlin Heidelberg, 2005), pp.
29–32.
[3] A. Guagliardi, N. Masciocchi, Associazione italiana di cristallografia, Schweizerische
Gesellschaft für Kristallographie, and Paul Scherrer Institut, in (Insurbia University
Press, 2010).
[4] B. D. Hall, J. Appl. Phys. 87, 1666 (2000).
[5] A. Cervellino, C. Giannini, A. Guagliardi, and M. Ladisa, Phys. Rev. B 72, 035412
(2005).
[6] T. Proffen and R. B. Neder, J. Appl. Crystallogr. 32, 838 (1999).
[7] G. Cernuto, N. Masciocchi, A. Cervellino, G. M. Colonna, and A. Guagliardi, J. Am.
Chem. Soc. 133, 3114 (2011).
[8] F. Niederdraenk, K. Seufert, A. Stahl, R. S. Bhalerao-Panajkar, S. Marathe, S. K.
Kulkarni, R. B. Neder, and C. Kumpf, Phys. Chem. Chem. Phys. 13, 498 (2010).
[9] A. Cervellino, J. Schefer, L. Keller, T. Woike, and D. Schaniel, J. Appl. Crystallogr.
43, 1040 (2010).
[10] D. a. H. Cunningham, W. Vogel, R. M. Torres Sanchez, K. Tanaka, and M. Haruta,
J. Catal. 183, 24 (n.d.).
[11] W. Vogel, D. a. H. Cunningham, K. Tanaka, and M. Haruta, Catal. Lett. 40, 175
(1996).
[12] R. B. Neder and T. Proffen, Diffuse Scattering and Defect Structure Simulations (Oxford
University Press, 2008).
[13] I.-K. Jeong, R. H. Heffner, M. J. Graf, and S. J. L. Billinge, Phys. Rev. B 67, 104301
(2003).
[14] I.-K. Jeong, T. Proffen, F. Mohiuddin-Jacobs, and S. J. L. Billinge, J. Phys. Chem. A
103, 921 (1999).
[15] T. Proffen and S. J. L. Billinge, J. Appl. Crystallogr. 32, 572 (1999).
[16] C. L. Farrow, P. Juhas, J. W. Liu, D. Bryndin, E. S. Božin, J. Bloch, T. Proffen, and
S. J. L. Billinge, J. Phys. Condens. Matter 19, 335219 (2007).
[17] N. Rademacher, L. L. Daemen, E. L. Chronister, and T. Proffen, J. Appl.
Crystallogr. 45, 482 (2012).
[18] B. H. Toby and T. Egami, Acta Crystallogr. A 48, 336 (1992).

48
[19] R. C. Howell, T. Proffen, and S. D. Conradson, Phys. Rev. B 73, 094107 (2006).
[20] K. Kodama, S. Iikubo, T. Taguchi, and S. Shamoto, Acta Crystallogr. A 62, 444
(2006).
[21] V. Iorsunskiy, R. B. Neder, A. Hofmann, S. Dembski, C. Graf, and E. Rühl, J. Appl.
Crystallogr. 40, 975 (2007).
[22] T. E. Faber and J. M. Ziman, Philos. Mag. 11, 153 (1965).
[23] R. L. McGreevy and L. Pusztai, Mol. Simul. 1, 359 (1988).
[24] M. G. Tucker, M. T. Dove, and D. A. Keen, J. Appl. Crystallogr. 34, 630 (2001).
[25] A. K. SOPER, Mol. Phys. 99, 1503 (2001).
[26] K. Binder and D. W. Heermann, Monte Carlo Simulation in Statical Physics: An
Introduction (Springer, Berlin, 2012).
[27] D. T. Bowron, Mater. Sci. Eng. B 149, 166 (2008).

Chapter 4 Synthesis and multiscale structural analysis of photoswitchable molecular hybrid materials 4.1 Sample preparation………………………………………………………………51
4.1.1 Post-doping….……………………………………………………..….51
4.1.2 Pre-doping…………………………………………………………….52
4.2 Average crystal structure of the bulk material Na2[Fe(CN)5NO]. 2H2O.…….…....53
4.3 Evidence of photoswitchable properties…………………………………………56
4.4 The PDF and d-PDF experiments for the bulk and SNP@1nm SiO2 monolith…61
4.4.1 PDFs of bulk SNP……………………………………………………61
4.4.2 PDFs of amorphous SiO2 matrix……………………………………..68
4.4.3 Fingerprint of SNP@SiO2 hybrids……………………………………74
4.5 The Solid State NMR….…………………………………………………………79
4.5.1 Structure of amorphous SiO2 host……………………………………80
4.5.2 Structure and dynamics of the SNP guest……………………………..81
4.5.3 Hydration of the nanocomposite SNP@SiO2 xerogel………………...85
4.6 Multiscale structural analysis of SNP@SiO2 (1nm, 5nm, 11nm): the structural aspect-pore size and organisation relationship…………………………………...86
4.6.1 Problems of SNP crystallized on monolith surface……………………86
4.6.2 SNP@SiO2 (5nm) ……………………………………………………90
4.6.3 Pre-doping SNP@SiO2 nanocomposites……………………………...96
4.7 Conclusion..……………………………………………………………………..99
Annex……………………………………………………………………..…………101


49
Chapter 4
Synthesis and multiscale structural
analysis of photoswitchable molecular
hybrid materials
The inclusion of photoswitchable mononitrosyl complexes [ML5NO]x (M = metal,
L=ligand) into silica matrices is of interest in view of the exploitation of their optical
properties for applications such as holography, data storage or medical application [1–4].
In this class of compounds the nitrosyl ligand can undergo photoinduced linkage
isomerisation [5,6] resulting in changes of the color and the refractive index of the
compounds. Since the linkage isomerism is a molecular property these complexes are
suitable candidates for embedding them into host materials such as silica gels [7] and
metal-organic frameworks [8] or electrostatic attachment on surfaces [9].
The study of the prototype complex Na2[Fe(CN)5NO]·2H2O (Sodium
Nitroprusside, SNP) embedded in silica matrices showed that the properties of the
metastable linkage isomers [10,11] are independent of the particle size [12]. Furthermore
this study indicated that at low doping levels the SNP guest might be included as isolated
molecules in the mesopores SiO2 host (see paragraph 4.6.3). This finding is in agreement
with the results of a neutron diffraction study on a (CN3H6)2[Fe(CN)5NO] complex

50
embedded in a silica host [13], which allowed for the identification of the structural
fingerprint of isolated molecules in the porous network. In this case however the
properties of the linkage isomerisation change insofar as that the achievable population is
increased in the gel matrix compared to the crystalline material. In order to be able to
derive a structure-functionality relationship and to proceed to a more targeted design of
such hybrid complexes, a detailed description of the structural organisation of the guest
species and of their immediate surrounding (i.e. silica wall, solvent and counter-ions) is
thus absolutely mandatory.
In the following we will present the results of total scattering experiments
performed on SNP@SiO2 and discuss in detail the structural information that can be
obtained for such molecular hybrid materials from PDF analysis.

51
4.1 Sample Preparation
The synthesis of the molecular hybrid materials is realized by the sol-gel
procedure [14]. The advantages of the sol-gel technique are the low temperature
processing, which allows an embedding of molecular species, as well as the high
variability of compositions.
Two main strategies have been developed herein for the incorporation of the SNP
complexes into the silica matrix, namely, post-doping and pre-doping. The former procedure
is the so-called wet impregnation, where a solidified SiO2 monolith is impregnated by
immersing it into an aqueous solution of guest species. In the latter procedure the
molecular species are added in the form of an aqueous solution to the silica sol before
hydrolysis. The mixture then hydrolyses to form a gel and is subsequently dried.
4.1.1 Post-doping
4.1.1.1 Empty SiO2 host
The empty (Pure) silica xerogel host can be synthesized with any shape and size;
herein we prepared SiO2 monoliths which exhibit pore sizes of ca. 1 nm, 5 nm and 11
nm, which are characterized by BET measurement (see Annex. 2). Small pore sizes in the
range of 1~3 nm are suited for the inclusion of isolated molecules, while pores with sizes
5 and 11 nm allow in situ growing of nano-particles in the matrices.
(a) Pore sizes of 1~3 nm:
The SiO2 xerogel of pore sizes ca. 1~3 nm was obtained by the following
procedure: 1.5 ml of tetramethoxysilane (TMOS, 98% purity, Fluka), 1.8 ml of methanol
(VWR) and 3.6 ml of distilled water were mixed and stirred at room temperature for
about 5 minutes which allowed the solution to gel. The mixture was then placed in a
glass tube at 50 °C for 3 weeks in an oven to dry and solidify the obtained gel. Finally the
dried gels were put in desiccators at 10-2 mbar in order to remove the residual solvent.
Cylindrical transparent rods with a diameter of about 1.0 mm were obtained (see Fig 4.1
(a)) as final product.
(b) Pore sizes of 5 nm and 11 nm:
The porous SiO2 matrices with pore sizes of ca. 5 nm and 11 nm were synthesized
and provided by the PhLAM laboratory (Universié de Lille 1). These xerogels, having
good optical transparency and mechanical strength, were obtained by hydrolysis and
polycondensation of TMOS, followed by a drying step and annealing in air at 850°. This

52
sol–gel process yields a large range of mesoporous xerogels with well controlled pore
sizes [15].
4.1.1.2 Wet impregnation
The SNP@SiO2 hybrids were prepared by impregnating the empty porous SiO2
monoliths with an aqueous solution of SNP salt (concentration, c = 3.507 mol/L). The
SiO2 matrices were slowly immersed into the SNP solution in order to prevent cracking
of the monoliths. The monoliths, initially colourless, then became progressively more
and more brown-orange indicating the diffusion of the SNP complexes into the silica
pore network. After about 24 hours the monoliths displayed homogeneous colouring and
were kept at 50 °C for 7 days in an oven. A final drying step was performed at room
temperature in desiccators coupled with a primary pump (ca. 10-2 mbar) for about 3 days
in order to remove the remaining solvent.
The pre-formed empty SiO2 monoliths with pore sizes of about 1 nm, 5 nm and 11
nm were prepared by this procedure, leading to the confined precipitation of
nanoparticles within the matrix. The obtained empty SiO2 monoliths and SNP@SiO2
(1nm pores) samples are shown in Fig. 4.1.
Figure 4.1 Photographs of the synthesized mesoporous silica monoliths: (a)
empty SiO2 monolith and (b) SNP@SiO2 nanocomposites.
4.1.2 Pre-doping
1.5 ml of TMOS, 1.8 ml of methanol (VWR) and 3.6 ml of distilled water and
different amounts of 0.2517 (mol/L) aqueous SNP solutions were mixed and stirred for

53
about 30 minutes. The total amount of water was kept constant at 3.6 ml. By varying the
amount of added SNP solution the concentration of SNP was varied between 12.5 and
625 μmol per gel. After 30 minutes the gels in the glass flasks were covered by parafilm
and put into an oven for 1 week at 50 °C in order to allow for complete gelation. Then
small holes were pierced into the parafilm in order to allow for a complete evaporation
of remaining solvents in about 1 week. Then the parafilm was completely removed and
the gel dried for 1 week in an oven at 50 °C. Finally the dried gels were put in desiccators
at ca. 10-2 mbar in order to remove remaining residual solvent.
4.2 Average crystal structure of the bulk material (Na2[Fe(CN)5NO]·2H2O
The crystal structure of the Sodium Nitroprusside dihydrate complex
(Na2[Fe(CN)5NO].2H2O, SNP), has been previously determined from both X-ray and
neutron diffraction measurements [16–18]. In order to use the average structural model
of this complex in our PDF analysis we have reinvestigated the average crystal structure
of SNP from accurate room temperature single crystal X-ray diffraction measurements.
More details on the single crystal measurement and structural refinement are given in
Annex 1. The asymmetric unit of SNP is shown in Fig 4.2.a and selected structural
parameters are given in Table 4.1. The compound crystallizes in the orthorhombic space
group Pnnm with cell parameters a=6.2051(4) Å , b= 11.9098(6) Å , c=15.5605(9) Å and
V=1149.94(1) Å 3. The molecular structure is characterized by distorted octahedral
geometry around the iron atom, where the metal center is hexacoordinated by five CN
groups and one NO ligand (Fig 4.2.a). The distortion from a perfect octahedral
configuration is essentially due to the presence of the NO group and as a consequence
the four cis CN ligands (related by the pseudo-fourfold axis) are bent down away from
the N-O group toward the trans CN ligand. This is also marked by the displacement of
the Fe atom (0.184(1) Å ) out of the plane of the cis C atoms towards NO group. It is
worth noting that the cis Fe—C bond lengths (Fe—C2=1.936(1) Å and Fe—C3
=1.943(1) Å ) are slightly longer than the trans Fe—C (Fe—C1= 1.928(1) Å ). One also
notes that the Fe-N4-O4 fragment of the ion is more deviated from linearity compared
to the Fe-Ci-Ni portions (i=1, 2 or 3) (Table 4.1.).

54
Figure 4.2 (a) A projection of SNP complex, showing the atom-labelling scheme and
coordination geometry of Na atoms. Displacement ellipsoids are drawn at the 50%
probability level for all non-H atoms. (b) The N—O…O—N anion-anion interactions
Table4.1. Selected structural parameters for SNP complex.
Bond length (Å )
Fe—C1: 1.928(1) Fe—C2: 1.936(1) Fe—C3: 1.943(1)
C1—N1: 1.144(2) C2—N2: 1.144(1) C3—N3: 1.147(1)
Fe—N4: 1.660(1) N4—O4: 1.130(2) Na1…Na2: 3.7306(6)
Fe…Na1:5.5695(6) Fe…Na2: 4.9293(5)
Bond angles (°)
N1-C1-Fe:179.8(2) N2-C2-Fe:176.9(1)
N3-C3-Fe:178.5(1) O4-N4-Fe: 176.1(1)
The crystal packing consists of a three dimensional network of intermolecular
interactions involving [Fe(CN)5NO]2- anions, Na+ cations and water molecules. The
cyano moieties are only involved in anion-cation interactions and there is no hydrogen
bonding between water molecules and the CN groups. This can be explained by the fact
that the water oxygen atoms are tetrahedrally coordinated by sodium cations (Na1+ and
Na2+) and therefore water molecules are not close enough to the CN groups to form
such hydrogen bonds. Furthermore, the specific configuration of the [Fe(CN)5NO]2-
anions results in shortened anion-anion contacts between two neighbouring NO groups
with O…O distance of 2.704(2) Å (Fig 4.2.b).

55
The sodium cations (Na1+ and Na2+) have similar distorted octahedral environment,
where each sodium cation is hexacoordinated to two water molecules and four cyano
groups (Fig 4.2.a). The Na…N interactions range from 2.487(1) Å to 2.534(1) Å and the
Na…O interactions have distances varying from 2.496(1) Å to 2.528(1) Å. It is also
noteworthy that the shortest distance between two iron metal centers is 6.6583(4) Å .
The optical excitation of SNP leads to a change in the bond between the central
metal atom Fe and the NO ligand which triggers the rotation of the NO group. In the
ground state (GS) the nitrosyl ligand is bound via nitrogen (Fe-N-O). The ligand can be
totally switched by 180° to an oxygen coordination Fe-O-N (metastable state S1) by
irradiation with blue-green light [11]. A subsequent irradiation of light in the near
infrared spectral range turns nitrosyl ligands by 90° to a side-on coordination
(S2) [6,19,20] as illustrated in Fig. 4.3.
Figure 4.3 Schematic illustration of the photoinduced changes for
(Na2[Fe(CN)5NO]. 2H2O) complex [21].
These photoswitchable properties have been evidenced by infrared spectroscopy by
the υ(NO) shift under irradiation (λ = 458 nm and 1064 nm) at low temperature (T = 80
K). The reversible transfers in a single crystal from the GS to S1 and GS to S2 are about
45% [11] and 30% [22], respectively. In order to explore the properties of embedded
(Na2[Fe(CN)5NO]. 2H2O) complex and the generation conditions of photoinduced
linkage isomers in these conditions we studied the electronic structure of SNP embedded
in SiO2 xerogels using X-ray diffraction, absorption and infrared spectroscopy.

56
4.3 Evidence of photoswitchable properties
UV-Vis absorption spectroscopy delivers information about the electronic structure
of the compound in its different configurations. In the case of photoinduced metastable
linkage isomers, the low temperature measurements yield in addition information about
the spectral ranges for photoswitching [22]. Fig. 4.4 shows the absorption spectra in the
GS at 297 K of SNP@SiO2 with 1 nm pore sizes, with the two absorption bands at
19100 cm-1 (I) and 25100 cm-1 (II) (deconvolution with Gaussians).
For comparison the two absorption bands in crystalline SNP are found at 19800
cm-1 (I) and 25950 cm-1 (II) for polarization along a-axis of the crystal [22]. There is thus
a slight redshift of about 700 cm-1 in the xerogel compared to the crystal, an effect
known from SNP embedded in aqueous solutions, where the two bands are found at
19125 cm-1 and 25100 cm-1, respectively [23]. Also the width of the peaks is in the same
range of that found in solution, 4800 cm-1 and 6000 cm-1 in the silica compared to 3800
cm-1 and 6000 cm-1 in solution. Consequently the assignment of the absorption bands to
the transitions dxy → π(NO) (I, HOMO-LUMO) and dxz,yz → π(NO) (II) is the same as
found in single crystal and solutions. Furthermore, the fact that the absorption spectrum
of SNP@SiO2 resembles the spectrum of an aqueous SNP solution is a first hint that the
SNP complexes are embedded as isolated complexes and that the system SNP@SiO2
might be considered as some kind of frozen solution of SNP in a glassy matrix.
Figure 4.4 UV/vis spectra of SNP@SiO2 (pore sizes of 1 nm) at 297 K
using Shimadzu UV-3600 spectrophotometer. The dotted curves I and II
denote the Gaussian deconvolution of the spectrum

57
Infrared spectroscopy (IR) yields information of embedded SNP in the SiO2 matrix,
as well as their photoswitchable properties [7,12]. The IR spectrum of the SNP@SiO2
hybrids is a combination of the pure SiO2 spectrum with the pure SNP spectrum and
shows both the characteristic bands for the SiO2 gel and SNP. The pure SiO2 has wide
bands at 800 cm-1 (Si-O stretching) and 970 cm-1 (SiOH bending). The Si-O stretching
vibrations lead to a very strong and wide band between 1000 and 1200 cm-1. At 1660,
1875 and 2000 cm-1 weak bands are observed that are identified as combination or
overtones of the silicon-oxygen fundamentals [7]. Since H2O can easily be adsorbed into
the pores, the band at 1660 cm-1 might also stem from its bending mode (see Fig. 4.5 (a)).
The IR spectrum of crystalline SNP shows peaks corresponding to the nitrosyl
stretching mode υ(NO) and the cyanide stretching mode υ(CN) centered at 1947 cm-1
and 2147 cm-1, respectively. However, the asymmetric υ(CN) band splits into multiple
bands (2147 cm-1, 2163 cm-1, 2168 cm-1, and 2177 cm-1). After embedding the SNP
complexes into SiO2 gel, some of the SiO2 bands overlap the SNP bands. The two
characteristic bands of υ(NO) and υ(CN) are still visible in Fig. 4.5 (b) and (c), which
represent samples of post-doping SNP into SiO2 matrices of 1 nm and 5 nm, respectively.
If we take a closer look at υ(CN) bands, the fourfold splitting is completely smeared out
in the samples with 1 nm pore sizes. In the samples with 5 nm pore size this splitting is
clearly visible, however it is less pronounced than in the crystalline SNP. These results
indicate that the inclusion of SNP in matrices with different pore size leads to different
structural arrangement of the SNP complexes inside the pores. While in the small pores
(with probably isolated SNP complexes) the effect of the well-ordered crystalline
environment seems to be completely absent or at least largely reduced it reappears in the
bigger pores, indicating that in these larger pores small crystallites are formed. We note
also that the position of the peaks is not changed within experimental error (2cm-1)
indicating that the structure of the anion is not changed upon embedding.

58
Figure 4.5 Infrared spectra of SNP-silica hybrids in GS: (a) pure/empty silica gel,
(b) SNP-silica with pore sizes of 1 nm, (c) SNP-silica with pore sizes of 5 nm, and
(d) crystalline SNP. The spectra are shifted vertically for clarity.
The illumination with light in the blue-green spectral range at 80 K generates the
metastable state S1, which can be identified by a new υ(NO) band appearing at 1828 cm-1.
The decrease in the area of the GS band at 1947 cm-1 yields the amount of transferred
molecules, i.e. the population of S1. In the samples with 1 nm pores the populations
obtained for S1 are 11(1)% when using 476 nm. The subsequent illumination with 1064
nm transfers the molecules from S1 towards S2 and partially back to GS. As can be seen
from Fig. 4.6(a) the S1 band disappears and the GS band increases. The new band of S2
is hidden in the H2O absorption band, but can be identified from a difference spectrum,
shown in the inset. The band of S2 is found at 1684 cm-1 and the population determined
from the GS area is about 7(1)%. Compared to the crystalline SNP, where the υ(NO)
stretching vibrations of S1 and S2 are found at 1835 and 1664 cm-1, respectively, we
observe a shift of 7 and 20 cm-1 for S1 and S2, respectively. In the case of the samples
with 5 nm pores we obtain a population of about 13(1)% and 12(1)% for irradiation with
442 nm and 476 nm, respectively (Fig. 4.6(b)). The transfer with 1064 nm results in a
population of 7(1)% for S2. No shifts of the peak with respect to the crystalline SNP are

59
observed in the samples of 5 nm pores, i.e the bands of S1 and S2 are found at 1835 and
1664 cm-1, respectively. Furthermore, we note that there is broad band underneath the S1
peak around 1828 cm-1, indicating that there might be also a contribution due to isolate
molecules as for the 1 nm sample.
The large width of the two bands in the xerogel samples (1 nm pore size) of 40 and
60 cm-1 for S1 and S2 is a clear hint for the disordered arrangement of the molecules
within the pores and possibly weak interactions with the matrix, e.g. with OH groups on
the pore surfaces. In general we could expect that S2 with its side-on position reacts
more sensitively upon small local structural changes that could occur in the isolated
complexes in the gel compared to the crystalline packing, which might explain the more
pronounced broadening as well as the peak shift of 20 cm-1 with respect to the crystal.
The population of 13% is in the range of the population achieved in powder samples
indicating that the orientation of the fourfold axis of the molecules is statistically
distributed in the gel.

60
Figure 4.6 Infrared spectra at T = 80 K of SNP@SiO2 hybrids with pore sizes
of (a) 1 nm and (b) 5nm. The GS and after irradiation with 458 nm and 1064
nm for S1 and S2, respectively.

61
4.4 The PDF for SNP@SiO2 monolith (1nm)
By the total scattering method, including Debye function analysis (DFA) and Pair
distribution function (PDF), not only Bragg peaks but also the diffuse scattering in the
whole powder diffraction pattern is measured. In this manner the local atomic
environment which may be lost in the average long-range structure analysis can be
studied as, e.g., in the case of the isolated complexes embedded in amorphous matrix.
In order to explore the possibilities and limitations of the total scattering
measurements coupled to a PDF analysis we first investigated crystalline SNP which
serves as a reference substance. Furthermore we used this measurement to compare the
PDF analysis of synchrotron data to that of data collected on the laboratory X-ray
diffractometer. This allows for studying the effect of Qmax on the accuracy of the
structural model, and – as a more general conclusion – for the comparison of the quality
of laboratory based PDF results to those obtained on synchrotron beamlines for such
molecular materials.
4.4.1 Bulk structure of SNP
We compare experimental data of bulk SNP collected at E = 24.9866 keV (λ =
0.4133 Å ) at the MS-beamline (SLS, Paul Scherrer Institut) and using Mo Kα radiation (λ
= 0.7107 Å ) at CRM2. Fig. 4.7 illustrates the routine extraction steps, which are followed
in order to obtain from raw intensity I(Q) the normalized S(Q), and finally G(r) using the
program GudrunX [24].
The X-ray total structure factor falls off sharply with increasing Q resulting in a
weak signal at high diffraction angles. This is illustrated in Fig 4.7(a) that shows the raw
intensity from bulk SNP. The overall drop-off in intensity follows <f(Q)>2 with very
little apparent structure in the scattering at high-Q region. However, when the data are
divided by <f(Q)>2, (cf. Eq. 2.10), diffuse scattering becomes apparent in this region (Fig
4.7(c)). It is therefore important to measure the diffracted intensity up to high Q-values
with good counting statistics. This does not present a problem when high flux,
high-energy sources such as synchrotrons are used. The incident flux at high energies is
so intense that, despite the inefficient coherent scattering and Qmax value, sufficient
statistics can be obtained to yield accurate G(r) (Fig 4.7(e)). On the other hand, on a
laboratory source one usually needs to increase data acquisition times at high angle in
order to improve statistics. Otherwise it could result in an improper picture of the
local-range order below ca. 5 Å in G(r) after Fourier transformation (Fig 4.7(f)).
Comparing the intensity patterns in Fig 4.7(a,b) one immediately recognizes the two
main differences in the synchrotron and laboratory pattern: resolution and maximum

62
accessible Q-range. The synchrotron data exhibit both a higher resolution and a higher
Qmax. By measuring up to 120° a Qmax of about 27 Å -1 can be obtained (data are truncated
at Qmax= 25 Å -1 beyond which the signal-to-noise ratio became unfavourable) in the
synchrotron data set while on the laboratory source the Qmax of about 17 Å -1 can only be
obtained when measuring up to 150° in 2θ. Concerning the resolution the shown
patterns illustrate the compromise made in the laboratory measurement, where a step
size of 0.07° in 2θ was chosen in order to limit the measurement time to approximately
48h, whereas in the synchrotron measurement the resolution can be reached 0.0035° due
to the fact that the measurement time of only about 20 minutes is not a limiting factor.
The differences in signal-to-noise ratio are more clearly visible in the S(Q) patterns
in Fig 4.7(c,d), from which can be seen that noise remains small up to high Q-values,
while for the laboratory pattern the noise starts to increase at about 10Å -1. Note that the
difference in scale of the two patterns, S(Q) tends towards 1 in both cases, the count rate
simply being much higher in the synchrotron data.
Finally, these differences are transferred to the PDF (Fig 4.7(c,d)), showing a much
better resolution in the small-r range and less termination effects due to higher Qmax, as
well as a smaller peak width due to the higher Q-resolution.
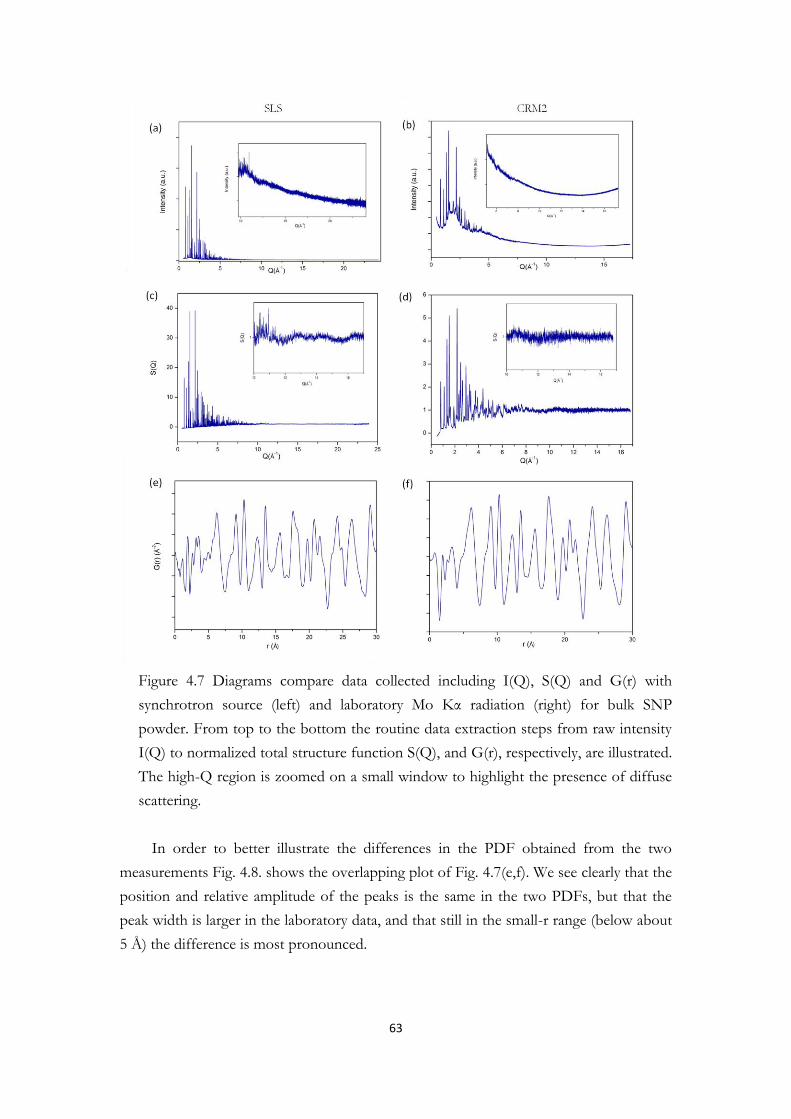
63
Figure 4.7 Diagrams compare data collected including I(Q), S(Q) and G(r) with
synchrotron source (left) and laboratory Mo Kα radiation (right) for bulk SNP
powder. From top to the bottom the routine data extraction steps from raw intensity
I(Q) to normalized total structure function S(Q), and G(r), respectively, are illustrated.
The high-Q region is zoomed on a small window to highlight the presence of diffuse
scattering.
In order to better illustrate the differences in the PDF obtained from the two
measurements Fig. 4.8. shows the overlapping plot of Fig. 4.7(e,f). We see clearly that the
position and relative amplitude of the peaks is the same in the two PDFs, but that the
peak width is larger in the laboratory data, and that still in the small-r range (below about
5 Å ) the difference is most pronounced.

64
Figure 4.8 Scaled overlap of plots from Fig. 1.7(e,f) for comparison of PDF
obtained from laboratory and synchrotron data.
In order to extract structural information from the experimental PDF, it is then
possible to refine the experimental PDF with a structural model in direct space in a
similar way as Rietveld refinement is used in reciprocal space for crystalline materials. We
first used the PDF analysis method to check the average structural model by refining the
observed G(r) (Fig 4.7(e)) by using the program PDFgui [25].
To be noted, previous PDF studies have shown that the small-r peaks in
experimental PDFs have systematically smaller peak widths than the PDF peaks that
have been calculated from a model, as illustrated in Fig 4.9(a). This phenomenon is
related to correlated motions of atoms in PDFs [26,27] and more visible in molecular
compounds [28]. In order to take this correlated motion into account a cut-off value in r
(rcut) can be defined which corresponds to the longest intramolecular distances in the
studied system. In our case the [Fe(CN)5NO]2- anion is quite rigid and therefore the
displacements of the atoms within this anion are correlated. We therefore introduced the
cut-off value of rcut = 3.25 Å corresponding to the distances of the central Fe atom to the
terminal N atoms of the C-N ligands. The result is shown in Fig 4.9(b).

65
Figure 4.9 Experimental PDF of SNP and calculations from a structural
model. (a) No parameter for peak sharpening is used, (b) sharpened PDF
defining rcut=3.25 Å .
After application of the r-cut correction we performed the PDF refinement in three
steps and the final fit result is shown in Fig. 4.10. The initial model is the one that was
measured from single crystal data at 297 K. The refinement was carried out from 0.5 Å
up to 30 Å . Using the atomic positions fixed to the average structure known from the
single crystal study and refining only a scale factor leads already to a reasonable fit result
(RWP = 22.44 %). In a second step the parameter Qdamp, is introduced and fixed to the
value obtained from the Si calibration measurement, this takes into account peak
broadening due to the instrument configuration. Furthermore the two parameters Qbroad,
describing instrumental peak broadening and broadening due to thermal motion, and Srat
describing the effects of correlated motions on peak broading are refined. This fit results
in an improved RWP of 19.72%. Finally the lattice parameters are refined resulting in the
parameters shown in Table 4.2. This step leads only to a small reduction of the RWP to
19.24% yielding lattice parameters in good agreement with single crystal refinement. If

66
we further release atom positions and thermal parameters, the RWP improves to 18.28%.
However, in this case the atomic positions undergo important change (up to 0.2 Å )
compared to the known crystal structure, and the thermal parameters increase for the
terminal atoms of the ligands by about a factor of 2. We consider this refinement result
as physically not meaningful. In effect, it is most probably due to the fact that the
instrumental peak broadening in the PDF is not completely described using the three
parameters Qdamp, Qbroad, and Srat. Thus the remaining broadening effects are accounted by
increased thermal parameters and movements in the positional coordinates. This
represents thus a limitation of our PDF based analysis of the detailed structure, on the
other hand yields information on the precision of our PDF analysis.
Figure 4.10 Refinement of the PDF for crystalline SNP from 0.5 Å up to 30 Å
(agreement factor RWP = 19.24 % for synchrotron data collected at SLS, PSI).
The same refinement procedure has been applied to the laboratory data by using the
same rcut value (rcut = 3.25 Å ). The result is shown in Fig. 4.11. The experimental PDF is
well described by the structural model of SNP. Compared to the synchrotron data we see
that the low-r range clearly exhibits larger residuals, which is expected due to the smaller
Qmax. The agreement factor RWP = 29.37 % was obtained by fitting with the instrumental
parameters (Qdamp and Qbroad), and improves to RWP = 26.16 % after refining with lattice

67
parameters. We note that the lattice parameter change with respect to the single crystal
measurement.
Figure 4.11 Refinement of the PDF for crystalline SNP from 0.5 Å up to 30 Å
(agreement factor RWP = 26.16 % for laboratory data).
It is worth nothing that the agreement factor Rwp used in PDF refinements appears
higher when compared to the corresponding Rwp factor used in single crystal refinements.
This does not indicate an inferior quality of the PDF fit since it yields structural
parameters that agree with those obtained by the single crystal refinement. Rather, it
reflects the fact that the experimental quantity being fit in real and reciprocal space is not
the same.
In summary, the presented results show that from the PDF analysis a good
structural description of SNP can be obtained from synchrotron measurements. Using a
laboratory X-ray source yields PDF results of similar quality in the range 10-30 Å and a
slightly lower precision in the range below 10 Å , provided the necessary care for
calibration of the instrument and corrections has been taken. This is crucial to obtain
good results in the distances inferior to ~5 Å , which are of interest in our further studies.

68
Table 4.2. Selected parameters for refinement of SNP single crystal model.
Parameter Single crystal data Synchrotron data Lab data
Qdamp (Å-1) 0.0071 0.0165
Qbroad (Å-1) 0.0022 0.0343
Srat (rcut =3.25 Å ) 0.7125 0.7671
Rwp (%) 19.72 29.37
a (Å ) 6.2051(4) 6.205 6.168
b (Å ) 11.9098(6) 11.909 11.870
c (Å ) 15.5605(9) 15.582 15.545
V (Å 3) 1149.94(1) 1151.7 1138.3
Rwp (%) 19.24 26.16
4.4.2 Structure of amorphous SiO2 matrix
For the structural study of the hybrid materials it was first necessary to establish a
good model for the amorphous silica matrix. Therefore the amorphous SiO2 monolith
was measured on both experimental setups as described above for bulk SNP. Fig. 4.12
illustrates the obtained results. The two data sets yield similar results even though the
Qmax values are quite different, i.e., Qmax = 25 Å -1 for the synchrotron data (left) and Qmax
= 16.7 Å -1 for the conventional laboratory source (right).
The X-ray diffraction data of the SiO2 monoliths are shown in Fig. 4.12(a,b). Both
data sets show the typical silica glass pattern first measured by Mozzi and Warren [29],
exhibiting the characteristic broad first sharp diffraction peak (FSDP) at Q1.64 Å -1,
which is associated with the intermediate range ordering. It refers to the ordering of the
nearest neighbor in a tetrahedral environment, which occurs with a periodicity of 2π/Q
~ 3.8 Å . The similar features at higher Q range are more clearly visible in total structure
function S(Q) shown in Fig. 4.12(c,d).

69
Figure 4.12 Diagrams compare data collected with synchrotron source (left) and
laboratory Mo Kα radiation (right) for a monolithic SiO2 rod. From top to the bottom
illustrates the routine data extraction steps from raw intensity I(Q) to normalized total
structure function S(Q), and G(r), respectively. The high-Q region is zoomed on a
small window to highlight the presence of diffuse scattering.
The corresponding atomic PDFs in real space, G(r), are shown in Fig. 4.12(e,f). The
expected pair distances for a SiO2 xerogel have been identified and are in agreement with
published data of (see e.g. Benmore [30]). The first peak at 1.60 Å in the PDF refers to
the Si-O bond length in the silica network. The second G(r) peak at 2.64 Å originates
from O-O distances and confirms that the average O-Si-O bond angle is tetrahedral. The
third peak in G(r) at 3.08 Å corresponds to Si-Si distances in the configuration of

70
corner-shearing SiO4 tetrahedral units. This mutual arrangement of the SiO4 tetrahedra
can be further described by the 4th and 5th peaks, respectively, at 4.08 Å and 4.99 Å ,
corresponding to two Si-O and O-O distances between two adjacent SiO4 units and
depending on the two torsion angles describing the rotation of the SiO4 units about the
two joined Si-O bonds. The assignment of peaks at higher r values is difficult due to
peak overlap.
4.4.2.1 Refinement of amorphous SiO2
X-ray diffraction studies have long been used to obtain information on the short
and intermediate range structure of liquid and glasses, where the long range order
structure is broken. In the amorphous state ordering only persists on the length scale of a
few polyhedral units. Amorphous silica is considered as a continuous random network of
corner-linked SiO4 tetrahedra as proposed by Zachariasen [31]. (Fig 4.13 and Fig. 4.14)
Figure 4.13 Zachariasen 2D
network model of a glass in
which the structure is
random within the steric
packing constraints of local
units.
Figure 4.14 Fragments of
SiO4 tetrahedral units in an
amorphous silica structure.
Oxygen atoms are colored
red and Silicon atoms are
lightly grey.

71
Structure refinement was then used to build a three dimensional structural model of
the SiO2 that is consistent with the experimental data, using the EPSR code [32]. The
procedure begins with a Monte Carlo simulation of the system based on a combination
of Lennard-Jones and Coulomb potentials. The potential between atoms α and β is given
by,
(4.1)
Where Lorentz-Berthelot mixing rules for calculating ϵαβ = (ϵαϵβ)1/2, σαβ = 0.5(σα +σβ),
between different types of atom are used.
The simulation was performed in a cubic box of side length 35.2762 Å under
periodic boundary conditions. The simulation box contained 1000 silicon atoms and
2000 oxygen atoms at a corresponding local density of 0.0683 atoms Å -3. Ionic charges
have been used on the silicon (+4e) and oxygen (-2e) atoms to mimic their effects in the
formation of the local chemical ordering expected in this binary system. All atoms were
given a Lennard-Jones potential well depth with Coulomb repulsive potential of atoms.
Table 4.3 lists the main parameters used in the Monte Carlo simulations of these
materials. The Reverse Monte Carlo procedure is then allowed to continue under this
final potential scheme and ensemble average structural information is accumulated for
the judgment of χ2 (cf. Eq. 3.13). Once generated, these average functions can be
interrogated to obtain structural information of interest. Fig. 4.15(a) shows the resulting
calculated G(r) in comparison to the experimental one.
Table 4.3. Lennard-Jones and charge parameters used in the simulation of
SiO2 xerogel. [33]
Atoms ϵα
(kJ/mol)
σα
(rαβ), (Å )
q
(e)
No.
of atoms
Box size
(Å )
Si 0.800 0.760 4.000 1000 35.2762
O 0.650 3.690 -2.000 2000
For a system containing N atom types, there are N(N+1)/2 partial pair distribution
functions Gαβ(r). If we take SiO2 xerogel as an example, N=2 and there are three partial
distribution function, namely GSiSi(r), GSiO(r) and GOO(r). For SiO2 we have,

72
(4.2)
Given that the atomic concentrations of Si and O are cSi=1/3 and cO=2/3 respectively,
and that the number of electrons are fSi=14 and fO=8 (at Q=0 Å -1). Eq 4.2 reduces to,
(4.3)
Fig. 4.15(b) shows the three weighted partial PDFs calculated from the total PDF.
The good reproduction of these independent partial PDFs suggests that the X-ray
diffraction generated model is reasonable.
Figure 4.15 (a) Refinement of total pair distribution function G(r), and (b) the
three corresponding contributions from partial Gαβ(r), namely Si-O, O-O, and
Si-Si for SiO2.

73
To better understand the local geometry of the SiO4 units within the structure, the
coordination numbers N(r) calculated from each partial PDF and the angular
distributions are illustrated in Fig. 4.16 and Fig. 4.17, respectively. These indicate that
each silicon atom is directly coordinated to 3.9 oxygen atoms with dominant 109° and
140° O–Si–O and Si–O–Si bond angles, respectively, confirming the basic tetrahedral
structure of amorphous silica.
Figure 4.16 Coordination numbers NSi(r),
NSiSi(r), and NOO(r).
Figure 4.17 Bonding angles distribution
of Si-O-Si and O-Si-O.
Fig 4.18 shows the picture of the RMC generated structure SiO2 model obtained
from experimental PDFs, it consists of a polyhedral network of SiO4. However, the
information of pore size distribution is missing in this model. Such information can be
obtained from small angle scattering or adsorption measurements (see Annex 2).
Figure 4.18 A plot showing the central
3000 atoms from the RMC refined model
of silica gel. Grey spheres correspond to
silicon atoms and red spheres to oxygen
atoms.

74
Summarizing this part, a valid model for the amorphous silica host can be obtained from
RMC modeling of the experimental PDF. This validation is important for the calculation
of the differential PDF as used in the next section describing the result of the matrices
loaded with SNP complexes.
4.4.3 Fingerprints of SNP@1 nm SiO2
The X-ray diffraction data of the loaded and unloaded monoliths are shown in
Fig.4.19(a). Both data sets confirm the amorphous nature of the silica gel, exhibiting the
characteristic broad principal peak at Q1.64 Å -1 [34]. We observe that the main peak has
a lower intensity and is slightly broadened in the loaded monolith. This feature has been
observed in previous work [12] and indicates the change of the scattering contrast
between the empty and filled monoliths. The corresponding atomic PDFs in real space,
G(r), are shown in Fig. 4.19(b). Small differences in the PDF between loaded and
unloaded monoliths can be clearly observed in the differential PDF corresponding to the
direct subtraction G(r)loaded – G(r)unloaded, and occur mainly at low r values (x3, Fig. 4.19(b))
up to 7 Å .
The study of differential PDFs allows for the extraction of structural information
due to atomic correlation involving the guests, both guest-guest and guest-framework, as
well as guest-induced framework perturbations [35]. In the present case the significant
structural changes due to the insertion of the SNP complexes are limited to the local
scale up to distances of 10 Å indicating well isolated molecules inside the matrix pores.
Fig. 4.20 shows the comparison of the experimental differential PDF obtained by
the subtraction G(r)loaded – G(r)unloaded and the G(r) obtained from crystalline SNP
(measured under the same experimental conditions). We note that the positions of the
peaks below 5 Å are different in the two spectra. They are slightly shifted to each other
which is a clear hint for a structural relaxation of the single molecule embedded in
nano-pores. However, it can be seen that the main bond lengths of SNP encapsulated in
the SiO2 gel correspond to the intramolecular pair correlations found in crystalline
samples in the range 1-5 Å , with distances of 1.16 Å (C-N), 1.93 Å (Fe-C), 3.09 Å (Fe-N)
and some weaker intra-molecular correlations (C-C, N-N between ligands). The most
intense peaks in the G(r) involve the pairs including the strongest scatterers (Fe atom) in
this complex as well as the most abundant pairs (five C-N ligands). The absence of sharp
features in the d-PDF beyond 5 Å is a strong indication for the absence of any regular
ordering around the [Fe(CN)5NO]2- molecules and thus confirms our hypothesis that we
are dealing with isolated SNP complexes in the porous network. However, the distances
due to intramolecular pair correlations in [Fe(CN)5NO]2- do not account for all the
features observed in the d-PDF. In order to obtain more detailed information about a

75
possible structural relaxation of the SNP complex, the position of the counter ions (Na+),
and the interactions with the pore walls of the SiO2 monoliths we performed extensive
modelling as detailed below.
Figure 4.19 (a) Diffraction patterns of unloaded and loaded monoliths. (b) corresponding
PDFs, G(r), unloaded (blue) and loaded (black) monoliths, and the subtracted
differential-PDF (red) is scaled up for clarity.

76
Figure 4.20 Comparison of G(r) of crystalline SNP (crystalline structure illustrated
perpendicular to ab plane), and subtracted d-G(r) from embedded SNP which isolates
structural information of the molecule in the porous matrix.
The fitting of the differential PDF was accomplished using the “difference
modelling” strategy which employs three components: i) a reference PDF of the vacant
host, ii) the structure model of the host-guest system, and iii) the experimental
differential PDF. An initial structure of the host-guest system was constructed as follows.
First, the empty porous SiO2 network was created using the Reverse Monte Carlo (RMC)
method which has been described by Keen [36]. The RMC modelling of amorphous SiO2
was developed by using reliable total scattering data to create three dimensional models
as described in the previous section. Starting from random configuration of SiO2 groups
based on the experimental number density, three geometrical constraints have been
applied: Si-O distances (~1.6 Å ) and O-Si-O angle (~109.5°) which permit to keep the
SiO4 tetrahedral configuration, and Si-O-Si angle (~143.0°) for creating undistorted
corner shearing SiO4 tetrahedra to form an amorphous silica network. Then, a credible
configuration of the Na2[Fe(CN)5NO] complex was taken from single crystal data
measured at room temperature. This modelling was performed using the DISCUS
program [37].
Fig. 4.21(a) illustrates clearly that pair correlations are mainly dominated by the
[Fe(CN)5NO]2- anion to ~5 Å ; Fig. 4.21 (b~f) show configurations where two Na+
cations are taken into account around the molecule with a fixed radial distance of 5.55 Å .
This allows an improved fit of the d-PDF in the region below 8 Å . Fig. 4.21(d) shows the
configuration yielding the best fit including the 5-10 Å region. In this configuration the

77
two Na+ anions are in the equatorial plane of the [Fe(CN)5NO]2- anions, in prolongation
of the Fe-C-N direction. Additionally, we have arranged the Na+ positions as given in the
single crystal (one equatorial and one near the axial CN ligand) but the Rwp-value
increases (see Fig 4.22). The same increase of Rwp was found by varying the radial
distance of the Na+ counter ions between 4 - 7 Å . Consequently we can determine by
this procedure the position of the two Na+ ions with respect to the [Fe(CN)5NO]2- anion
with reasonable reliability.
On the other hand there are still some features in the differential PDF that are not
completely explained by our model, especially the intensity of the peak at 1.3 Å as well as
the shoulder at about 2.3 Å . It should be noted here that the low r region (~1.2 Å ) of the
differential PDF is very critical and may contain some errors due to the limitation of the
experimental setup and the processing of the data [38]. Therefore we should be careful in
interpreting the intensity of the peak at 1.3 Å . Nevertheless, we tested two hypotheses in
order to account for these features: i) hydration, ii) interaction with pore wall.
Concerning i) the impregnation of the monoliths was performed from aqueous solutions
and NMR measurements indicate that the SNP complex inside the pore is surrounded by
water molecules (see details below). It is also known that porous matrices like SiO2
readily uptake humidity. However, fitting the differential PDF with additional H2O
molecules proved to be a very difficult task. Although improvements could be realized
the reliability of such fits was quite limited, as different configurations yielded similar
results, sometimes with no significant improvement of R-values. We conclude therefore
that the presence of water molecules in the pores surrounding the SNP complexes is
highly probable but the structural arrangement cannot be obtained from a PDF
measurement at this stage. Concerning ii) host-guest interaction: we note that the
shoulder at 2.3 Å could stem from such an interaction. However, also in this case the
differential PDF did not allow a clear identification of the host-guest interaction. It could
stem from NaH-O or NH-O. We note here that an earlier neutron diffraction study
on a similar compound GuNP@SiO2 has shown the possibility of such host-guest
interactions (Cervellino et al. [13]).

78
Figure 4.21 d-PDF fits with different configurations of isolated SNP complexes
illustrated on the right: (a) one [Fe(CN)5NO]2- anion within the pores; (b)~(f) considers
two Na+ cations placed around [Fe(CN)5NO]2- to keep electrostatic neutrality. Five
configurations are considered for which (d) results in the best fit. In that case the two
Na+ cations are placed on the coordination of the cyanide ligands within the equatorial
plane of the molecule.

79
Figure 4.22 Arrangement of Na+ positions are given as in the single crystal
(one equatorial and one near the axial CN ligand) but the Rwp-value increases.
Concluding this first part, total X-ray scattering measurements coupled to analysis
of the differential PDF showed that for the silica matrices with 1-3 nm pore sizes
isolated SNP complexes are embedded in SiO2 pores. Additionally the structural
configuration of cation and anion could be proposed from a difference modelling
strategy.
Furthermore, it should be mentioned here that comparable results have been
achieved using the data collected on the laboratory setup, even though the attainable
Q-range is not as high as with synchrotron radiation. Together with the good results
obtained for the amorphous matrix this shows, that for such amorphous molecular
compounds the PDF analysis based on laboratory data is feasible and can yield results of
similar quality as that obtained using synchrotron data.
4.5 The Solid State NMR
Since NMR observables depend on the local environment of the nuclear spins, long
range order is not necessary to obtain resolved structural information. This
complementary approach is thus well adapted to characterize both the amorphous host
and the molecular guest as long as NMR sensitive nuclei are present in both components
of the material. Additionally, the anisotropic nuclear interactions typically measured by
solid state NMR techniques can also be used to obtain information on molecular
dynamics inside the solids.

80
4.5.1 Structure of amorphous SiO2 host
The porous matrix containing the isolated SNP complexes is composed of
amorphous SiO2 silica. Both 29Si (I = 1/2; 4.7 % natural abundance) and 17O (I = 5/2;
0.037% natural abundance) allow NMR studies. However the very low natural abundance
and the quadrupole moment of the 17O isotope severely reduces its sensitivity and limits
the NMR application. We applied 29Si MAS NMR to characterize the xerogel matrix.
Figure 4.23 presents the 29Si MAS NMR spectra of the nanoporous SiO2 xerogel before
and after incorporating the SNP molecules. The chemical shifts observed are typical for
Qn SiO4 tetrahedral units; Qn representing SiO4 tetrahedral of the amorphous network,
which form n bonds with neighboring tetrahedral. Both spectra show two major
resonances at -101.7ppm and -110.5ppm, corresponding to Si(OSi)3(OH) (Q3) and
Si(OSi)4 (Q4) sites, respectively, and one resonance at -91.8ppm corresponding to
Si(OSi)2(OH)2 (Q2) sites. The absence of Q1 sites and the low ratio of Q2 sites indicate a
relatively high degree of condensation of the xerogels. This is especially true since, on the
spectra acquired here, this ratio is overestimated because of short experimental repetition
times compared to Q3 and Q4 29Si T1 relaxation times.
Figure 4.23 29Si MAS NMR spectra (νMAS = 12.5 KHz ) of the SNP loaded SiO2
matrix (top) and the empty SiO2 matrix (bottom). No additional sites are
observed after loading the matrix with SNP.

81
A comparison between the spectra of the empty and the SNP loaded matrix shows
neither a change of the line widths nor the appearance of additional sites. This indicates
that the gel structure is not modified by the embedding procedure of the SNP molecules.
This point is very important since it validates the differential PDF (d-PDF) approach
described previously. The comparison also doesn’t show evidence of strong interactions
between the host xerogel and the molecular guest since significant covalent
chemisorptions on the silanol groups (by Na+ for example) would generate new
chemically shifted 29Si sites.
4.5.2 Structure and dynamics of the SNP guest
Given the NMR sensitivity of the nuclei present in the SNP salt (Na2[Fe(CN)5NO]),
we applied 13C NMR to probe the local environment of the nitroprusside and 23Na NMR
to probe the environment of the counterions.
The 23Na MAS NMR spectrum of the bulk crystal (Fig. 4.24) displays two
inequivalent sites with same multiplicity but significantly different quadrupolar coupling
constants. The first site Na1 has a quadrupolar constant CQ1 = 1369 kHz and an
asymmetry of η1 = 0.92 while the second site Na2 has a smaller constant CQ2 = 615 kHz
and η2 = 0.33. The isotropic chemical shifts (δ1iso = -5.74 ppm and δ2
iso = -1.91 ppm)
indicate hexacoordinated sodium atoms and are consistent with the XRD crystal
structure, the NMR sites could be assigned by comparison of the Electrical Field
Gradient properties with those published from DFT calculations [39].The 23Na MAS
NMR spectrum of the SNP inside the silica matrix (Fig. 4.24) is very different. This
spectrum presents only one 23Na site with a chemical shift (δiso = -1.1 ppm) indicating
that the sodium site is coordinated by six water molecules. This means that the crystal
structure is not preserved inside the pores of the SiO2 matrix and that the two 23Na
counterions experience a similar local environment on the ms timescale. Several
possibilities can explain the presence of a unique 23Na site but consistently with our other
measurements we interpret this as motional averaging below the ms timescale due to
solvation by surrounding water molecules.

82
Figure 4.24 23Na MAS NMR spectra (νMAS = 12.5 KHz ) of the SNP loaded
SiO2 matrix (top) and crystalline SNP (bottom). Inside the matrix the
quadrupolar interaction is averaged out by rotational diffusion. For the
crystalline sample quadrupolar coupling constants and asymmetry parameters
could be obtained by fitting the central bands using the Dmfit program [40].
Quadrupolar satellites are marked by asterisks.
The 13C MAS NMR spectrum of the bulk crystal (Fig. 4.25) displays four resolved
sites (δiso=136.7ppm, 136.2ppm, 135.9ppm, and 135.5ppm) whereas the SNP-silica
nanocomposite displays only two (δeqiso = 134.7 ppm and δax
iso = 133.3 ppm). For the
nanocomposite, the isotropic chemical shifts are thus displaced towards the solution state
values with a surface ratio of 4:1 typically observed for SNP in solution. Consistently

83
with the 23Na results, this means that the crystal structure is not preserved in the
nanocomposite. It also indicates that water molecules are present inside the pores and
that, for sufficiently high hydration levels, the nitroprussiate is well separated from its
sodium counterions. Nevertheless, as will be detailed in the next section, the line width
broadening observed for samples stored in relatively dry conditions indicates that the
“free” solvation water molecules can quite easily be removed.
In the bulk crystal, both the 13C and the 23Na nuclei display anisotropic interactions.
Fitting the MAS sideband pattern of the 13C spectrum informs us about the chemical
shift anisotropy. For the crystal we find δaniso= 32 kHz with a slight asymmetry of η=
0.08. It’s origin is mainly intramolecular and relies on the anisotropic electron
distribution of the Fe-C≡N bonding. For the 23Na spins the dominant interaction is the
quadrupolar coupling which can be obtained here by fitting the second order
quadrupolar lineshapes of the center bands. These values are CQ1 = 1369 kHz and CQ2 =
615 kHz depending on how the nuclear electric quadrupole moment couples to the local
electric field gradient. As evidenced on Fig 4.24 and 4.25, both interactions split the MAS
NMR signals into spinning sidebands and satellites (respectively) appearing at integer
multiples of the sample rotation frequency and spread over a frequency window
equivalent to the strength of the interactions. Interestingly these spinning sidebands are
no longer present for the nanocomposite powder spectra. This clearly indicates that the
embedded SNP performs isotropic motion inside the pores, a motion sufficiently fast to
completely average out both types of anisotropic interactions. Hence the characteristic
frequency of the motion is higher than those interactions and implies a sub-μs isotropic
reorientation. Still, whether or not the nitroprussiate and the counterions move in a
correlated manner cannot be inferred from these experiments alone.

84
Figure 4.25 13C MAS NMR spectra (νMAS = 12.5 KHz ) of the SNP loaded SiO2 matrix
(top) and crystalline SNP (bottom). Inside the matrix the CSA interaction is averaged out
by rotational diffusion. For the crystalline sample CSA and asymmetry parameters could
be obtained by fitting the spinning sideband pattern using the Dmfit program [40].
Spinning sidebands are marked by asterisks.

85
4.5.3 Hydration of the nanocomposite SNP@SiO2 xerogel
To study how hydration influences the structure and dynamics of the SNP complex
inside the SiO2 matrix, the NMR samples have been stored in three different
environments of 6%, 29% and 85% relative humidity. 1H, 13C, 23Na MAS NMR spectra
(Fig. 4.26) were subsequently acquired to observe how the different components of the
material were influenced by hydration.
Figure 4.26 Effect of hydration on the 1H, 13C and 23Na spectra (respectively from left to
right) of the SNP@SiO2 hybrid xerogel. For reference, the upper spectra are acquired on
crystalline SNP. The spectra below correspond to SNP loaded xerogels that have been
stored overnight at 84%, 29% and 6% relative humidity (broken, fine and bold line
respectively). MAS spinning sidebands are marked with asterisks (νMAS = 12.5 KHz ).
The signals observed on the 1H spectra originate principally from water molecules
that can exchange protons with silanols groups. The series of 1H spectra shows how the
pore water content diminishes with the relative humidity levels. The spectra are
composed of a dominating signal between 4.5ppm and 4ppm that is reduced, broadened
and shifted upfield when the relative humidity is lowered. This signal reflects relatively
mobile water molecules present inside the pores of the matrix. When the humidity is
decreased, the “free” water is removed and only the first hydration layers remain.

86
Therefore the remaining signal is shifted and broadened because of the stronger
adsorption of the protons and their exchange between liquid water, physisorbed water
and silanols [42].
The 13C and 23Na spectra (Fig. 4.24) focus on the SNP guest. Both series behave
comparably and show that all anisotropic interactions remain motionally averaged even at
a low hydration level (no MAS sidebands or satellites even at 6% relative humidity).
Additionally, the removal of water molecules does not induce chemical shift changes
towards those observed for crystalline SNP. This indicates that even when most of the
water inside the nanopore cavity is removed, the SNP maintains its strong dynamic
properties and does not take a bulk-like nanocrystalline structure. We also observe an
upfield shifting of the 23Na signal which is consistent with an elongation of the average
coordination distance [43]. Nevertheless, both 13C and 23Na signals become considerably
broadened for samples stored at 6% RH. This broadening cannot be refocused by spin
echo type sequences; it is therefore from the homogeneous type which means that it is
not due to a distribution of chemical shifts. Since both the nitroprusside and the sodium
counterions display sub-μs dynamics, we speculate that the broadening originates from
their mutual interaction rather than from physisorption to the pore surface.
4.6 Multiscale structural analysis of SNP@SiO2 (1nm, 5nm, 11nm): the
structural aspect-pore size and organisation relationship
In the previous sections, we have discussed the structure of isolated
Na2[Fe(CN)5NO] complexes incorporated in silica monoliths with pore sizes in the range
of 1~3 nm using the PDF approach. In the following we will study the inclusion of SNP
into SiO2 with larger pore dimensions of 5 nm and 11 nm. In this case the post-doping
of the SNP is expected to generate nanoparticles within the matrix where the particle size
is limited by the pore size.
4.6.1 Problems of SNP crystallized on monolith surface
As a first observation and in contrast to the samples with smaller pore sizes, we
observe sharp Bragg peaks in the diffraction pattern in the samples of pore sizes 5 and 11
nm. These sharp Bragg peaks are an indication that SNP crystallites of dimensions that
exceed the dimensions of the pores are formed. This suggests that at least a fraction of
SNP has crystalllized outside the pores, yielding an inhomogeneous composite material.
(Fig 4.27)
A more detailed analysis of the total structure functions (Fig 4.28) clearly
demonstrates that 2 different cluster sizes of SNP have formed: large crystals as indicated

87
by the sharp Bragg peaks and isolated complexes as indicated by the broader oscillations.
However, the SNP@SiO2 of 5 nm pore sizes exhibits stronger broad oscillations of S(Q),
indicating a higher number of isolated [Fe(CN)5NO]2- complexes within the pores (Fig
4.29). By comparing the intensities of peaks corresponding to isolated molecules (low-r
region < 8 Å ) and nanoparticles (medium to long range region).
Figure 4.27 diffraction pattern of SNP@SiO2 doping in pore size of (a) 5
nm and (b) 11 nm.

88
Figure 4.28 Total structure function of difference (loaded - unloaded) subtracted from
Fig 4.27 SNP@SiO2 doping in pore size of (a) 5 nm and (b) 11 nm.

89
Figure 4.29 Difference PDFs (loaded - unloaded) are Fourier transformed from Fig 4.28.
SNP@SiO2 doping in pore size of (a) 5 nm and (b) 11 nm.

90
In order to avoid the extra signal that most probably stems from larger crystallites
that have formed on the monolith surface, we slightly polished the surface of monolith
and then measured again the SNP@SiO2 sample with 5 nm pore sizes.
4.6.2 SNP@SiO2 (5nm)
The PDF measurements of the polished samples was performed at ESRF (60keV,
λ=0.22299 Å , ID11) using a Perkin Elmer flat panel detector to record diffraction
pattern to high momentum transfer (Q~24 Å -1). Raw images were processed using
Fit-2D and PDFs were extracted by GudrunX as described previously.
The diffraction pattern of the empty monolith exhibits the typical amorphous silica
features (Fig 4.30). Inspection of the diffraction pattern of the loaded monolith indicates
the amorphous SiO2 phase, as well as additional rather broad peaks due to a
nanocrystalline SNP phase (Fig 4.27). The rather large width of the diffraction peaks
indicates clearly the formation of SNP nanoparticles. The evaluation of the broadening
according to Scherrer’s formula yields a particle size of ca. 7.5 nm. Note that this particle
size corresponds to an average particle size.
Figure 4.30 X-ray diffraction pattern of SNP@SiO2 with pores size of 5 nm. The porous
empty SiO2 indicates an amorphous silica phase, and the loaded samples present several
weak peaks corresponding to the confined SNP nanoparticles.

91
The difference intensity was then calculated after absorption correction of both
samples (Fig 4.31(a)). In this manner the information of the embedded nanoparticles can
be extracted. While the presence of SNP peaks indicative of nanoparticles is clearly
visible in the difference pattern, the total scattering function S(Q) (Fig 4.31(b)) reveals a
further contribution from an incorporated guest. In order to determine the origin of this
second contribution we need to analyze in detail the PDF (Fig 4.31(c)). In the case of the
PDF of a nanoparticle, the extent of atom-atom distribution is influenced by the particle
diameter, beyond which the PDF drops to zero. Effectively G(r) is rather structureless
beyond 5 nm, we therefore refer to the confined SNP particles as 5 nm in diameter. On
the other hand, two strong and sharp peaks are present in the r-range below 8 Å , which
cannot be explained by the 5 nm particles and might be due to the formation of a second
phase of SNP confined in the porous environment.
As a first model we compared the PDF calculated from a 5 nm spherical model of
SNP to the experimental d-PDF, as shown in Fig 4.32(a). The modelling of the SNP
particles was based on the structural model of the bulk material at 297 K, and by
applying a spherical shape function up to 50 Å (Fig 4.32(b)). The particle size is a little bit
larger than 5 nm as shown in the inset, Thus the final refinement of the SNP particles
was then carried out in the medium to long-range from 8 to 70 Å , thereby we avoid the
overlapping of peaks with the second phase in the low-r region. The particle size was
refined to 6.7 nm in diameter, and lattice parameters were refined to a= 6.23(1) Å ,
b=11.93(2) Å , and c=15.60(2) Å . This corresponds to about 0.3 % of lattice expansion
for the confined SNP nanoparticles compared to the bulk.
The particle sizes estimated from the PDFs (~6.7 nm) or Scherrer equation (~7.5
nm) are systematically larger than those which are obtained from the BET measurement
(~5 nm). It could be explained by different shape of embedded particles. The porous
environment is not ideally spherical in shape and furthermore connected by tunnels. We
could thus expect the formation of, e.g. elliptical particles with one dimension longer
than 5 nm, or even interconnected particles via tunnels. We note furthermore that the
BET analysis is also based on a spherical pore model and therefore yields limited
accuracy. Finally 5 nm corresponds to an average pore size, i.e. larger pores of 6-7 nm are
present and might be filled with nanoparticles.

92
Figure 4.31 (a) Difference intensity subtracted from Iloaded – Iunloaded after
absorption correction, (b) the total structure function S(Q), and (c) the
corresponding PDFs where the atomic pair distribution tends to zero
beyond ~50 Å .

93
Figure 4.32 (a) Comparison between PDFs obtained from difference data and
simulation from a spherical particle model (d=5 nm) using crystal structure,
and (b) refinement of lattice parameters a, b, c and the particle size in the
medium to long-range from 8 to 70 Å .

94
Having determined the contribution of the 5 nm particles, we can address the
second phase that is visible in the low-r region of the differential PDFs. The subtraction
of the PDF modelled with the 5 nm particles from the experimental PDFs as shown in
Fig 4.33 allows for a more detailed investigation. Two sharp peaks are located inferior to
5 Å , which resemble very much the PDF of the isolated Na2[Fe(CN)5NO] complexes in
the SiO2 monolith with pore sizes of about 1 nm (see section 4.4.3). However, in the
range of 5 to 8 Å , there are some differences to the signature of the isolated molecules,
which might be due to the perturbation of counter-ions or different porous
environments. Further, broad features (oscillations with a period of ~11 Å ) in the
long-range region of the PDFs might be due to intermolecular distances including
molecules in neighboring pores.
Figure 4.33 Subtraction of experimental PDFs by the refined SNP
nanoparticles from Fig 1.32 (b). The “fingerprint” of isolated SNP was also
presented at low-r region, the same as we have observed in SiO2 of 1 nm pore
sizes.
Concluding this part we found that in the samples of SNP@SiO2 with pore sizes
~5nm, SNP nanoparticles of about 6 nm are formed and that the lattice parameters in
the SNP nanoparticles are slightly expanded in comparison to bulk SNP. Furthermore,
the PDF analysis indicates the presence of a second phase of SNP in the form of isolated
Na2[Fe(CN)5NO] complexes inside the porous network. However it is difficult to
quantify accurately the contribution of these two phases from such analysis.

95
Additional Solid State NMR experiments confirm the presence of two types of SNP
structures. The 23Na NMR spectrum acquired under magic angle spinning (νMAS=12,5kHz)
is shown on Fig. 4.34. It can be deconvoluted into three different sites. The two sites
presented in purple correspond to the sites present in the published crystal structure [44].
The third site (in red) is not present in the bulk crystalline material and its chemical shift
is sensitive to the hydration level of the sample. Therefore this site reflects the presence
of smaller molecular clusters where the number of SNP complexes is not sufficient to
allow for ideal crystallization. In those assemblies the sodium counterions are partially
coordinated by water molecules to replace the missing Nitroprusside molecules. These
results are therefore consistent with the PDF analysis since they show the presence of
properly crystallized nanoparticles as well as additional structures that probably
correspond to smaller assemblies. These additional sites correspond to less than 30% of
all 23Na atoms.
Figure 4.34 Central band of the 23Na spectrum from the L5 sample.
Experimental spectrum (top) and the corresponding deconvoluted model
(bottom). The spectral components are represented in purple and red
whereas the sum is overlaid in black

96
4.6.3 Pre-doping SNP@SiO2 nanocomposites
A second possibility to prepare xerogels with isolated SNP complexes and/or SNP
nanoparticles is the pre-doping procedure (see section 4.1.2). In the pre-doping samples
the particle size can be influenced by the initial concentration of the dopant. In order to
study the structure and size of the SNP (nano)particles formed by this procedure we
performed total scattering experiments coupled to PDF analysis as described for the
post-doped samples. Fig 4.35 illustrates the XRD patterns from pure SiO2 xerogel and
doped samples for different concentrations of the SNP salt (see Table 4.4). For the
samples of Pre-4 to Pre-7, broadened Bragg peaks are clearly visible and indicate the
presence of embedded crystalline SNP particles within the gel. The evaluation of the
broadening according to Scherrers formula yields a particle size in a range of 83 nm to
143 nm. In the samples with lower doping concentration (samples Pre-1 to Pre-3) no
traces of Bragg peaks appear. In this case the structural information can be obtained by
subtracting the intensity of loaded – unloaded samples following the procedures
described earlier. Fig 4.36 shows the total scattering functions S(Q) of difference
intensities from Fig 4.35. The oscillations of isolated Na2[Fe(CN)5NO] complexes
become visible for the samples with lower concentrations. For the samples with higher
concentrations we observe two phases: the nanocrystalline one reflected already in the
Bragg peaks but also a huge population of isolated complexes within the gel (Fig 4.36),
which are listed in the Table 4.4.

97
Figure 4.35 XRD patterns of SNP@SiO2 series of samples
synthesized by pre-doping method.
Table 4.4. Pre-doping samples of SNP@SiO2 with different concentrations.
Samples Number of SNP in gel Estimated embedded SNP phases (%)
(μmol) Isolated complexes Particles
Pure SiO2 0 0 0
Pre-1 12.5 100 0
Pre-2 62.5 100 0
Pre-3 187.5 100 0
Pre-4 312.5 92.5 7.5
Pre-5 437.5 90.3 9.7
Pre-6 500.0 88.2 11.8
Pre-7 625.0 86.7 13.3

98
Figure 4.36 Total structure function of difference (loaded - unloaded)
subtracted from Fig 4.35.
Figure 4.37 PDFs of difference (loaded - unloaded) obtained from Fig 1.36.

99
4.7 Conclusion
We have studied the influence of embedding SNP in porous silica xerogels with
different pore sizes on its structure. The high energy X-ray total scattering experiments
coupled to experimental differential PDF analysis, together with Solid State NMR
techniques, allow us to investigate structural properties of isolated SNP molecules
incorporated in the silica nanopores. The atomic d-PDF and the modelling approaches
provide direct structural evidence on the local cation and anion arrangement of the SNP
complexes and show that the SNP complexes are well isolated as single molecules inside
the matrix pores in the case of SiO2 matrices with pore sizes in the range of 1-3 nm. The
corresponding analysis of SNP encapsulated in hosts with 5 nm pores sizes (average
value !) reveals the presence of both isolated molecules as in the previous case and of
nanoparticles of SNP with an estimated diameter of 6 nm.
The multi-nuclei Solid State NMR investigation provides information on both the
amorphous host and the molecular guest and adds a dynamic dimension to the classical
static structural characterization. 29Si MAS NMR measurements show that the gel matrix
structure is not modified by the SNP embedding procedure.
13C and 23Na MAS NMR measurements show that inside the matrix pores the SNP
neither takes a crystalline like structure nor does it adhere to the pore surface in
agreement with the d-PDF results. We surprisingly find evidence that the confined
complex adopts solution like structure and dynamics with isotropic reorientation below
the μs timescale. Additional experiments at different relative humidity levels show the
presence of weakly interacting water molecules inside the pores. These water molecules
can easily be removed to some extent, nevertheless the strong isotropic motion of the
SNP is still preserved even for low hydration levels. Globally, the SNP complexes behave
as “free” isolated molecules inside the matrix pores. The fact that the local arrangement
of cation and anion and their dynamic can be proposed from a model obtained by using
d-PDF and solid state NMR multiscale approach allows for future systematic
investigations of structure-property relationship in such hybrid organic-inorganic
nanocomposites.
Furthermore, we have verified that SNP retains its interesting optical properties.
Especially the photoisomerisation of the nitrosyl group is still possible, and it was shown
that the main characteristics of this photoswitching (spectral sensitivity, population of the
isomers, …) are independent of the particle sizes, indicating the truly molecular nature of
the nitrosyl isomerisation.
A second important conclusion of this study concerns the methodology. In fact we
have seen through this example, that good PDFs yielding proper structural information

100
can be obtained using a laboratory setup with limited Q-range (17 Å -1). The comparison
with PDF analysis based on synchrotron data shows, that using (much) longer counting
times a sufficient signal-to-noise ratio for meaningful structure analysis can be obtained
on a laboratory source. We note that this observation is especially true for amorphous
molecular compounds, which have limited diffraction power at high Q-values, thus
yielding the parameter Qmax less important for the structure interpretation.

101
Annex 1: Single crystal measurement of SNP complex
Table. X-ray data collection and refinement details for SNP complex
Chemical formula Na2[Fe(CN)5NO]. 2H2O
Formula weight 297.97
Temperature 293(2) K
Crystal system, Space group Orthorhombic, Pnnm
Unit cell dimensions (Å): a, b, c 6.2051(4), 11.9098(6), c = 15.5605(9)
V (Å3) 1149.94(12)
Z 4
Radiation type, Wavelength Mo K, 0.71073 Å
Density (calculated) 1.721 Mg/m3
Absorption coefficient 1.390 mm-1
F(000) 592 electrons/unit cell
Crystal size 0.12 x 0.12 x 0.1 mm3
Data collection
Diffractometer Oxford SuperNova Dual with an Atlas detector
Theta range for data collection 3.53 to 30.00°.
Index ranges -8<=h<=8, -16<=k<=16, -21<=l<=21
Reflections collected 36985
Absorption correction Analytical [CrysAlis PRO, Oxford Diffraction,
2009]
Tmin, Tmax 0.681 and 0.768
Independent reflections 1731 [Rint = 0.045]
Completeness to theta = 30.00° 99.7 %
Refinement
Refinement method Full-matrix least-squares on F2
Data / restraints / parameters 1731 / 0 / 89
Goodness-of-fit on F2 1.072
Final R indices [F2>2(F2)], wR(F2) R1 = 0.022, 0.064
R indices (all data) R1 = 0.025, 0.065
max, min (e.Å-3) 0.255 and -0.246
Data Collection and Reduction
Accurate single crystal X-ray diffraction experiment was performed at room temperature
(T=293(2) K) with an Oxford Diffraction SuperNova Dual Wavelength Microfocus
diffractometer equipped with a 135 mm Atlas CCD detector, using Mo K radiation (

102
= 0.71073 Å ). In order to ensure high redundancies, the intensity data were accurately
collected using oscillation scans of 1° per frame repeated at different positions. The
radiation exposure time was 20 s per frame. Coverage of reciprocal space was more than
99% complete to (sinmax/) of 0.704 Å -1. The unit cell determination and data
integration were carried out using the CrysAlis Pro program suite [45]. Absorption effects
were corrected by numerical methods based on multifaceted crystal model. The different
sets of measured reflections were subsequently merged and scaled using SORTAV [46].
A total of 36985 reflections intensities were merged into 1731 unique reflections. The
internal agreement factor for all data is RInt(I) = 0.045 with an average redundancy of
21.3.
Crystal structures Determination and refinements
The structure was solved by direct methods and successive Fourier difference syntheses
and refined against F2 by weighted full-matrix least-squares methods using the
SHELXL97 program [47]. All calculations were carried out using the WinGX software
package [48].

103
Annex 2. Brunauer-Emmett-Teller (BET) results
0,0 0,2 0,4 0,6 0,8 1,0
200
300
400
500
600
700
800
882 m2/g
V (
cm
3/g
)
P/P0
n1_vide
2 4 6 8 10 12 14 16 18 20
0,0
0,5
1,0
1,5
4,7 nm
1,01 cm3/gd
V/d
D (
cm
3/n
m/g
)
Diamètre (nm)
n1_vide
0,0 0,2 0,4 0,6 0,8 1,0
200
300
400
500
934 m2/g
V (
cm
3/g
)
P/P0
n1_snp_aq1
2 4 6 8 10 12 14 16 18 20
0,0
0,2
0,4
0,6
0,68 cm3/g
3,7 nm
dV
/dD
(cm
3/n
m/g
)
Diamètre (nm)
n1_snp_aq1
0,0 0,2 0,4 0,6 0,8 1,0
100
200
300
400
V(c
m3/g
)
P/P0
n5_vide
360 m2/g
2 4 6 8 10
0,0
0,2
0,4
0,6
0,8
1,0
0,49 cm3/g
dP
/dV
(cm
3/n
m/g
)
Diamètre (nm)
n5_vide
5,4 nm
0,0 0,2 0,4 0,6 0,8 1,0
100
200
300
400
500
600
432 m2/g
V (
cm
3/g
)
P/P0
n5_snp_aq1
2 4 6 8 10
0,0
0,2
0,4
0,6
0,8
1,0
5,8 nm
0,67 cm3/gd
V/d
D (
cm
3/n
m/g
)
Diamètre (nm)
n5_snp_aq1

104
0.0 0.2 0.4 0.6 0.8 1.0-40
-30
-20
-10
0
10
20
30
40
50
V (
cm
3/g
)
P/P0
n11_snp_aq2
non exploitable
Samples Specific Surface
(m2/g)
Porous Volume
(cm3/g)
Average sizes of pores
(nm)
SiO2 (1nm) 882 1.01 4.7
SNP@SiO2 (1nm) 934 0.68 3.7
SiO2 (5nm) 360 0.49 5.4
SNP@SiO2 (5nm) 432 0.67 5.8
SiO2 (11nm) 200 0.52 11.4
SNP@SiO2 (11nm) - - -
0,0 0,2 0,4 0,6 0,8 1,0
0
100
200
300
400
200 m2/g
V(c
m3/g
)
P/P0
n11_vide
5 10 15 20 25 30 35 40
0,00
0,05
0,10
0,15
0,20
0,25
0,52 cm3/g
dP
/dV
(cm
3/n
m/g
)
Diamètre (nm)
n11_vide

105
Bibliography
[1] V. Dieckmann, S. Eicke, K. Springfeld, and M. Imlau, Materials 5, 1155 (2012).
[2] D. Schaniel, M. Imlau, T. Weisemoeller, T. Woike, K. W. Krämer, and H.-U. Güdel,
Adv. Mater. 19, 723 (2007).
[3] M. Goulkov, D. Schaniel, and T. Woike, J. Opt. Soc. Am. B 27, 927 (2010).
[4] T. Woike, W. Kirchner, G. Schetter, T. Barthel, K. Hyung-sang, and S. Haussühl,
Opt. Commun. 106, 6 (1994).
[5] P. Coppens, I. Novozhilova, and A. Kovalevsky, Chem. Rev. 102, 861 (2002).
[6] D. Schaniel and T. Woike, Phys. Chem. Chem. Phys. 11, 4391 (2009).
[7] A. Schuy, T. Woike, and D. Schaniel, J. Sol-Gel Sci. Technol. 50, 403 (2009).
[8] C. Seidel, U. Ruschewitz, A. Schuy, T. Woike, and D. Schaniel, Z. Für Anorg. Allg.
Chem. 634, 2018 (2008).
[9] V. Dieckmann, M. Imlau, D. H. Taffa, L. Walder, R. Lepski, D. Schaniel, and T.
Woike, Phys. Chem. Chem. Phys. 12, 3283 (2010).
[10] B. Delley, J. Schefer, and T. Woike, J. Chem. Phys. 107, 10067 (1997).
[11] D. Schaniel, T. Woike, J. Schefer, V. Petříček, K. W. Krämer, and H. U. Güdel,
Phys. Rev. B 73, 174108 (2006).
[12] Z. Tahri, R. Lepski, K.-Y. Hsieh, E.-E. Bendeif, S. Pillet, P. Durand, T. Woike, and
D. Schaniel, Phys. Chem. Chem. Phys. 14, 3775 (2012).
[13] A. Cervellino, J. Schefer, L. Keller, T. Woike, and D. Schaniel, J. Appl. Crystallogr.
43, 1040 (2010).
[14] L. L. Hench and S. H. Wang, Phase Transitions 24-26, 785 (1990).
[15] H. El Hamzaoui, L. Courthéoux, V. N. Nguyen, E. Berrier, A. Favre, L. Bigot, M.
Bouazaoui, and B. Capoen, Mater. Chem. Phys. 121, 83 (2010).
[16] F. Bottomley and P. S. White, Acta Crystallogr. B 35, 2193 (1979).
[17] A. Navaza, G. Chevrier, P. M. Alzari, and P. J. Aymonino, Acta Crystallogr. C 45,
839 (1989).
[18] P. T. Manoharan and W. C. Hamilton, Inorg. Chem. 2, 1043 (1963).
[19] P. Coppens, D. V. Fomitchev, M. D. Carducci, and K. Culp, J. Chem. Soc. Dalton
Trans. 865 (1998).
[20] D. Schaniel, T. Woike, J. Schefer, and V. Petříček, Phys. Rev. B 71, 174112 (2005).
[21] D. Schaniel, Structural Investigations of High Knowledge Content Materials, [s.n.],
2003.
[22] D. Schaniel, J. Schefer, B. Delley, M. Imlau, and T. Woike, Phys. Rev. B 66, 085103
(2002).
[23] M. S. Lynch, M. Cheng, B. E. Van Kuiken, and M. Khalil, J. Am. Chem. Soc. 133,
5255 (2011).

106
[24] A. K. Soper and E. R. Barney, J. Appl. Crystallogr. 44, 714 (2011).
[25] C. L. Farrow, P. Juhas, J. W. Liu, D. Bryndin, E. S. Božin, J. Bloch, T. Proffen, and
S. J. L. Billinge, J. Phys. Condens. Matter 19, 335219 (2007).
[26] I.-K. Jeong, T. Proffen, F. Mohiuddin-Jacobs, and S. J. L. Billinge, J. Phys. Chem. A
103, 921 (1999).
[27] I.-K. Jeong, R. H. Heffner, M. J. Graf, and S. J. L. Billinge, Phys. Rev. B 67, 104301
(2003).
[28] N. Rademacher, L. L. Daemen, E. L. Chronister, and T. Proffen, J. Appl.
Crystallogr. 45, 482 (2012).
[29] R. L. Mozzi and B. E. Warren, J. Appl. Crystallogr. 2, 164 (1969).
[30] C. J. Benmore and P. J. M. Monteiro, Cem. Concr. Res. 40, 892 (2010).
[31] W. H. Zachariasen, J. Am. Chem. Soc. 54, 3841 (1932).
[32] A. K. Soper, Phys. Rev. B 72, 104204 (2005).
[33] A. K. Soper, J. Phys. Condens. Matter 22, 404210 (2010).
[34] H. F. Poulsen, J. Neuefeind, H.-B. Neumann, J. R. Schneider, and M. D. Zeidler, J.
Non-Cryst. Solids 188, 63 (1995).
[35] K. W. Chapman, P. J. Chupas, and C. J. Kepert, J. Am. Chem. Soc. 127, 11232
(2005).
[36] D. A. Keen, Phase Transitions 61, 109 (1997).
[37] T. Proffen and R. B. Neder, J. Appl. Crystallogr. 32, 838 (1999).
[38] B. H. Toby and T. Egami, Acta Crystallogr. A 48, 336 (1992).
[39] P. Blaha, K. Schwarz, W. Faber, and J. Luitz, Hyperfine Interactions 126, 389
(2000).
[40] D. Massiot, F. Fayon, M. Capron, I. King, S. Le Calvé, B. Alonso, J.-O. Durand, B.
Bujoli, Z. Gan, and G. Hoatson, Magn. Reson. Chem. 40, 70 (2002).
[41] A. R. Butler, C. Glidewell, A. R. Hyde, and J. McGinnis, Inorg Chem 24, 2931
(1985).
[42] J. Trébosc, J. W. Wiench, S. Huh, V. S.-Y. Lin, and M. Pruski, J. Am. Chem. Soc.
127, 3057 (2005).
[43] X. Xue and J. F. Stebbins, Phys. Chem. Miner. 20, 297 (1993).
[44] K.-Y. Hsieh, E.-E. Bendeif, G. Axel, P. Sbestien, S. Dominik, and W. Theo, Phys.
Chem. Chem. Phys. (2013).
[45] Oxford Diffraction, CrysAlis CCD and CrysAlis RED (Oxford Diffraction Ltd, Yarnton,
Oxfordshire, England, 2009).
[46] R. H. Blessing, J. Appl. Crystallogr. 30, 421 (1997).
[47] G. M. Sheldrick, Acta Crystallogr. A 64, 112 (2007).
[48] L. J. Farrugia, J. Appl. Crystallogr. 45, 849 (2012).

Chapter 5 Structural investigation and photoluminescent properties of embedded neodymium complex
5.1 Sample preparation……………………………………………………………...109
5.2 Average crystal structure of the bulk material [NdCl2(H2O)6]Cl-………..……......109
5.3 Optical properties………………………………………………………………114
5.3.1 UV-visible spectroscopy……………………………………………...114
5.3.2 IR spectroscopy……………………………………………………...115
5.3.3 Photoluminescence…………………………………………………..116
5.4 Total scattering methods………………………………………………………..118
5.4.1 Differential pattern…………………………………………………..120
5.4.2 Structure of embedded Nd3+ complexes……………………………..123
5.4.3 Debye function analysis……………………………………………...128
5.5 Conclusion……………………………………………………………………...130
Annex………………………………………………………………………………..131


107
0BChapter 5
1BStructural investigation and
photoluminescent properties of
embedded neodymium complex
Luminescent rare earth (RE) materials are very promising for a variety of photonic
applications, such as IR lasers, as a source for optical communication networks or as
light-emitting diodes; and they are very suitable for photovoltaic devices [1–7]. The
trivalent ions of the RE series are characterized by a gradual filling of the 4f orbitals, from
4f0 (La3+) to 4f14 (Lu3+). One of the most interesting features of these ions is their
photoluminescence, whose emission is due to transitions inside the 4f shell, thus
intraconfigurational f-f transitions. The shielding of the partially filled 4f shell is
responsible for the specific properties of RE luminescence, particularly for the
narrowband emission and the long lifetimes of the excited states. Several RE-doped silica
materials show luminescence in the visible or near-infrared spectral regions upon
irradiation with ultraviolet radiation. In this respect, the Nd3+ based materials are among
the most investigated systems and have attracted a major interest owing to their
near-infrared photoluminescence behaviour [4,5].

108
Recently, many theoretical and experimental studies have been devoted to Nd3+ (4f4)
based materials, aiming at defining the relevant parameters which control the luminescent
properties [8–11]. It was found that the spectroscopic and the photonic properties of
Nd3+ based complexes are strongly affected by the arrangement of the ligands around the
RE sites (i.e., the local structure at the RE sites) [12,13]. Furthermore, the neodymium
hydroxychlorides complexes have been investigated by various scientists [2-6] owing to
their interesting structural and optical properties. By investigating the correlation of the
structural and spectroscopic properties of the Nd(OH)2Cl complex [5], it has been shown
that the highly linked three-dimensional network seems to contribute to the remarkable
inertness of this material in near neutral aqueous environments, which could be one of the
key properties for the potential application of actinide bis-hydroxychlorides as nuclear
waste forms. Although the characterisation of the optical properties of Nd3+ based
complexes has thoroughly been performed and are quite well documented [17,18], reports
on their structural behaviour are still rather scarce and quite disparate.
In this chapter we present a detailed structural characterization of neodymium
complexes embedded into SiO2 xerogels with pore sizes of 1 nm, 5 nm and 11 nm, as well
as their optical properties (absorption and luminescence) as a function of the host pore
size.
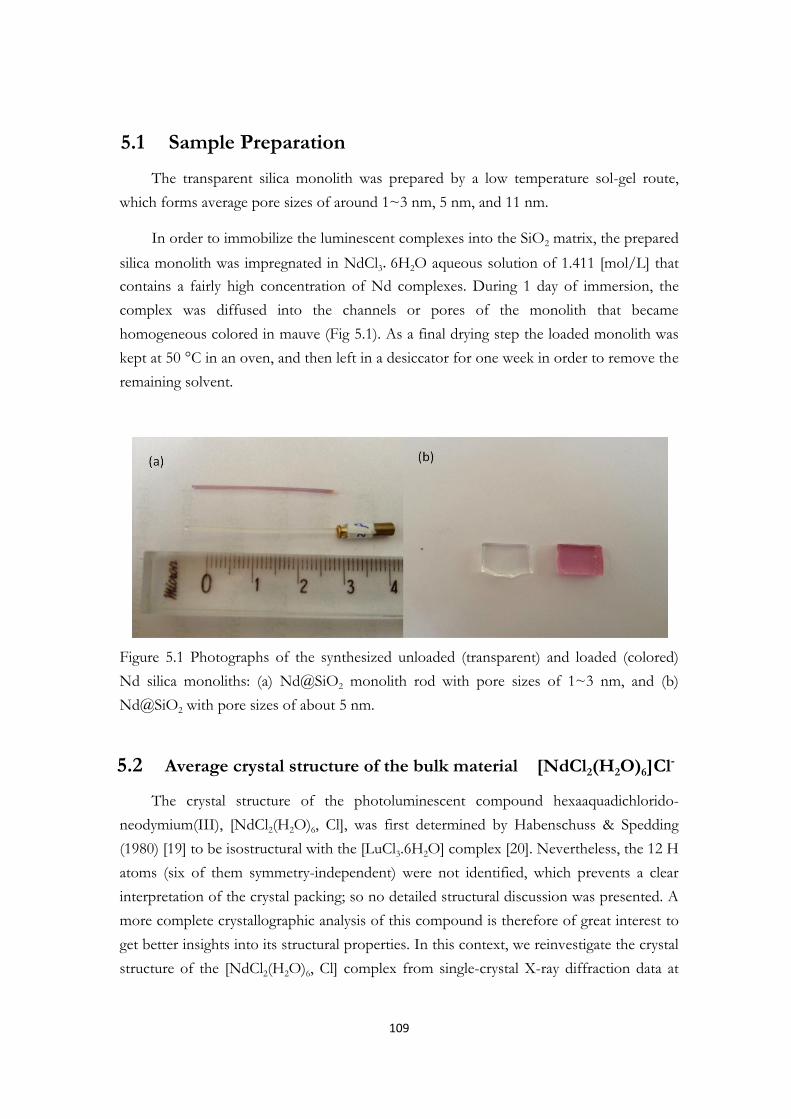
109
5.1 Sample Preparation
The transparent silica monolith was prepared by a low temperature sol-gel route,
which forms average pore sizes of around 1~3 nm, 5 nm, and 11 nm.
In order to immobilize the luminescent complexes into the SiO2 matrix, the prepared
silica monolith was impregnated in NdCl3.6H2O aqueous solution of 1.411 [mol/L] that
contains a fairly high concentration of Nd complexes. During 1 day of immersion, the
complex was diffused into the channels or pores of the monolith that became
homogeneous colored in mauve (Fig 5.1). As a final drying step the loaded monolith was
kept at 50 °C in an oven, and then left in a desiccator for one week in order to remove the
remaining solvent.
Figure 5.1 Photographs of the synthesized unloaded (transparent) and loaded (colored)
Nd silica monoliths: (a) Nd@SiO2 monolith rod with pore sizes of 1~3 nm, and (b)
Nd@SiO2 with pore sizes of about 5 nm.
5.2 Average crystal structure of the bulk material [NdCl2(H2O)6]Cl-
The crystal structure of the photoluminescent compound hexaaquadichlorido-
neodymium(III), [NdCl2(H2O)6, Cl], was first determined by Habenschuss & Spedding
(1980) [19] to be isostructural with the [LuCl3.6H2O] complex [20]. Nevertheless, the 12 H
atoms (six of them symmetry-independent) were not identified, which prevents a clear
interpretation of the crystal packing; so no detailed structural discussion was presented. A
more complete crystallographic analysis of this compound is therefore of great interest to
get better insights into its structural properties. In this context, we reinvestigate the crystal
structure of the [NdCl2(H2O)6, Cl] complex from single-crystal X-ray diffraction data at

110
100 K, with the aim of providing an accurate structural model for the bulk crystalline
material. In addition we calculate the PDF in order to discuss the local structure which
will serve as a reference model for the structural studies of neodymium complex
encapsulated in the different mesoporous silica matrices. Crystal data, data collection and
structure refinement details are summarized in Table 1 (Annex 1).
Fig.5.2 shows the crystal structure of the studied compound, [NdCl2(H2O)6,·Cl],
along with the numbering scheme. The detailed examination of the arrangement around
the neodymium ion reveals a distorted square antiprism geometry, where each neodymium
ion (Nd3+) is located on a twofold axis and is eight-fold coordinated by six water
molecules and two inner sphere chlorines atoms (Table 1). The Nd1—H2O bond lengths
range from 2.437(1) Å to 2.465(1) Å with an average value of 2.453(1) Å and are
significantly shorter than the Nd1—Cl1 [2.8180 (4) Å ]. The third chloride ion (Cl2) is
located on a twofold axis, at much greater distance of 5.0638(2) Å from the Nd3+ cation,
without any evidence for direct Nd1…Cl2 interaction. These interatomic distances are
clearly visible in the calculated atomic Pair distribution Function (PDF) diagram (Fig. 5.3).
Figure 5.2 A projection of [NdCl2(H2O)6, Cl], showing the atom-labelling
scheme. Displacement ellipsoids are drawn at the 50% probability level.
[Symmetry code: (i) -x + 3/2, y, -z +3/2.]
In Fig. 5.3 we illustrate the calculated PDF up to 10 Å obtained from the crystal
structure described herein (solid line) and that from the previously reported structure

111
(Habenschuss & Spedding, (1980)) (open circles). The most intense peaks in the G(r)
function correspond to atomic pairs between the strongest atomic scatterers in this
complex, Nd3+ cations, as well as the most abundant pairs (six water molecules). Moreover,
the examination of the short scale region in the PDF diagram, below 10 Å , gives
information on the first few coordination spheres and therefore yields extensive
information about the local atomic arrangement in the vicinity of the Nd3+ sites.
Table 2: Selected geometric parameters for [NdCl2(H2O)6,·Cl] complex.
Bond length (Å )
Nd1—O1W: 2.437(1) Nd1—O3W: 2.465(1) Nd1—O2W: 2.457(1)
Nd1—Cl1 2.8180(4) Nd1…Cl2: 5.0638(2) Cl1…Cl2: 4.1821(5)
Bond angles (°)
O1W-Nd1-O1Wi: 83.19(6) O3Wi-Nd1-O3W:148.49(6) O1W-Nd1-O2W:69.41(4)
O1W-Nd1-Cl1: 142.94(3) O1Wi-Nd1-O2W: 75.13(4) O1Wi-Nd1-Cl1: 108.22(3)
O2W-Nd1-O2Wi: 132.01(6) O2W-Nd1-Cl1: 147.07(3) O1W-Nd1-O3Wi: 70.06(4)
O2Wi-Nd1-Cl1: 76.39(3) O1Wi-Nd1-O3Wi: 138.34(4) O3Wi-Nd1-Cl1: 79.32(3)
O2W-Nd1-O3Wi: 120.76(4) O3W-Nd1-Cl1: 77.41(3) O2Wi-Nd1-O3Wi: 73.11(4)
Cl1-Nd1-Cl1i:84.10(2)
Symmetry code: (i) -x + 3/2, y, -z +3/2.

112
Figure 5.3 Comparison of PDFs calculated from the crystal structure obtained in this
work (solid line) and that determined from previously reported structure (open circles).
The PDF diagrams were calculated using the program PDFgui [21]
The PDF peak at 2.45 Å corresponds to the Nd1—O bond lengths whereas the peak
at 2.82 Å is due to both the Nd1—Cl1 pairs and the intraprism H2O…H2O interactions.
The peaks at 3.15 Å and 4.18 Å originate from the intramolecular Cl1…H2O interactions
and the intense G(r) peak near 5.1 Å can be assigned to the Nd…Cl2 interactions,
together with a significant number of next nearest Nd…O pairs. As can be seen in Fig.5.3,
the calculated PDFs are quite similar. As a notable difference a small peak near 1 Å ,
definitely corresponding to the O—H bond length, is only observed in the PDF profile
obtained from the results reported in this work. This is obviously due to the fact that all
hydrogen atoms (12 atoms) were successfully located in Fourier difference maps in our
study. Furthermore, we note that the structural parameters reported here are more precise
than those communicated previously due to the different experimental conditions (low
temperature, experimental data collection setup).
The crystal structure of [NdCl2(H2O)6,·Cl] is made up of a network of three different
neodymium pairs linked by O—H…Cl1 interactions ranging from 3.134(1) Å to 3.162 (1)
Å (Fig. 5.4). These pairs are also characterized by significantly different Nd1…Nd1 pairs
with distances ranging from 6.3739(3) Å to 6.7491(3) Å which are clearly visible in the

113
PDF diagram (Fig 5.3) in the 6.13-7.26 Å regions. The chloride ion (Cl2) is in contact with
six neighboring [NdCl2(H2O)6]+ cations, four in the ab plane and two directed almost
along the crystallographic c axis. Anions Cl1 and Cl2 are both involved in the highly linked
three-dimensional network of the intermolecular interactions connecting the different
pairs of neodymium-centred cations (Table3, Annex 1). It is also noteworthy that the
O—H…Cl2 interactions are only slightly longer (from 3.170(1) Å to 3.233(1) Å )
compared to the O—H…Cl1 interactions and the shortest Cl1…Cl2 interaction is of
4.1821(5) Å .
Figure 5.4 (a) Packing diagram of [NdCl2(H2O)6,·Cl] in the ac plane showing dimers linked
by the three dimensional network of O—H…Cl intermolecular interactions. (b) A
detailed view of the different Nd1...Nd1 pairs.

114
5.3 Optical properties
We investigated the influence of the particle size on the optical properties of the
Nd3+ complexes embedded in the silica matrix using spectroscopic techniques including
UV/Vis, IR, and photoluminescence. The crystalline [NdCl2(H2O)6,·Cl] compound was
also characterized and will serve as a reference sample. The Nd3+characteristic absorption
bands are clearly shown on the UV/Vis spectra. The IR measurements give useful
information on both the SiO2 glass and the embedded Nd3+ species, namely the
characteristic vibrations of Si—OH and Nd—O bonds in the matrix. The inclusion of the
Nd3+ complex within the silica pores was also confirmed from the characteristic
luminescent bands of the Nd3+cation at 920, 1080, and 1320 nm.
5.3.1 UV-visible spectroscopy
Fig. 5.5 shows the absorption spectra of crystalline [NdCl2(H2O)6,·Cl], aqueous
solution of [NdCl2(H2O)6,·Cl], and the loaded and unloaded SiO2 gel, respectively. One
can clearly observe that the absorption spectra of the Nd3+ doped-silica composite differs
significantly from that of the crystalline [NdCl2(H2O)6,·Cl] complex but resembles very
much the absorption spectrum of the aqueous solution of [NdCl2(H2O)6,·Cl]. This result
suggests that the embedded Nd3+ species did not crystallize within the matrix pores and
that the Nd3+ cations might have a local structure closely related to that found in aqueous
solution.
The absorption spectra of the different Nd-compounds that are shown in Fig. 5.5 in
the range 200-900 nm show several transitions from the ground state (4I9/2) to various
excited states. Karraker [22] has shown that the intensities and peak shapes of the
transitions at ~800 nm (4I9/2 → 4F5/2, 2H9/2), ~740 nm (4I9/2 → 4S3/2,
4F7/2), ~580 nm
(4I9/2 → 4G5/2, 2G7/2), and ~520 nm (4I9/2 → 4G7/2) are sensitive to the coordination of
the Nd3+ ion. The transition at 580 nm is often referred to as “hypersensitive
transition” [22–24] while the three remaining transitions are sometimes referred to as
“insensitive transitions” [24]. From these studies it was inferred that the coordination
number of Nd3+ in aqueous solution is 9, a fact that was later confirmed by analysis of the
radial distribution function obtained from x-ray diffraction experiments [27]. The fact,
that the corresponding peaks in the absorption spectrum of Nd@SiO2 resemble those of
the aqueous solution, is thus a strong indication that the Nd3+ is nonacoordinated within
the xerogel.

115
Figure 5.5 UV/vis spectra of loaded and unloaded SiO2, aqueous NdCl3
solution, and the [NdCl2(H2O)6,·Cl] crystalline, respectively.
5.3.2 IR spectroscopy
IR spectra of empty SiO2 and Nd@SiO2 are shown in Fig 5.6(a). The SiO2 network
exhibits the absorption bands at ~1090 cm-1 (antisymmetric Si-O-Si stretch, transverse
optic mode, with the shoulder at ~1200 cm-1 arising from the longitudinal optic mode),
~970 cm-1 (Si-OH), ~800 cm-1 (symmetric Si-O-Si stretch). In addition, peaks at ~3400
cm-1 and 1660 cm-1 arise from hydroxyl groups associated with the silica.
For the Nd@SiO2 gel the absorption bands at ~3400 cm-1 and ~1660 cm-1 seem
more intense compared to the bulk crystalline complex [NdCl2(H2O)6,·Cl] (see Fig
5.6(b)). This effect is associated with the Nd3+ doping as was also reported for other Re
complexes [24,25] and might indicate an increase of the concentration of the hydroxyl

116
groups in the Nd@SiO2 hybrid material. This is probably due to the presence of an
important amount of water molecules in the vicinity of the Nd3+ cations within the
matrix pores. To verify that, we calculated the ratio between such absorption bands,
~3400 cm-1 and ~1660 cm-1, in both cases (the difference curve as well as the bulk
crystalline material). We find that this ratio is 2.5 larger in the case of the doped monolith
compared to that obtained in the crystalline material, confirming the presence of a larger
amount of water molecules in the Nd@SiO2 composite.
Figure 5.6 IR spectra of (a) unloaded and loaded Nd@SiO2 gel and the
corresponding difference pattern. (b) Crystalline [NdCl2(H2O)6,·Cl] complex for
comparison.
5.3.3 Photoluminescence
The photoluminescence spectrum was obtained through excitation at room
temperature with λ = 325 nm in a range of 800-1200 nm. The empty SiO2 xerogel shows
the characteristic wide PL band around 800 nm, which overlaps with the bands around
920 nm of the loaded Nd@SiO2. We used a filter of 600 μm to avoid it.

117
The characteristic PL emissions of Nd3+ are observed at 920, 1050 and 1320 nm and
correspond to the transitions 4F3/2 4I9/2 , 4I11/2, and 4I13/2 , respectively, as shown in Fig
5.7. The spectra of Nd@SiO2 exhibit changes in line shapes and positions of the
luminescent bands compared with crystalline [NdCl2(H2O)6,·Cl]. Most notably the 4F3/2 4I9/2 transition found at 920 nm in [NdCl2(H2O)6,·Cl] crystals are shifted by about 40 nm
to 880 nm in the Nd@SiO2 samples. A similar position (emission band at 860-920 nm) for
this transition was found in a neodymium monochloroacetate single crystal, where the
Nd3+ is coordinated by 9 (2 sites) or 10 (1 site) oxygen atoms with average bond lengths of
2.501 Å and 2.486 Å (coordination number 9) and 2.552 Å (coordination number 10) [26].
Furthermore we note that the positions and peak shapes of the three different gel samples
do not differ, only the luminescence intensity decreases with increasing pore size. This
indicates that there is probably no formation of [NdCl2(H2O)6,·Cl] nanocrystals inside the
pores.
Figure 5.7 (a) Emission spectra of [NdCl2(H2O)6,·Cl] crystalline and Nd@SiO2 monoliths
with pore sizes 1 nm, 5 nm, and 11 nm, respectively. (b) Energy level diagram of Nd3+
ions and three radioactive intra-4f transitions.

118
In order to investigate the structural details, especially the coordination number of the
embedded Nd3+ complexes and their cluster size as a function of pore size, we perform
total scattering experiments coupled to PDF and Debye Function Analysis.
5.4 Total scattering methods
The structural characterizations of the neodymium doped monoliths (Nd@SiO2)
were carried out by using two complementary approaches namely, the PDF technique and
the Debye analysis. The total scattering data of empty SiO2 monoliths with pores sizes of 1
nm, 5 nm, and 11 nm and post-doping Nd@SiO2 nanocomposite were recorded, similar to
SNP@SiO2 samples, on the powder diffractometer of the MS beamline of the Swiss Light
Source (SLS) at the Paul Scherrer Institute (Villigen, Switzerland). Several data sets were
collected at room temperature up to Qmax= 24.2 Å -1 using a monochromatic beam of
wavelength = 0.4962 Å (energy E = 24.9866 keV) with Debye-Scherrer geometry.
The diffraction patterns of loaded and unloaded Nd@SiO2 xerogels and the
corresponding patterns (loaded – unloaded) are shown in Fig 5.8. Interestingly, the
difference patterns of the three samples (1 nm, 5 nm, 11 nm pore size) are very similar,
exhibiting three main broad Q peaks at about 0.798 Å -1, 1.482 Å -1, and 2.797 Å -1
respectively. Given the strong similarities of the three experimental PDFs resulting in
equivalent structural models for the three samples, we will present in the following only the
details of the structural analysis of the 1 nm doped sample.

119
Figure 5.8 Total scattering patterns of Nd-doped monoliths with pore sizes of (a) 1 nm, (b)
5 nm, and (c) 11 nm, respectively. The difference patterns (loaded – unloaded) (green lines)
show similar features for the three samples.

120
5.4.1 Differential patterns
In contrast to the example we have seen in chapter 4 the scattering contrast between
the unloaded SiO2 and loaded Nd@SiO2 hybrid materials is rather large yielding neat
difference patterns (Fig 5.8(a)). This difference is mainly due to the scattering power of the
Nd3+. The X-ray scattering factor of Neodymium (fNd(0) ~ 22.684 Å -1) is dominant with
respect to SiO2 (fSi(0) ~ 6.292 Å -1, fO(0) ~ 3.049 Å -1). By comparing the scattering patterns
of the empty SiO2 gels and the Nd@SiO2 hybrid materials (Fig 5.9(a)) one can clearly
observe that the Nd@SiO2 hybrid materials show additional features at Q=0.84 and 2.77
Å -1, that give information on the embedded Nd3+ species. This is also reflected by a more
pronounced second peak in the total structure function, S(Q) (Fig 5.9(b) and results in an
intense peak ~2.56 Å in the PDF diagram(Fig 5.9(c)). This peak can be assigned to the
Nd—O pairs in agreement with the PDF results we obtained for crystalline
[NdCl2(H2O)6,·Cl].
Fig 5.10 shows the difference patterns (loaded - unloaded) of the patterns shown in
Fig 5.9. The structure function, S(Q), shown in Fig 5.10(b) displays two oscillations
corresponding to the sin(Qr)/(Qr) in the Debye formula. The main oscillation evident
throughout the curve gives rise to the first peak in the PDFs ~2.56 Å , which can be
attributed to the Nd—O pairs. The remaining oscillations are due to the second or third
nearest neighbor interactions and are dominated by the interactions between the Nd3+
cations and the Cl- ions.
The difference PDF (Fig 5.10(c)) shows three prominent interaction distances below
5 Å at approximately 2.51, 3.12, and 4.81 Å . The region below the first significant peak, i.e.
low r region (0-~1.4 Å ), is often very critical and may contain some errors due to the
limitation of the experimental setup and the processing of the data. The broad features of
the d-PDF beyond 5 Å might be attributed to the third nearest neighbor distances or
intermolecular interactions. Beyond about 12 Å the G(r) function becomes featureless.

121
Figure 5.9 The empty SiO2 and Nd@SiO2:(a) X-ray powder diffraction patterns, (b) the
total structure function, S(Q), and (c) the corresponding PDFs.

122
Figure 5.10 (a)The difference pattern subtracted from Fig 5.9:, (b) the total structure
function, S(Q), and (c) the corresponding PDF.

123
5.4.2 Structure of embedded Nd3+ complexes
It is straightforward to verify that the differential G(r) of the embedded Nd3+
complexes is different from the initial crystalline configuration, i.e. [NdCl2(H2O)6]+ cations.
Fig 5.11(a) shows the difference diffraction pattern (loaded – unloaded) in comparison to
those of crystalline [NdCl2(H2O)6,·Cl] and an aqueous solution of [NdCl2(H2O)6,·Cl]. It
becomes clear that the embedded Nd3+ complex has a similar diffraction pattern as found
for the aqueous solution of [NdCl2(H2O)6,·Cl]. This indicates that the local arrangement of
the Nd3+ cations undergoes a drastic change in the solution before entering into the SiO2
matrix and that it does not recrystallize in its original form within the matrix. As a result, the
distance between the Nd3+ cations and Cl- anions (~2.818 Å ) in the inner sphere of the
crystalline salt disappears in the liquid state, as well as for the embedded Nd3+ complexes
(sees Fig 5.11(b)). Therefore, we can assume that the embedded Nd3+ species have a similar
inner coordination sphere as Nd3+ in aqueous solution of [NdCl2(H2O)6,·Cl]. This local
structural rearrangement around the Nd3+ cations was also observed in other rare-earth
based systems [27–29].
Steele and Wertz have first reported the X-ray diffraction studies on aqueous solution
of LaCl3, LaBr3, and GdCl3, with different chloride solutions concentrations. They showed
that the Re sites may adopt either 8 fold [Re(H2O)8]3+ or [ReCl(H2O)7]
3+ configurations
depending on the nature and the concentration of the solvent [20]. Habenschuss and
Spedding [27–29] have reported a series of local structural studies of rare earth ions in
aqueous chloride solutions. It has been shown that the inner coordination spheres for the
La3+, Pr3+, and Nd3+ cations are dominated by the nonaaquo [Re(H2O)9]3+ complex and the
octaaquo [Re(H2O)8]3+ complex is the predominant hydration species for the cations Tb3+
through Lu3+. Furthermore, in these systems the average Re3+···Cl- ion pair distances are
located on the second sphere shell at about 5 Å .
Based on these literature results, we tested different configurations such as
[NdCl2(H2O)6]+, [Nd(H2O)9]
3+ and [Nd(H2O)9]Cl3 for describing the inner coordination
sphere of the embedded Nd3+ complex. For this purpose we used the derived radial
distribution function, R(r), instead of the total pair distribution function G(r). It is
noteworthy that compared to the G(r) function, the R(r) function is very useful for peak
fitting and is more suitable to overcome the difficulties that might arise from the
normalization process [30]. The fitting results of the radial distribution function R(r) based
on the three models are illustrated in Fig 5.12. One can clearly observe that the bulk
crystalline configuration, [NdCl2(H2O)6]+ (Fig 5.12.a), is not appropriate as it produces a

124
supplementary intense peak at about 2.8 Å corresponding to the Nd-Cl inner sphere
interaction which is absent in the experimental data. We can thus conclude that the inner
coordination sphere of the embedded Nd3+ complex can be described either by a 9-fold
[Nd(H2O)9]3+ or [Nd(H2O)9]Cl3 geometry instead of the 8-fold [NdCl2(H2O)6]
+
configuration of the crystalline solid state (Fig 5.12.b and c).
Figure 5.11 (a ) X-ray diffraction of difference pattern (loaded - unloaded), aqueous
solution of NdCl3 salt, and hydrate [NdCl2(H2O)6,·Cl] crystalline. (b) The corresponding
PDFs., where embedded Nd3+ complexes show a remarkable change in intensity at ~2.818
Å comparing to [NdCl2(H2O)6,·Cl] crystalline.

125
Figure 5.12 Fitting of the R(r) function by different local configuration of the
Nd3+cation: (a) 8 fold [NdCl2(H2O)6]+ geometry, (b) 9 fold [Nd(H2O)9]
3+ configuration,
and (c) [Nd(H2O)9]3+···3 Cl- ion pairs model.
Furthermore, the analysis of the remaining peaks was accomplished by fitting the R(r) by
Gaussian distributions up to 5 Å . For this, we first assume that the Nd—O interactions
corresponding to the first peak ~2.56 Å have an approximate Gaussian distribution, that
can be deconvoluted from the rest of the RDF by means of the least squares fit. Then, we

126
used four additional Gaussian distributions to fit the RDFs up to 5 Å (see Fig 1.13). The
second peak ~ 3.12 Å could be deconvoluted by two contributions corresponding to 4~5
H2O···H2O inner sphere interactions plus 7~8 Cl-···H2O interactions for each Cl-
anion [28], and serve to approximate these interactions reasonably well. Finally, the RDF
peak near 4.8 Å was deconvoluted by taking into account the Nd3+···Cl- outer sphere
interactions.
Figure 5.13 The radial distribution function, R(r), fited with four Gaussian distributions
up to 5 Å
This deconvoluted model is based on the fact that the embedded Nd3+ complexes
have very similar local structure as in aqueous solution of [NdCl2(H2O)6,·Cl] salts.
Qualitatively, the likely interactions of the nearest neighbour in the Nd@SiO2 hybrid
materials are: O···H, Nd3+···H2O, H2O···H2O, Cl-···H2O, and possibly Nd3+···Cl-. The
O···H interaction is very difficult to detect due to the weak scattering power of the
hydrogen atoms and will be ignored. The peak at~2.56 Å can be attributed to the
Nd3+···H2O distance. If we assume that no chloride anions penetrate the inner
coordination sphere of the rare earth one can expect that the Nd3+ cation is coordinated
by 9 water molecules (Fig 5.14). As a result, the H2O···H2O distances will be near ~2.85 Å
and the Cl-···H2O interactions vary from 3.1 to 3.3 Å in agreement with the results found
in other studies [31]. It is noteworthy that we might estimate the number of Cl-···H2O
127
interactions from the deconvoluted contributions (7~8 Cl-···H2O interactions), however
the analysis of the contributions of H2O···H2O interactions is more complicated. In fact,
the majority of the H2O···H2O interactions should be nearest neighbour distances.
However, the water molecules in the hydration sphere would have a distribution of
H2O···H2O distances varying from normal H2O···H2O distances to H2O···H2O distances
across the Nd3+ water complex. This would cause the distribution of H2O···H2O distances
to trail to longer distances and might cause different position in the PDF. Four to 11 water
nearest neighbours have been reported for Cl- ions in various studies [32,33]. It has been
found that the H2O···H2O coordination distance for pure water is around 4.4 Å and the
number of water nearest neighbours for water molecules in the rare earth chloride
hydrates is around 4-5 Å .
The peak near 4.8 Å is due to an array of second nearest neighbour interactions. One
of the larger contributions to this peak is from the Nd3+···Cl- outer sphere ion pairs
because of the large scattering power of these ions. The dependence of the position of this
peak on the rare earth ion confirms this view. Note that, in the [NdCl2(H2O)6,·Cl]
crystalline the shortest outer sphere Nd3+···Cl- interaction occurs at 5.0638(2) Å .
Figure 5.14 The local geometry of 9 fold [Nd(H2O)9]
3+ complex, where
Cl- ion pairs are located on the second shell.

128
In summary, the embedded Nd3+ complexes have similar inner coordination sphere as
for aqueous solution of [NdCl2(H2O)6,·Cl]. The local structural arrangement of the Nd3+
cation can be appropriately described by a 9 fold [Nd(H2O)9]3+ model with Nd3+···Cl-
outer sphere interactions in contrast to the [NdCl2(H2O)6,·Cl] crystalline, where the Nd3+
is eight-fold coordinated by six water molecules and two inner sphere chlorine atoms.
5.4.3 Debye function analysis
In view of the difficulty of the d-PDF analysis due to modeling in liquid state, it is
worth to verify the same data set by Debye function analysis (DFA) in reciprocal space. For
this, an appropriate Q range should be determined, that depends on the average size of
the embedded substance. For small clusters of one or two molecules, it is best to choose
Qmin = 2π/D and Qmax = 2π/d, where D is the cluster diameter and d the nearest-neighbor
distance [34]. Here the wide angle region (2 ≦ Q ≦ 6 Å -1) has been chosen for small
clusters of one [Nd(H2O)9]3+ complex. The fit is taken into account by adding a linearly
increasing background.
Fig 5.15 shows the subtracted and corrected scattering intensity, together with three
different calculated patterns based on three different geometries of the Nd3+ complexes.
The main peak at Q~2.76 Å -1 represents the sin(Qr)/(Qr) contributions from the inner
sphere of complexes, e.g. interactions between Nd—O and O···O . For the 8 fold
[NdCl2(H2O)6]+ complex, two Chlorine atoms lead to a slight shifting of this peak to lower
Q region due to the longer Nd—Cl distances. On the contrary, the 9 fold [Nd(H2O)9]3+
complex remains on the same position. However, those two models do not account for a
small broad peak at ~4.21 Å -1, which is principally contributed by the second maximum of
the oscillation due Nd···Cl pairs (around 4.9 Å ). The assumption of ion pairing and 9 fold
[Nd(H2O)9]3+ complex improved the fit quality in the region from 2 to 6 Å -1, and even
extended to Q>6 Å -1 where the data might be influenced by the correlated motions of
atoms.
In the previous work of Cervellino [34] further guest-host interaction in the small
angle region have been discussed as an explanation for peaks in this range. However, the
two extra peaks at Q ~1.53 Å -1 and ~0.81 Å -1 in the subtracted pattern in our samples are
also observed in the aqueous solution (Fig. 5.11a). Thus assigning the peak at Q~1.53 Å -1 to
a hydration shell of Nd3+ complexes, corresponding to the 4th and 5th Gaussian peaks in the
R(r) in Fig 5.13 is justified. The position at Q~0.81 Å -1 seems to be due to inter-complexes
interactions, and corresponds to the broad peaks at r~8.5 Å in the PDFs [29]. The exact

129
position of this peak in PDFs is modulated by the amount of solvent separating the
hydrated Nd3+ ions, depending on the concentration. It also appears that the position of
this peak is consistent with approximately one layer of water molecules separating the
hydrated Nd3+ ions on the average.
Figure 5.15 Fitting of R(r) by two different geometries: (a) 8 fold [NdCl2(H2O)6]
+
complex, and (b) 9 fold [Nd(H2O)9]3+ complex.

130
5.5 Conclusion
In the crystal structure of [(NdCl2(H2O)6, Cl] complex, the Nd3+ cation is
eight-coordinated: six water molecules and two chlorine atoms build the inner
coordination sphere. The average value of the inner sphere Nd—Ow distance is 2.453(1) Å
and is significantly shorter than the Nd—Cl- distance [2.8180(4) Å ]. The outer sphere
chloride anion is located at much greater distance of 5.0638(2) from the Nd3+ cation
without any evidence for direct Nd···Cl- interaction. The crystal packing consists of three
different neodymium pairs linked by a three-dimensional network of O—H···Cl
intermolecular interactions.
In aqueous solution of [NdCl2(H2O)6,·Cl] salt, the Nd3+ cation is nonacoordinated by
water molecules and forms the [Nd(H2O)9]3+ species. The average Nd···Ow distance is
2.56 Å in the inner sphere which adopts a local geometric configuration of a tricapped
trigonal prism (TTP) about the trivalent Nd. Further, an average Nd3+···Cl- ion pair
distance of 4.88 Å is found for the second sphere (i.e. the Cl- anions).
In the porous host the Nd3+ cation adopts also the nonacoordinated configuration
like in solution. Further there is evidence from both the d-PDF (R(r) deconvolution) and
the DFA that the Cl- anions are embedded in a second hydration shell around the
[Nd(H2O)9]3+ cations with an average distance of 4.9 Å , very similar to the structural
arrangement in aqueous solution. Note that there is no significant difference in the
structures of the embedded complexes for the three different host matrices (1, 5, and 11
nm pore size). Furthermore, absorption and luminescence spectra are in agreement with
the interpretation of the embedded complex as a nonacoordinated [Nd(H2O)9]3+ with
Nd3+···Cl- outer sphere interactions.
This example shows that the DFA can be used to obtain structural information on
molecular clusters embedded in porous host matrices. The results are in good agreement
with the interpretation based on the R(r) analysis. DFA has the advantage that the
refinement is performed in reciprocal space, it thus does not require high Q-values which
is needed for a good quality PDF in real space. However, we note also the limitations of
both approaches in modeling the second coordination sphere. This is most probably due
to the dynamics of the water molecules in the pores, which were not taken into account in
our static model.

131
Annex 1: Single crystal measurement of [NdCl2(H2O)6, Cl] complex
Table 1. X-ray data collection and refinement details for [NdCl2(H2O)6, Cl] complex
Chemical formula NdCl2(H2O)6, Cl
Formula weight 358.69
Temperature 100(2) K
Crystal system, Space group Monoclinic, P2/n
Unit cell dimensions (Å): a, b, c 7.9850(3), 6.5561(2), 9.6727(4)
(°) 93.655(4)
V (Å3) 505.34(3)
Z 2
Radiation type, Wavelength Mo K, 0.71073 Å
Density (calculated) 2.357 Mg/m3
Absorption coefficient 5.91 mm-1
F(000) 592 electrons/unit cell
Crystal size 0.06 x 0.04 x 0.01 mm3
Data collection
Diffractometer Oxford SuperNova Dual with an Atlas detector
Theta range for data collection 3.11 to 32.89°.
Index ranges -12<=h<=12, -9<=k<=9, -14<=l<=14
Reflections collected 8593
Absorption correction Analytical [CrysAlis PRO, Oxford Diffraction, 2009]
Tmin, Tmax 0.712 and 0.943
Independent reflections 1731 [Rint = 0.032]
Completeness to theta = 30.00° 99.9 %
Refinement
Refinement method Full-matrix least-squares on F2
Data / restraints / parameters 1793 / 6 / 71
Goodness-of-fit on F2 1.03
Final R indices [F2>2(F2)], wR(F2) R1 = 0.016, 0.030
R indices (all data) R1 = 0.017, 0.030
max, min (e.Å-3) 0.57 and -0.57

132
Table 3. Interatomic distances (Å ) and bond angles (º) for Hydrogen bonds in the
[NdCl2(H2O)6, Cl] complex
D—H···A D—H H···A D···A D—H···A
O1W—H11···Cl2ii 0.81(2) 2.39(1) 3.194(1) 171(2)
O1W—H12···Cl1iii 0.81(2) 2.33(1) 3.134 (1) 177(3)
O2W—H21···Cl1iv 0.80(2) 2.38(1) 3.153 (1) 163(1)
O2W—H22···Cl2 0.81(2) 2.36(1) 3.170 (1) 171(2)
O3W—H31···Cl2v 0.82(2) 2.44(1) 3.233 (1) 163(2)
O3W—H32···Cl1vi 0.79(2) 2.37(1) 3.162 (1) 176(2)
Symmetry codes: (ii) −x+2, −y+2, −z+2; (iii) −x+3/2, y+1, −z+3/2; (iv) x−1/2, −y+1, z+1/2; (v) −x+1,
−y+1, −z+2; (vi) −x+1, −y+1, −z+1.
Data Collection and Reduction
To investigate the crystal structure of hexaaquadichloridoneodymium(III) chloride
[(NdCl2(H2O)6, Cl], accurate single crystal X-ray diffraction experiment was performed at
100K with an Oxford Diffraction SuperNova Dual Wavelength Microfocus
diffractometer equipped with a 135 mm Atlas CCD detector, using Mo K radiation ( =
0.71073 Å ). The temperature of the sample was controlled with a liquid-nitrogen Oxford
Cryostream cooling device. In order to ensure high redundancies, the intensity data were
accurately collected using oscillation scans of 1° per frame repeated at different
positions. The radiation exposure time was 30 s per frame. Coverage of Hreciprocal space H
was more than 99.9% complete to (sinmax/) of 0.704 Å -1. The unit cell determination
and data integration were carried out using the CrysAlis Pro program suite [35]. Absorption
effects were corrected by numerical methods based on multifaceted crystal model. The
different sets of measured reflections were subsequently merged and scaled using
SORTAV [36]. A total of 8593 reflections intensities were merged into 1793 unique
reflections. The internal agreement factor for all data is RInt(I) = 0.032 with an average
redundancy of 5.
Crystal structures Determination and refinements
The structure was solved by direct methods and successive Fourier difference
syntheses and refined against F2 by weighted full-matrix least-squares methods using the
SHELXL97 program [37]. The electron density of the H atoms was clearly identified in a
difference Fourier map, and their atomic coordinates and isotropic displacement
parameters were refined with O—H distances restrained to 0.84(2) Å . All calculations
were carried out using the WinGX software package [38].

133
Bibliography
[1] K. Binnemans, Chem. Rev. 109, 4283 (2009).
[2] K.-Y. Hsieh, E.-E. Bendeif, S. Pillet, A. Doudouh, D. Schaniel, and T. Woike, Acta
Crystallogr. C 69, 1002 (2013).
[3] L. H. Slooff, A. Polman, F. Cacialli, R. H. Friend, G. A. Hebbink, F. C. J. M. van
Veggel, and D. N. Reinhoudt, Appl. Phys. Lett. 78, 2122 (2001).
[4] K. Kuriki, S. Nishihara, Y. Nishizawa, A. Tagaya, Y. Koike, and Y. Okamoto, J. Opt.
Soc. Am. B 19, 1844 (2002).
[5] Z. Li, J. Yu, L. Zhou, R. Deng, and H. Zhang, Inorg. Chem. Commun. 12, 151
(2009).
[6] S. I. Klink, L. Grave, D. N. Reinhoudt, F. C. J. M. van Veggel, M. H. V. Werts, F. A.
J. Geurts, and J. W. Hofstraat, J. Phys. Chem. A 104, 5457 (2000).
[7] R. J. Reeves, C. Polley, and J. S. Choi, J. Lumin. 129, 1673 (2009).
[8] A. Mussot, M. L. Parquier, B. Berrier, M. Perard, and P. Szriftgiser, Opt. Commun.
282, 988 (2009).
[9] E. O. Serqueira, N. O. Dantas, G. H. Silva, V. Anjos, M. J. V. Bell, and M. A.
Pereira-da-Silva, Chem. Phys. Lett. 504, 67 (2011).
[10] J. C. Pivin, A. Podhorodecki, R. Kudrawiec, and J. Misiewicz, Opt. Mater. 27, 1467
(2005).
[11] E. Steveler, H. Rinnert, and M. Vergnat, J. Appl. Phys. 110, 113518 (2011).
[12] Ehrt D., Ebendorff-Heidepriem H., and Seeber W., J. Non-Cryst. Solids 183, 191
(1995).
[13] S. Tanabe, K. Hirao, and N. Soga, J. Non-Cryst. Solids 142, 148 (1992).
[14] V. I. Bukin, Dokl Akad Nauk SSSR 207, 1332 (1972).
[15] L. N. Dem’yanets and E. N. Emel’yanova, Kristallografiya 14, 753 (1969).
[16] R. A. Zehnder, D. L. Clark, B. L. Scott, R. J. Donohoe, P. D. Palmer, W. H. Runde,
and D. E. Hobart, Inorg. Chem. 49, 4781 (2010).
[17] J. Pisarska, J. Mol. Struct. 887, 201 (2008).
[18] I. A. Sokolov, I. V. Murin, N. A. Mel’nikova, and A. A. Pronkin, Glass Phys. Chem.
29, 291 (2003).
[19] A. Habenschuss and F. H. Spedding, Acta Crystallogr. C 9, 71 (1980).
[20] M. L. Steele and D. L. Wertz, Inorg. Chem. 16, 1225 (1977).

134
[21] C. L. Farrow, P. Juhas, J. W. Liu, D. Bryndin, E. S. Božin, J. Bloch, T. Proffen, and S.
J. L. Billinge, J. Phys. Condens. Matter 19, 335219 (2007).
[22] D. G. Karraker, Inorg. Chem. 7, 473 (1968).
[23] K. Gatterer, G. Pucker, H. . Fritzer, and S. Arafa, J. Non-Cryst. Solids 176, 237
(1994).
[24] C. C. Perry and S. Aubonnet, J. Sol-Gel Sci. Technol. 13, 593 (1998).
[25] R. M. Almeida, X. Orignac, and D. Barbier, J. Sol-Gel Sci. Technol. 2, 465 (1994).
[26] G. Oczko, J. Alloys Compd. 300–301, 414 (2000).
[27] A. Habenschuss and F. H. Spedding, J. Chem. Phys. 70, 3758 (1979).
[28] A. Habenschuss and F. H. Spedding, J. Chem. Phys. 70, 2797 (1979).
[29] A. Habenschuss and F. H. Spedding, J. Chem. Phys. 73, 442 (1980).
[30] D. A. Keen, J. Appl. Crystallogr. 34, 172 (2001).
[31] C. Kepert, B. Skelton, and A. White, Aust. J. Chem. 47, 385 (1994).
[32] A. H. Narten and H. A. Levy, J. Chem. Phys. 55, 2263 (1971).
[33] A. H. Narten and H. A. Levy, Science 165, 447 (1969).
[34] A. Cervellino, J. Schefer, L. Keller, T. Woike, and D. Schaniel, J. Appl. Crystallogr.
43, 1040 (2010).
[35] Oxford Diffraction, CrysAlis CCD and CrysAlis RED (Oxford Diffraction Ltd, Yarnton,
Oxfordshire, England, 2009).
[36] R. H. Blessing, J. Appl. Crystallogr. 30, 421 (1997).
[37] G. M. Sheldrick, Acta Crystallogr. A 64, 112 (2007).
[38] L. J. Farrugia, J. Appl. Crystallogr. 45, 849 (2012).

General conclusion and perspectives
Molecular hybrid materials have been prepared by embedding photofunctional molecules into porous silica hosts with different pore sizes. Two main strategies, based on the sol-gel procedure, have been developed in this work for the incorporation of the molecular guest into the silica matrix, namely, post-doping and pre-doping. We have focused our investigations in this work on two different photoactive complexes: the photo-isomerisable (Na2[Fe(CN)5NO]·2H2O, SNP) complex and the luminescent [NdCl2(H2O)6]Cl compound.
In the case of SNP@SiO2 the wet-impregnation technique resulted in the formation of isolated molecules when using hosts with pore sizes in the range of 1-3 nm and of small nanoparticles of about 6-7 nm (value determined from PDF analysis) for silica matrices with pore sizes of about 5-6 nm (value determined from BET analysis). The detailed structural analysis of these materials has been performed by using appropriate multiscale approach combining the solid state NMR and pair distribution function analysis based on total X-ray scattering data. The differential PDF modelling allowed for the structural description of the encapsulated SNP complexes. It could be shown that the SNP complex is included as isolated guest in the 1-3 nm pores and the mutual arrangement of [Fe(CN)5NO]2- anion and Na+ cation could be inferred from the comparison of model structures and experimental PDF. The multi-nuclei solid state NMR experiments have provided evidence that the gel matrix structure is not modified by the SNP embedding process. Furthermore, the NMR investigations confirmed the isolated nature of the guest complex and indicated in addition that the SNP guests are highly mobile in the pores (rotational movement below the µs timescale). In the sample with 5 nm pores two types of structural arrangement are taken: besides the small SNP
135

nanoparticles with diameter of about 6-7 nm a second SNP population is present, exhibiting the same signature as the isolated SNP complexes found in the 1 nm pores. Again NMR measurements confirm the presence of these two SNP populations and furthermore allow estimate the fraction of the second phase to be lower than 30%. Moreover, using infrared spectroscopy we could show that the embedded SNP retains its interesting optical properties and that its photoswitching characteristics are independent of the particle size. Further solid state NMR measurements coupled to PDF analysis over a wide range of temperature will shed light on the motional regimes present inside the pore which allows obtaining more relevant structural information.
As a second example the SiO2 matrices were impregnated with an aqueous solution of [NdCl2(H2O)6]Cl salt. In this case the complex changes its coordination upon embedding and adopts the nona-coordinated [Nd(H2O)9]3+ configuration surrounded by a hydration shell containing several water molecules and the three Cl- counter ions. The coordination of Nd3+ by 9 water molecules could be unambiguously determined from the PDF analysis as well as from the Debye function analysis. The modeling of the hydration shell is more complicated: while a static model accounts for the remaining peaks in the experimental patterns, it is not suitable to perform complete refinements. In fact one would probably need to simulate a dynamical model of the [Nd(H2O)9]3+ - H2O- Cl- system in order to explain the clearly visible distances in the short range and to account for their washing out in the medium to long range distances. Furthermore, in this system the impregnation of the matrices with 1-3 nm, 5 nm and 11 nm resulted in a very similar diffraction pattern suggesting that in all three cases the same structural configuration is adopted. Thus in this case the impregnation did not yield nanoparticles for the larger pore sizes. The absorption and luminescence properties are in agreement with the structural interpretation as a nona-coordinated neodymium complex. Interestingly, the photoluminescence measurements show that the luminescence intensity decreases with increasing pore size. This behavior can be induced either by the decrease of the neodymium species ( i.e., decrease of Nd3+ ions number) within the matrix pores or by the concentration quenching effect that results from non-radiative energy transfer processes between Nd3+ ions. In this respect, time dependent PL measurements will be very beneficial to determine the origin of such behavior.
From a methodological point of view the two structural studies of SNP and [NdCl2(H2O)6]Cl embedded into silica matrices yielded some interesting results. On the example of SNP@SiO2 we could show that the PDF obtained from laboratory data with
136

a significantly lower Qmax (17 Å-1 compared to 25 Å-1 for the synchrotron data) allows extracting the same structural information, although with lower precision especially in the range below 5 Å. It is noteworthy that the difference in quality of fit between synchrotron and laboratory measurement is smaller for the amorphous samples (empty SiO2 host and SNP@SiO2) compared to the crystalline reference (SNP powder).
The example with the rare earth compound shows that the refinement in reciprocal space using the Debye Function yields results of comparable quality as the refinement in real space using the R(r) analysis. We note here that in this exemplary case we deal with limited cluster sizes, which is in favor of the DFA. Finally, we see in this example also the limitations of both approaches in modeling the second coordination sphere of a dynamical system. In view of this, the molecular structure will be greatly complemented by using locale probe techniques such as solid state NMR and therefore more extensive and accurate structural properties can be obtained.
137

138

List of publications related to this work
Z. Tahri, R. Lepski, K.-Y. Hsieh, E.-E. Bendeif, S. Pillet, P. Durand, T. Woike, and D. Schaniel, Phys. Chem. Chem. Phys. 14, 3775 (2012), “Properties of metastable linkage NO isomers in Na2[Fe(CN)5NO]·2H2O incorporated in mesopores of silica xerogels”
K.-Y. Hsieh, E.-E. Bendeif, S. Pillet, A. Doudouh, D. Schaniel, and T. Woike, Acta Crystallogr. C 69, (2013), “Structural reinvestigation of the photoluminescent complex [NdCl2(H2O)6, Cl]”
K.-Y. Hsieh, E.-E. Bendeif, A. Gansmuller, S. Pillet, D. Schaniel, and T. Woike, RSC Advances, (2013), “Structure and dynamics of single molecules confined in a mesoporous silica matrix: a joint NMR and PDF characterisation”, accepted.

Conference & School
Hercules: Neutron and Synchrotron Radiation (Session A: Physics and Chemistry of Condensed Matter): Poster, Grenoble, 2011/2/27
Journées Philip Coppens Oral, Nancy, 2011/9/20
ADD workshop: Analysis of Diffraction Data in Real Space
Poster, Grenoble, 2011/10/12, Laue Day and 20th Annual Meeting of the German Crystallographic Society (DGK)
Poster, Munich (Germany), 2012/03/12, DISCUS simulation package workshop
Erlangen (Germany), 2012/09/13 Ecole Doctorale de Chimie et Physique Moléculaires (Journée Scientifique)
Oral, Metz, 2012/11/08 GDR MCM-2 : Magnétisme et Commutation Moléculaires
Oral, Dourdan, 2012/12/15

This journal is c the Owner Societies 2012 Phys. Chem. Chem. Phys., 2012, 14, 3775–3781 3775
Cite this: Phys. Chem. Chem. Phys., 2012, 14, 3775–3781
Properties of metastable linkage NO isomers in Na2[Fe(CN)5NO]�2H2O
incorporated in mesopores of silica xerogels
Zakaria Tahri,aRobert Lepski,
bKuan-Ying Hsieh,
aEl-Eulmi Bendeif,
a
Sebastien Pillet,aPierrick Durand,
aTheo Woike
cand Dominik Schaniel*
a
Received 16th November 2011, Accepted 13th January 2012
DOI: 10.1039/c2cp23607a
We study the properties of photoinduced metal–nitrosyl linkage isomers in sodium nitroprusside
(SNP) as a function of particle size. By embedding the molecular complex at various
concentrations into mesopores of silica xerogels the size of the particles can be adjusted. The
ground state is characterized by X-ray diffraction, absorption and infrared spectroscopy. The
physical properties of the photoswitched molecules were analysed by steady-state low-temperature
absorption, infrared spectroscopy and by nanosecond transient absorption spectroscopy. The
electronic structure as well as the activation energies of the metastable linkage isomers are
independent of the particle size down to single isolated molecules, indicating that the SNP
complexes are quasi-free inside the pores of the gel.
1 Introduction
The generation of photoinduced nitrosyl linkage isomers in
Na2[Fe(CN)5NO]�2H2O (SNP) is connected with a photochromic
and photorefractive response of the material which renders it
interesting for optical applications.1–6 Such applications would
demand a more robust and industrial processing than growing
single crystals. A potential route to applicable materials is the
embedding of the complex into polymers or sol–gel basedmaterials
like silica or titania matrices or the deposition on functionalized
surfaces.7–20 From a fundamental point of view it is interesting to
study the properties of the complex and its photoinduced linkage
isomers as a function of particle size and variation of the environ-
ment. First studies of (CN3H6)2[Fe(CN)5NO] embedded in bulk
silica xerogels indicated that the structure of the complex remains
close to that found in single crystals21 and that the [Fe(CN)5NO]-
molecule retains its ability to form linkage isomers.11 In the case
where the molecule is electrostatically attached to thin films of
mesoporous TiO2 deposited on silicon, the photofunctionality is
changed towards a release of the NO and CN ligands upon
irradiation.13 These different functionalities depend on the electronic
structure and on the characteristics of the potential energy surface.
The generation of linkage isomers in such Xn[ML5NO]yH2O
complexes with different transition metals M such as nickel,23,24
ruthenium,25–29 osmium,30 iron,31 platinum,32,33 different ligands
L such as F, Cl, Br, I, OH, CN, NH3, NO2, pyridine, different
counter ions Xn such as (CN3H6), alkali, earth alkali, halogen, NH4,
and different amounts y of crystal water34 can be described in a
generalized potential scheme as illustrated in Fig. 1.22 The optical
excitation leads to a change in the bond between the central metal
atom M and the NO ligand which triggers the rotation of the NO
group. If the excited state potential possesses a minimum close to
the saddle point of the ground state surface between the ground
state (GS) and the metastable state S1 or S2 or crosses that surface,
the relaxation towards S1 or S2 can occur. It was recently
shown that the relaxation into S2 occurs with a time constant of
200 femtoseconds.35 The NO ligand rotates from the N-bound
Fig. 1 Potential scheme illustrating the characteristic points of the
potential surface and relaxation pathways during generation of linkage
isomers in ML5NO compounds.22
a CRM2 UMR 7036, Institut Jean Barriol, Universite de Lorraine,BP 70239, 54506 Vandoeuvre les Nancy, France.E-mail: [email protected];Fax: 0033 383 684300; Tel: 0033 383 684889
b I. Physikalisches Institut, Universitat zu Koln, Zulpicher Str. 77,50674 Koln, Germany
c Institut fur Strukturphysik, TU Dresden, Zellescher Weg 16,Dresden, Germany
PCCP Dynamic Article Links
www.rsc.org/pccp PAPER
Dow
nloa
ded
by U
nive
rsite
Hen
ri P
oinc
are
Nan
cy o
n 30
Apr
il 20
12Pu
blis
hed
on 0
8 Fe
brua
ry 2
012
on h
ttp://
pubs
.rsc
.org
| do
i:10.
1039
/C2C
P236
07A
View Online / Journal Homepage / Table of Contents for this issue

3776 Phys. Chem. Chem. Phys., 2012, 14, 3775–3781 This journal is c the Owner Societies 2012
configuration (M–N–O) in GS either to the O-bound configuration
M–O–N (S1) by nearly 1801 or by about 901 to the side-on bound
configuration MzON (S2).36–38 These new structures correspond
to two different potential minima (S1, S2) in the relaxed GS
potential.22,39,40 In SNP the linkage isomers are separated from
the GS by potential barriers of EA = 0.68 eV (S1) and EA =
0.47 eV (S2), so that at low temperatures they exhibit lifetimes
t 4 106 s.41 At low temperature the population, i.e. number of
transferred molecules into S1 or S2, depends on the absorption
cross sections sGS,S1,S2 for population and depopulation that
establish the photostationary state. In order to explore the proper-
ties of isolated ML5NOmolecules and the generation conditions of
photoinduced linkage isomers in these conditions we studied the
electronic structure and potential energy surface of SNP embedded
in silica xerogels using X-ray diffraction, absorption and infrared
spectroscopy, and transient transmission measurements.
2 Experimental details
2.1 Synthesis of silica–SNP hybrids
Silica–SNP hybrids were prepared following the two slightly
different procedures described hereafter.
(1) Procedure A: 1.5 ml of tetramethoxysilane (TMOS, 98%
purity, Fluka), 1.8 ml of methanol (VWR) and 3.6 ml of distilled
water were mixed and stirred for 5 minutes which allowed the
solution to gel. Then 3.1 ml of two different concentrations
(0.1 mol l�1 and 0.01 mol l�1) of aqueous SNP solutions were
added and stirred for another 5 minutes in a glass dish. The
mixtures were kept at 50 1C for 7 days in an oven and dried
at room temperature in air for 1 week. The resulting SNP
concentrations were 310 and 31 mmol per gel.
(2) Procedure B: 1.5 ml of TMOS, 1.8 ml of methanol
(VWR) and 3.6 ml of distilled water and different amounts
of 0.25 mol l�1 aqueous SNP solutions were mixed and stirred
for about 30 minutes. The amount of water was kept constant
at 3.6 ml, e.g., when 2.0 ml of aqueous SNP solution was
added only 1.6 ml of pure H2O was added. By varying the
amount of added SNP solution the concentration of SNP was
varied between 12.5 and 875 mmol per gel. After 30 minutes the
gels in the glass dish were covered by parafilm or a cap and put
into a dry chamber for 1 week at 50 1C in order to allow for
complete gelation. Then small holes were pierced into the
parafilm or the cap in order to allow for a complete evaporation
of remaining solvents in about 1 week. Then the parafilm or cap
was completely removed and the gel dried for further 4–8 weeks
in the dry cabinet. Finally the dried gels were put in an exsiccator
at 10�3 mbar in order to remove remaining solvent molecules.
2.2 X-Ray diffraction
X-Ray powder diffraction measurements were performed on a
PANalytical XPert system equipped with a reflection spinner,
scanning 2y from 5 to 681 using CuKa1 radiation (l=1.5406 A).
The particle size L of embedded nanoparticles of SNP was
determined from the broadening of the Bragg peaks according
to Scherrer’s formula D(2y) =K/l cosy0 using the Scherrer factorK=0.9 for the Bragg peak at 2y0 = 30.91 corresponding toQ=
4p siny0/l = 2.173 A�1 (see Fig. 2).
2.3 UV/Vis and infrared spectroscopy
UV-Vis absorption spectra were recorded using a Shimadzu
UV-3600 UV-Vis-NIR spectrophotometer. For the low-
temperature measurements a home-built cryostat was used,
where the sample was positioned in a N2 gas atmosphere. The
double-walled cryostat is equipped with glass windows that allow
for measurement and in situ illumination of the samples. The
molar extinction coefficient e(l) was determined according to the
Lambert–Beer law E(l) = �log(I/I0) = a(l)d = e(l)cd, whereE(l) denotes the measured absorption, I and I0 the intensity of
the probe and reference beam, c the concentration of SNP
complexes in the sample, and d the thickness of the sample.
Knowing the volume of the prepared disk-like samples (proce-
dure B), VGel = pr2d, r being the radius of the disk and d the
thickness, the concentration of samples is given by c = n/VGel, n
being the number of moles per gel, as indicated above. The
infrared spectra were collected using a Nicolet 5700 FTIR
Fig. 2 X-Ray diffraction pattern of xerogels with different concen-
trations of SNP synthesized according to procedures A (top) and B
(bottom). With decreasing concentration the particle size of the
embedded SNP decreases as can be seen from the broadening and
subsequent disappearance of the Bragg peaks. The dotted line
indicates the powder diffraction pattern of crystalline SNP.
Dow
nloa
ded
by U
nive
rsite
Hen
ri P
oinc
are
Nan
cy o
n 30
Apr
il 20
12Pu
blis
hed
on 0
8 Fe
brua
ry 2
012
on h
ttp://
pubs
.rsc
.org
| do
i:10.
1039
/C2C
P236
07A
View Online

This journal is c the Owner Societies 2012 Phys. Chem. Chem. Phys., 2012, 14, 3775–3781 3777
spectrometer with a resolution of 2 cm�1. The samples were
finely ground, mixed with KBr, and pressed to pellets. To ensure
good thermal contact for the low-temperature measurements the
pellets were contacted with silver paste on the cold finger of a
home-built cryostat. The samples were cooled to liquid nitrogen
temperature (80 K) in the evacuated sample chamber (10�6
mbar). The cryostat is equipped with CsI windows allowing for
collection of spectra in the range 8000–260 cm�1 and for in situ
illumination with lasers. The excitation of the samples at low
temperature was performed with different laser sources with
wavelengths ranging from 325 nm up to 1064 nm.
2.4 Time-resolved transmission measurements
The generation and relaxation of light-induced metastable
states at different temperatures in a SNP crystal and the
different SNP gels are measured by transient absorption
spectroscopy with nanosecond time resolution. The pump
pulses that excite the sample were provided by a Surelitet
laser with wavelength lp = 532 nm corresponding to the
frequency doubled pulse of the fundamental at l = 1064 nm,
with a pulse duration of tp = 5 ns. This pump pulse is guided
by two mirrors and focussed by a lens in order to obtain a
diameter of about dp = 0.4 cm on the sample surface and an
energy of 35 mJ per pulse. The pump laser pulse is delivered on
demand by an external control. The probe light was provided
by a cw He–Ne laser centred at 632.8 nm that was focussed by
a lens to a spot size much smaller than the pump pulse in order
to ensure proper overlap of the probe and pump pulse on
the sample position. The probe light is detected by a 200 MHz
Si-Pin diode from Femto Messtechnik GmbH. The output
voltage of the detector is sampled using a 1.5 GHz oscilloscope
(Lecroy Wavepro 715zi). The trigger is obtained from another
fast Si-Pin diode (Thorlabs PE310) that detects a part of the
reflected light from the first guiding mirror. In order to block
the pump light a color filter RG610 (FGL610 Thorlabs) and
an interference filter IR632.8 (Coherent, FWHM = 10 nm)
are mounted in front of the probe diode, attenuating the
532 nm light by a factor of 10�6. The measurements are performed
as a function of temperature in the range 190–290 K. For this
reason, the samples are mounted on the cold finger of an Oxford
Instruments cryostat in a sample holder sandwiched between two
thin glass plates to ensure good thermal contact and plane surfaces.
The optical absorption changes induced due to the excitation of
metastable states are measured as ali= (1/d)ln(I(t=0)/I(t)), where
d is the thickness of the sample and I(t) and I(t = 0) are,
respectively, the intensity of the probe beam measured after and
before the pulse irradiation. A typical trace is obtained by averaging
100 acquisitions in order to improve the signal to noise ratio.
3 Experimental results and discussion
3.1 Structural characterization
The synthesized xerogels with embedded SNP were characterized
by X-ray diffraction. The top panel of Fig. 2 shows the powder
diffraction patterns of the two samples prepared according
to procedure A. For the sample with higher concentration
(c = 0.1 mol l�1 corresponding to 310 mmol SNP in the gel)
Bragg peaks are clearly visible and can be attributed to the
structure of SNP (orthorhombic, space group Pnnm).36 The
reference diffraction pattern of a SNP powder sample is indicated
by dashed lines in Fig. 2. The peak positions of the particles
formed within the gel and that of the crystalline reference sample
coincide perfectly, clearly showing that the embedded particles
exhibit the same structure as the crystalline phase of SNP.
The peaks of the SNP xerogel sample are broadened and the
evaluation of the broadening according to Scherrer’s formula
yields a particle size of 83 nm. Note that this particle size
corresponds to an average particle size. In fact the peaks exhibit
an even more broadened base indicating the presence of particles
smaller than 83 nm in the gel. The broad peak at Q= 1.6 A�1 is
due to the amorphous SiO2 matrix. For the sample with a ten
times lower concentration (c = 0.01 mol l�1 corresponding to
31 mmol SNP in the gel) no traces of Bragg peaks could be
detected, indicating that SNP is embedded as isolated complexes
in the pores of the xerogel.21 It is worth noting in this case that
the amount of water used in the synthesis is identical for the two
samples with different SNP concentrations; the porosity of the
corresponding formed xerogel is thus expected to be quite similar
and of the order of 1 nm.21 As a consequence, the size of the
embedded particles is independent of the pore size, indicating
that the nanoparticles are formed before the xerogel matrix has
become too rigid.
The bottom panel of Fig. 2 shows the powder diffraction
patterns of four samples prepared according to procedure B at
concentrations of 875, 750, 625, and 500 mmol per gel. The average
particle sizes determined from the peak broadenings are 200 nm for
a concentration of 875 mmol SNP per gel and 11 nm for 750 mmol
SNP per gel. In the sample with 625 mmol SNP per gel the peaks
are so broad that the analysis becomes difficult. An estimate yields
particles of size 2–3 nm. At concentrations of 500 mmol and less
SNP per gel no traces of Bragg peaks could be detected indicating
again that SNP is embedded in the form of isolated complexes.
These structural measurements clearly show that the initial
concentration of SNP in the gel solution determines the particle
size. For low enough concentrations the SNP complexes occur
isolated in the pores of the xerogels, a result that is in agreement
with previous studies.11,21 We note however that different
procedures of sol–gel production lead to different results with
respect to the size of embedded particles. By procedure A a
concentration of 310 mmol SNP in the gel produces rather large
particles of 83 nm, while the same concentration in procedure B
results in isolated molecules in the gel. In procedure A the
amount of H2O used in the synthesis was superior compared
to that in the procedure B (6.7 ml vs. 3.1 ml). It is known that the
gelation is slowed down when the amount of H2O in the starting
solution is increased. The SNP guest has thus more time to
crystallize in procedure A, a fact which explains the observed
larger particle sizes for lower concentrations obtained in proce-
dure A compared to B. It would be thus important to measure
the particle size within each synthesized sample, as small varia-
tions in the sol–gel process can lead to quite different results.
3.2 Properties of linkage isomers
Infrared spectroscopy is a fast and efficient tool to identify the
photoinduced linkage isomers, which is suitable also for the
characterization of molecules embedded in silica matrices.11
Dow
nloa
ded
by U
nive
rsite
Hen
ri P
oinc
are
Nan
cy o
n 30
Apr
il 20
12Pu
blis
hed
on 0
8 Fe
brua
ry 2
012
on h
ttp://
pubs
.rsc
.org
| do
i:10.
1039
/C2C
P236
07A
View Online

3778 Phys. Chem. Chem. Phys., 2012, 14, 3775–3781 This journal is c the Owner Societies 2012
Fig. 3 shows the infrared spectra collected at 80 K in the range
1550–2250 cm�1 in a gel with 375 mmol SNP that was
synthesized using procedure B. This corresponds to a concen-
tration where SNP is embedded as an isolated complex in the
pores of the silica matrix. In the GS we can clearly identify the
n(NO) and n(CN) stretching vibrations at 1947 and 2149 cm�1,
respectively. The band at 1650 cm�1 is the deformation mode
d(H2O) of water, which is very broad due to the disordered
position of the H2O molecules and possibly the presence of
hydrogen bonds within the pores. Compared to crystalline
SNP, where the n(NO) and n(CN) stretching vibrations are
found at 1947 and 2147 cm�1, respectively,42 no significant
shifts are observed. However the fourfold splitting of the
n(CN) stretching vibrations (2147, 2163, 2168, 2177 cm�1)
present in crystalline SNP has disappeared in the gel. This and
the broadening of all vibrations are due to the lack of the
crystalline environment in the gel and a consequence of the
disordered arrangement and the environment of isolated
molecules in the mesopores of the xerogel.
The illumination with 458 nm at 80 K generates the
metastable state S1, which can be identified by a new n(NO)
band appearing at 1828 cm�1. The decrease in the area of the
GS band at 1947 cm�1 yields the amount of transferred
molecules, i.e. the population of S1, of 17%. A subsequent
illumination with 1064 nm transfers the molecules from
S1 towards S2 and partially back to GS. As can be seen from
Fig. 3 the S1 band disappears and the GS band increases. The
new band of S2 is hidden in the H2O absorption band, but can
be identified from a difference spectrum, shown as the inset.
The band of S2 is found at 1684 cm�1 and the population
determined from the GS area is about 7%. Compared to the
crystalline SNP, where the n(NO) stretching vibrations of
S1 and S2 are found at 1835 and 1664 cm�1, respectively, we
observe a shift of 7 and 20 cm�1 for S1 and S2, respectively.
The large width of the two bands in the xerogel samples of
40 and 60 cm�1 for S1 and S2 is a clear hint for the disordered
arrangement of the molecules within the pores and possibly
weak interactions with the matrix, e.g. with OH groups on the
pore surfaces. In general we could expect that S2 with its side-
on position reacts more sensitively upon small local structural
changes that could occur in the isolated complexes in the gel
compared to the crystalline packing,21 which might explain the
more pronounced broadening. The population of 17% is in
the range of the population achieved in powder samples
indicating that the orientation of the fourfold axis of the
molecules is statistically distributed.
UV-Vis absorption spectroscopy delivers information about
the electronic structure of the compound in its different configu-
rations. In the case of photoinduced metastable linkage isomers,
the low temperature measurements yield in addition information
about the spectral ranges for photoswitching.43 Fig. 4 shows the
absorption spectra in the GS at 95 K for two SNP silica xerogel
hybrids. Both have concentrations below the threshold for
nanoparticle formation, i.e. less than 500 mmol SNP per gel
synthesized according to procedure B. The left part of Fig. 4
shows the absorption spectrum of a 400 mmol SNP gel with the
two absorption bands at 19 300 cm�1 (I) and 25 600 cm�1 (II)
with molar extinction coefficients of e(I) = 8 M�1 cm�1 and
e(II) = 25 M�1 cm�1 (deconvolution with Gaussian bands). The
right hand side shows the absorption spectrum of a 62.5 mmol
SNP gel for illustration of the high-energy bands at 31600 cm�1
(III) and 37000 cm�1 (IV). The lower concentration simply allows
for measuring up to higher energies. The molar extinction coeffi-
cients are e(III) = 70 M�1 cm�1 and e(IV) = 900 M�1 cm�1
(estimated value). For comparison the four absorption bands in
crystalline SNP are found at 19800 cm�1 (I), 25950 cm�1 (II),
31750 cm�1 (III), and 37600 cm�1 (IV) for polarization along the
crystallographic a-axis.43 There is thus only a slight redshift of
maximal 500 cm�1 in the xerogel compared to the crystal, an effect
known from SNP in solutions.44,45 Consequently the assignment
of the absorption bands to the transitions dxy - p(NO)
(I, HOMO–LUMO), dxz,yz - p(NO) (II), dxy - dz2 (III) and
dxz,yz - dz2 (IV) is the same as found in single crystals43 and
solutions.44
In order to explore the electronic structure of S1 and S2 we
performed absorption measurements at low temperature after
illumination with 488 nm and subsequent illumination withFig. 3 Infrared spectra at T=80 K of a SNP xerogel in GS and after
irradiation with 458 nm and 1064 nm for S1 and S2, respectively.
Fig. 4 Absorption spectrum of SNP embedded in silica xerogels at
95 K. The concentrations of SNP are 400 mmol (left) and 62.5 mmol
(right), such that SNP is embedded in the form of isolated complexes
in the mesopores of the silica host. The dotted curves I–IV denote the
Gaussian deconvolution of the spectrum.
Dow
nloa
ded
by U
nive
rsite
Hen
ri P
oinc
are
Nan
cy o
n 30
Apr
il 20
12Pu
blis
hed
on 0
8 Fe
brua
ry 2
012
on h
ttp://
pubs
.rsc
.org
| do
i:10.
1039
/C2C
P236
07A
View Online

This journal is c the Owner Societies 2012 Phys. Chem. Chem. Phys., 2012, 14, 3775–3781 3779
1064 nm. The results on the gel with 375 mmol SNP are shown in
Fig. 5 and 6 for S1 and S2, respectively. Two bands attributed to
S1 are found at 13000 cm�1 with e(I) = 1.5 M�1 cm�1 and at
29300 cm�1 with e(II)= 640M�1 cm�1 (from the fit). For S2 two
bands are found at 14300 cm�1 with e(I)= 0.68M�1 cm�1 and at
16200 cm�1 with e(II) = 0.75 M�1 cm�1 (from the fit). The
corresponding populations for S1 and S2 shown in Fig. 5 and 6
are 17(1)% and 6(1)%, respectively. Novel bands appear in the
NIR both in S1 and S2, i.e. the HOMO–LUMO transition is
shifted to lower energies. This is in agreement with the single
crystal study43 where the corresponding transitions were found at
13050 cm�1 (I) and 29300 cm�1 (II) for S1 and at 14000 cm�1 (I)
and 16350 cm�1 (II) for S2 where the reduction of symmetry lifts
the degeneracy of the p(NO) orbital. For S1 the values
are identical within errors, while for S2 a slight blueshift of the
low-lying absorption at 14000 cm�1 is observed in the gel. This
apparent blueshift most probably is due to the fact that in the
crystal the low-lying transition of S2 measured along the c-axis is
found at 17000 cm�1 and we thus would have to consider an
average position of the transitions in the gel due to the disordered
complexes. Overall we find that the generation of S1 and S2 in
SNP embedded in xerogels (as isolated complexes) occurs in the
same manner as in single crystals. Furthermore the electronic
structure is almost identical within errors. Only small shifts of the
absorption bands towards lower energies are observed, but less
pronounced than found in solutions. This indicates that the
electronic properties of the linkage isomers on a single molecule
scale embedded in a porous host remain unaffected.
A further important characteristic of the photoinduced linkage
isomers is the energy barrier that separates them from the ground
state. These activation energies can be detected by Differential
Scanning Calorimetry in single crystals.41 Unfortunately, DSC is
not applicable to the case of the low concentrations embedded in
the xerogel host, because the heatflow released is too small and
blurred by the thermal isolation properties of the surrounding host
material. However, as was shown in an earlier study46 the activation
energy (for S2) can be determined by time-resolved transmission
measurements after pulsed excitation at high temperatures. S2 has a
lifetime in the range of 100 ns at room temperature to milliseconds
at 200 K.46We therefore performed a temperature dependent study
of the lifetime of S2 excited with nanosecond laser pulses in the
temperature range 200–300 K. Fig. 7 shows the temporal decay of
the light-induced metastable state after excitation with a pulse
energy of E = 35 mJ at T = 220 K and concentrations of SNP
of 310 mmol (top) and 31 mmol (bottom). For all measured
temperatures the decay of ali(t) is mono-exponential. The open
circles and squares are the thinned data points and the solid line
corresponds to a fit of ali(t) = a0liexp(�t/t) where t is the relaxationtime (lifetime) and a0li is the amplitude of the light-induced absorp-
tion at t = 0. The amplitude of the light-induced absorption a0li(t)probed at 632 nm in the xerogels is 6.3 m�1 and 0.8m�1 for the two
samples with 310 and 31 mmol SNP per gel, respectively.
From the temperature dependence of the relaxation time t ofthe monoexponential decay the activation energy EA and the
frequency factor Z are obtained via the Arrhenius relation: t =Z�1exp(EA/kBT). Fig. 8 shows the natural logarithm of the
inverse relaxation time t�1 as a function of the inverse tempera-
ture for the xerogels. The linear fit yields the activation energy
EA = 0.36(3) eV and the frequency factor Z = 1 � 1013 s�1 for
both samples. The data and fit for lifetimes measured on a SNP
single crystal are also shown in Fig. 8. For the crystal an
activation energy of EA = 0.38(3) eV and a frequency factor
of Z = 2 � 1013 s�1 are obtained. This shows that the size
reduction to nanoparticles of 83 nm (310 mmol SNP per gel) and
to single molecules in mesopores (31 mmol per gel) does not affect
the activation energy and thus the potential energy surface. In
comparison with an earlier study on single crystals in the
temperature range 260–340 K46 where EA = 0.43(3) eV and
Z= 7� 1013 s�1 were found, we observe a slight deviation. This
can be explained by the inaccuracy of our temperature measure-
ments (the temperature is measured on the cold finger of the
cryostat). The thermal contact of the crystal sandwiched between
two glass plates as well as the thermal contact of the embedded
complexes through the silica xerogel to the coldfinger of the
cryostat is far from being perfect. Assuming a temperature gradient
Fig. 5 Absorption spectrum of GS+ S1 after illumination with 488 nm
at T=95K. I and II denote novel absorption bands due to the generation
of S1. The inset shows the difference spectrum (GS + S1) � GS.
Fig. 6 Absorption spectrum of GS+ S2 after illumination with 488 nm
and subsequently 1064 nm at T=95 K. I and II denote novel absorption
bands due to the generation of S2. The inset shows the difference
spectrum (GS + S2) � S2.
Dow
nloa
ded
by U
nive
rsite
Hen
ri P
oinc
are
Nan
cy o
n 30
Apr
il 20
12Pu
blis
hed
on 0
8 Fe
brua
ry 2
012
on h
ttp://
pubs
.rsc
.org
| do
i:10.
1039
/C2C
P236
07A
View Online

3780 Phys. Chem. Chem. Phys., 2012, 14, 3775–3781 This journal is c the Owner Societies 2012
yielding a 10 1C higher temperature in the sample we can
re-evaluate our data and find activation energies of EA =
0.40(3) eV and Z = 2 � 1013 s�1 for the two xerogel samples
and EA = 0.42(3) eV and Z=4� 1013 s�1 for the single crystal,
which correspond perfectly to the results obtained in ref. 46.
Overall we find that in SNP the electronic and energetic
properties of the photoinduced linkage isomers are almost
identical for isolated complexes or nanoparticles embedded in
xerogel matrices compared to single crystals. The activation
energy and thus the lifetime of the metastable linkage isomers
remain the same. The electronic transitions and especially the
HOMO–LUMO transition remain unaffected as well and
consequently the spectral ranges for transfer between the three
NO configurations remain the same as in single crystals, except
that in the gel there is no possibility to choose the polarization
along a specific direction of the [Fe(CN)5NO] molecule. These
results underline the local nature of the linkage isomerism in
these nitrosyl complexes. While the change of counter ions or of
molecular composition, e.g. through the substitution of ligands,
significantly affects the properties of the linkage isomers,26–29 the
bare isolation of the complex (still with the presence of the
counter ion) has nearly no influence. Furthermore this study
supports the structural investigations on the relative guanidinium
nitroprusside, isolated in xerogels, where it was found that the
counter ions remain at the nearly identical position with respect
to the [Fe(CN)5NO] molecule in the gel as in the crystal.21 With
respect to potential applications these results are encouraging, as
they show us that we can produce sol–gel materials with homo-
geneously embedded nanoparticles or isolated molecules that
retain their photosensitive properties.
4 Conclusion
We have studied the influence of the embedding of SNP in
mesoporous silica xerogels on the properties of the photoinduced
nitrosyl linkage isomers in SNP. Statistically distributedmolecules
as well as nanoparticles of SNP can be incorporated or grown in
the silica matrix depending on the gelation procedures. The
generation and relaxation of the metastable states as well as their
electronic and nuclear structure are not significantly changed by
the size of SNP particles/clusters (or local concentration of the
SNP) confined in the silica matrices. In conclusion, this approach
allows us to obtain photochromic nitrosyl complexes in the form
of nano-objects or isolated complexes that retain their interesting
properties as an internal molecular effect almost isolated from the
surrounding atoms of the matrix.
Financial support by the BMBF (FKZ 03X5510) and DFG
(SCHA1550/1-1) is gratefully acknowledged.
References
1 T. Woike, W. Kirchner, G. Schetter, T. Barthel, K. Hyung-Sangand S. Haussuhl, Opt. Commun., 1994, 106, 6–10.
2 S. Haussuhl, G. Schetter and T. Woike, Opt. Commun., 1995, 114,219–222.
3 T. Woike, M. Imlau, S. Haussuhl, R. Rupp and R. Schieder, Phys.Rev. B: Condens. Matter, 1998, 58, 8411–8415.
Fig. 7 Light-induced absorption ali(t) after pulsed excitation with
nanosecond laser pulses (35 mJ per pulse at 532 nm) for two hybrid
xerogels with 310 mmol (top) and 31 mmol (bottom) SNP per gel and
thickness d= 0.8 mm and d= 1.9 mm, respectively. The absorption is
probed at 632 nm and 220 K. The solid line corresponds to a mono-
exponential fit with relaxation times t = 2 � 10�5 s.
Fig. 8 Arrhenius plot of the relaxation times for two xerogels with
310 mmol (empty squares) and 31 mmol (full triangles) SNP per gel,
respectively. Empty circles denote the relaxation times found in a
single crystal of SNP. The absorption is probed at 632 nm. The solid
line corresponds to linear fits yielding the activation energies EA =
0.36(3) eV for the xerogel hybrids and EA = 0.38(3) eV for the SNP
crystal. The frequency factors areZ=1� 1013 s�1 andZ=2� 1013 s�1
for the xerogel hybrids and the crystal, respectively.
Dow
nloa
ded
by U
nive
rsite
Hen
ri P
oinc
are
Nan
cy o
n 30
Apr
il 20
12Pu
blis
hed
on 0
8 Fe
brua
ry 2
012
on h
ttp://
pubs
.rsc
.org
| do
i:10.
1039
/C2C
P236
07A
View Online

This journal is c the Owner Societies 2012 Phys. Chem. Chem. Phys., 2012, 14, 3775–3781 3781
4 T. Woike, S. Haussuhl, B. Sugg, R. Rupp, J. Beckers, M. Imlauand R. Schieder, Appl. Phys. B: Lasers Opt., 1996, 63, 243–248.
5 D. Schaniel, M. Imlau, T. Weisemoller, T. Woike, K. Kramer andH. U. Gudel, Adv. Mater., 2007, 19, 723–726.
6 M. Goulkov, D. Schaniel and T. Woike, J. Opt. Soc. Am. B, 2010,27, 927–931.
7 D. Levy, Chem. Mater., 1997, 9, 2666–2670.8 K. Moller and T. Bein, Chem. Mater., 1997, 10, 2950–2963.9 K. Ariga, Coord. Chem. Rev., 2007, 251, 2562–2591.
10 G. Schulz-Ekloff, D. Wohrle, B. van Duffel andR. A. Schoonheydt, Microporous Mesoporous Mater., 2002, 51,91–138.
11 A. Schuy, T. Woike and D. Schaniel, J. Sol-Gel Sci. Technol., 2009,50, 403–408.
12 B. Cormary, I. Malfant and L. Valade, J. Sol-Gel Sci. Technol.,2009, 52, 19–23.
13 V. Dieckmann, M. Imlau, D. H. Taffa, L. Walder, R. Lepski,D. Schaniel and T. Woike, Phys. Chem. Chem. Phys., 2010, 12,3283–3288.
14 R. Pardo, M. Zayat and D. Levy, J. Mater. Chem., 2009, 19,6756–6760.
15 C. Schomburg, M. Wark, Y. Rohlfing, G. Schulz-Ekloff andD. Wohrle, J. Mater. Chem., 2001, 11, 2014–2021.
16 B. Schaudel, C. Guermeur, C. Sanchez, K. Nakatani andJ. A. Delaire, J. Mater. Chem., 1997, 7, 61–65.
17 S. Wagner, F. Leyssner, C. Kordel, S. Zarwell, R. Schmidt,M. Weinelt, K. Ruck-Braun, M. Wolf and P. Tegeder, Phys.Chem. Chem. Phys., 2009, 11, 6242–6248.
18 P. G. Zanichelli, R. L. Sernaglia and D. W. Franco, Langmuir,2006, 22, 203–208.
19 F. G. Doro, U. P. Rodrigues-Filho and E. Tfouni, J. ColloidInterface Sci., 2007, 307, 405–417.
20 F. Chaput, J. Biteau, K. Lahlil, J. P. Boilot, B. Darracq, Y. Levy,J. Peretti, V. I. Safarov, G. Parent, A. Fernandez-Acebes andJ.-M. Lehn, Mol. Cryst. Liq. Cryst., 2000, 334, 77–82.
21 A. Cervellino, J. Schefer, L. Keller, T. Woike and D. Schaniel,J. Appl. Crystallogr., 2010, 43, 1040–1045.
22 D. Schaniel and T. Woike, Phys. Chem. Chem. Phys., 2009, 11,4391–4395.
23 D. Fomitchev, T. R. Furlani and P. Coppens, Inorg. Chem., 1998,37, 1519–1526.
24 P. Schaiquevich, J. Guida and P. Aymonino, Inorg. Chim. Acta,2000, 303, 277–281.
25 D. Fomitchev, P. Coppens, T. Li, K. A. Bagley, L. Chen andG. B. Richter-Addo, Chem. Commun., 1999, 2013–2014.
26 K. Ookubo, Y. Morioka, H. Tomizawa and E. Miki, J. Mol.Struct., 1996, 379, 241–247.
27 P. Coppens, I. Novozhilova and A. Kovalevsky, Chem. Rev., 2002,102, 861–883.
28 D. Schaniel, B. Cormary, I. Malfant, L. Valade, T. Woike,B. Delley, K. Kramer and H. U. Gudel, Phys. Chem. Chem. Phys.,2007, 9, 3717–3724.
29 D. Schaniel, T. Woike, B. Delley, D. Biner, K. Kramer andH. U. Gudel, Phys. Chem. Chem. Phys., 2005, 7, 1164–1170.
30 J. Guida, O. Piro and P. Aymonino, Inorg. Chem., 1995, 34, 4113–4116.31 P. Gutlich, Y. Garcia and T. Woike, Coord. Chem. Rev., 2001,
219–221, 839–879.32 D. Schaniel, T. Woike, B. Delley, D. Biner, K. Kramer and
H. U. Gudel, Phys. Chem. Chem. Phys., 2007, 9, 5149–5157.33 D. Schaniel, T. Woike, N. R. Behrnd, J. Hauser, K. Kramer,
T. Todorova and B. Delley, Inorg. Chem., 2009, 48, 11399–11406.34 H. Zollner, W. Krasser, T. Woike and S. Haussuhl, Chem. Phys.
Lett., 1989, 161, 497–501.35 D. Schaniel, M. Nicoul and T. Woike, Phys. Chem. Chem. Phys.,
2010, 12, 9029–9033.36 M. Carducci, M. Pressprich and P. Coppens, J. Am. Chem. Soc.,
1997, 119, 2669–2678.37 D. Schaniel, J. Schefer, T. Woike and V. Petrıcek, Phys. Rev. B:
Condens. Matter Mater. Phys., 2005, 71, 174112.38 D. Schaniel, J. Schefer, T. Woike and V. Petrıcek, Phys. Rev. B:
Condens. Matter Mater. Phys., 2006, 73, 174108.39 B. Delley, J. Schefer and T. Woike, J. Chem. Phys., 1997, 107,
10067–10074.40 M. Buchs, C. Daul, P. T. Manoharan and C. W. Schlapfer, Int. J.
Quantum Chem., 2002, 91, 418–431.41 D. Schaniel, T. Woike, L. Tsankov and M. Imlau, Chem. Phys.,
2005, 429, 19–23.42 J. B. Bates and R. K. Khanna, Inorg. Chem., 1970, 9, 1376.43 D. Schaniel, J. Schefer, B. Delley, M. Imlau and T. Woike, Phys.
Rev. B: Condens. Matter, 2002, 66, 085103.44 P. Manoharan and H. Gray, J. Am. Chem. Soc., 1965, 87,
3340–3347.45 M. Lynch, M. Cheng, E. Van Kuiken and M. Khalil, J. Am. Chem.
Soc., 2010, 133, 5255–5262.46 D. Schaniel, T. Woike, C. Merschjann andM. Imlau, Phys. Rev. B:
Condens. Matter Mater. Phys., 2005, 72, 195119.Dow
nloa
ded
by U
nive
rsite
Hen
ri P
oinc
are
Nan
cy o
n 30
Apr
il 20
12Pu
blis
hed
on 0
8 Fe
brua
ry 2
012
on h
ttp://
pubs
.rsc
.org
| do
i:10.
1039
/C2C
P236
07A
View Online


electronic reprint
Acta Crystallographica Section C
Crystal StructureCommunications
ISSN 0108-2701
Structural reinvestigation of the photoluminescent complex[NdCl2(H2O)6]Cl
Kuan-Ying Hsieh, El-Eulmi Bendeif, Sebastien Pillet, Abdelatif Doudouh,Dominik Schaniel and Theo Woike
Acta Cryst. (2013). C69, 1002–1005
Copyright c© International Union of Crystallography
Author(s) of this paper may load this reprint on their own web site or institutional repository provided thatthis cover page is retained. Republication of this article or its storage in electronic databases other than asspecified above is not permitted without prior permission in writing from the IUCr.
For further information see http://journals.iucr.org/services/authorrights.html
Acta Crystallographica Section C: Crystal Structure Communications specializes in therapid dissemination of high-quality studies of crystal and molecular structures of interestin fields such as chemistry, biochemistry, mineralogy, pharmacology, physics and mate-rials science. The numerical and text descriptions of each structure are submitted to thejournal electronically as a Crystallographic Information File (CIF) and are checked andtypeset automatically prior to peer review. The journal is well known for its high stan-dards of structural reliability and presentation. Section C publishes approximately 1000structures per year; readers have access to an archive that includes high-quality structuraldata for over 10000 compounds.
Crystallography Journals Online is available from journals.iucr.org
Acta Cryst. (2013). C69, 1002–1005 Hsieh et al. · [NdCl2(H2O)6]Cl

Structural reinvestigation of thephotoluminescent complex[NdCl2(H2O)6]Cl
Kuan-Ying Hsieh,a El-Eulmi Bendeif,a* Sebastien Pillet,a
Abdelatif Doudouh,a Dominik Schaniela and Theo Woikeb
aLaboratoire de Cristallographie, Resonance Magnetique et Modelisations (CRM2,
UMR CNRS 7036), Institut Jean Barriol, Universite de Lorraine, BP 70239, Boulevard
des Aiguillettes, 54506 Vandoeuvre-les Nancy, France, and bInstitut fur Struktur-
physik, TU Dresden, Zellescher Weg 16, Dresden, Germany
Correspondence e-mail: [email protected]
Received 29 May 2013
Accepted 31 July 2013
The structure of the photoluminescent compound hexaaqua-
dichloridoneodymium(III) chloride has been redetermined
from single-crystal X-ray diffraction data at 100 K, with the
aim of providing an accurate structural model for the bulk
crystalline material. The crystal structure may be described as
a network of [NdCl2(H2O)6]+ cations with distorted square-
antiprism geometry around the NdIII centre. The NdIII cation
and the nonbonded Cl� anion are both located on twofold
symmetry axes. The crystal packing consists of three different
neodymium pairs linked by a three-dimensional network of
O—H� � �Cl intermolecular interactions. The pair distribution
function (PDF) calculated from the experimentally deter-
mined structure is used for the discussion of the local
structure.
Keywords: crystal structure; rare earth materials; neodymiumcompounds; pair distribution function; optically activecompounds; photoluminescent materials.
1. Introduction
Luminescent rare earth (RE) materials have been extensively
studied over recent decades for both fundamental and appli-
cation purposes. These compounds possess narrow emission
lines and are very promising for a variety of photonic appli-
cations, such as IR lasers, as a source for optical communica-
tion networks or as light-emitting diodes; and they are very
suitable for photovoltaic devices (Slooff et al., 2001; Kuriki et
al., 2002; Klink et al., 2000; Li et al., 2009; Reeves et al., 2009).
In this respect, the Er3+- and Nd3+-based materials are among
the most investigated systems and have attracted major
interest owing to their photoluminescence behaviour.
Recently, many theoretical and experimental studies have
been devoted to Nd3+-based materials, aiming to define the
relevant parameters which control the luminescent properties
(Mussot et al., 2009; Serqueira et al., 2011; Pivin et al., 2005;
Steveler et al., 2011). It was found that the spectroscopic and
photonic properties of Nd3+-based complexes are strongly
affected by the coordination environments of the RE sites
(Ebendorff-Heidepriem et al., 1995; Tanabe et al., 1992).
Although the characterization of their optical properties has
been performed thoroughly and is quite well documented
(Pisarska, 2008; Sokolov et al., 2003), reports on their struc-
tural behaviour are still rather scarce and quite disparate.
The synthesis and X-ray single-crystal structural studies of
neodymium hydroxychloride complexes have been described
by various workers (Bukin, 1972; Dem’yanets & Emel’yanova,
1969; Habenschuss & Spedding, 1980). Recently, Zehnder et
al. (2010) established a correlation between the structural and
spectroscopic properties of the complex [NdCl(OH)2],
showing that the highly linked three-dimensional network
seems to contribute to the remarkable inertness of this
material in near-neutral aqueous environments. This could be
one of the key properties for the potential application of
actinide bis-hydroxychlorides as nuclear waste materials.
The title compound was originally determined by Haben-
schuss & Spedding (1980) as isostructural with the
[LuCl3�6H2O] complex (Habenschuss & Spedding, 1979).
Nevertheless, the 12 H atoms (six of them symmetry-inde-
pendent) were not identified, which prevents a clear inter-
pretation of the crystal packing; so no detailed structural
discussion was presented. A more complete crystallographic
analysis of this compound is therefore of interest for gaining
better insight into its structural properties.
2. Experimental
2.1. Synthesis and crystallization
Crystals of [NdCl2(H2O)6]�Cl were obtained by slow
evaporation of an aqueous solution (10�3 M) of [NdCl3-
(H2O)6] powder (99.9% purity, Fluka AG) kept at room
temperature. After a few weeks, small colourless single crys-
tals appeared.
2.2. Refinement
Crystal data, data collection and structure refinement
details are summarized in Table 1. The electron density of the
H atoms was clearly identified in a difference Fourier map, and
their atomic coordinates and isotropic displacement para-
meters were refined with O—H distances restrained to
0.84 (2) A.
3. Results and discussion
Fig. 1 shows the structure of the asymmetric unit of the title
compound, [NdCl2(H2O)6]Cl, along with the atom-numbering
scheme. Selected bond lengths and angles are listed in Table 2.
A detailed examination of the coordination of the NdIII cation
reveals a distorted square-antiprism geometry, where each
NdIII cation is located on a twofold axis and eight-fold coor-
dinated by six water molecules and two inner-sphere Cl atoms
inorganic compounds
1002 # 2013 International Union of Crystallography doi:10.1107/S0108270113021367 Acta Cryst. (2013). C69, 1002–1005
Acta Crystallographica Section C
Crystal StructureCommunications
ISSN 0108-2701
electronic reprint

(Fig. 1 and Table 2), the twofold symmetry axis bisecting the
Cl1—Nd—Cl1 and OiW—Nd—OiW (i = 1, 2 or 3) angles. The
Nd1—O bond lengths range from 2.4371 (12) to 2.4653 (11) A,
with an average value of 2.453 (14) A, and are significantly
shorter than Nd1—Cl1 [2.8180 (4) A].
Chloride ion Cl2 is located on a twofold axis, at a much
greater distance of 5.0638 (2) A from the NdIII cation, without
any evidence for a direct Nd1� � �Cl2 interaction. These inter-
atomic distances are clearly visible in the calculated atomic
pair distribution function (PDF) diagram (Fig. 2), since peaks
in the PDF pattern correspond to distances between atomic
pairs and so describe the atomic arrangement in a material
(Egami & Billinge, 2003; Billinge, 2007). In Fig. 2 we illustrate
the calculated PDF up to 10 A obtained from the crystal
structure described herein (solid line) and that from the
previously reported structure (Habenschuss & Spedding,
1980) (open circles). The highest peaks in the G(r) function
correspond to atomic pairs between the strongest atomic
scatterers in this complex, the NdIII cations, as well as the most
abundant pairs (six water molecules). Moreover, examination
of the short-scale region in the PDF diagram gives information
on the first few coordination spheres and therefore yields
extensive information about the local atomic arrangement in
inorganic compounds
Acta Cryst. (2013). C69, 1002–1005 Hsieh et al. � [NdCl2(H2O)6]Cl 1003
Table 1Experimental details.
Crystal dataChemical formula [NdCl2(H2O)6]ClMr 358.69Crystal system, space group Monoclinic, P2/nTemperature (K) 100a, b, c (A) 7.9850 (3), 6.5561 (2), 9.6727 (4)� (�) 93.655 (4)V (A3) 505.34 (3)Z 2Radiation type Mo K�� (mm�1) 5.91Crystal size (mm) 0.06 � 0.04 � 0.01
Data collectionDiffractometer Oxford SuperNova Dual (Cu at
zero, with an Atlas detector)diffractometer
Absorption correction Analytical [CrysAlis PRO (OxfordDiffraction, 2009); analyticalnumerical absorption correctionusing a multifaceted crystal modelbased on expressions derived byClark & Reid (1995)]
Tmin, Tmax 0.712, 0.943No. of measured, independent and
observed [I > 2�(I)] reflections8593, 1793, 1710
Rint 0.032(sin �/�)max (A
�1) 0.764
RefinementR[F 2 > 2�(F 2)], wR(F 2), S 0.016, 0.030, 1.03No. of reflections 1793No. of parameters 71No. of restraints 6H-atom treatment All H-atom parameters refined��max, ��min (e A�3) 0.57, �0.57
Computer programs: CrysAlis PRO (Oxford Diffraction, 2009), SHELXS97 (Sheldrick,2008), SHELXL97 (Sheldrick, 2008), WinGX (Farrugia, 2012), ORTEPIII (Burnett &Johnson, 1996), ORTEP-3 for Windows (Farrugia, 2012) and enCIFer (Allen et al.,2004).
Figure 2Comparison of the PDF [G(r) function] calculated from the crystalstructure obtained in this work (solid line) and that determined from thepreviously reported structure (open circles) (Habenschuss & Spedding,1980). The PDF diagrams were calculated using the program PDFgui(Farrow et al., 2007).
Table 2Selected geometric parameters (A, �).
Nd1—O1W 2.4371 (12) Nd1—O3W 2.4653 (11)Nd1—O2W 2.4569 (12) Nd1—Cl1 2.8180 (4)
O1W—Nd1—O1W i 83.19 (6) O3W i—Nd1—O3W 148.49 (6)O1W—Nd1—O2W 69.41 (4) O1W—Nd1—Cl1 142.94 (3)O1W i—Nd1—O2W 75.13 (4) O1W i—Nd1—Cl1 108.22 (3)O2W—Nd1—O2W i 132.01 (6) O2W—Nd1—Cl1 147.07 (3)O1W—Nd1—O3W i 70.06 (4) O2W i—Nd1—Cl1 76.39 (3)O1W i—Nd1—O3W i 138.34 (4) O3W i—Nd1—Cl1 79.32 (3)O2W—Nd1—O3W i 120.76 (4) O3W—Nd1—Cl1 77.41 (3)O2W i—Nd1—O3W i 73.11 (4) Cl1—Nd1—Cl1i 84.099 (16)
Symmetry code: (i) �x þ 32; y;�z þ 3
2.
Figure 1A projection of the title compound, showing the atom-labelling scheme.Displacement ellipsoids are drawn at the 50% probability level for allnon-H atoms. [Symmetry code: (i) �x + 3
2, y, �z + 32.]
electronic reprint
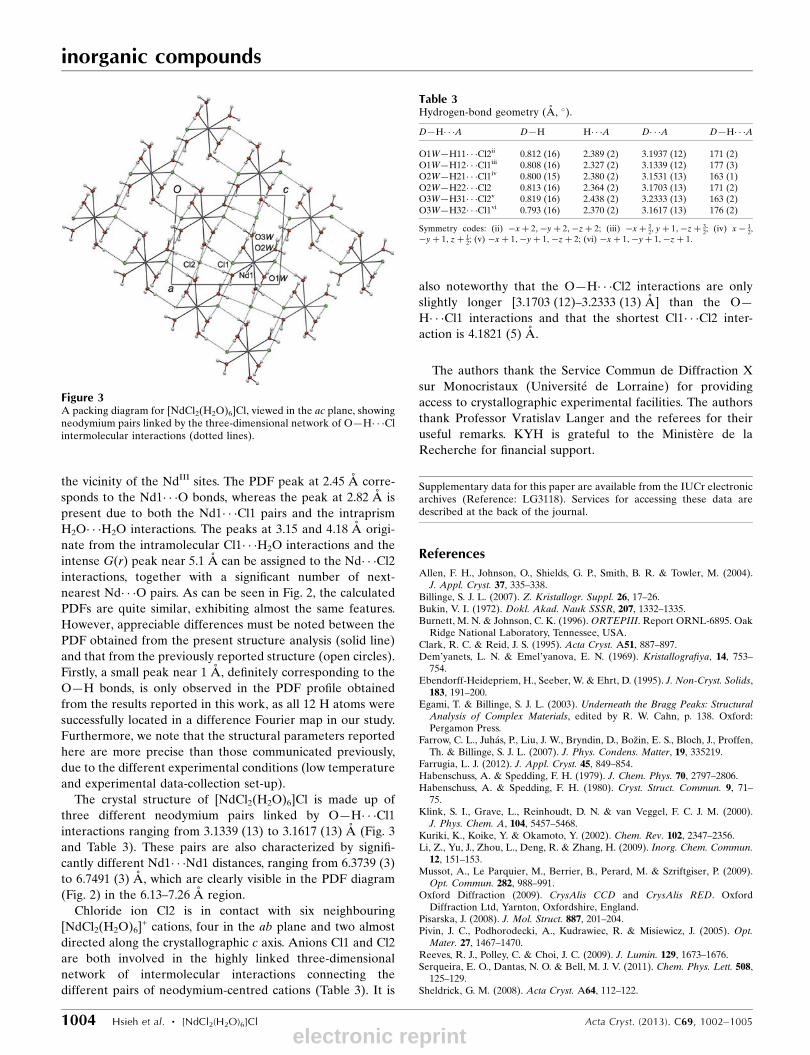
the vicinity of the NdIII sites. The PDF peak at 2.45 A corre-
sponds to the Nd1� � �O bonds, whereas the peak at 2.82 A is
present due to both the Nd1� � �Cl1 pairs and the intraprism
H2O� � �H2O interactions. The peaks at 3.15 and 4.18 A origi-
nate from the intramolecular Cl1� � �H2O interactions and the
intense G(r) peak near 5.1 A can be assigned to the Nd� � �Cl2interactions, together with a significant number of next-
nearest Nd� � �O pairs. As can be seen in Fig. 2, the calculated
PDFs are quite similar, exhibiting almost the same features.
However, appreciable differences must be noted between the
PDF obtained from the present structure analysis (solid line)
and that from the previously reported structure (open circles).
Firstly, a small peak near 1 A, definitely corresponding to the
O—H bonds, is only observed in the PDF profile obtained
from the results reported in this work, as all 12 H atoms were
successfully located in a difference Fourier map in our study.
Furthermore, we note that the structural parameters reported
here are more precise than those communicated previously,
due to the different experimental conditions (low temperature
and experimental data-collection set-up).
The crystal structure of [NdCl2(H2O)6]Cl is made up of
three different neodymium pairs linked by O—H� � �Cl1interactions ranging from 3.1339 (13) to 3.1617 (13) A (Fig. 3
and Table 3). These pairs are also characterized by signifi-
cantly different Nd1� � �Nd1 distances, ranging from 6.3739 (3)
to 6.7491 (3) A, which are clearly visible in the PDF diagram
(Fig. 2) in the 6.13–7.26 A region.
Chloride ion Cl2 is in contact with six neighbouring
[NdCl2(H2O)6]+ cations, four in the ab plane and two almost
directed along the crystallographic c axis. Anions Cl1 and Cl2
are both involved in the highly linked three-dimensional
network of intermolecular interactions connecting the
different pairs of neodymium-centred cations (Table 3). It is
also noteworthy that the O—H� � �Cl2 interactions are only
slightly longer [3.1703 (12)–3.2333 (13) A] than the O—
H� � �Cl1 interactions and that the shortest Cl1� � �Cl2 inter-
action is 4.1821 (5) A.
The authors thank the Service Commun de Diffraction X
sur Monocristaux (Universite de Lorraine) for providing
access to crystallographic experimental facilities. The authors
thank Professor Vratislav Langer and the referees for their
useful remarks. KYH is grateful to the Ministere de la
Recherche for financial support.
Supplementary data for this paper are available from the IUCr electronicarchives (Reference: LG3118). Services for accessing these data aredescribed at the back of the journal.
References
Allen, F. H., Johnson, O., Shields, G. P., Smith, B. R. & Towler, M. (2004).J. Appl. Cryst. 37, 335–338.
Billinge, S. J. L. (2007). Z. Kristallogr. Suppl. 26, 17–26.Bukin, V. I. (1972). Dokl. Akad. Nauk SSSR, 207, 1332–1335.Burnett, M. N. & Johnson, C. K. (1996). ORTEPIII. Report ORNL-6895. Oak
Ridge National Laboratory, Tennessee, USA.Clark, R. C. & Reid, J. S. (1995). Acta Cryst. A51, 887–897.Dem’yanets, L. N. & Emel’yanova, E. N. (1969). Kristallografiya, 14, 753–
754.Ebendorff-Heidepriem, H., Seeber, W. & Ehrt, D. (1995). J. Non-Cryst. Solids,
183, 191–200.Egami, T. & Billinge, S. J. L. (2003). Underneath the Bragg Peaks: Structural
Analysis of Complex Materials, edited by R. W. Cahn, p. 138. Oxford:Pergamon Press.
Farrow, C. L., Juhas, P., Liu, J. W., Bryndin, D., Bozin, E. S., Bloch, J., Proffen,Th. & Billinge, S. J. L. (2007). J. Phys. Condens. Matter, 19, 335219.
Farrugia, L. J. (2012). J. Appl. Cryst. 45, 849–854.Habenschuss, A. & Spedding, F. H. (1979). J. Chem. Phys. 70, 2797–2806.Habenschuss, A. & Spedding, F. H. (1980). Cryst. Struct. Commun. 9, 71–
75.Klink, S. I., Grave, L., Reinhoudt, D. N. & van Veggel, F. C. J. M. (2000).
J. Phys. Chem. A, 104, 5457–5468.Kuriki, K., Koike, Y. & Okamoto, Y. (2002). Chem. Rev. 102, 2347–2356.Li, Z., Yu, J., Zhou, L., Deng, R. & Zhang, H. (2009). Inorg. Chem. Commun.
12, 151–153.Mussot, A., Le Parquier, M., Berrier, B., Perard, M. & Szriftgiser, P. (2009).
Opt. Commun. 282, 988–991.Oxford Diffraction (2009). CrysAlis CCD and CrysAlis RED. Oxford
Diffraction Ltd, Yarnton, Oxfordshire, England.Pisarska, J. (2008). J. Mol. Struct. 887, 201–204.Pivin, J. C., Podhorodecki, A., Kudrawiec, R. & Misiewicz, J. (2005). Opt.
Mater. 27, 1467–1470.Reeves, R. J., Polley, C. & Choi, J. C. (2009). J. Lumin. 129, 1673–1676.Serqueira, E. O., Dantas, N. O. & Bell, M. J. V. (2011). Chem. Phys. Lett. 508,
125–129.Sheldrick, G. M. (2008). Acta Cryst. A64, 112–122.
inorganic compounds
1004 Hsieh et al. � [NdCl2(H2O)6]Cl Acta Cryst. (2013). C69, 1002–1005
Figure 3A packing diagram for [NdCl2(H2O)6]Cl, viewed in the ac plane, showingneodymium pairs linked by the three-dimensional network of O—H� � �Clintermolecular interactions (dotted lines).
Table 3Hydrogen-bond geometry (A, �).
D—H� � �A D—H H� � �A D� � �A D—H� � �A
O1W—H11� � �Cl2ii 0.812 (16) 2.389 (2) 3.1937 (12) 171 (2)O1W—H12� � �Cl1iii 0.808 (16) 2.327 (2) 3.1339 (12) 177 (3)O2W—H21� � �Cl1iv 0.800 (15) 2.380 (2) 3.1531 (13) 163 (1)O2W—H22� � �Cl2 0.813 (16) 2.364 (2) 3.1703 (13) 171 (2)O3W—H31� � �Cl2v 0.819 (16) 2.438 (2) 3.2333 (13) 163 (2)O3W—H32� � �Cl1vi 0.793 (16) 2.370 (2) 3.1617 (13) 176 (2)
Symmetry codes: (ii) �x þ 2;�y þ 2;�z þ 2; (iii) �x þ 32; y þ 1;�z þ 3
2; (iv) x � 12,�y þ 1; z þ 1
2; (v) �x þ 1;�y þ 1;�z þ 2; (vi) �x þ 1;�y þ 1;�z þ 1.
electronic reprint

Slooff, L. H., Polman, A., Cacialli, F., Friend, R. H., Hebbink, G. A., vanVeggel, F. C. J. M. & Reinhoudt, D. N. (2001). Appl. Phys. Lett. 78, 2122–2124.
Sokolov, I. A., Murin, I. V., Mel’nikova, N. A. & Pronkin, A. A. (2003). GlassPhys. Chem. 29, 291–299.
Steveler, E., Rinnert, H. & Vergnat, M. (2011). J. Appl. Phys. 110, 113518.Tanabe, S., Hirao, K. & Soga, N. (1992). J. Non-Cryst. Solids, 142, 148–
154.Zehnder, R. A., Clark, D. L., Scott, B. L., Donohoe, R. J., Palmer, P. D., Runde,
W. H. & Hobart, D. E. (2010). Inorg. Chem. 49, 4781–4790.
inorganic compounds
Acta Cryst. (2013). C69, 1002–1005 Hsieh et al. � [NdCl2(H2O)6]Cl 1005electronic reprint

supplementary materials
sup-1Acta Cryst. (2013). C69, 1002-1005
supplementary materials
Acta Cryst. (2013). C69, 1002-1005 [doi:10.1107/S0108270113021367]
Structural reinvestigation of the photoluminescent complex [NdCl2(H2O)6]Cl
Kuan-Ying Hsieh, El-Eulmi Bendeif, Sebastien Pillet, Abdelatif Doudouh, Dominik Schaniel and
Theo Woike
Computing details
Data collection: CrysAlis PRO (Oxford Diffraction, 2009); cell refinement: CrysAlis PRO (Oxford Diffraction, 2009);
data reduction: CrysAlis PRO (Oxford Diffraction, 2009); program(s) used to solve structure: SHELXS97 (Sheldrick,
2008); program(s) used to refine structure: SHELXL97 (Sheldrick, 2008) and WinGX (Farrugia, 2012); molecular
graphics: ORTEPIII (Burnett & Johnson, 1996) and ORTEP-3 for Windows (Farrugia, 2012); software used to prepare
material for publication: enCIFer (Allen et al., 2004).
(Hexaaquadichlorido)neodymium(III) chloride
Crystal data
[NdCl2(H2O)6]·ClMr = 358.69Monoclinic, P2/nHall symbol: -P 2yaca = 7.9850 (3) Åb = 6.5561 (2) Åc = 9.6727 (4) Åβ = 93.655 (4)°V = 505.34 (3) Å3
Z = 2
F(000) = 342Dx = 2.357 Mg m−3
Mo Kα radiation, λ = 0.71073 ÅCell parameters from 8593 reflectionsθ = 3.1–32.9°µ = 5.91 mm−1
T = 100 KPlate, colourless0.06 × 0.04 × 0.01 mm
Data collection
Oxford SuperNova Dual diffractometer, Cu at zero, with an Atlas detector
Radiation source: SuperNova (Mo) X-ray source
Mirror monochromatorDetector resolution: 10.4508 pixels mm-1
ω scans
Absorption correction: analytical [CrysAlis PRO (Oxford Diffraction, 2009); analytical numerical absorption correction using a multifaceted crystal model based on expressions derived by Clark & Reid (1995)]
Tmin = 0.712, Tmax = 0.9438593 measured reflections1793 independent reflections1710 reflections with I > 2σ(I)Rint = 0.032θmax = 32.9°, θmin = 3.1°h = −12→12k = −9→9l = −14→14
electronic reprint

supplementary materials
sup-2Acta Cryst. (2013). C69, 1002-1005
Refinement
Refinement on F2
Least-squares matrix: fullR[F2 > 2σ(F2)] = 0.016wR(F2) = 0.030S = 1.031793 reflections71 parameters6 restraintsPrimary atom site location: structure-invariant
direct methods
Secondary atom site location: difference Fourier map
Hydrogen site location: difference Fourier mapAll H-atom parameters refinedw = 1/[σ2(Fo
2) + (0.0097P)2 + 0.0698P] where P = (Fo
2 + 2Fc2)/3
(Δ/σ)max < 0.001Δρmax = 0.57 e Å−3
Δρmin = −0.57 e Å−3
Special details
Geometry. All s.u.'s (except the s.u. in the dihedral angle between two l.s. planes) are estimated using the full covariance matrix. The cell s.u.'s are taken into account individually in the estimation of s.u.'s in distances, angles and torsion angles; correlations between s.u.'s in cell parameters are only used when they are defined by crystal symmetry. An approximate (isotropic) treatment of cell s.u.'s is used for estimating s.u.'s involving l.s. planes.Refinement. Refinement of F2 against ALL reflections. The weighted R-factor wR and goodness of fit S are based on F2, conventional R-factors R are based on F, with F set to zero for negative F2. The threshold expression of F2 > 2σ(F2) is used only for calculating R-factors(gt) etc. and is not relevant to the choice of reflections for refinement. R-factors based on F2 are statistically about twice as large as those based on F, and R-factors based on ALL data will be even larger.
Fractional atomic coordinates and isotropic or equivalent isotropic displacement parameters (Å2)
x y z Uiso*/Ueq
Nd1 0.7500 0.647838 (16) 0.7500 0.00558 (4)Cl1 0.75958 (5) 0.32866 (5) 0.55554 (4) 0.01015 (7)Cl2 0.7500 0.87674 (8) 1.2500 0.01062 (10)O1W 0.91551 (15) 0.92584 (18) 0.85559 (13) 0.0112 (2)O2W 0.60535 (15) 0.80024 (18) 0.94150 (13) 0.0113 (2)O3W 0.45290 (14) 0.54572 (18) 0.71823 (13) 0.0115 (2)H11 1.003 (2) 0.963 (4) 0.825 (2) 0.034 (7)*H12 0.873 (3) 1.030 (3) 0.880 (2) 0.031 (6)*H21 0.512 (2) 0.762 (4) 0.953 (2) 0.028 (6)*H22 0.645 (3) 0.833 (3) 1.0179 (18) 0.029 (7)*H31 0.420 (3) 0.431 (3) 0.736 (2) 0.029 (6)*H32 0.398 (3) 0.581 (4) 0.651 (2) 0.031 (7)*
Atomic displacement parameters (Å2)
U11 U22 U33 U12 U13 U23
Nd1 0.00511 (6) 0.00594 (5) 0.00569 (6) 0.000 0.00049 (4) 0.000Cl1 0.01099 (17) 0.00977 (16) 0.00978 (17) −0.00071 (12) 0.00144 (14) −0.00203 (13)Cl2 0.0090 (2) 0.0122 (2) 0.0107 (2) 0.000 0.00065 (19) 0.000O1W 0.0088 (5) 0.0099 (5) 0.0153 (6) −0.0016 (4) 0.0027 (5) −0.0043 (5)O2W 0.0100 (6) 0.0140 (5) 0.0102 (6) −0.0019 (4) 0.0031 (5) −0.0028 (5)O3W 0.0086 (5) 0.0118 (6) 0.0139 (6) −0.0016 (4) −0.0018 (5) 0.0023 (5)
electronic reprint

supplementary materials
sup-3Acta Cryst. (2013). C69, 1002-1005
Geometric parameters (Å, º)
Nd1—O1W 2.4371 (12) Nd1—Cl1i 2.8180 (4)Nd1—O1Wi 2.4371 (11) O1W—H11 0.812 (16)Nd1—O2W 2.4569 (12) O1W—H12 0.808 (16)Nd1—O2Wi 2.4569 (12) O2W—H21 0.800 (15)Nd1—O3W 2.4653 (11) O2W—H22 0.813 (16)Nd1—O3Wi 2.4653 (11) O3W—H31 0.819 (16)Nd1—Cl1 2.8180 (4) O3W—H32 0.793 (16)
O1W—Nd1—O1Wi 83.19 (6) O3Wi—Nd1—Cl1 79.32 (3)O1W—Nd1—O2W 69.41 (4) O3W—Nd1—Cl1 77.41 (3)O1Wi—Nd1—O2W 75.13 (4) O1W—Nd1—Cl1i 108.22 (3)O1W—Nd1—O2Wi 75.13 (4) O1Wi—Nd1—Cl1i 142.94 (3)O1Wi—Nd1—O2Wi 69.41 (4) O2W—Nd1—Cl1i 76.39 (3)O2W—Nd1—O2Wi 132.01 (6) O2Wi—Nd1—Cl1i 147.07 (3)O1W—Nd1—O3Wi 70.06 (4) O3Wi—Nd1—Cl1i 77.41 (3)O1Wi—Nd1—O3Wi 138.34 (4) O3W—Nd1—Cl1i 79.32 (3)O2W—Nd1—O3Wi 120.76 (4) Cl1—Nd1—Cl1i 84.099 (16)O2Wi—Nd1—O3Wi 73.11 (4) Nd1—O1W—H11 121.9 (17)O1W—Nd1—O3W 138.34 (4) Nd1—O1W—H12 121.8 (17)O1Wi—Nd1—O3W 70.06 (4) H11—O1W—H12 104 (2)O2W—Nd1—O3W 73.11 (4) Nd1—O2W—H21 117.4 (17)O2Wi—Nd1—O3W 120.76 (4) Nd1—O2W—H22 128.3 (17)O3Wi—Nd1—O3W 148.49 (6) H21—O2W—H22 105 (2)O1W—Nd1—Cl1 142.94 (3) Nd1—O3W—H31 123.1 (16)O1Wi—Nd1—Cl1 108.22 (3) Nd1—O3W—H32 120.0 (18)O2W—Nd1—Cl1 147.07 (3) H31—O3W—H32 106 (2)O2Wi—Nd1—Cl1 76.39 (3)
Symmetry code: (i) −x+3/2, y, −z+3/2.
Hydrogen-bond geometry (Å, º)
D—H···A D—H H···A D···A D—H···A
O1W—H11···Cl2ii 0.81 (2) 2.39 (1) 3.194 (1) 171 (2)O1W—H12···Cl1iii 0.81 (2) 2.33 (1) 3.134 (1) 177 (3)O2W—H21···Cl1iv 0.80 (2) 2.38 (1) 3.153 (1) 163 (1)O2W—H22···Cl2 0.81 (2) 2.36 (1) 3.170 (1) 171 (2)O3W—H31···Cl2v 0.82 (2) 2.44 (1) 3.233 (1) 163 (2)O3W—H32···Cl1vi 0.79 (2) 2.37 (1) 3.162 (1) 176 (2)
Symmetry codes: (ii) −x+2, −y+2, −z+2; (iii) −x+3/2, y+1, −z+3/2; (iv) x−1/2, −y+1, z+1/2; (v) −x+1, −y+1, −z+2; (vi) −x+1, −y+1, −z+1.
electronic reprint

Structure and dynamics of single molecules confinedin a mesoporous silica matrix: a joint NMR and PDFcharacterisation†
Kuan-Ying Hsieh,a El-Eulmi Bendeif,*a Axel Gansmuller,a Sebastien Pillet,a
Theo Woikeb and Dominik Schaniela
We present an experimental approach to study the structure and dynamics of molecular functional
complexes in porous host matrices. Combining the results of Solid-State NMR and pair distribution
function analysis based on total X-ray scattering data the structural arrangement and dynamical
behaviour of Na2[Fe(CN)5NO]$2H2O (SNP) embedded in amorphous SiO2 matrix is investigated. We
show that the SNP complexes are embedded as isolated complexes within the SiO2 pores and propose a
structural model for the cation and anion arrangement. Additionally the NMR results demonstrate the
rotational dynamics of the SNP complexes.
1. Introduction
In recent years, the sol–gel process has emerged as a promisingstrategy to design nanocomposites in which mesoporous silicamatrices serve as templates for the connement of various typesof functional molecules leading to hybrid organic–inorganicnanocomposites. Such nanocomposite materials combine theproperties of the guest functional molecules with those of inor-ganic materials (high stability, transparency, convenient pro-cessing and shaping), and have attracted considerable interestowing to their potential applications, such as the fabrication ofnext-generation molecular-based devices including plasmonicwaveguides, photonic crystals, memory storage devices, photo-voltaics.1–6 Embedding photoswichable molecules into poroushosts opens the possibility to complement the molecular opticalproperties with the chemical and mechanical stability of thehost.7,8 We are especially interested in the inclusion of photo-switchable mononitrosyl complexes [ML5NO]
x (M ¼ metal, L ¼ligand) into porous silica matrices in order to exploit theirinteresting optical properties for applications such as holographyor information storage.9–12 In this class of compounds thenitrosyl ligand can undergo photoinduced linkage isomer-isation13,14 resulting in changes of the colour and the refractiveindex of the compounds. Since the linkage isomerism is amolecular property these complexes are suitable candidates for
embedding them into hosts materials such as silica gels15
and metal–organic frameworks16 or electrostatic attachment onsurfaces.17 The study of the prototype complex Na2[Fe(CN)5NO]$2H2O (sodiumnitroprusside, SNP) embedded in silica matricesshowed that the properties of the metastable linkage isomers areindependent of the pore and particle size.1 Furthermore thisstudy indicated that at low doping levels the SNP guest might beincluded as isolatedmolecules in themesopores of the SiO2 host.This nding is in agreement with the results of a neutrondiffraction study on a (CN3H6)2[Fe(CN)5NO] complex embeddedin a silica host,18 which allowed for the identication of thestructural ngerprint of isolated molecules in the porousnetwork. In this case however the properties of the linkage iso-merisation change insofar that the achievable population isincreased in the gel matrix compared to the crystalline material.In order to be able to derive a structure–functionality relationshipand to proceed to a more targeted design of such hybridcomplexes, a detailed description of the structural organisationof the guest species and of their immediate surrounding (i.e.silica wall, solvent and counter-ions) is thus absolutely manda-tory. We show here that detailed structural information canbe obtained by using an appropriate multiscale approachcombining various experimental techniques such as X-ray totalscattering coupled to atomic pair distribution function (PDF) andsolid-state NMR spectroscopy. This multiscale approach doesprovide more extensive and accurate structural information. Asthe pioneering work of Toby & Egami (1992)19 and severalsubsequent studies20–23 have shown, the PDF approach is ideallysuited for structural characterisation of crystalline materials aswell as nanostructured and disordered materials. The PDF is theinstantaneous atomic density–density correlation function whichdescribes the atomic arrangements in real space without anycrystallographic assumption. Simply speaking, the PDF function
aLaboratoire de Cristallographie, Resonance Magnetique et Modelisations, CRM2,
UMR CNRS 7036, Institut Jean Barriol, Universite de Lorraine, BP 70239, 54506
Vandoeuvre les Nancy, France. E-mail: [email protected]; Fax:
+33 (0)3 83 68 43 00; Tel: +33 (0)3 83 68 48 70bInstitut fur Strukturphysik, TU Dresden, Zellescher Weg 16, Dresden, Germany
† Electronic supplementary information (ESI) available. See DOI:10.1039/c3ra45347b
Cite this: DOI: 10.1039/c3ra45347b
Received 25th September 2013Accepted 14th October 2013
DOI: 10.1039/c3ra45347b
www.rsc.org/advances
This journal is ª The Royal Society of Chemistry 2013 RSC Adv., 2013, xx, 1–10 | 1
1
5
10
15
20
25
30
35
40
45
50
1
5
10
15
20
25
30
35
40
45
50
RSC Advances
PAPER

is another representation of total scattered X-ray intensities andreects both the long-range atomic structure, manifested in thesharp Bragg peaks, and the local structural imperfections,manifested in the diffuse components of the total scatteringpattern. A signicant advantage of the PDF approach is that,unlike EXAFS spectroscopy, the relevant structural informationpersists over a long distances range. Thus, the structural prop-erties are described at different scale orders in real space.However, the structural studies, based on PDFs obtained fromtotal X-ray scattering data, of amorphous organic–inorganicnanocomposites is a challenging task because of their weakscattering power that contributes to the magnitude of thecorrelations in the PDF diagrams. Accordingly, it is important tocombine different complementary approaches to provide anaccurate structural description of these hybrid organic–inorganicnanocomposites. As such, solid state NMR spectroscopy and PDFanalysis are very complementary techniques that are increasinglybeing combined for structural characterisation of heterogeneous,nanocrystalline, and even disordered materials.24–29 The PDFmethod can deliver atomic resolution structural information thatextends to distances of several nanometers, and thus ll theimportant gap between short range NMR and long range X-rayBragg diffraction methods. Additionally, solid-state NMR tech-niques are element selective, chemically resolved and canprovide further information on molecular motion.
In this study we establish a structural characterisationstrategy of mononitrosyl complexes [ML5NO]
x embedded inporous silica matrices and apply it to observe how connementin the nanopores affects the structure of a SNP guest. Aprerequisite for NMR characterization is the presence of NMRsensitive nuclei in the components studied. This condition isfullled here since the [Fe(CN)5NO]
2� ions can be studied bynatural abundance (1%) 13C NMR. The sodium counterioncorresponds to 100% abundant and sensitive 23Na, and the SiO2
matrix can be characterized by natural abundance (4.7%) 29SiNMR. The high resolution necessary for interpretation of thespectra is provided by Magic Angle Spinning30 (MAS) of thesamples that partially averages out the anisotropic interactionspresent in the solid state. Solid State NMR has already beenwidely applied to characterize crystalline and amorphous silicamatrices.31–38 29Si MAS NMR allows to characterize the degree ofcondensation of the gel matrix31,32,34,38–40 whereas 29Si CPMASand 1H MAS NMR provide information on the speciation ofsilanol groups and the arrangement of water molecules insidethe pores.32,34,37,41,42 Although many structural studies of SNPhave been published,43–50 until now NMR has been applied onlyin the solution state,51,52 or single crystals.53In this study weapply 13C and 23Na MAS NMR on crystalline and encapsulatedSNP@SiO2 to assess how the porous connement inuences thestructure of the complex. As mentioned earlier solid state NMRcan also probe molecular motions. This feature relies on thefact that anisotropic NMR interactions depend on the orienta-tion of their tensors with respect to the static magnetic eld.When the anisotropic tensors reorient because of moleculardynamics, NMR measurements of the tensor propertiesare specically averaged depending on motional amplitude,symmetry and correlation time. Even when the averaging
cannot be characterized directly, the inuence of the uctuatinginteraction tensors on the different NMR relaxation times iscorrelated to the characteristics of the dynamics.54–56 As aconsequence NMR is increasingly applied to study dynamicsin conned porous environments57–65 mostly by measuringthe effect on quadrupolar interactions from isotopicallydeuterated molecules. In this study, we use the 13C ChemicalShi Anisotropy (CSA) and 23Na quadrupolar couplings to proberotational diffusion of the complex inside the nanopores.
2. Experimental2.1. Sample preparation
2.1.1. Synthesis of porous silica monoliths. The poroussilica matrices were obtained following a procedure publishedearlier resulting in transparent monolith with pores size in therange of 1–2 nm:1,15,66 1.5 ml of tetramethoxysilane (TMOS, 98%purity, Fluka), 1.8 ml of methanol (VWR) and 3.6 ml of distilledwater were mixed and stirred at room temperature for about5 minutes which allowed the solution to gel. The mixture wasthen placed in a glass tube at 50 �C for 3 weeks in a conventionaloven to dry and solidify the obtained gels. Cylindrical trans-parent rods with a diameter of about 1.0 mm were obtainedaer the drying and gelation–solidication processes.
2.1.2. Synthesis of SNP–silica hybrid. The SNP–silicananocomposites were prepared by impregnating the porous SiO2
monoliths with an aqueous solution (0.877 mol l�1) of SNP salt(Na2[Fe(CN)5NO]$2H2O). The SiO2 matrices were slowly intro-duced into the SNP solution in order to prevent any cracking. Themonoliths, initially colourless, then became progressively moreand more brown-orange indicating the diffusion of the SNPcomplexes into the silica pore network. Aer about 24 hours themonoliths displayed homogeneous colouring andwere kept at 50�C for 7 days in an oven. A nal drying step was performed atroom temperature in desiccators coupled to vacuum (10�2 mbar)for about 3 days in order to remove the remaining solvent. Theobtained empty SiO2 monoliths and SNP@SiO2 nanocompositesamples are shown in Fig. 1.
2.2. Total scattering measurement
The experiments were performed on the powder diffractometerof the Material Science beamline of the Swiss Light Source
Fig. 1 Photographs of the synthesized mesoporous silica monoliths: (a) emptySiO2 monolith and (b) SNP–silica nanocomposites.
2 | RSC Adv., 2013, xx, 1–10 This journal is ª The Royal Society of Chemistry 2013
RSC Advances Paper
1
5
10
15
20
25
30
35
40
45
50
55
1
5
10
15
20
25
30
35
40
45
50
55

synchrotron facility (SLS) at the Paul Scherrer Institute (Villigen,Switzerland). Data were collected using a monochromatic beamof wavelength l ¼ 0.4962 A (energy E ¼ 24.9866 keV) and thesecond generation microstrip detector Mythen II covering 120�
with 0.0037� resolution. Due to the relatively low absorptioncoefficient of unloaded and loaded SiO2 monoliths, Debye–Scherrer transmission set up was used. The used photon energycombined with an appropriate data collection strategy enabledata to be recorded over a sufficiently high wave vector Q (Q ¼4p sin q/l) to provide the necessary resolution in real-space forquantitative structural analysis to be attempted. Two totalscattering data sets have been collected at room temperature upto Qmax¼ 24.2 A�1 corresponding to a d spacing of 0.26 A for theunloaded and the loaded monoliths under the exact sameexperimental conditions, which is of utmost importance toderive the d-PDF described below. Using the impregnationmethod described above (post-loading of SNP complexes intothe solidied monolith), ensures that the porous silica networkis not altered between loaded and unloaded sample.18,66
This approach allows for calculation of the differential PDF bysimple subtraction of the two corresponding G(r) (loaded–unloaded). The G(r) function is dened in the next section. Wenote here that similar data collections have been conducted(under the same experimental conditions) for the bulk micro-crystalline SNP powder. The PDF obtained from the crystallineSNP will serve as a reference for the structural modelling of theloaded SiO2 monoliths.
2.3. Data reduction and calculation of the PDF
The data were corrected for absorption, multiple scattering,polarization, Compton scattering and Laue diffuse scattering.To obtain the total scattering structure function S(Q) the datawere normalized by the incident ux and the number of scat-terers. The experimental atomic pair distribution function G(r)in real space was then obtained by a direct sine Fourier trans-formation of the resulting total scattering structure functionS(Q) according to:
GðrÞ ¼ 2
p
ðQmax
Qmin
Q½SðQÞ � 1�sinðQrÞdQ
The scattering signal from the air and the experimental setup was measured independently under the exact same condi-tions as the sample and subtracted as a background in the datareduction procedure. In the Fourier transformation step forobtaining the experimental atomic pair distribution functionG(r) from S(Q), the data were truncated at a nite maximumvalue of Qmax ¼ 23.2 A�1 beyond which the signal-to-noise ratiobecame unfavourable. All data processing was done using theprogram GudrunX.67
2.4. Solid state NMR spectroscopy
All experiments were carried out on a high-eld Bruker NMRAvance III spectrometer operating at 14 T (1H NMR frequency of600 MHz) with a Bruker 4 mmMAS triple-resonance probe. MASspinning speed was set to 12.5 kHz. For 29Si experiments the
rf-eld strength applied for the 29Si pulse was set to 45 kHz, withan excitation pulse length of 1.85 ms. During acquisition, SPINAL-6468 heteronuclear decoupling was applied at an rf-eld strengthof 80 kHz. The interscan delay was set to 10 s; 1536 scans wereaccumulated for a total experimental time of about 4.5 h.
For 13C MAS experiments the rf-eld strength applied for the13C pulse was set to 51 kHz, leading to a 90� pulse length of4.9 ms. During acquisition, SPINAL-6468 heteronuclear decou-pling was applied at an rf-eld strength of 80 kHz. For thecrystalline SNP sample the interscan delay was set to 19 s and4608 scans were accumulated for a total experimental time ofabout 24 h; for the hybrid SNP@SiO2 sample the interscan delaywas set to 3 s and 6144 scans were accumulated for a totalexperimental time of about 5 h.
For 23Na MAS experiments the rf-eld strength applied forthe 23Na pulse was set to 76 kHz, leading to a 90� pulse length of3.3 ms. During acquisition, SPINAL-6468 heteronuclear decou-pling was applied at an rf-eld strength of 80 kHz. The interscandelay was set to 3 s; 128 scans were accumulated for a totalexperimental time of about 6 min.
For 1H MAS experiments the rf-eld strength applied forthe 1H pulse was set to 80 kHz, leading to a 90� pulse length of3.1 ms. The interscan delay was set to 3 s; 32 scans were accu-mulated for a total experimental time of 1.6 min.
For the hydration study (Fig. 7) the open NMR rotors werestored overnight with saturated solutions of LiBr, CaCl2 and KClsalts stabilizing the atmosphere at 6%, 29% and 85% relativehumidity (25 �C) respectively. For all experiments, the temper-ature at the stator output was stabilized at 298 K.
The Dmt69 program was used to t 13C chemical shianisotropy based on spinning sideband patterns and to t thesecond order quadrupolar effects on the lineshapes of the 23Nacentral peaks. All spectra were processed with the GSimprogram developed by V. Zorin.70
3. Results and discussion3.1. Total X-ray scattering approach
3.1.1. Experimental PDF and d-PDF. The X-ray diffractiondata of the loaded and unloaded monoliths are shown inFig. 2a. Both data sets conrm the amorphous nature of thesilica gel, exhibiting the characteristic broad principal peak atQ � 1.64 A�1.71 We observe that the main peak has a lowerintensity and is slightly broadened in the loaded monolith. Thisfeature has been observed in previous work1 and reect thechange of the scattering contrast between the empty and lledmonoliths.
The corresponding atomic PDFs in real space, G(r), areshown in Fig. 2b. The expected pair distances for a SiO2 xerogelhave been identied and are in agreement with published data(see e.g. Benmore72). The second peak at 1.60 A in the PDF refersto the Si–O bond length in the silica network. The third G(r)peak at 2.64 A originates from O–O distances and conrms thatthe average O–Si–O bond angle is tetrahedral. The fourth peakin G(r) at 3.08 A corresponds to Si–Si distances in the congu-ration of corner-sharing SiO4 tetrahedral units. This mutualarrangement of the SiO4 tetrahedra can be further described by
This journal is ª The Royal Society of Chemistry 2013 RSC Adv., 2013, xx, 1–10 | 3
Paper RSC Advances
1
5
10
15
20
25
30
35
40
45
50
55
1
5
10
15
20
25
30
35
40
45
50
55

the 5th and 6th peaks, respectively, at 4.08 A and 4.99 A, corre-sponding to two Si–O and O–O distances between two adjacentSiO4 units and depending on the two torsion angles describingthe rotation of the SiO4 units about the two joined Si–O bonds.The assignment of peaks at higher r values is difficult due topeak overlap. Small differences in the PDF between loaded andunloaded monoliths can be clearly observed in the differentialPDF corresponding to the direct subtraction G(r)loaded �G(r)unloaded, and occur mainly at low r values up to 7 A (Fig. 2).
The study of differential PDFs allows for the extraction ofstructural information due to atomic correlation involving theguests, both guest–guest and guest-framework, as well as guest-induced framework perturbations.73 In the present case thesignicant structural changes due to the insertion of the SNPcomplexes are limited to the local scale up to distances of 10 Aindicating well isolated molecules inside the matrix pores.
Fig. 3 shows the comparison of the experimental differentialPDF obtained by the subtraction G(r)loaded� G(r)unloaded and theG(r) obtained from crystalline SNP (measured under the sameexperimental conditions). The positions of the peaks (corre-sponding to atom–atom distances) in the differential PDF areslightly shied with respect to the crystal structure indicating aminor structural relaxation of the molecule embedded in nano-pores. However, it can be seen that the main bond lengthsof SNP encapsulated in the SiO2 gel correspond to the
intramolecular pair correlations found in crystalline samples inthe range 1–5 A, with distances of 1.16 A (C–N), 1.93 A (Fe–C),3.09 A (Fe–N) and some weaker intra-molecular correlations (C–C, N–N between ligands). The most intense peaks in the G(r)involve the pairs including the strongest scatterers (Fe atom) inthis complex as well as the most abundant pairs (ve C–Nligands). The absence of sharp features in the d-PDF beyond 5 Ais a strong indication of the absence of any regular orderingaround the [Fe(CN)5NO]
2� molecules and thus conrms ourhypothesis that we are dealing with isolated SNP complexes inthe porous network. However, the distances due to intra-molecular pair correlations in [Fe(CN)5NO]
2� do not account forall the features observed in the d-PDF. In order to obtain moredetailed information about a possible structural relaxation ofthe SNP complex, the position of the counter ions (Na+), and theinteractions with the pore walls of the SiO2 monoliths, we per-formed extensive modelling as detailed below.
3.1.2. Modelling. The tting of the differential PDF wasaccomplished using the “difference modelling” strategy whichemploys three components: (i) a reference PDF of the vacant host,(ii) the structure model of the host–guest system, and (iii) theexperimental differential PDF. An initial structure of the host–guest system was constructed as follows. First, the empty porousSiO2 network was created using the Reverse Monte Carlo (RMC)method which has been described by Keen.74 The RMC model-ling of amorphous SiO2 was developed by using reliable totalscattering data to create three dimensional models. Starting fromrandom conguration of SiO2 groups based on the experimentalnumber density, three geometrical constraints have beenapplied: Si–O distances (�1.6 A) and O–Si–O angle (�109.5�)which permit to keep the SiO4 tetrahedral conguration, and Si–O–Si angle (�143.0�) for creating undistorted corner shearingSiO4 tetrahedra to form an amorphous silica network. Then, acredible conguration of the [Fe(CN)5NO]
2: anion was takenfrom single crystal data measured at room temperature. Thismodelling was performed using the DISCUS program.75
Fig. 4 shows the results of the tting of the experimentald-PDFs up to 10 A together with the corresponding congura-tions of the SNP complexes. In order to keep electricalneutrality, the congurations were chosen such that one
Fig. 2 (a) Diffraction patterns of unloaded and loaded monoliths. (b) Corre-sponding PDFs, G(r), for unloaded (blue) and loaded (black) monoliths, and thedifferential-PDF (red) which is scaled up for clarity.
Fig. 3 Comparison of G(r) of crystalline SNP (crystal structure illustratedperpendicular to ab plane), and differential-PDF from embedded SNP whichisolates structural information of molecule in the porous matrix.
4 | RSC Adv., 2013, xx, 1–10 This journal is ª The Royal Society of Chemistry 2013
RSC Advances Paper
1
5
10
15
20
25
30
35
40
45
50
55
1
5
10
15
20
25
30
35
40
45
50
55

[Fe(CN)5NO]2� anion is associated with 2 Na+ cations in one
nanopore. The two Na+ cations are placed on ve differentpositions with respect to the [Fe(CN)5NO]
2� anion.For judging the quality of the t we used the weighted
R-value;
Rwp ¼
ffiffiffiffiffiffiffiffiffiffiffiffiffiffiffiffiffiffiffiffiffiffiffiffiffiffiffiffiffiffiffiffiffiffiffiffiffiffiffiffiffiffiffiffiffiPj
wj
�Gobs; j � Gcalc; j
�2Pj
wjGobs; j2
vuuuut
where wj is the weighting, Gobs,j and Gcalc,j are observed andcalculated G(r), respectively, for each point j of the PDF curve.
Fig. 4a illustrates clearly that pair correlations are mainlydominated by the [Fe(CN)5NO]
2� anion up to �5 A; Fig. 4b–fshow congurations where two Na+ cations are taken intoaccount around the molecule with a xed radial distance of5.55 A. This allows for an improved t of the d-PDF in the regionbelow 8 A. Fig. 4d shows the conguration yielding the best tincluding the 5–10 A region. In this conguration the two Na+
anions are in the equatorials plane of the [Fe(CN)5NO]2� anions,
in prolongation of the Fe–C–N direction. Additionally, we have
arranged the Na+ positions as given in the single crystal (oneequatorial and one near the axial CN ligand, not shown here)but for this conguration the Rwp-value increases. The sameincrease of Rwp was found by varying the radial distance of theNa+ counter ions between 4 and 7 A. Consequently we candetermine by this procedure the position of the two Na+ ionswith respect to the [Fe(CN)5NO]
2� anion with reasonablereliability.
On the other hand there are still some features in the d-PDFthat are not completely explained by our model, especially theintensity of the peak at 1.3 A as well as the shoulder at about2.3 A. It should be noted here that the low r region (0 to �1.2 A)of the d-PDF is very critical and may contain some errors due tothe limitation of the experimental setup and the processing ofthe data.19 Therefore the interpretation of the interactionscontributing to the intensity of the peak at 1.3 A has to betaken with care. However we tested two hypotheses in order toaccount for these features: i) interaction with pore wall, and ii)hydration. Concerning i) host–guest interaction: even thoughan earlier neutron diffraction study on a similar compoundGuNP@SiO2 has shown the possibility of host–guest interac-tions (Cervellino et al.)18, the NMR results don’t show anyevidence for such interactions, neither on the Si nor on the Na+
side. Concerning ii), the impregnation of the monoliths wasperformed from aqueous solutions and it is also known thatporous matrices like SiO2 readily uptake humidity. Additionally,NMR measurements indicate that the SNP complex inside thepore is surrounded by water molecules (see details below).However, tting the d-PDF with additional H2O moleculesproved to be a very difficult task. Although improvements couldbe realized, the reliability of such ts was quite limited, asdifferent congurations yielded similar results, sometimes withno signicant improvement of R-values. Thus, although thepresence of water molecules surrounding the SNP complexes inthe pores is shown by NMR, the structural arrangement cannotbe obtained from a PDF measurement at this stage.
Concluding this rst part, total X-ray scattering measure-ments coupled to d-PDF analysis showed that isolated SNPcomplexes are embedded in SiO2 pores. Additionally the struc-tural conguration of cation and anion could be proposed froma difference modelling strategy.
3.2. Solid State NMR approach
Since NMR observables depend on the local environment of thenuclear spins, long range order is not necessary to obtainresolved structural information. This complementary approachis thus well adapted to characterise both the amorphous hostand the molecular guest as long as NMR sensitive nuclei arepresent in both components of the material. Additionally, theanisotropic nuclear interactions typically measured by SolidState NMR techniques can also be used to obtain informationon molecular dynamics inside the solids.
3.2.1. Structure of the amorphous SiO2 host. The porousmatrix containing the isolated SNP complexes is composed ofamorphous SiO2 silica. Both 29Si (I ¼ 1/2; 4.7% natural abun-dance) and 17O (I ¼ 5/2; 0.037% natural abundance) allow NMR
Fig. 4 d-PDF fits with different configurations of isolated SNP complexes illus-trated on the right: (a) one [Fe(CN)5NO]2� anion within the pores; (b)–(f)considers two Na+ cations placed around [Fe(CN)5NO]2� to keep electrostaticneutrality. Five configurations are considered for which (d) results in the best fit. Inthat case the two Na+ cations in the equatorial plane of the [Fe(CN)5NO]2: anions,in prolongation of the Fe–C–N direction.
This journal is ª The Royal Society of Chemistry 2013 RSC Adv., 2013, xx, 1–10 | 5
Paper RSC Advances
1
5
10
15
20
25
30
35
40
45
50
55
1
5
10
15
20
25
30
35
40
45
50
55

studies, however the very low natural abundance and thequadrupole moment of the 17O isotope severely reduce itssensitivity and make its NMR application difficult. Therefore weapplied 29Si MAS NMR to characterise the xerogel matrix. Fig. 5presents the 29Si MAS NMR spectra of the porous SiO2 xerogelbefore and aer incorporating the SNPmolecules. The chemicalshis observed are typical for Qn SiO4 tetrahedra units;31 Qn
representing SiO4 tetrahedra of the amorphous network, whichform n bonds with neighboring tetrahedral. Both spectra showtwo major resonances at �101.7 ppm and �110.5 ppm, corre-sponding to Si(OSi)3(OH) (Q3) and Si(OSi)4 (Q4) sites, respec-tively, and one resonance at �91.8 ppm corresponding toSi(OSi)2(OH)2 (Q2) sites. The absence of Si(OSi)(OH)3 (Q1) sitesand the low ratio of Q2 sites indicate a relatively high degree ofcondensation of the xerogels. This is especially true since, onthe spectra acquired here, this ratio is overestimated because ofshort experimental repetition times compared to Q3 and Q4 29SiT1 relaxation times.
A comparison between the spectra of the empty and the SNPloaded matrix shows neither an increase of the line widths northe appearance of additional sites. This indicates that the gelstructure is not modied by the embedding procedure of theSNP molecules. This point is very important since it validatesthe differential PDF (d-PDF) approach described previously. Thecomparison also does not show evidence of strong interactionsbetween the host xerogel and the molecular guest since signif-icant covalent chemisorptions on the silanol groups (by Na+ forexample) would generate new chemically shied 29Si sites.
3.2.2. Structure and dynamics of the SNP guest. Given theNMR sensitivity of the nuclei present in the SNP salt, we applied13C NMR to probe the local environment of the [Fe(CN)5NO]
2�
anions and 23Na NMR to probe the environment of thecounterions.
The 23Na MAS NMR spectrum of the bulk crystal (Fig. 6)displays two inequivalent sites with same multiplicity butsignicantly different quadrupolar coupling constants. The rstsite Na1 has a quadrupolar constant CQ1 ¼ 1369 kHz and anasymmetry of h1 ¼ 0.92 while the second site Na2 has a smaller
constant CQ2 ¼ 615 kHz and h2 ¼ 0.33. The isotropic chemicalshis (diso1 ¼ �5.74 ppm and diso2 ¼ �1.91 ppm) indicate hex-acoordinated sodium atoms76 and are consistent with the XRDcrystal structure;48,49 the NMR sites can be assigned to theinequivalent crystallographic positions by comparing the Elec-trical Field Gradient properties with those published from DFTcalculations.77 The 23Na MAS NMR spectrum of the SNP insidethe silica matrix (Fig. 6) is very different. This spectrum presentsonly one 23Na site with a chemical shi (diso ¼ �1.1 ppm)indicating that the sodium site is coordinated by mostly watermolecules.78 This means that the crystal structure is notpreserved inside the pores of the SiO2 matrix and that the two23Na counterions experience identical local environments onthe ms timescale. Several possibilities can explain the presenceof a unique 23Na site but consistently with our other measure-ments we interpret this as motional averaging below the mstimescale due to solvation by surrounding water molecules.
The 13C MAS NMR spectrum of the bulk crystal (Fig. 7)displays four resolved sites (diso ¼ 136.7 ppm, 136.2 ppm,135.9 ppm, and 135.5 ppm) whereas the SNP@SiO2 nano-composite displays only two (disoequatorial ¼ 134.7 ppm and disoaxial ¼133.3 ppm). For the nanocomposite, the isotropic chemicalshis are thus displaced towards the solution state values52 witha surface ratio of 4 : 1 typically observed for SNP in solution.
Fig. 5 29Si MAS NMR spectra (nMAS ¼ 12.5 kHz) of the SNP loaded SiO2 matrix(top) and the empty SiO2 matrix (bottom).
Fig. 6 23Na MAS NMR spectra (nMAS ¼ 12.5 kHz) of the SNP loaded SiO2 matrix(top) and crystalline SNP (bottom). Quadrupolar satellites are marked by asterisks.
6 | RSC Adv., 2013, xx, 1–10 This journal is ª The Royal Society of Chemistry 2013
RSC Advances Paper
1
5
10
15
20
25
30
35
40
45
50
55
1
5
10
15
20
25
30
35
40
45
50
55

Consistently with the 23Na results, this means that the crystalstructure is not preserved in the nanocomposite. It also indi-cates that water molecules are present inside the pores and that,for sufficiently high hydration levels, the nitroprussiate is wellseparated from its sodium counterions. Nevertheless, as will bedetailed in the next section, the line width broadening observedfor samples stored in relatively dry conditions indicates that the“free” solvation water molecules can quite easily be removed.
In the bulk crystalline state, both the 13C and the 23Na nucleidisplay anisotropic interactions. Fitting the MAS sidebandpattern of the 13C spectrum informs us about the chemical shianisotropy. For the crystal we nd a relatively strong anisotropydaniso ¼ 32 kHz with a slight asymmetry of h ¼ 0.08. Its origin isessentially intramolecular and relies on the anisotropic electrondistribution of the Fe–C^N bonding. For the 23Na spins thedominant interaction is the quadrupolar coupling which can beobtained here by tting the second order quadrupolar line-shapes of the center bands. These values are CQ1 ¼ 1369 kHzand CQ2 ¼ 615 kHz depending on how the nuclear electricquadrupole moment couples to the local electric eld gradient.As evidenced on Fig. 6 and 7, the CSA and quadrupolar inter-actions split the MAS NMR signals into spinning sidebands andsatellites (respectively) appearing at integer multiples of thesample rotation frequency and spread over a frequency window
equivalent to the strength of the interactions.79 Interestingly thesidebands and satellites are no longer present for the nano-composite powder spectra. This clearly indicates that theembedded SNP performs isotropic reorientation inside thepores, a motion sufficiently fast to completely average out bothtypes of anisotropic interactions. Hence the characteristicfrequency of the motion is higher than those interactions andimplies a sub-ms isotropic reorientation. Since the NMR chem-ical shis are identical for all equatorial 13C sites, and the d-PDFmodelling results suggest that the Na+ cations are located in theprolongation of the equatorial C^N bonds, then [Fe(CN)5NO]
2�
must also experience a C4 rotation around the Fe–N–O axis withrespect to the Na+ cation. The correlation time of this rotationhas to be shorter than the NMR measurement timescale (ms).
This last point will be further investigated in a subsequentNMR study dedicated to quantitative characterisation of theSNP dynamics inside the SiO2 matrix. CSA and relaxationtime measurement at different temperatures and hydrationlevels will be necessary to characterise the motional correlationbetween the nitroprusside and its counterion.
3.2.3. Hydration of the nanocomposite SNP@SiO2 xerogel.To study how hydration inuences the structure and dynamicsof the SNP complex inside the SiO2 matrix, the NMR sampleshave been stored in three different environments of 6%, 29%and 85% relative humidity (RH). 1H, 13C, 23NaMAS NMR spectra(Fig. 8) were subsequently acquired to observe how the differentcomponents of the material were inuenced by hydration.
The signals observed on the 1H spectra originate principallyfrom water molecules that can exchange protons with silanolsgroups. The series of 1H spectra shows how the pore watercontent diminishes with the relative humidity levels. Thespectra are composed of a dominating signal between 4.5 ppmand 4 ppm that is reduced, broadened and shied upeld whenthe relative humidity is lowered. This signal reects relatively
Fig. 7 13C MAS NMR spectra (nMAS ¼ 12.5 kHz) of the SNP loaded SiO2 matrix(top) and crystalline SNP (bottom). Spinning sidebands are marked by asterisks.
Fig. 8 Effect of hydration on the 1H, 13C and 23Na spectra (respectively from leftto right) of the SNP@SiO2 hybrid xerogel. For reference, the upper spectra areacquired on crystalline SNP. The spectra below correspond to SNP loaded xerogelsthat have been stored overnight at 84%, 29% and 6% relative humidity (broken,fine and bold line respectively). MAS spinning sidebands are marked with aster-isks (nMAS ¼ 12.5 kHz).
This journal is ª The Royal Society of Chemistry 2013 RSC Adv., 2013, xx, 1–10 | 7
Paper RSC Advances
1
5
10
15
20
25
30
35
40
45
50
55
1
5
10
15
20
25
30
35
40
45
50
55

mobile water molecules present inside the pores of the matrix.When the humidity is decreased, the “free” water is removedand only the rst hydration layers remain. Therefore theremaining signal is shied and broadened because of thestronger adsorption of the water and the proton exchangebetween liquid water, physisorbed water and silanols.42
The 13C and 23Na spectra (Fig. 8) focus on the SNP guest.Both series behave comparably and show that all anisotropicinteractions remain motionally averaged even at a low hydra-tion level (no MAS sidebands or satellites even at 6% relativehumidity). Additionally, the removal of water molecules doesnot induce chemical shi changes towards those observed forcrystalline SNP. This indicates that even when most of the waterinside the nanopore cavity is removed, the SNP maintains itsstrong dynamic properties and does not take a nanocrystallinestructure. We also observe an upeld shiing of the 23Na signalwhich is consistent with an elongation of the average coordi-nation distance.76 Nevertheless, both 13C and 23Na signalsbecome considerably broadened for samples stored at 6%RH. This broadening cannot be refocused by spin echo typesequences; it is therefore from the homogeneous type. Thismeans that it is not due to a distribution of chemical shis butto a decrease of T*2 transverse relaxation time. Since both the[Fe(CN)5NO]
2� anions and the sodium counterions display sub-ms dynamics, we speculate that the relaxation mechanismoriginates from uctuating ion–counterion interactions ratherthan from interactions with the pore surface. A more quanti-tative description of the molecular motion inside the pores willbe addressed elsewhere by a dedicated NMR study.
4. Conclusion and future outlook
High energy X-ray total scattering coupled with experimentaldifferential PDF analysis, together with Solid State NMR tech-niques, allows us to investigate structural properties of isolatedSNPmolecules incorporated in the silica nanopores. The atomicd-PDF and the modelling approaches provide direct structuralevidence on the local cation and anion arrangement of the SNPcomplexes and show that the SNP complexes are embedded inthe form of isolated molecules inside the matrix pores. Themulti-nuclei Solid State NMR investigation provides informa-tion on both the amorphous host and the molecular guest andadds a dynamic dimension to the classical static structuralcharacterisation. 29Si MAS NMR measurements show that thegel matrix structure is not modied by the SNP embeddingprocedure. 13C and 23Na MAS NMR measurements show thatinside the matrix pores the SNP neither takes a crystalline likestructure nor does it adhere to the pore surface in agreementwith the d-PDF results. Additionally, we surprisingly ndevidence that the conned complex adopts solution like struc-ture and dynamics with isotropic reorientation below the mstimescale. Subsequent NMR experiments at different relativehumidity levels show the presence of weakly interacting watermolecules inside the pores. This explains, to some extent, thedifferences on the d-PDF curves observed between the experi-mental and the suggested model. These water molecules caneasily be removed to some extent, nevertheless the strong
isotropic motion of the SNP is still preserved even for lowhydration levels. Globally, the SNP complexes behave as “free”isolated molecules inside the matrix pores. The fact that thelocal arrangement of cation and anion and their dynamic can beproposed from a model obtained by using d-PDF and SolidState NMR multiscale approach allows for future systematicinvestigations of structure–property relationship in such hybridorganic–inorganic nanocomposites.
Acknowledgements
This work was supported by the Universite de Lorraine, theCNRS, the Institut Jean Barriol and ANR (CROSS-NANOMATproject, ANR2010-BLAN-0716) which are gratefully acknowl-edged. We acknowledge the help of Dr A. Cervellino for the useof the MS beamline of the Swiss Light Source synchrotronfacility (SLS) at the Paul Scherrer Institute (Villigen, Switzerland)
Notes and references
1 Z. Tahri, R. Lepski, K.-Y. Hsieh, E.-E. Bendeif, S. Pillet,P. Durand, T. Woike and D. Schaniel, Phys. Chem. Chem.Phys., 2012, 14, 3775–3781.
2 P. Durand, S. Pillet, E.-E. Bendeif, C. Carteret, M. Bouazaoui,H. E. Hamzaoui, B. Capoen, L. Salmon, S. Hebert,J. Ghanbaja, L. Aranda and D. Schaniel, J. Mater. Chem. C,2013, 1, 1933–1942.
3 K. Ariga, A. Vinu, J. P. Hill and T. Mori, Coord. Chem. Rev.,2007, 251, 2562–2591.
4 K. Moller and T. Bein, Chem. Mater., 1998, 10, 2950–2963.5 C. Sanchez and B. Lebeau, MRS Bull., 2001, 26, 377–387.6 C. Sanchez, B. Lebeau, F. Chaput and J.-P. Boilot, Adv. Mater.,2003, 15, 1969–1994.
7 U. Ruschewitz and D. Hermann, Z. Anorg. Allg. Chem., 2010,636, 2068.
8 D. Hermann, H. Emerich, R. Lepski, D. Schaniel andU. Ruschewitz, Inorg. Chem., 2013, 52, 2744–2749.
9 V. Dieckmann, S. Eicke, K. Springfeld and M. Imlau,Materials, 2012, 5, 1155–1175.
10 D. Schaniel, M. Imlau, T. Weisemoeller, T. Woike,K.W. Kramer andH.-U. Gudel, Adv. Mater., 2007, 19, 723–726.
11 M. Goulkov, D. Schaniel and T. Woike, J. Opt. Soc. Am. B,2010, 27, 927–932.
12 T. Woike, W. Kirchner, G. Schetter, T. Barthel, K. Hyung-sang and S. Haussuhl, Opt. Commun., 1994, 106, 6–10.
13 P. Coppens, I. Novozhilova and A. Kovalevsky, Chem. Rev.,2002, 102, 861–884.
14 D. Schaniel and T. Woike, Phys. Chem. Chem. Phys., 2009, 11,4391–4395.
15 A. Schuy, T. Woike and D. Schaniel, J. Sol-Gel Sci. Technol.,2009, 50, 403–408.
16 C. Seidel, U. Ruschewitz, A. Schuy, T. Woike and D. Schaniel,Z. Anorg. Allg. Chem., 2008, 634, 2018.
17 V. Dieckmann, M. Imlau, D. H. Taffa, L. Walder, R. Lepski,D. Schaniel and T. Woike, Phys. Chem. Chem. Phys., 2010,12, 3283–3288.
8 | RSC Adv., 2013, xx, 1–10 This journal is ª The Royal Society of Chemistry 2013
RSC Advances Paper
1
5
10
15
20
25
30
35
40
45
50
55
1
5
10
15
20
25
30
35
40
45
50
55

18 A. Cervellino, J. Schefer, L. Keller, T. Woike and D. Schaniel,J. Appl. Crystallogr., 2010, 43, 1040–1045.
19 B. H. Toby and T. Egami, Acta Crystallogr., Sect. A: Found.Crystallogr., 1992, 48, 336–346.
20 R. B. Neder and T. Proffen, Diffuse Scattering and DefectStructure Simulations, Oxford University Press, 2008.
21 T. Proffen, S. J. L. Billinge, T. Egami and D. Louca, Z.Kristallogr., 2003, 218, 132–143.
22 T. Egami and S. J. L. Billinge, Underneath the Bragg Peaks:Structural Analysis of Complex Materials, Pergamon, 2ndedn, 2012.
23 S. J. L. Billinge and M. G. Kanatzidis, Chem. Commun., 2004,749–760.
24 F. Pourpoint, X. Hua, D. S. Middlemiss, P. Adamson,D. Wang, P. G. Bruce and C. P. Grey, Chem. Mater., 2012,24, 2880–2893.
25 B. Key, M. Morcrette, J.-M. Tarascon and C. P. Grey, J. Am.Chem. Soc., 2011, 133, 503–512.
26 F. Atassi, C. Mao, A. S. Masadeh and S. R. Byrn, J. Pharm. Sci.,2010, 99, 3684–3697.
27 Y.-I. Kim, S. Cadars, R. Shayib, T. Proffen, C. S. Feigerle,B. F. Chmelka and R. Seshadri, Phys. Rev. B: Condens.Matter Mater. Phys., 2008, 78, 195205.
28 M. Shatnawi, G. Paglia, J. L. Dye, K. C. Cram, M. Lefenfeldand S. J. L. Billinge, J. Am. Chem. Soc., 2007, 129, 1386–1392.
29 J. Breger, N. Dupre, P. J. Chupas, P. L. Lee, T. Proffen,J. B. Parise and C. P. Grey, J. Am. Chem. Soc., 2005, 127,7529–7537.
30 E. Andrew, A. Bradbury and R. Eades, Nature, 1958, 182,1659.
31 E. Lippmaa, M. Maegi, A. Samoson, G. Engelhardt andA. R. Grimmer, J. Am. Chem. Soc., 1980, 102, 4889–4893.
32 I. S. Chuang, D. R. Kinney and G. E. Maciel, J. Am. Chem. Soc.,1993, 115, 8695–8705.
33 H. El Rassy, P. Buisson, B. Bouali, A. Perrard and A. C. Pierre,Langmuir, 2002, 19, 358–363.
34 E. Framery and P. H. Mutin, J. Sol-Gel Sci. Technol., 2002, 24,191–195.
35 D. H. Brouwer, R. J. Darton, R. E. Morris and M. H. Levitt,J. Am. Chem. Soc., 2005, 127, 10365–10370.
36 C. A. Fyfe and D. H. Brouwer, J. Am. Chem. Soc., 2006, 128,11860–11871.
37 G. Hartmeyer, C. Marichal, B. Lebeau, S. Rigolet, P. Caulletand J. Hernandez, J. Phys. Chem. C, 2007, 111, 9066–9071.
38 W. Lutz, D. Taschner, R. Kurzhals, D. Heidemann andC. Hubert, Z. Anorg. Allg. Chem., 2009, 635, 2191–2196.
39 C. Cannas, M. Casu, A. Musinu and G. Piccaluga, J. Non-Cryst. Solids, 2005, 351, 3476–3482.
40 H. El Rassy and A. C. Pierre, J. Non-Cryst. Solids, 2005, 351,1603–1610.
41 J. Walia, J. Crone, J. Liang, M. Niknam, C. Lemaire, R. TerryThompson and H. Peemoeller, Solid State Nucl. Magn.Reson., 2013, 49–50, 26–32.
42 J. Trebosc, J. W. Wiench, S. Huh, V. S.-Y. Lin and M. Pruski,J. Am. Chem. Soc., 2005, 127, 3057–3068.
43 P. T. Manoharan and W. C. Hamilton, Inorg. Chem., 1963, 2,1043–1047.
44 F. Bottomley and P. S. White, Acta Crystallogr., Sect. B: Struct.Crystallogr. Cryst. Chem., 1979, 35, 2193–2195.
45 M. Y. Antipin, V. Tsirelson, M. P. Flyugge, Y. T. Struchkovand R. P. Ozerov, Russ. J. Coord. Chem., 1987, 13, 67–75.
46 A. Navaza, G. Chevrier, P. M. Alzari and P. J. Aymonino, ActaCrystallogr., Sect. C: Cryst. Struct. Commun., 1989, 45, 839–841.
47 D. Schaniel, T. Woike, J. Schefer and V. Petrıcek, Phys. Rev. B:Condens. Matter Mater. Phys., 2005, 71, 174112.
48 M. D. Carducci, M. R. Pressprich and P. Coppens, J. Am.Chem. Soc., 1997, 119, 2669–2678.
49 B. Delley, J. Schefer and T. Woike, J. Chem. Phys., 1997, 107,10067–10074.
50 A. J. Schultz, B. N. Figgis and A. N. Sobolev, Acta Crystallogr.,Sect. C: Cryst. Struct. Commun., 2000, 56(Pt 11), 1289–1291.
51 H. E. Toma, J. A. Vanin and J. M. Malin, Inorg. Chim. Acta,1979, 33, L157–L159.
52 A. R. Butler, C. Glidewell, A. R. Hyde and J. McGinnis, Inorg.Chem., 1985, 24, 2931–2934.
53 D. Gross, N. Pislewski, U. Haeberlen and K. H. Hausser,J. Magn. Reson., 1983, 54, 236–252.
54 H. W. Spiess, Macromolecules, 2010, 43, 5479–5491.55 D. A. Torchia, J. Magn. Reson., 2011, 212, 1–10.56 M. R. Hansen, R. Graf and H. W. Spiess, Acc. Chem. Res.,
2013, 46(9), 1996–2007.57 J. Zhang and J. Jonas, J. Phys. Chem., 1993, 97, 8812–8815.58 F. Cros, L. Malier, J. P. Korb and F. Chaput, J. Sol-Gel Sci.
Technol., 1998, 13, 457–460.59 R. Kimmich, Chem. Phys., 2002, 284, 253–285.60 G. Buntkowsky, H. Breitzke, A. Adamczyk, F. Roelofs,
T. Emmler, E. Gedat, B. Gruenberg, Y. Xu, H.-H. Limbach,I. Shenderovich, A. Vyalikh and G. Findenegg, Phys. Chem.Chem. Phys., 2007, 9, 4843–4853.
61 W. Sangthong, M. Probst and J. Limtrakul, Chem. Eng.Commun., 2008, 195, 1486–1501.
62 T. Uemura, S. Horike, K. Kitagawa, M. Mizuno, K. Endo,S. Bracco, A. Comotti, P. Sozzani, M. Nagaoka andS. Kitagawa, J. Am. Chem. Soc., 2008, 130, 6781–6788.
63 R. Kimmich and N. Fatkullin, Macromolecules, 2010, 43,9821–9827.
64 M. Vogel, Eur. Phys. J.: Spec. Top., 2010, 189, 47–64.65 A. M. Nishchenko, D. I. Kolokolov, A. A. Gabrienko and
A. G. Stepanov, J. Phys. Chem. C, 2012, 116, 8956–8963.66 J. Krause, C. Schrage, A. Schuy, T. Woike, E. Kockrick,
S. Kaskel and D. Schaniel, Microporous Mesoporous Mater.,2011, 142, 245–250.
67 A. K. Soper and E. R. Barney, J. Appl. Crystallogr., 2011, 44,714–726.
68 A. Khitrin and B. M. Fung, J. Chem. Phys., 2000, 112, 2392–2398.
69 D. Massiot, F. Fayon, M. Capron, I. King, S. Le Calve,B. Alonso, J.-O. Durand, B. Bujoli, Z. Gan and G. Hoatson,Magn. Reson. Chem., 2002, 40, 70–76.
70 V. Zorin, GSim – visualisation and processing tool for NMRexperiments and simulations.
71 H. F. Poulsen, J. Neuefeind, H.-B. Neumann, J. R. Schneiderand M. D. Zeidler, J. Non-Cryst. Solids, 1995, 188, 63–74.
This journal is ª The Royal Society of Chemistry 2013 RSC Adv., 2013, xx, 1–10 | 9
Paper RSC Advances
1
5
10
15
20
25
30
35
40
45
50
55
1
5
10
15
20
25
30
35
40
45
50
55

72 C. J. Benmore and P. J. M. Monteiro, Cem. Concr. Res., 2010,40, 892–897.
73 K. W. Chapman, P. J. Chupas and C. J. Kepert, J. Am. Chem.Soc., 2005, 127, 11232–11233.
74 D. A. Keen, Phase Transitions, 1997, 61, 109–124.75 T. Proffen and R. B. Neder, J. Appl. Crystallogr., 1999, 32, 838–
839.
76 X. Xue and J. F. Stebbins, Phys. Chem.Miner., 1993, 20, 297–307.77 P. Blaha, K. Schwarz, W. Faber and J. Luitz, Hyperne
Interact., 2000, 126, 389–395.78 X. Ai, F. Deng, J. Dong, L. Chen and C. Ye, J. Phys. Chem. B,
2002, 106, 9237–9244.79 E. R. Andrew, A. Bradbury and R. G. Eades, Nature, 1958, 182,
1659–1659.
10 | RSC Adv., 2013, xx, 1–10 This journal is ª The Royal Society of Chemistry 2013
RSC Advances Paper
1
5
10
15
20
25
30
35
40
45
50
55
1
5
10
15
20
25
30
35
40
45
50
55


Étude multi-échelle des changements structuraux et leur influence sur les propriétés
optiques de complexes photoactifs encapsulés dans des matrices mésoporeuses
Résumé :
Les matériaux poreux silicatés ont été mis à profit pour encapsuler différents types de molécules, clusters ou nano-objets fonctionnels, donnant lieu à des nanocomposites hybrides organiques-inorganiques à propriétés physiques, chimiques ou biologiques remarquables. Elucider l’organisation structurale à l’échelle moléculaire de tels nanocomposites est indispensable pour l’analyse et la compréhension des propriétés macroscopiques qui en découlent. Ainsi, les techniques de diffusion totale associées à la fois à l’analyse Debye et la Fonction de Distribution de Paires (PDF) sont des méthodes de choix pour la caractérisation des propriétés structurales de matériaux hybrides nano-structurés.
Le principal objectif de ce travail consiste à l’utilisation des approches basées sur la diffusion totale de rayons X pour l’analyse structurale complète de molécules photoactives confinées dans des matrices silicatées amorphes avec différentes tailles de pores, afin d’étudier l’influence de l’organisation structurale sur les propriétés optiques et d’explorer également les limites de ces approches d’analyse. Nous avons étudié deux systèmes photoactifs. L’analyse structurale du premier complexe confiné, Na2[Fe(CN)5NO]·2H2O (SNP), a été entreprise par une approche multi-échelle combinant la RMN du solide et l’analyse PDF. Cette approche a permis l’identification de la nature des espèces incorporées, l’arrangement des cations et des anions ainsi que la distinction des différentes phases existantes : molécules isolées et nanoparticules. Les analyses Debye et PDF sur le deuxième composé étudié, [NdCl2(H2O)6]Cl, montrent que l’organisation structurale du complexe confiné est différente de celle du matériau massif cristallin. De plus, les cations Nd3+ changent de coordination de 8 à 9 durant le processus d’imprégnation et adoptent ainsi un arrangement structural très similaire à celui en solution aqueuse. Cette modification structurale est en accord avec le changement des propriétés luminescentes de ce complexe.
Mots clés : Diffusion totale, La fonction de distribution des paires (PDF), Nanocristallographie, Analyse Debye, Molécules photoactives, Nanomatériaux hybrides, Luminescence, Terres rares. _________________________________________________________________________________
Multiscale study of the influence of the structural changes on the optical properties of
photoactive complexes confined in mesoporous matrices
Abstract :
Silica xerogels are versatile host materials for the inclusion of molecules, clusters, or nano-objects yielding host-guest compounds with unique physical, chemical or biological properties. The knowledge of the structural organization of the guest within the host is crucial for the understanding of its properties. Total scattering methods, based on Debye function analysis (DFA) and Pair Distribution Function (PDF), have become powerful tools for structural characterization of nanostructured hybrid materials.
The aim of this work is to use the X-ray total scattering method to obtain structural information on photoactive molecules embedded into amorphous silica hosts with different pore sizes, to correlate their structure with the optical properties, and to explore the limitations of the chosen method. Two different photoactive complexes have been investigated. In the first example, the combined PDF and NMR study on Na2[Fe(CN)5NO]·2H2O (SNP) embedded into silica matrices allows to extract the nature of the inserted species: quasi-free isolated molecules can be distinguished from nanoparticles and in the former case a model for the arrangement of cation-anion can be proposed from the PDF analysis. In the second example, a luminescent Nd3+ complex, the PDF and DFA analysis reveal that the structural organization of the embedded Nd3+ complexes is different from that of the crystalline material. Furthermore, the Nd3+ cations change the coordination from 8 to 9 during the wet-impregnation doping and adopt very similar structural arrangement as in aqueous solution, which is in agreement with the observed change in the luminescence properties.
Keywords: Total scattering, Pair distribution function (PDF), Debye function, Nanocrystallography, Photoactive molecules, Guest-host nano-materials, Luminescence, Rare-earth.