lidar in hayabusa mission - nasa · pulse width tx beam width rx fov rx optics 50m~50km...
TRANSCRIPT
Hayabusa LIDAR
LIDAR in HAYABUSA Mission
Takahide MizunoInstitute of Space and Astronautical Science JAXA
Katsuhiko Tsuno, Eisuke OkumuraNEC Toshiba Space Systems Ltd.
Michio NakayamaToshiba Corporation

•Outline of HAYABUSA Mission•How to use LIDAR?•LIDAR System & components•Lessons Learned•Ranging Data at Touchdown•Conclusion
Agenda
Hayabusa LIDAR

HAYABUSA Objectives
Hayabusa LIDAR
HAYABUSA is Spacecraft to demonstrate following technologyand to observe small asteroid Itokawa.
- Operation of Ion Engines for more than - Earth Gravity Assist with Ion Engines- Rendezvous with Itokawa with Autonomous Navigation- Scientific Observation of Itokawa- Touch-down and Sample Collection- Return and Recovery of Capsule

HAYABUSA Today
Hayabusa LIDAR
LaunchedMay 9, 2003
Earth SwingbyMay 19, 2004
Arrival at ItokawaSeptember 12, 2005
First touchdownNovember 19, 2005
Second TouchdownNovember 25, 2005
Preparation to return voyageNow

Spacecraft Trajectory
GP (Gate Position) AcquisitionGlobal Mapping, Remote SensingGravity and Solar radiation Estimation,
HP(Home Position) Keeping Remote SensingDetailed Global Mapping,
Earth Direction
Approach by RCS
~7km
~20km
X
Rendezvous and Landing Sequence
50km
50m
50,000km
R&RR
R&RR + ONC + LIDAR
R&RR + ONC
R&RR + ONC + LRF
Δ=2000km
Δ=2~3 km
Δ=~6 mSignal Level60dB
Hayabusa LIDAR

Telescopic Camera (ONC-T)
ISAS Robot Lander MINERVA
Sample Collector Horn
Laser Range Finder
Solar Array Panel Target MarkerX-ray FluorescentSpectrometer
Wide-angle Camera (ONC-W1)
Fan Beam Sensor (one of four)
Near Infrared Spectrometer
LIDAR
Medium Gain Antenna
Start Tracker (STT)Sample Recovery Capsule
Bottom Panel View of HAYABUSA
Hayabusa LIDAR

240mm×228mm×250mmRadiator: 240mm×300mm
Size
17.0W (+LD Heater max5W) Power
3.7kgInclude: DC/DC, Radiator
Weight
Q-SW, Nd:Cr:YAG1064 nm8 mJ14 nsecφ1.7 mrad(1/e2)
φ1 mradCasegren φ126 mm、SiC
LaserWave lengthOutput PowerPulse WidthTX Beam WidthRX FOVRX Optics
50m~50km±1m(@50m) 1Hz
RangeAccuracyRepetition Rate
Specification Items
HAYABUSA LIDAR
Hayabusa LIDAR
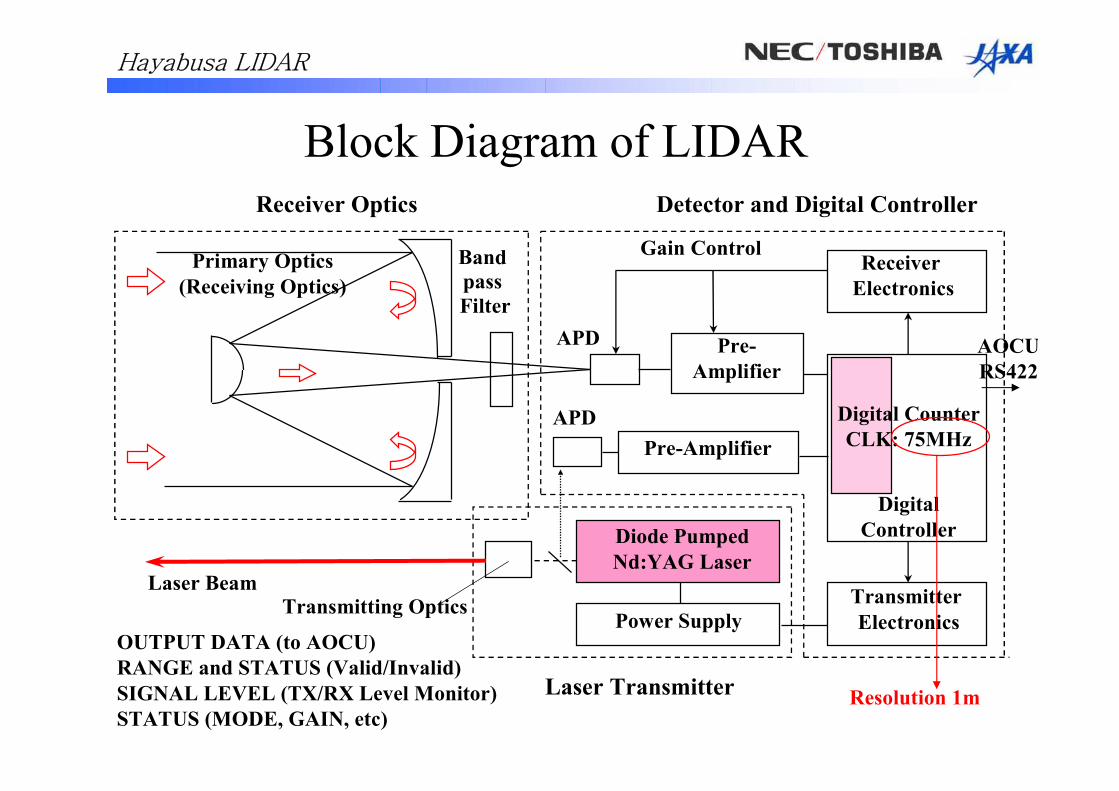
Laser Transmitter
BandpassFilter
APD
Gain Control
Pre-Amplifier
ReceiverElectronics
Receiver Optics
Primary Optics(Receiving Optics)Primary Optics
(Receiving Optics)
Diode Pumped Nd:YAG Laser
Power SupplyTransmitterElectronics
Laser Beam
Detector and Digital Controller
APDPre-Amplifier
Transmitting OpticsTransmitting Optics
Block Diagram of LIDAR
Digital CounterCLK: 75MHz
DigitalController
Resolution 1m
Hayabusa LIDAR
OUTPUT DATA (to AOCU)RANGE and STATUS (Valid/Invalid)SIGNAL LEVEL (TX/RX Level Monitor)STATUS (MODE, GAIN, etc)
AOCURS422

RX Casegren Telescope
Main Reflector Truss Sub Reflector
Surface Irregularity 0.18μmP-V
FOV: 1mradSiC: Small Thermal Expansion
Hayabusa LIDAR

YAG Laser Resonator
Pumping PeriodQ Switch Open
LiNbO3
Nd:Cr:YAG Rod
Laser Beam
Trapezoid Prism Output Mirror
PolarizerLaser Diode
Porro Prism
Wedge Plate Wave Plate
Hayabusa LIDAR
- Single Mode Q-Switched Diode Pumped Nd:YAG- LD is thermally controlled between 30 and 35 degrees by thermostat
to tune LD wave length to the absorption line.-Some protective windows are installed to avoid radiation damagedue to contaminations.
- Pockels Cell is driven by 2.7kV high voltage driver. - Output Laser is expanded by expander with magnification of 3.

Lessons Learned
•Deterioration of LD•Damaged by contamination•LiNbO3•Thermal Vacuum test
Hayabusa LIDAR
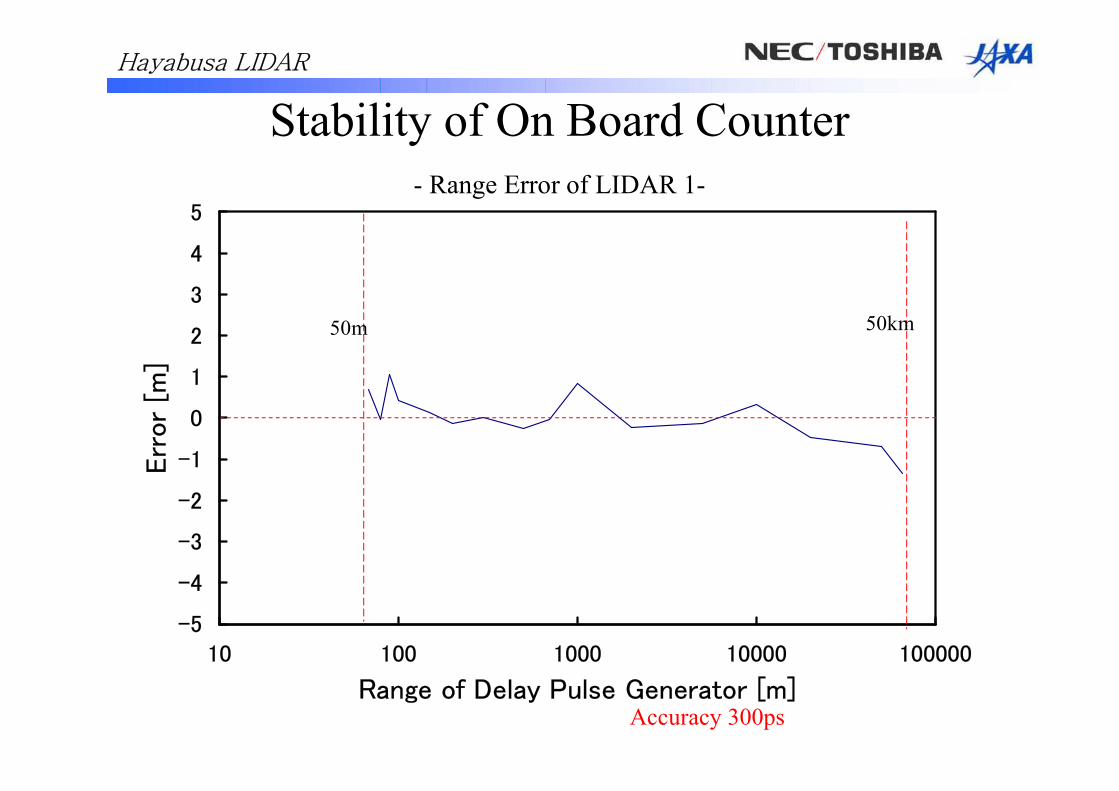
Stability of On Board Counter- Range Error of LIDAR 1-
-5
-4
-3
-2
-1
0
1
2
3
4
5
10 100 1000 10000 100000
Range of Delay Pulse Generator [m]
Err
or
[m]
Accuracy 300ps
50m 50km
Hayabusa LIDAR
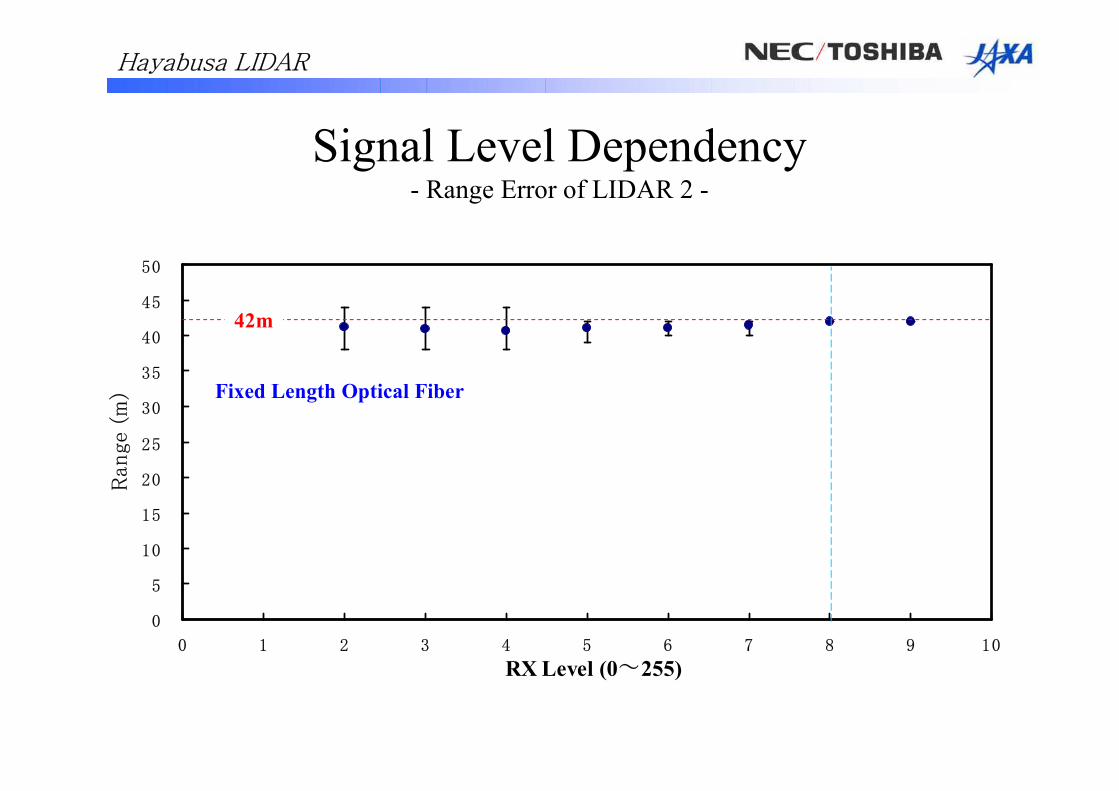
Signal Level Dependency- Range Error of LIDAR 2 -
0
5
10
15
20
25
30
35
40
45
50
0 1 2 3 4 5 6 7 8 9 10
RX Level (0~255)
Range (
m)
42m
Fixed Length Optical Fiber
Hayabusa LIDAR
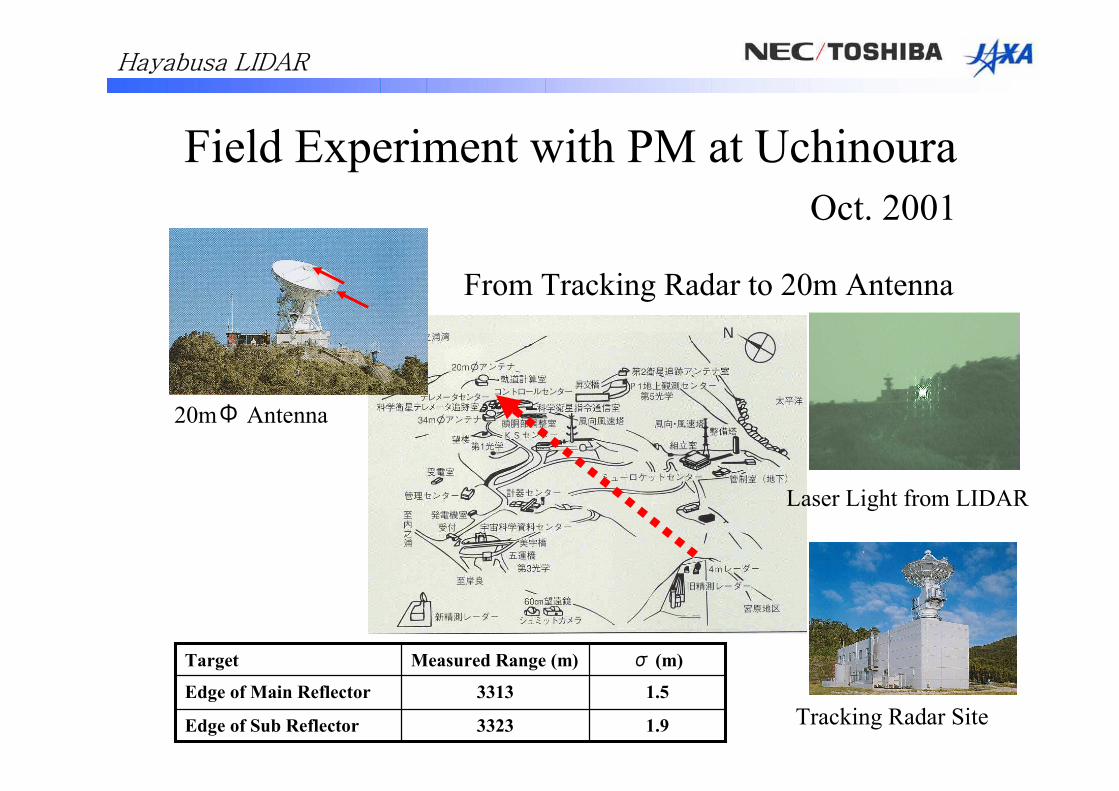
From Tracking Radar to 20m Antenna
Field Experiment with PM at UchinouraOct. 2001
1.93323Edge of Sub Reflector
1.53313Edge of Main Reflector
σ (m)Measured Range (m)Target
20mΦ Antenna
Tracking Radar Site
Laser Light from LIDAR
Hayabusa LIDAR

LIDAR First Light
0
10000
20000
30000
40000
50000
60000
70000
09/10 00:00:00 09/10 12:00:00 09/11 00:00:00 09/11 12:00:00 09/12 00:00:00 09/12 12:00:00
Date and Time(UST)
Ran
ge (
m)
0
5
10
15
20
25
30
35
40
RX
LEV
EL (
count)
TX level
9/10 4:26:2648602m
9/10 5:55:1847182m
9/10 6:07:5146970m
Gate Position
48.6km
GP
RX Signal Level
30cm/sec
Hayabusa LIDAR

Ranging Result at First Landing R
ange
(m)
Universal Time
19 Nov. 2005
RX
Lev
el
Hayabusa LIDAR
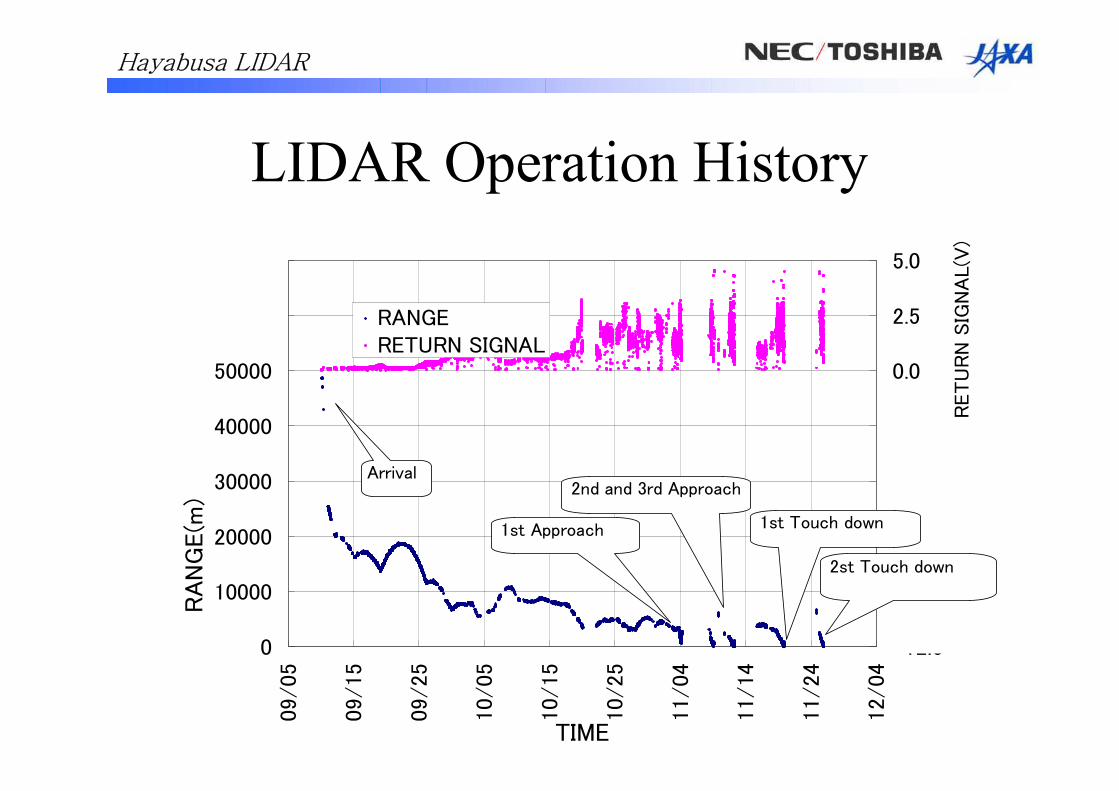
LIDAR Operation History
0
10000
20000
30000
40000
50000
60000
7000009/05
09/15
09/25
10/05
10/15
10/25
11/04
11/14
11/24
12/04
TIME
RA
NG
E(m
)
-12.5
-10.0
-7.5
-5.0
-2.5
0.0
2.5
5.0
RETU
RN
SIG
NA
L(V
)
RANGERETURN SIGNAL
1st Touch down
2st Touch down
1st Approach
2nd and 3rd ApproachArrival
Hayabusa LIDAR

188.6188.5
42.943.3
Calculation from shadow (m)
38.539.9
LIDAR Range (m)
Good agreement!
Calibration with shadow of HAYABUSA
No Range Bias.
Hayabusa LIDAR

Measurement of ITOKAWA Surface
Hayabusa LIDAR
-Tukuba boulder with 3-4m heightwas identified
-A possible rock fissure was also identified
- Rough Terrain: Surface roughnessnear Tsukuba Boulder: 2.2m
- Smooth Terrain: Surface roughness in the Muses Sea: 0.6m
Gravity (Mass) Estimation of ITOKAWA=> Science June 2 2006

Conclusion
-Three month LIDAR operation is successfully performedwith 4.1 million laser shot.
- No Laser power degradation was observed.-HAYABUSA had successfully rendezvoused with ITOKAWA
by LIDAR data.-HAYABUSA had successfully touchdown based on its navigation sensor including LIDAR.
-LIDAR detected the range from 50km to 30m.-LIDAR data will provide important surface information of ITOKAWA
Hayabusa LIDAR