licl-kcl−ucl phase diagram studies - ne.anl.gov · rate for 46.6 mol% licl in kcl (duplicate...
TRANSCRIPT
LiCl-KCl−UCl� Phase Diagram Studies
Frances Dozier Sutherland*, Amber Hames †, Robert Blaskovitz †, James Willit †, Mark Williamson ††Argonne National Laboratory
*Defense Nuclear Facilities Safety Board
International Pyroprocessing Research Conference
August 29, 2012
Outline
� Introduction
� Background
� Thermal analysis system
� Pseudo-binary systems
� Anneal and quench studies
� Summary
2
3
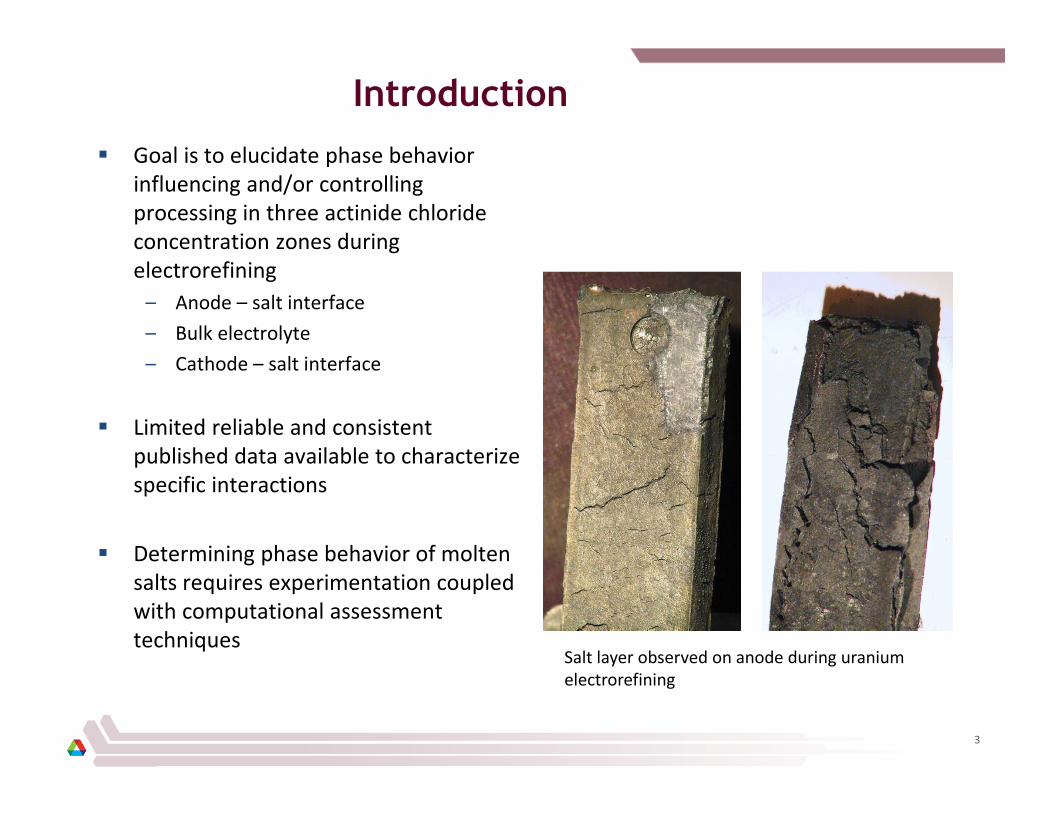
Introduction
� Goal is to elucidate phase behavior
influencing and/or controlling
processing in three actinide chloride
concentration zones during
electrorefining
– Anode – salt interface
– Bulk electrolyte
– Cathode – salt interface
� Limited reliable and consistent
published data available to characterize
specific interactions
� Determining phase behavior of molten
salts requires experimentation coupled
with computational assessment
techniquesSalt layer observed on anode during uranium
electrorefining
4
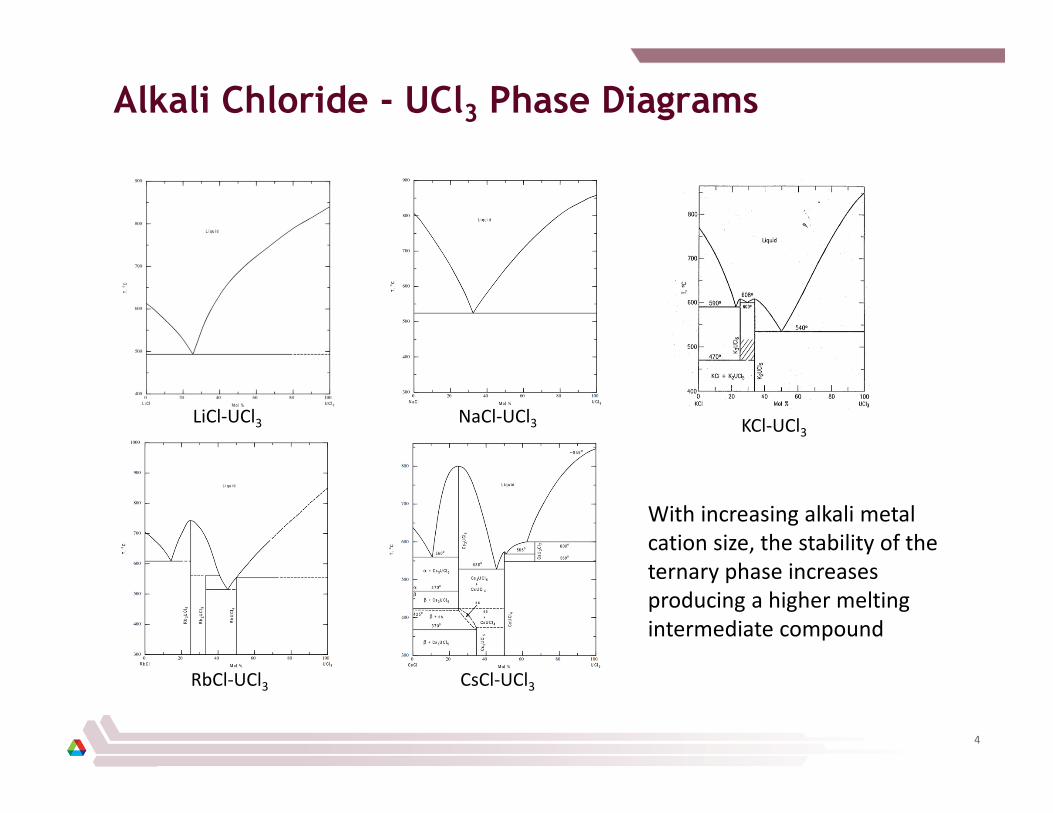
Alkali Chloride - UCl3 Phase Diagrams
LiCl-UCl3 NaCl-UCl3 KCl-UCl3
RbCl-UCl3 CsCl-UCl3
With increasing alkali metal
cation size, the stability of the
ternary phase increases
producing a higher melting
intermediate compound
5
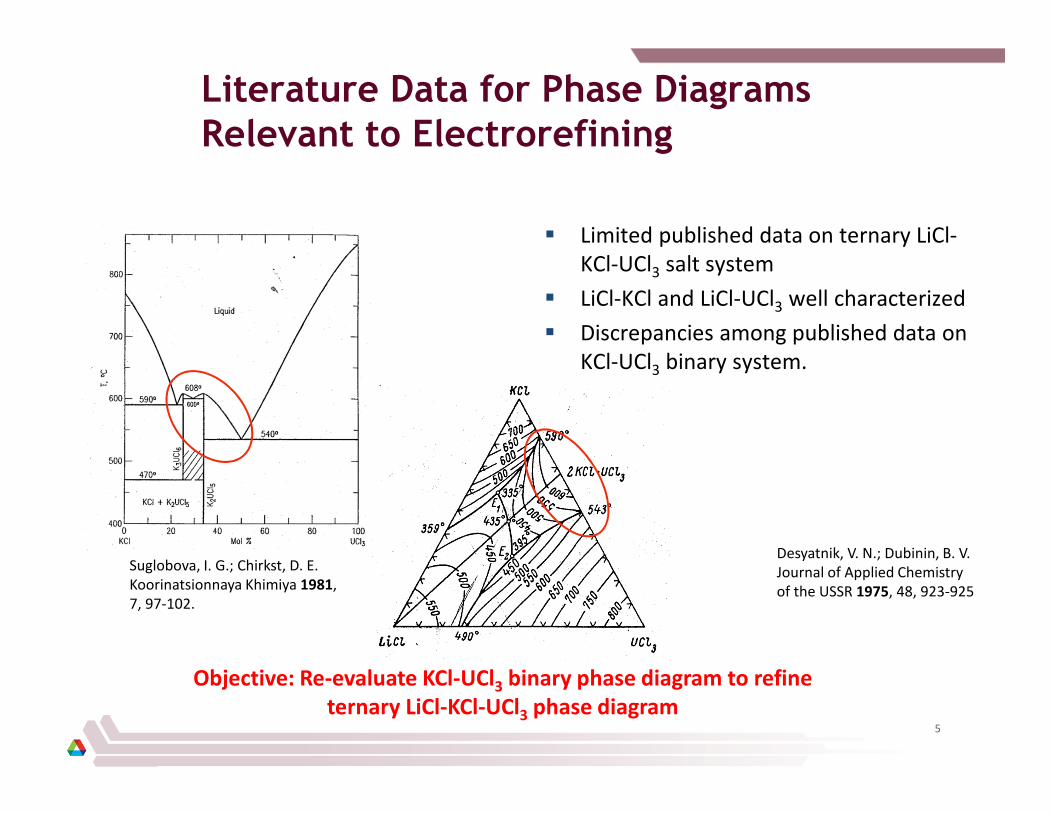
Literature Data for Phase Diagrams
Relevant to Electrorefining
� Limited published data on ternary LiCl-
KCl-UCl3 salt system
� LiCl-KCl and LiCl-UCl3 well characterized
� Discrepancies among published data on
KCl-UCl3 binary system.
Objective: Re-evaluate KCl-UCl3 binary phase diagram to refine
ternary LiCl-KCl-UCl3 phase diagram
Suglobova, I. G.; Chirkst, D. E.
Koorinatsionnaya Khimiya 1981,
7, 97-102.
Desyatnik, V. N.; Dubinin, B. V.
Journal of Applied Chemistry
of the USSR 1975, 48, 923-925
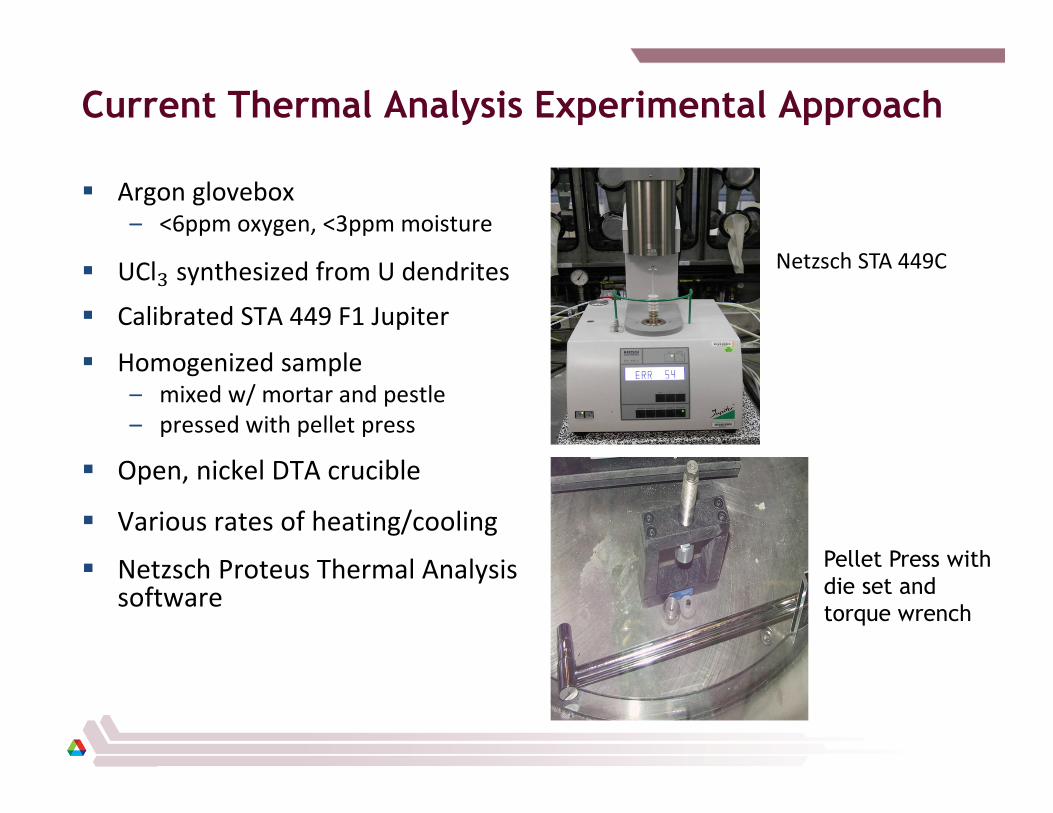
Current Thermal Analysis Experimental Approach
� Argon glovebox – <6ppm oxygen, <3ppm moisture
� UCl� synthesized from U dendrites
� Calibrated STA 449 F1 Jupiter
� Homogenized sample– mixed w/ mortar and pestle
– pressed with pellet press
� Open, nickel DTA crucible
� Various rates of heating/cooling
� Netzsch Proteus Thermal Analysis software
Pellet Press with
die set and
torque wrench
Netzsch STA 449C
7
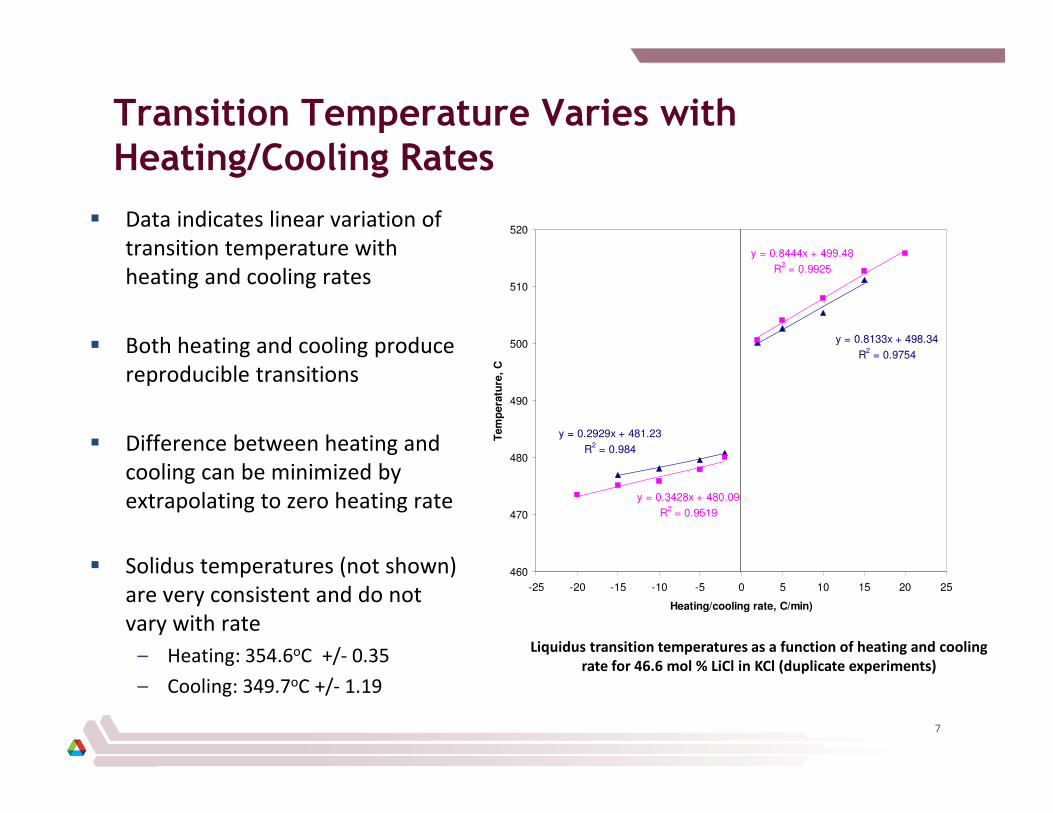
Transition Temperature Varies with
Heating/Cooling Rates
� Data indicates linear variation of
transition temperature with
heating and cooling rates
� Both heating and cooling produce
reproducible transitions
� Difference between heating and
cooling can be minimized by
extrapolating to zero heating rate
� Solidus temperatures (not shown)
are very consistent and do not
vary with rate
– Heating: 354.6oC +/- 0.35
– Cooling: 349.7oC +/- 1.19
y = 0.8133x + 498.34
R2 = 0.9754
y = 0.2929x + 481.23
R2 = 0.984
y = 0.8444x + 499.48
R2 = 0.9925
y = 0.3428x + 480.09
R2 = 0.9519
460
470
480
490
500
510
520
-25 -20 -15 -10 -5 0 5 10 15 20 25
Heating/cooling rate, C/min)
Tem
pe
ratu
re,
C
Liquidus transition temperatures as a function of heating and cooling
rate for 46.6 mol % LiCl in KCl (duplicate experiments)
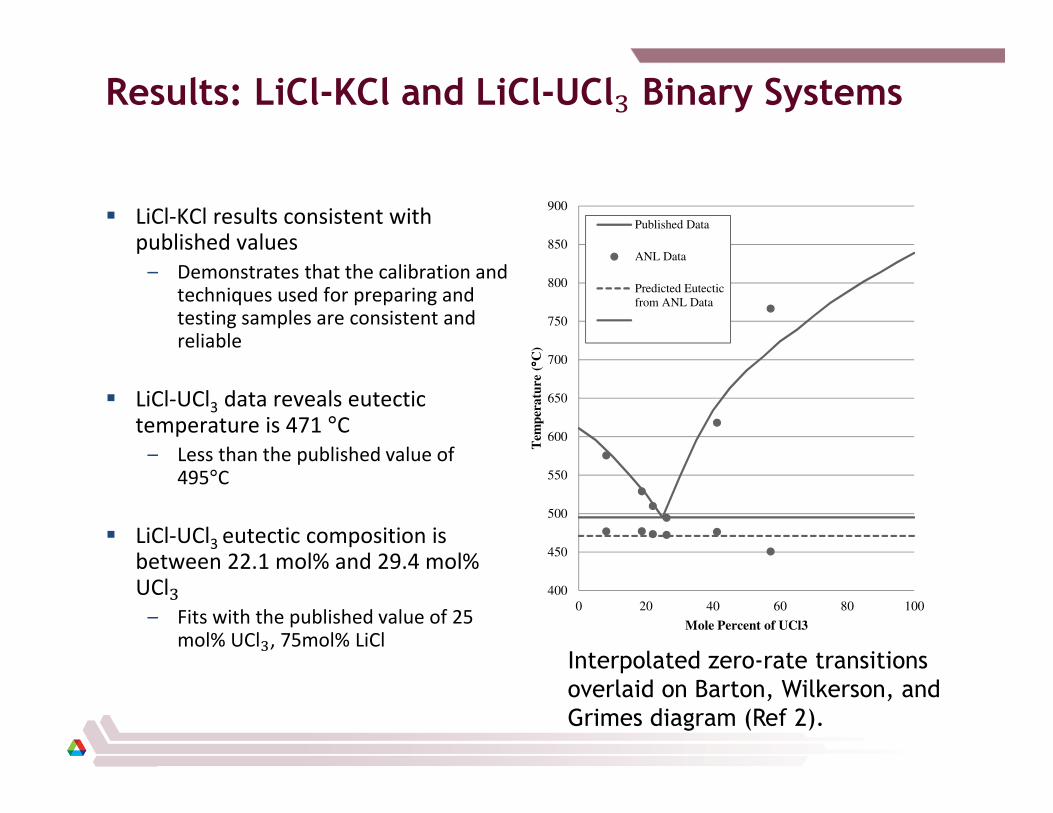
Results: LiCl-KCl and LiCl-UCl� Binary Systems
� LiCl-KCl results consistent with published values
– Demonstrates that the calibration and techniques used for preparing and testing samples are consistent and reliable
� LiCl-UCl3 data reveals eutectic temperature is 471 °C
– Less than the published value of 495°C
� LiCl-UCl3 eutectic composition is between 22.1 mol% and 29.4 mol% UCl�
– Fits with the published value of 25 mol% UCl�, 75mol% LiCl
400
450
500
550
600
650
700
750
800
850
900
0 20 40 60 80 100
Tem
per
atu
re (
°° °°C
)
Mole Percent of UCl3
Published Data
ANL Data
Predicted Eutectic
from ANL Data
Interpolated zero-rate transitions
overlaid on Barton, Wilkerson, and
Grimes diagram (Ref 2).
Results: KCl-UCl� Binary System
There are significant differences between ANL data and published Suglobova and
Chirkst diagram (Ref 3).
� Inconsistencies exist between the limited literature on the KCl-UCl3 system and
ANL data.
– current work shows that quartz reacts with UCl�, bringing published data into
question
� Determine validity of UCl�-KCl ternary phases by running anneal and quench
experiments to identify ternary phases present in system
Possible Quartz-UCl� Reaction
� Possible reaction is:
2UCl3 (s) + SiO2 (s) = 2UOCl (s) + SiCl4 (g)
� Quartz was added to UCl3-KCl and UCl3-LiCl systems
– Data exhibited shifts in transition temperature on repeated cycles
– No such systematic shifts were observed on repeated cycling in the absence of quartz
� X-ray diffraction (XRD) was employed to verify the presence of UOCl, the reaction product of
the SiO2-UCl3 reaction.
– Thermal cycled sample loaded onto slide in inert atmosphere glovebox
� XRD Samples analyzed possessed unidentifiable peaks
– Peak intensities were low, inconsistent in repeated runs, and did not exhibit exact
matches in 2θ values for the largest peaks of any of the possible substances present
– Most intense observable peaks for SiO2, UOCl, and UCl3 are at very close 2θ values
– Larger sample sizes would improve the quality of the X-ray data
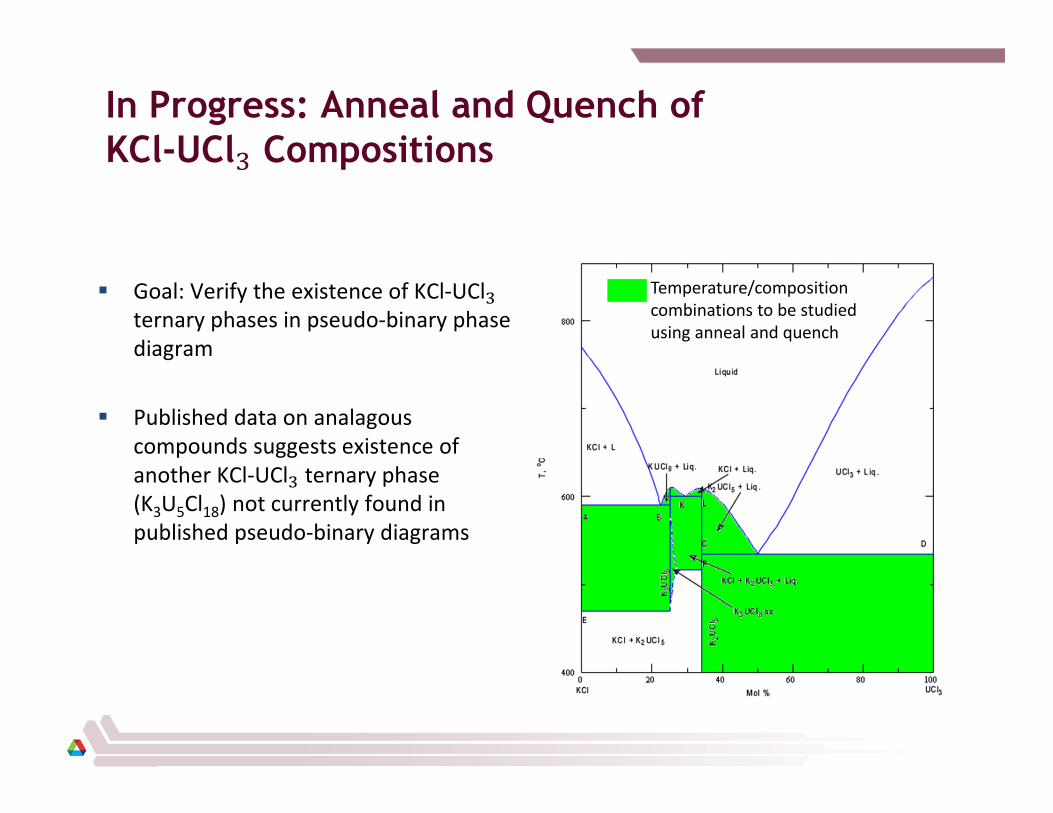
In Progress: Anneal and Quench of
KCl-UCl� Compositions
� Goal: Verify the existence of KCl-UCl�ternary phases in pseudo-binary phase
diagram
� Published data on analagous
compounds suggests existence of
another KCl-UCl� ternary phase
(K3U5Cl18) not currently found in
published pseudo-binary diagrams
Temperature/composition
combinations to be studied
using anneal and quench
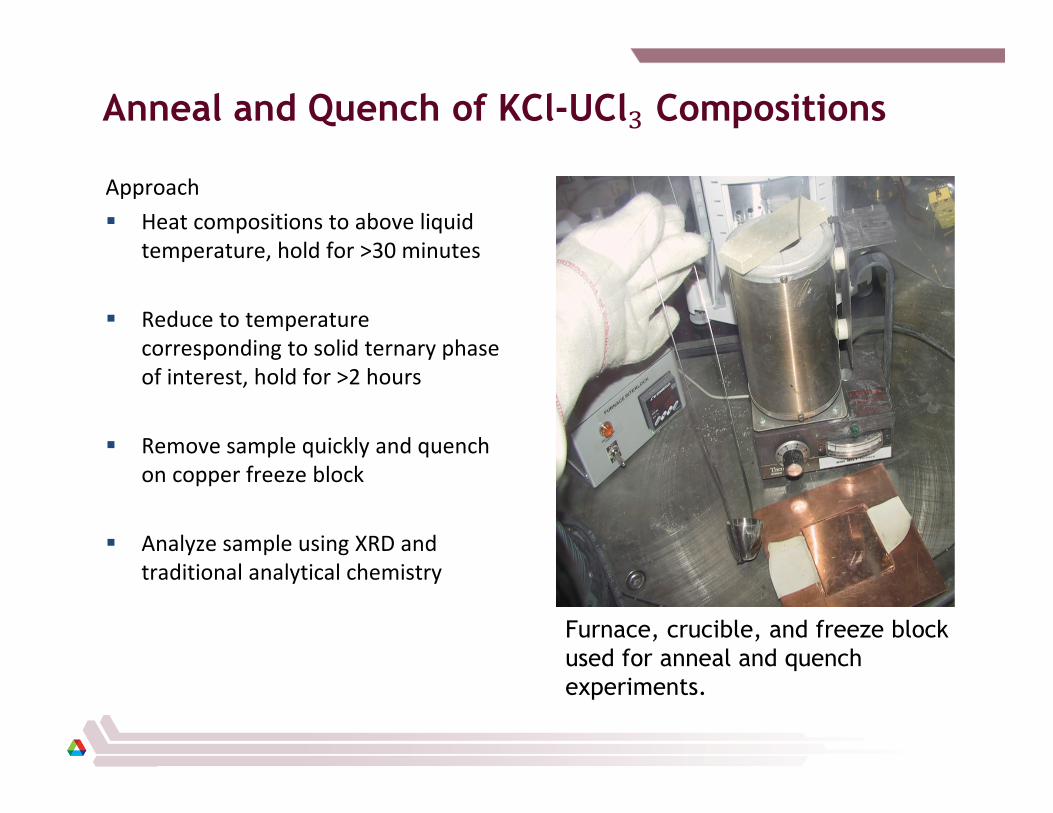
Anneal and Quench of KCl-UCl� Compositions
Approach
� Heat compositions to above liquid
temperature, hold for >30 minutes
� Reduce to temperature
corresponding to solid ternary phase
of interest, hold for >2 hours
� Remove sample quickly and quench
on copper freeze block
� Analyze sample using XRD and
traditional analytical chemistry
Furnace, crucible, and freeze block
used for anneal and quench
experiments.
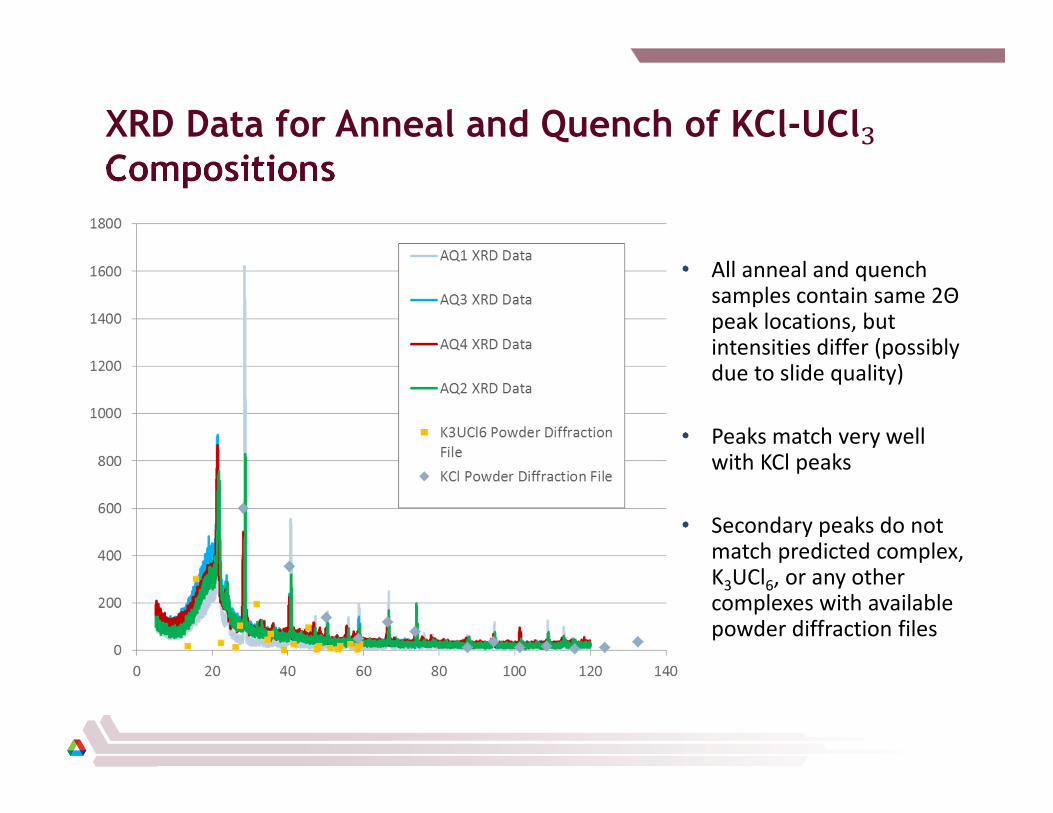
XRD Data for Anneal and Quench of KCl-UCl�Compositions
• All anneal and quench samples contain same 2Θpeak locations, but intensities differ (possibly due to slide quality)
• Peaks match very well with KCl peaks
• Secondary peaks do not match predicted complex, K3UCl6, or any other complexes with available powder diffraction files
Additional Comments on KCl-UCl�Anneal and Quench Experiments
� KCl-UCl3 ternary phases or UCl3 should also be identifiable, but are not evident in
x-ray patterns
– Large differences found between the predicted concentrations of
unquenched samples and the analytically determined concentrations
– Likely that samples were never taken to temperature above the liquidus for
the projected composition
� Additional procedure modifications necessary to
– Ensure homogeneity of sample during heating/quenching
– Verify concentration of unquenched sample to ensure that liquidus
temperature is reached prior to quenching
Summary
� LiCl-KCl results consistent with published values
– demonstrates that the calibration and techniques used for preparing and testing
samples are consistent and reliable
� LiCl-UCl3 data show that eutectic temperature for system is 471 °C
– Less than the published value of 495°C, probably due to methods used to determine
transition temperature
– Eutectic composition for LiCl-UCl3 system is between 22.1 mol% and 29.4 mol% UCl�,
which is consistent with the published value of 25 mol% UCl�, 75mol% LiCl
� Inconsistencies still exist between the limited literature on the KCl-UCl3 system and
ANL data
– UCl�-quartz reaction could be one reason for discrepancies
� Anneal and quench work in progress to determine identity of UCl3-KCl ternary
phases
– Experimental procedures are being refined to ensure phase formation prior to
quenching
Acknowledgements
Government License Notice
� The submitted manuscript has been created by UChicago Argonne, LLC, Operator
of Argonne National Laboratory (“Argonne”). Argonne, a U.S. Department of
Energy Office of Science laboratory, is operated under Contract No. DE-AC02-
06CH11357. The U.S. Government retains for itself, and others acting on its behalf,
a paid-up nonexclusive, irrevocable worldwide license in said article to reproduce,
prepare derivative works, distribute copies to the public, and perform publicly and
display publicly, by or on behalf of the Government.
� This work was supported by the U.S. Department of Energy, Office of Nuclear
Energy, under Contract DE-AC02-06CH11357.
16