licensed to - faculty.southwest.tn.edufaculty.southwest.tn.edu/hprovinc/content/materials/lecture...
TRANSCRIPT
Licensed to:
© 2010 Brooks/Cole, Cengage Learning
ALL RIGHTS RESERVED. No part of this work covered by the copy-right herein may be reproduced, transmitted, stored, or used in anyform or by any means graphic, electronic, or mechanical, includingbut not limited to photocopying, recording, scanning, digitizing, tap-ing, Web distribution, information networks, or information storageand retrieval systems, except as permitted under Section 107 or 108of the 1976 United States Copyright Act, without the prior writtenpermission of the publisher.
Library of Congress Control Number: 2008934780
Student Edition
ISBN-13: 978-0-547-13249-5
ISBN-10: 0-547-13249-2
Annotated Instructor’s Edition
ISBN-13: 978-0-547-18852-2
ISBN-10: 0-547-18852-8
Brooks/Cole10 Davis DriveBelmont, CA 94002-3098USA
Cengage Learning is a leading provider of customized learning solu-tions with office locations around the globe, including Singapore, theUnited Kingdom, Australia, Mexico, Brazil, and Japan. Locate yourlocal office at www.cengage.com/global.
Cengage Learning products are represented in Canada by Nelson Education, Ltd.
For your course and learning solutions, visitacademic.cengage.com.
Purchase any of our products at your local college store or at our preferred online store www.ichapters.com.
Understanding Basic Statistics, Fifth EditionCharles Henry Brase and Corrinne Pellillo Brase
Senior Acquiring Sponsoring Editor:Molly Taylor
Development Editor: Carl Chudyk
Editorial Associate: Andrew Lipsett
Associate Media Editor: Catie Ronquillo
Senior Marketing Manager: Greta Kleinert
Marketing Coordinator: Angela Kim
Marketing Communications Manager:Mary Anne Payumo
Project Manager, Editorial Production:Paula Kmetz
Art & Design Manager: Jill Haber
Senior Manufacturing Coordinator: Diane Gibbons
Photo Researcher: Lisa Jelly Smith
Copy Editor: Jean Bermingham
Cover Designer: Nina Wishnok
Cover Image: © Roy Toft/Getty Images
Compositor: Nesbitt Graphics, Inc.
A complete list of photo credits appears inthe back of the book, immediatelyfollowing the appendix.
TI-83Plus and TI-84Plus are registeredtrademarks of Texas Instruments, Inc.SPSS is a registered trademark of SPSS, Inc.Minitab is a registered trademark ofMinitab, Inc.Microsoft Excel Screen Shots reprinted bypermission from Microsoft Corporation.Excel, Microsoft, and Windows are eitherregistered trademarks or trademarks ofMicrosoft Corporation in the UnitedStates and/or other countries.
For product information and technology assistance, contact us at Cengage Learning Customer & Sales Support, 1-800-354-9706.
For permission to use material from this text or product, submit all requests online at www.cengage.com/permissions.
Further permissions questions can be e-mailed [email protected].
Printed in Canada 1 2 3 4 5 6 7 12 11 10 09 08
1048629_FM_SE_pi-xxviii,1.qxd 9/25/08 3:26 PM Page iv
Copyright 2010 Cengage Learning, Inc. All Rights Reserved.May not be copied, scanned, or duplicated, in whole or in part.
Licensed to:

Louis Pasteur (1822–1895) is the founder of modernbacteriology. When studying cholera, he accidentallyleft some bacillus culture unattended over the sum-mer. In the fall, he injected laboratory animals withthis bacilli. To his surprise, the animals did not die—in fact, they had become vaccinated against cholera!
As the first quote at the left reminds us, ourchances of success are greatly improved if we have a“prepared mind.” The statistical methods you willlearn in this book will help you achieve a preparedmind for the study of many different fields. The sec-ond quote reminds us that statistics is an importanttool, but it is not a replacement for an in-depthknowledge of the field to which it is being applied.
The authors of this book want you to understandand enjoy statistics. The reading material will tell youabout the subject. The examples will show you how it works. To understand, however, you must get in-volved. Guided exercises, calculator and computer ap-plications, section and chapter problems, and writingexercises are all designed to get you involved in thesubject. As you grow in your understanding of statis-tics, we believe you will enjoy learning a subject thathas a world full of interesting applications.
Chance favors the pre-
pared mind.
—Louis Pasteur
Statistical techniques are
tools of thought . . . not
substitutes for thought.
—Abrahm Kaplan
1
For on-line student resources, visit the Brase/Brase, Understanding Basic Statistics, 5th edition web site atwww.cengage.com/statistics/Brase/UBS5e.
1.1 What Is Statistics?
1.2 Random Samples
1.3 Introduction to Experimental Design
2
1048629_Brase_CH01_p002-033 8/4/08 4:16 PM Page 2
Copyright 2010 Cengage Learning, Inc. All Rights Reserved.May not be copied, scanned, or duplicated, in whole or in part.
Licensed to:

F O C U S P R O B L E M
Where Have All the Fireflies Gone?
A feature article in The Wall Street Journal discusses the disappearance offireflies. In the article, Professor Sara Lewis of Tufts University and otherscholars express concern about the decline in the worldwide population of fireflies.
There are a number of possible explanations for the decline, including habitat reduction of woodlands,wetlands, and open fields; pesticides; and pollution.Artificial nighttime lighting might interfere with theMorse-code-like mating ritual of the fireflies. Somechemical companies pay a bounty for fireflies becausethe insects contain two rare chemicals used in medicalresearch and electronic detection systems in spacecraft.
What does any of this have to do with statistics?The truth, at this time, is that no one really knows
(a) how much the world firefly population has declinedor (b) how to explain the decline. The population of allfireflies is simply too large to study in its entirety.
In any study of fireflies, we must rely on incompleteinformation from samples. Furthermore, from thesesamples we must draw realistic conclusions that havestatistical integrity. This is the kind of work that makesuse of statistical methods to determine ways to collect,analyze, and investigate data.
Suppose you are conducting a study to comparefirefly populations exposed to normal daylight/darkness conditions with fire-fly populations exposed to continuous light (24 hours a day). You set up twofirefly colonies in a laboratory environment. The two colonies are identical
Getting Started
P R E V I E W Q U EST I O N S
Why is statistics important? (SECTION 1.1)
What is the nature of data? (SECTION 1.1)
How can you draw a random sample? (SECTION 1.2)
What are other sampling techniques? (SECTION 1.2)
How can you design ways to collect data? (SECTION 1.3)
Adapted from Ohio State University Firefly Files logo
3
1048629_Brase_CH01_p002-033 8/4/08 4:16 PM Page 3
Copyright 2010 Cengage Learning, Inc. All Rights Reserved.May not be copied, scanned, or duplicated, in whole or in part.
Licensed to:

4 Chapter 1 GETTING STARTED
except that one colony is exposed to normal daylight/darkness conditions and theother is exposed to continuous light. Each colony is populated with the same num-ber of mature fireflies. After 72 hours, you count the number of living fireflies ineach colony.
After completing this chapter, you will be able to answer the followingquestions.
(a) Is this an experiment or an observation study? Explain.
(b) Is there a control group? Is there a treatment group?
(c) What is the variable in this study?
(d) What is the level of measurement (nominal, interval, ordinal, or ratio) of thevariable?
(See Problem 9 of the Chapter 1 Review Problems.)
S EC T I O N 1 . 1 What Is Statistics?
FOCUS POINTS
• Identify variables in a statistical study.• Distinguish between quantitative and qualitative variables.• Identify populations and samples.• Distinguish between parameters and statistics.• Determine the level of measurement.• Compare descriptive and inferential statistics.
IntroductionDecision making is an important aspect of our lives. We make decisions based onthe information we have, our attitudes, and our values. Statistical methods helpus examine information. Moreover, statistics can be used for making decisionswhen we are faced with uncertainties. For instance, if we wish to estimate theproportion of people who will have a severe reaction to a flu shot without givingthe shot to everyone who wants it, statistics provides appropriate methods. Sta-tistical methods enable us to look at information from a small collection of peo-ple or items and make inferences about a larger collection of people or items.
Procedures for analyzing data, together with rules of inference, are centraltopics in the study of statistics.
Statistics is the study of how to collect, organize, analyze, and interpretnumerical information from data.
The statistical procedures you will learn in this book should supplement yourbuilt-in system of inference—that is, the results of statistical procedures and goodsense should dovetail. Of course, statistical methods themselves have no power towork miracles. These methods can help us make some decisions, but not all con-ceivable decisions. Remember, a properly applied statistical procedure is no moreaccurate than the data, or facts, on which it is based. Finally, statistical resultsshould be interpreted by one who understands not only the methods, but also thesubject matter to which they have been applied.
The general prerequisite for statistical decision making is the gathering ofdata. First, we need to identify the individuals or objects to be included in thestudy and the characteristics or features of the individuals that are of interest.
Statistics
1048629_Brase_CH01_p002-033 8/4/08 4:16 PM Page 4
Copyright 2010 Cengage Learning, Inc. All Rights Reserved.May not be copied, scanned, or duplicated, in whole or in part.
Licensed to:

For instance, if we want to conduct a study about the people who haveclimbed Mt. Everest, then the individuals in the study are all people who have ac-tually made it to the summit. One variable might be the height of such individu-als. Other variables might be age, weight, gender, nationality, income, and so on.Regardless of the variables we use, we would not include measurements or obser-vations from people who have not climbed the mountain.
The variables in a study may be quantitative or qualitative in nature.
Section 1.1 What Is Statistics? 5
Individuals are the people or objects included in the study.A variable is a characteristic of the individual to be measured or observed.
A quantitative variable has a value or numerical measurement for which op-erations such as addition or averaging make sense. A qualitative variable de-scribes an individual by placing the individual into a category or group,such as male or female.
In population data, the data are from every individual of interest.In sample data, the data are from only some of the individuals of interest.
A parameter is a numerical measure that describes an aspect of a population.A statistic is a numerical measure that describes an aspect of a sample.
IndividualsVariable
For the Mt. Everest climbers, variables such as height, weight, age, or in-come are quantitative variables. Qualitative variables involve nonnumerical ob-servations such as gender or nationality. Sometimes qualitative variables arereferred to as categorical variables.
Another important issue regarding data is their source. Do the data compriseinformation from all individuals of interest, or from just some of the individuals?
It is important to know whether the data are population data or sample data.Data from a specific population are fixed and complete. Data from a sample mayvary from sample to sample and are not complete.
For instance, if we have data from all the individuals who have climbedMt. Everest, then we have population data. The proportion of males in the popula-tion of all climbers who have conquered Mt. Everest is an example of a parameter.
On the other hand, if our data come from just some of the climbers, we havesample data. The proportion of male climbers in the sample is an example of astatistic. Note that different samples may have different values for the proportionof male climbers. One of the important features of sample statistics is that theycan vary from sample to sample, whereas population parameters are fixed for agiven population.
EXAMPLE 1 Using basic terminologyThe Hawaii Department of Tropical Agriculture is conducting a study of ready-to-harvest pineapples in an experimental field.
(a) The pineapples are the objects (individuals) of the study. If the researchers areinterested in the individual weights of pineapples in the field, then the variableconsists of weights. At this point, it is important to specify units of meas-urement and degree of accuracy of measurement. The weights could be
Quantitative variableQualitative variable
Population dataSample data
ParameterStatistic
1048629_Brase_CH01_p002-033 8/4/08 4:16 PM Page 5
Copyright 2010 Cengage Learning, Inc. All Rights Reserved.May not be copied, scanned, or duplicated, in whole or in part.
Licensed to:

measured to the nearest ounce or gram. Weight is a quantitative variable be-cause it is a numerical measure. If the weights of all the ready-to-harvestpineapples in the field are included in the data, then we have a population. Theaverage weight of all ready-to-harvest pineapples in the field is a parameter.
(b) Suppose the researchers also want data on taste. A panel of tasters rates thepineapples according to the categories “poor,” “acceptable,” and “good.” Onlysome of the pineapples are included in the taste test. In this case, the variable istaste. This is a qualitative or categorical variable. Because only some of thepineapples in the field are included in the study, we have a sample. The propor-tion of pineapples in the sample with a taste rating of “good” is a statistic.
Throughout this text, you will encounter guided exercises embedded in thereading material. These exercises are included to give you an opportunity to workimmediately with new ideas. The questions guide you through appropriate analy-sis. Cover the answers on the right side (an index card will fit this purpose). Afteryou have thought about or written down your own response, check the answers. Ifthere are several parts to an exercise, check each part before you continue. Youshould be able to answer most of these exercise questions, but don’t skip them—
they are important.
6 Chapter 1 GETTING STARTED
G U I D E D E X E R C I S E 1 Using basic terminology
Television station QUE wants to know the proportion of TV owners in Virginia who watch the sta-tion’s new program at least once a week. The station asked a group of 1000 TV owners in Virginia ifthey watch the program at least once a week.
(a) Identify the individuals of the study and thevariable.
(b) Do the data comprise a sample? If so, what isthe underlying population?
(c) Is the variable qualitative or quantitative?
(d) Identify a quantitative variable that might be ofinterest.
(e) Is the proportion of viewers in the sample whowatch the new program at least once a week astatistic or a parameter?
The individuals are the 1000 TV owners surveyed.The variable is the response does, or does not, watchthe new program at least once a week.
The data comprise a sample of the population ofresponses from all TV owners in Virginia.
Qualitative—the categories are the two possibleresponses, does or does not watch the program.
Age or income might be of interest.
Statistic—the proportion is computed from sample data.
Levels of Measurement: Nominal, Ordinal, Interval, RatioWe have categorized data as either qualitative or quantitative. Another way toclassify data is according to one of the four levels of measurement. These levels in-dicate the type of arithmetic that is appropriate for the data, such as ordering, tak-ing differences, or taking ratios.
1048629_Brase_CH01_p002-033 8/4/08 4:16 PM Page 6
Copyright 2010 Cengage Learning, Inc. All Rights Reserved.May not be copied, scanned, or duplicated, in whole or in part.
Licensed to:

EXAMPLE 2 Levels of measurementIdentify the type of data.
(a) Taos, Acoma, Zuni, and Cochiti are the names of four Native Americanpueblos from the population of names of all Native American pueblos in Ari-zona and New Mexico.
SOLUTION: These data are at the nominal level. Notice that these data valuesare simply names. By looking at the name alone, we cannot determine if onename is “greater than or less than” another. Any ordering of the names wouldbe numerically meaningless.
(b) In a high school graduating class of 319 students, Jim ranked 25th, Juneranked 19th, Walter ranked 10th, and Julia ranked 4th, where 1 is the highestrank.
SOLUTION: These data are at the ordinal level. Ordering the data clearlymakes sense. Walter ranked higher than June. Jim had the lowest rank, andJulia the highest. However, numerical differences in ranks do not have mean-ing. The difference between June’s and Jim’s rank is 6, and this is the samedifference that exists between Walter’s and Julia’s rank. However, this differ-ence doesn’t really mean anything significant. For instance, if you looked atgrade point average, Walter and Julia may have had a large gap betweentheir grade point averages, whereas June and Jim may have had closer gradepoint averages. In any ranking system, it is only the relative standing thatmatters. Differences between ranks are meaningless.
(c) Body temperatures (in degrees Celsius) of trout in the Yellowstone River.
SOLUTION: These data are at the interval level. We can certainly order thedata, and we can compute meaningful differences. However, for Celsius-scaletemperatures, there is not an inherent starting point. The value 0�C may seemto be a starting point, but this value does not indicate the state of “no heat.”Furthermore, it is not correct to say that 20�C is twice as hot as 10�C.
(d) Length of trout swimming in the Yellowstone River.
SOLUTION: These data are at the ratio level. An 18-inch trout is three times aslong as a 6-inch trout. Observe that we can divide 6 into 18 to determine ameaningful ratio of trout lengths.
Section 1.1 What Is Statistics? 7
Levels of measurement
The nominal level of measurement applies to data that consist of names,labels, or categories. There are no implied criteria by which the data can beordered from smallest to largest.
The ordinal level of measurement applies to data that can be arranged inorder. However, differences between data values either cannot be deter-mined or are meaningless.
The interval level of measurement applies to data that can be arranged inorder. In addition, differences between data values are meaningful.
The ratio level of measurement applies to data that can be arranged inorder. In addition, both differences between data values and ratios of datavalues are meaningful. Data at the ratio level have a true zero.
Nominal level
Ordinal level
Interval level
Ratio level
1048629_Brase_CH01_p002-033 8/4/08 4:16 PM Page 7
Copyright 2010 Cengage Learning, Inc. All Rights Reserved.May not be copied, scanned, or duplicated, in whole or in part.
Licensed to:

In summary, there are four levels of measurement. The nominal level is con-sidered the lowest, and in ascending order we have the ordinal, interval, and ra-tio levels. In general, calculations based on a particular level of measurement maynot be appropriate for a lower level.
PROCEDURE How TO DETERMINE THE LEVEL OF MEASUREMENT
The levels of measurement, listed from lowest to highest, are nominal,ordinal, interval, and ratio. To determine the level of measurement of aset of data, state the highest level that can be justified for the entirecollection of data. Consider which calculations are suitable for the data.
Level of Measurement Suitable Calculation
Nominal We can put the data into categories.
Ordinal We can order the data from smallest to largest or “worst” to “best.” Each data value can be comparedwith another data value.
Interval We can order the data and also take the differences between data values. At this level, it makes sense to compare the differences between data values. For instance, we can say that one data value is 5 more than or 12 less than another data value.
Ratio We can order the data, take differences, and also find the ratio between data values. For instance, it makes sense to say that one data value is twice as large as another.
8 Chapter 1 GETTING STARTED
G U I D E D E X E R C I S E 2 Levels of measurement
The following describe different data associated with a state senator. For each data entry, indicatethe corresponding level of measurement.
(a) The senator’s name is Sam Wilson.
(b) The senator is 58 years old.
(c) The years in which the senator was elected tothe Senate are 1992, 1998, and 2004.
(d) The senator’s total taxable income last year was$878,314.
Nominal level
Ratio level. Notice that age has a meaningful zero. Itmakes sense to give age ratios. For instance, Sam istwice as old as someone who is 29.
Interval level. Dates can be ordered, and thedifference between dates has meaning. For instance,2004 is six years later than 1998. However, ratiosdo not make sense. The year 2000 is not twice aslarge as the year 1000. In addition, the year 0 doesnot mean “no time.”
Ratio level. It makes sense to say that the senator’sincome is 10 times that of someone earning$87,831.40.
Continued
1048629_Brase_CH01_p002-033 8/4/08 4:16 PM Page 8
Copyright 2010 Cengage Learning, Inc. All Rights Reserved.May not be copied, scanned, or duplicated, in whole or in part.
Licensed to:

CRITICALTHINKING “Data! Data! Data!” he cried impatiently. “I can’t make bricks without clay.”
Sherlock Holmes said these words in The Adventure of the Copper Beeches bySir Arthur Conan Doyle.
Reliable statistical conclusions require reliable data. This section has pro-vided some of the vocabulary used in discussing data. As you read a statisticalstudy or conduct one, pay attention to the nature of the data and the ways theywere collected.
When you select a variable to measure, be sure to specify the process and re-quirements for measurement. For example, if the variable is the weight ofready-to-harvest pineapples, specify the unit of weight, the accuracy of meas-urement, and maybe even the particular scale to be used. If some weights are inounces and others in grams, the data are fairly useless.
Another concern is whether or not your measurement instrument truly meas-ures the variable. Just asking people if they know the geographic location of theisland nation of Fiji may not provide accurate results. The answers may reflect thefact that the respondents want you to think they are knowledgeable. Asking peo-ple to locate Fiji on a map may give more reliable results.
The level of measurement is also an issue. You can put numbers into a calcu-lator or computer and do all kinds of arithmetic. However, you need to judgewhether the operations are meaningful. For ordinal data such as restaurant rank-ings, you can’t conclude that a 4-star restaurant is “twice as good” as a 2-starrestaurant, even though the number 4 is twice 2.
Are the data from a sample, or do they comprise the entire population? Sampledata can vary from one sample to another! This means that if you are studying thesame statistic from two different samples of the same size, the data values may bedifferent. In fact, the ways in which sample statistics vary among different samplesof the same size will be the focus of our study from Chapter 7 on.
Looking AheadThe purpose of collecting and analyzing data is to obtain information. Statisticalmethods provide us tools with which we can obtain information from data.These methods break into two branches.
Section 1.1 What Is Statistics? 9
GUIDED EXERCISE 2 continued
(e) The senator surveyed his constituents regardinghis proposed water protection bill. The choicesfor response were strong support, support,neutral, against, or strongly against.
(f) The senator’s marital status is “married.”
(g) A leading news magazine claims the senator isranked seventh for his voting record on billsregarding public education.
Ordinal level. The choices can be ordered, but thereis no meaningful numerical difference between twochoices.
Nominal level
Ordinal level. Ranks can be ordered, but differencesbetween ranks may vary in meaning.
Descriptive statistics involves methods of organizing, picturing, and summa-rizing information from samples or populations.
Inferential statistics involves methods of using information from a sample todraw conclusions regarding the population.
Descriptive statistics
Inferential statistics
1048629_Brase_CH01_p002-033 8/4/08 4:16 PM Page 9
Copyright 2010 Cengage Learning, Inc. All Rights Reserved.May not be copied, scanned, or duplicated, in whole or in part.
Licensed to:

We will look at methods of descriptive statistics in Chapters 2, 3, and 4. Thesemethods may be applied to data from samples or populations.
Sometimes we do not have access to an entire population. At other times, thedifficulties or expense of working with the entire population is prohibitive. Insuch cases, we will use inferential statistics together with probability. These arethe topics of Chapters 5 through 11.
10 Chapter 1 GETTING STARTED
VIEWPOINT The First Measured Century
The twentieth century saw measurements of aspects of American life that never
had been systematically studied before. Social conditions involving crime, sex, food, fun, religion,
and work were numerically investigated. The measurements and survey responses taken over the
entire century reveal unsuspected statistical trends. The First Measured Century is a book by Caplow,
Hicks, and Wattenberg. It is also a PBS documentary available on video. For more information, visit
the Online Study Center at www.cengage.com/statistics/Brase/UBS5e and find the link to the PBS
First Measured Century documentary.
SECTION 1.1 PROBLEMS
1. Statistical Literacy What is the difference between an individual and a variable?
2. Statistical Literacy Are data at the nominal level of measurement quantitativeor qualitative?
3. Statistical Literacy What is the difference between a parameter and a statistic?
4. Statistical Literacy For a set population, does a parameter ever change? If thereare three different samples of the same size from a set population, is it possibleto get three different values for the same statistic?
5. Marketing: Fast Food A nationwide survey of adults asks, “How many times perweek do you eat in a fast-food restaurant?” Possible answers: 0, 1–3, 4 or more.(a) Identify the variable.(b) Is the variable quantitative or qualitative?(c) What is the implied population?
6. Advertising: Auto Mileage What is the average miles per gallon (mpg) for allnew cars? Using Consumer Reports, a random sample of 35 new cars gave anaverage of 21.1 mpg.(a) Identify the variable.(b) Is the variable quantitative or qualitative?(c) What is the implied population?
7. Ecology: Wetlands Government agencies carefully monitor water quality andits effect on wetlands (Reference: Environmental Protection Agency WetlandReport EPA 832-R-93-005). Of particular concern is the concentration of nitro-gen in water draining from fertilized lands. Too much nitrogen can kill fish andwildlife. Twenty-eight samples of water were taken at random from a lake. Thenitrogen concentration (milligrams of nitrogen per liter of water) was deter-mined for each sample.(a) Identify the variable.(b) Is the variable quantitative or qualitative?(c) What is the implied population?
1048629_Brase_CH01_p002-033 8/4/08 4:16 PM Page 10
Copyright 2010 Cengage Learning, Inc. All Rights Reserved.May not be copied, scanned, or duplicated, in whole or in part.
Licensed to:
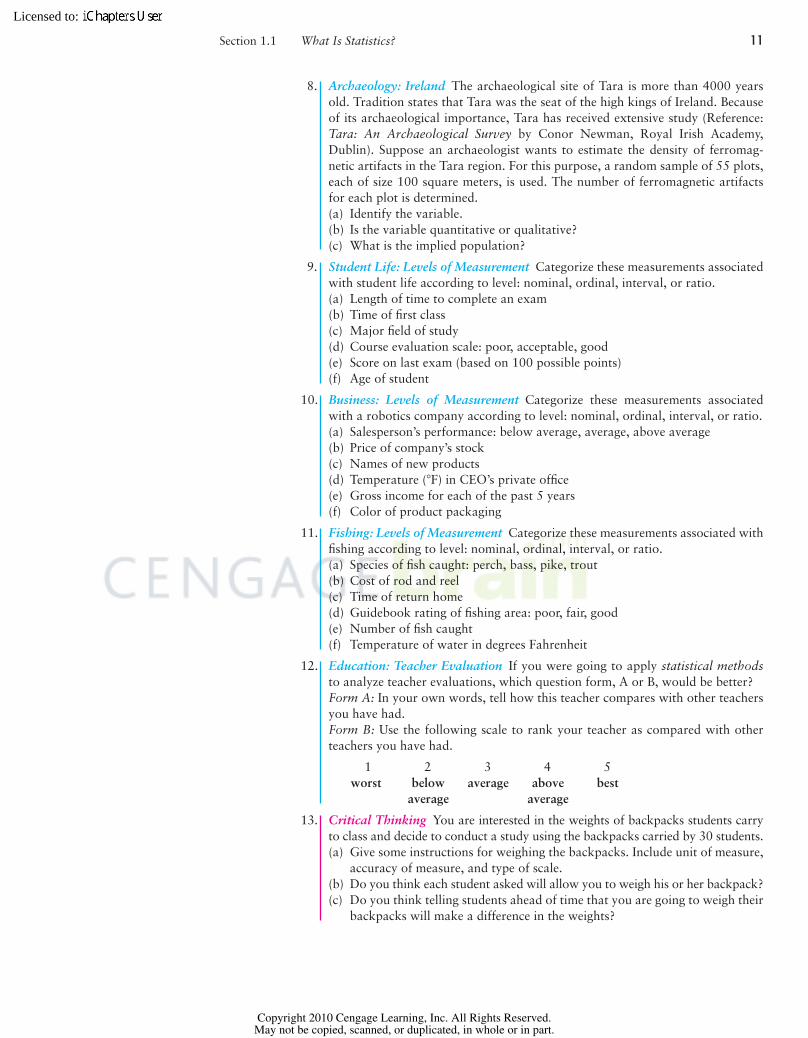
8. Archaeology: Ireland The archaeological site of Tara is more than 4000 yearsold. Tradition states that Tara was the seat of the high kings of Ireland. Becauseof its archaeological importance, Tara has received extensive study (Reference:Tara: An Archaeological Survey by Conor Newman, Royal Irish Academy,Dublin). Suppose an archaeologist wants to estimate the density of ferromag-netic artifacts in the Tara region. For this purpose, a random sample of 55 plots,each of size 100 square meters, is used. The number of ferromagnetic artifactsfor each plot is determined.(a) Identify the variable.(b) Is the variable quantitative or qualitative?(c) What is the implied population?
9. Student Life: Levels of Measurement Categorize these measurements associatedwith student life according to level: nominal, ordinal, interval, or ratio.(a) Length of time to complete an exam(b) Time of first class(c) Major field of study(d) Course evaluation scale: poor, acceptable, good(e) Score on last exam (based on 100 possible points)(f) Age of student
10. Business: Levels of Measurement Categorize these measurements associatedwith a robotics company according to level: nominal, ordinal, interval, or ratio.(a) Salesperson’s performance: below average, average, above average(b) Price of company’s stock(c) Names of new products(d) Temperature (�F) in CEO’s private office(e) Gross income for each of the past 5 years(f) Color of product packaging
11. Fishing: Levels of Measurement Categorize these measurements associated withfishing according to level: nominal, ordinal, interval, or ratio.(a) Species of fish caught: perch, bass, pike, trout(b) Cost of rod and reel(c) Time of return home(d) Guidebook rating of fishing area: poor, fair, good(e) Number of fish caught(f) Temperature of water in degrees Fahrenheit
12. Education: Teacher Evaluation If you were going to apply statistical methodsto analyze teacher evaluations, which question form, A or B, would be better?Form A: In your own words, tell how this teacher compares with other teachersyou have had.Form B: Use the following scale to rank your teacher as compared with otherteachers you have had.
1 2 3 4 5worst below average above best
average average
13. Critical Thinking You are interested in the weights of backpacks students carryto class and decide to conduct a study using the backpacks carried by 30 students.(a) Give some instructions for weighing the backpacks. Include unit of measure,
accuracy of measure, and type of scale.(b) Do you think each student asked will allow you to weigh his or her backpack?(c) Do you think telling students ahead of time that you are going to weigh their
backpacks will make a difference in the weights?
Section 1.1 What Is Statistics? 11
1048629_Brase_CH01_p002-033 8/4/08 4:16 PM Page 11
Copyright 2010 Cengage Learning, Inc. All Rights Reserved.May not be copied, scanned, or duplicated, in whole or in part.
Licensed to:

12 Chapter 1 GETTING STARTED
S EC T I O N 1 . 2 Random Samples
FOCUS POINTS
• Explain the importance of random samples.• Construct a simple random sample using random numbers.• Simulate a random process.• Describe stratified sampling, cluster sampling, systematic sampling, multistage sampling, and
convenience sampling.
Simple Random SamplesEat lamb—20,000 coyotes can’t be wrong!
This slogan is sometimes found on bumper stickers in the western UnitedStates. The slogan indicates the trouble that ranchers have experienced in protect-ing their flocks from predators. Based on their experience with this sample of thecoyote population, the ranchers concluded that all coyotes are dangerous to theirflocks and should be eliminated! The ranchers used a special poison bait to get ridof the coyotes. Not only was this poison distributed on ranch land, but with gov-ernment cooperation it also was distributed widely on public lands.
The ranchers found that the results of the widespread poisoning were not verybeneficial. The sheep-eating coyotes continued to thrive while the general popula-tion of coyotes and other predators declined. What was the problem? The sheep-eating coyotes the ranchers had observed were not a representative sample of allcoyotes. Modern methods of predator control target the sheep-eating coyotes. Toa certain extent, the new methods have come about through a closer examinationof the sampling techniques used.
In this section, we will examine several widely used sampling techniques. Oneof the most important sampling techniques is a simple random sample.
A simple random sample of n measurements from a population is a subsetof the population selected in a manner such that every sample of size n fromthe population has an equal chance of being selected.
In a simple random sample, not only does every sample of the specified sizehave an equal chance of being selected, but also every individual of the popula-tion has an equal chance of being selected. However, the fact that each individualhas an equal chance of being selected does not necessarily imply a simple randomsample. Remember, for a simple random sample, every sample of the given sizemust also have an equal chance of being selected.
G U I D E D E X E R C I S E 3 Simple random sample
Is open space around metropolitan areas important? Players of the Colorado Lottery might think so,since some of the proceeds of the game are used to fund open space and outdoor recreational space.To play the game, you pay 1 dollar and choose any six different numbers from the group of numbers1 through 42. If your group of six numbers matches the winning group of six numbers selected bysimple random sampling, then you are a winner of a grand prize of at least 1.5 million dollars.
(a) Is the number 25 as likely to be selected in thewinning group of six numbers as the number 5?
Yes. Because the winning numbers constitute asimple random sample, each number from 1 through42 has an equal chance of being selected.
Continued
Simple random sample
1048629_Brase_CH01_p002-033 8/4/08 4:16 PM Page 12
Copyright 2010 Cengage Learning, Inc. All Rights Reserved.May not be copied, scanned, or duplicated, in whole or in part.
Licensed to:

How do we get random samples? Suppose you need to know if the emissionsystems of the latest shipment of Toyotas satisfy pollution-control standards. Youwant to pick a random sample of 30 cars from this shipment of 500 cars and testthem. One way to pick a random sample is to number the cars 1 through 500,write these numbers on cards, mix up the cards, and then draw 30 numbers. Thesample will consist of the cars with the chosen numbers. If you mix the cards suf-ficiently, this procedure produces a random sample.
An easier way to select the numbers is to use a random-number table. You canmake one yourself by writing the digits 0 through 9 on separate cards and mixingup these cards in a hat. Then draw a card, record the digit, return the card, and mixup the cards again. Draw another card, record the digit, and so on. Table 1 in theAppendix is a ready-made random-number table (adapted from Rand Corporation,A Million Random Digits with 100,000 Normal Deviates). Let’s see how to pickour random sample of 30 Toyotas by using this random-number table.
EXAMPLE 3 Random-number tableUse a random-number table to pick a random sample of 30 cars from a popula-tion of 500 cars.
SOLUTION: Again, we assign each car a different number between 1 and 500, in-clusive. Then we use the random-number table to choose the sample. Table 1 inthe Appendix has 35 rows and 10 blocks of five digits each; it can be thought ofas a solid mass of digits that has been broken up into rows and blocks for userconvenience.
You read the digits by beginning anywhere in the table. We dropped a pin onthe table, and the head of the pin landed in row 15, block 5. We’ll begin there andlist all the digits in that row. If we need more digits, we’ll move on to row 16, andso on. The digits we begin with are
99281 59640 15221 96079 09961 05371
Since the highest number assigned to a car is 500, and this number has three dig-its, we regroup our digits into blocks of 3:
992 815 964 015 221 960 790 996 105 371
To construct our random sample, we use the first 30 car numbers we encounterin the random-number table when we start at row 15, block 5. We skip the firstthree groups—992, 815, and 964—because these numbers are all too large. Thenext group of three digits is 015, which corresponds to 15. Car number 15 is thefirst car included in our sample, and the next is car number 221. We skip the nextthree groups and then include car numbers 105 and 371. To get the rest of the carsin the sample, we continue to the next line and use the random-number table inthe same fashion. If we encounter a number we’ve used before, we skip it.
Section 1.2 Random Samples 13
GUIDED EXERCISE 3 continued
(b) Could all the winning numbers be even?
(c) Your friend always plays the numbers
1 2 3 4 5 6
Could she ever win?
Yes, since six even numbers is one of the possiblegroups of six numbers.
Yes. In a simple random sample, the listed group of six numbers is as likely as any of the 5,245,786possible groups of six numbers to be selected as thewinner. (See Section 5.3 to learn how to compute thenumber of possible groups of six numbers that canbe selected from 42 numbers.)
Random-number table
1048629_Brase_CH01_p002-033 8/4/08 4:16 PM Page 13
Copyright 2010 Cengage Learning, Inc. All Rights Reserved.May not be copied, scanned, or duplicated, in whole or in part.
Licensed to:

COMMENT When we use the term (simple) random sample, we havevery specific criteria in mind for selecting the sample. One proper methodfor selecting a simple random sample is to use a computer- or calculator-based random-number generator or a table of random numbers as wehave done in the example. The term random should not be confused withhaphazard!
14 Chapter 1 GETTING STARTED
PROCEDURE HOW TO DRAW A RANDOM SAMPLE
1. Number all members of the population sequentially.
2. Use a table, calculator, or computer to select random numbers fromthe numbers assigned to the population members.
3. Create the sample by using population members with numbers corre-sponding to those randomly selected.
Another important use of random-number tables is in simulation. We use theword simulation to refer to the process of providing numerical imitations of“real” phenomena. Simulation methods have been productive in studying a di-verse array of subjects such as nuclear reactors, cloud formation, cardiology (andmedical science in general), highway design, production control, shipbuilding,airplane design, war games, economics, and electronics. A complete list wouldprobably include something from every aspect of modern life. In Guided Exercise4 we’ll perform a brief simulation.
Simulation
A simulation is a numerical facsimile or representation of a real-worldphenomenon.
G U I D E D E X E R C I S E 4 Simulation
(a) How many outcomes are possible when youtoss a coin once?
(b) There are several ways to assign numbers to the two outcomes. Because we assume a faircoin, we can assign an even digit to the outcome“heads” and an odd digit to the outcome“tails.” Then, starting at block 3 of row 2 ofTable 1 in the Appendix, list the first 10 singledigits.
(c) What are the outcomes associated with the 10 digits?
(d) If you start in a different block and row ofTable 1 in the Appendix, will you get the samesequence of outcomes?
Two—heads or tails
7 1 5 4 9 4 4 8 4 3
T T T H T H H H H T
It is possible, but not very likely. (In Section 5.3 youwill learn how to determine that there are 1024 pos-sible sequences of outcomes for 10 tosses of a coin.)
Use a random-number table to simulate the outcomes of tossing a balanced (that is, fair) penny 10 times.
1048629_Brase_CH01_p002-033 8/4/08 4:16 PM Page 14
Copyright 2010 Cengage Learning, Inc. All Rights Reserved.May not be copied, scanned, or duplicated, in whole or in part.
Licensed to:

TECH NOTES Most statistical software packages, spreadsheet programs, and statistical calculators gen-erate random numbers. In general, these devices sample with replacement. Samplingwith replacement means that although a number has been selected for the sample, it isnot removed from the population. Therefore, the same number may be selected for thesample more than once. If you need to sample without replacement, generate more itemsthan you need for the sample. Then sort the sample and remove duplicate values. Specificprocedures for generating random samples using the TI-84Plus/TI-83Plus calculator,Excel, Minitab, and SPSS are shown in Using Technology at the end of this chapter.More details are given in the separate Technology Guides for each of these technologies.
Other Sampling TechniquesAlthough we will assume throughout this text that (simple) random samples areused, other methods of sampling also are widely used. Appropriate statistical tech-niques exist for these sampling methods, but they are beyond the scope of this text.
One of these alternative sampling methods is called stratified sampling.Groups or classes inside a population that share a common characteristic arecalled strata (plural of stratum). For example, in the population of all undergrad-uate college students, some strata might be freshmen, sophomores, juniors, orseniors. Other strata might be men or women, in-state students or out-of-statestudents, and so on. In the method of stratified sampling, the population is di-vided into at least two distinct strata. Then a (simple) random sample of a certainsize is drawn from each stratum, and the information obtained is carefully ad-justed or weighted in all resulting calculations.
The groups or strata are often sampled in proportion to their actual percentagesof occurrence in the overall population. However, other (more sophisticated) waysof determining the optimal sample size in each stratum may give the best results. Ingeneral, statistical analysis and tests based on data obtained from stratified samplesare somewhat different from techniques discussed in an introductory course in sta-tistics. Such methods for stratified sampling will not be discussed in this text.
Another popular method of sampling is called systematic sampling. In thismethod, it is assumed that the elements of the population are arranged in somenatural sequential order. We select a (random) starting point and then select everykth element for our sample. For example, people lining up to buy rock concerttickets are “in order.” To generate a systematic sample of these people (and askquestions regarding topics such as age, smoking habits, income level, etc.), wecould include every fifth person in line. The “starting” person is selected at ran-dom from the first five.
The advantage of a systematic sample is that it is easy to select. However, thereare dangers in using systematic sampling. When the population is repetitive orcyclic in nature, systematic sampling should not be used. For example, consider afabric mill that produces dress material. Suppose the loom that produces the ma-terial makes a mistake every 17th yard, but we check only every 16th yard with anautomated electronic scanner. In this case, a random starting point may or maynot result in detection of fabric flaws before a large amount of fabric is produced.
Cluster sampling is a method used extensively by government agencies andcertain private research organizations. In cluster sampling, we begin by dividingthe demographic area into sections. Then we randomly select sections or clusters.Every member of the cluster is included in the sample. For example, in conduct-ing a survey of school children in a large city, we could first randomly select fiveschools and then include all the children from each selected school.
Often a population is very large or geographically spread out. In such cases,samples are constructed through a multistage sample design of several stages,with the final stage consisting of clusters. For instance, the government Current
Section 1.2 Random Samples 15
Sampling with replacement
Systematic sampling
Cluster sampling
Multistage samples
Stratified sampling
1048629_Brase_CH01_p002-033 8/4/08 4:16 PM Page 15
Copyright 2010 Cengage Learning, Inc. All Rights Reserved.May not be copied, scanned, or duplicated, in whole or in part.
Licensed to:

Population Survey interviews about 60,000 households across the United Stateseach month by means of a multistage sample design.
For the Current Population Survey, the first stage consists of selecting samplesof large geographic areas that do not cross state lines. These areas are further bro-ken down into smaller blocks, which are stratified according to ethnic and otherfactors. Stratified samples of the blocks are then taken. Finally, housing units ineach chosen block are broken into clusters of nearby housing units. A randomsample of these clusters of housing units is selected, and each household in the fi-nal cluster is interviewed.
Convenience sampling simply uses results or data that are conveniently andreadily obtained. In some cases, this data may be all that is available, and in many cases, it is better than no information at all. However, convenience sam-pling does run the risk of being severely biased. For instance, consider a newsper-son who wishes to get the “opinions of the people” about a proposed seat tax tobe imposed on tickets to all sporting events. The revenues from the seat tax willthen be used to support the local symphony. The newsperson stands in front of aclassical music store at noon and surveys the first five people coming out of thestore who will cooperate. This method of choosing a sample will produce someopinions, and perhaps some human interest stories, but it certainly has bias. It ishoped that the city council will not use these opinions as the sole basis for a deci-sion about the proposed tax. It is good advice to be very cautious indeed whenthe data come from the method of convenience sampling.
16 Chapter 1 GETTING STARTED
Sampling techniques
Random sampling: Use a simple random sample from the entire population.
Stratified sampling: Divide the entire population into distinct subgroupscalled strata. The strata are based on a specific characteristic such as age,income, education level, and so on. All members of a stratum share thespecific characteristic. Draw random samples from each stratum.
Systematic sampling: Number all members of the population sequentially.Then, from a starting point selected at random, include every kth memberof the population in the sample.
Cluster sampling: Divide the entire population into pre-existing segments orclusters. The clusters are often geographic. Make a random selection ofclusters. Include every member of each selected cluster in the sample.
Multistage sampling: Use a variety of sampling methods to createsuccessively smaller groups at each stage. The final sample consists ofclusters.
Convenience sampling: Create a sample by using data from populationmembers that are readily available.
CRITICALTHINKING We call the list of individuals from which a sample is actually selected the sam-
pling frame. Ideally, the sampling frame is the entire population. However, froma practical perspective, not all members of a population may be accessible. For in-stance, a telephone directory used as the sample frame for residential telephonecontacts would not include unlisted numbers.
When the sample frame does not match the population, we have what iscalled undercoverage. In demographic studies, undercoverage could result if thehomeless, fugitives from the law, and so forth were not included in the study.
Sampling frame
Undercoverage
Convenience sampling
1048629_Brase_CH01_p002-033 8/4/08 4:16 PM Page 16
Copyright 2010 Cengage Learning, Inc. All Rights Reserved.May not be copied, scanned, or duplicated, in whole or in part.
Licensed to:

In general, even when the sampling frame and the population match, a sampleis not a perfect representation of a population. Therefore, information drawnfrom a sample may not exactly match corresponding information from the popu-lation. To the extent that sample information does not match the correspondingpopulation information, we have an error, called a sampling error.
Section 1.2 Random Samples 17
A sampling frame is a list of individuals from which a sample is actuallyselected.
Undercoverage results when population members are omitted from the sam-ple frame.
A sampling error is the difference between measurements from a sample andcorresponding measurements from the respective population. It is caused bythe fact that the sample does not perfectly represent the population.
A nonsampling error is the result of poor sample design, sloppy data collec-tion, faulty measuring instruments, bias in questionnaires, and so on.
Sampling errors do not represent mistakes! They are simply the consequencesof using samples instead of populations. However, be alert to nonsamplingerrors, which may sometimes occur inadvertently.
Sampling error
VIEWPOINT Extraterrestrial Life?
Do you believe intelligent life exists on other planets? Using methods of random
sampling, a Fox News opinion poll found that about 54% of all U.S. men do believe in intelligent life
on other planets, whereas only 47% of U.S. women believe there is such life. How could you conduct
a random survey of students on your campus regarding belief in extraterrestrial life?
SECTION 1.2 PROBLEMS
1. Statistical Literacy Explain the difference between a stratified sample and acluster sample.
2. Statistical Literacy Explain the difference between a simple random sample anda systematic sample.
3. Statistical Literacy Marcie conducted a study of the cost of breakfast cereal.She recorded the costs of several boxes of cereal. However, she neglected to takeinto account the number of servings in each box. Someone told her not to worrybecause she just had some sampling error. Comment on that advice.
4. Critical Thinking Consider the students in your statistics class as the popula-tion and suppose they are seated in four rows of 10 students each. To select asample, you toss a coin. If it comes up heads, you use the 20 students sitting inthe first two rows as your sample. If it comes up tails, you use the 20 students sit-ting in the last two rows as your sample.(a) Does every student have an equal chance of being selected for the sample?
Explain.(b) Is it possible to include students sitting in row 3 with students sitting in row
2 in your sample? Is your sample a simple random sample? Explain.(c) Describe a process you could use to get a simple random sample of size 20
from a class of size 40.
1048629_Brase_CH01_p002-033 8/4/08 4:16 PM Page 17
Copyright 2010 Cengage Learning, Inc. All Rights Reserved.May not be copied, scanned, or duplicated, in whole or in part.
Licensed to:

18 Chapter 1 GETTING STARTED
5. Critical Thinking Suppose you are assigned the number 1, and the other stu-dents in your statistics class call out consecutive numbers until each person inthe class has his or her own number. Explain how you could get a random sam-ple of four students from your statistics class.(a) Explain why the first four students walking into the classroom would not
necessarily form a random sample.(b) Explain why four students coming in late would not necessarily form a ran-
dom sample.(c) Explain why four students sitting in the back row would not necessarily
form a random sample.(d) Explain why the four tallest students would not necessarily form a random
sample.
6. Critical Thinking In each of the following situations, the sampling frame doesnot match the population, resulting in undercoverage. Give examples of popula-tion members that might have been omitted.(a) The population consists of all 250 students in your large statistics class. You
plan to obtain a simple random sample of 30 students by using the samplingframe of students present next Monday.
(b) The population consists of all 15-year-olds living in the attendance districtof a local high school. You plan to obtain a simple random sample of 200such residents by using the student roster of the high school as the sam-pling frame.
7. Sampling: Random Use a random-number table to generate a list of 10 randomnumbers between 1 and 99. Explain your work.
8. Sampling: Random Use a random-number table to generate a list of eight ran-dom numbers from 1 to 976. Explain your work.
9. Sampling: Random Use a random-number table to generate a list of six randomnumbers from 1 to 8615. Explain your work.
10. Simulation: Coin Toss Use a random-number table to simulate the outcomes oftossing a quarter 25 times. Assume that the quarter is balanced (i.e., fair).
11. Computer Simulation: Roll of a Die A die is a cube with dots on each face. Thefaces have 1, 2, 3, 4, 5, or 6 dots. The table below is a computer simulation(from the software package Minitab) of the results of rolling a fair die 20 times.
DATA DISPLAY
ROW C1 C2 C3 C4 C5 C6 C7 C8 C9 C101 5 2 2 2 5 3 2 3 1 42 3 2 4 5 4 5 3 5 3 4
(a) Assume that each number in the table corresponds to the number of dots onthe upward face of the die. Is it appropriate that the same number appearsmore than once? Why? What is the outcome of the fourth roll?
(b) If we simulate more rolls of the die, do you expect to get the same sequenceof outcomes? Why or why not?
12. Simulation: Birthday Problem Suppose there are 30 people at a party. Do youthink any two share the same birthday? Let’s use the random-number table tosimulate the birthdays of the 30 people at the party. Ignoring leap year, let’s as-sume that the year has 365 days. Number the days, with 1 representing January1, 2 representing January 2, and so forth, with 365 representing December 31.Draw a random sample of 30 days (with replacement). These days represent thebirthdays of the people at the party. Were any two of the birthdays the same?Compare your results with those obtained by other students in the class. Wouldyou expect the results to be the same or different?
1048629_Brase_CH01_p002-033 8/4/08 4:16 PM Page 18
Copyright 2010 Cengage Learning, Inc. All Rights Reserved.May not be copied, scanned, or duplicated, in whole or in part.
Licensed to:

Section 1.2 Random Samples 19
13. Education: Test Construction Professor Gill is designing a multiple-choicetest. There are to be 10 questions. Each question is to have five choices for an-swers. The choices are to be designated by the letters a, b, c, d, and e. Profes-sor Gill wishes to use a random-number table to determine which letter choiceshould correspond to the correct answer for a question. Using the numbercorrespondence 1 for a, 2 for b, 3 for c, 4 for d, and 5 for e, use a random-number table to determine the letter choice for the correct answer for each ofthe 10 questions.
14. Education: Test Construction Professor Gill uses true–false questions. Shewishes to place 20 such questions on the next test. To decide whether to placea true statement or a false statement in each of the 20 questions, she uses arandom-number table. She selects 20 digits from the table. An even digit tellsher to use a true statement. An odd digit tells her to use a false statement. Usea random-number table to pick a sequence of 20 digits, and describe the corre-sponding sequence of 20 true–false questions. What would the test key foryour sequence look like?
15. Sampling Methods: Benefits Package An important part of employee compen-sation is a benefits package, which might include health insurance, life insur-ance, child care, vacation days, retirement plan, parental leave, bonuses, etc.Suppose you want to conduct a survey of benefits packages available in privatebusinesses in Hawaii. You want a sample size of 100. Some sampling techniquesare described below. Categorize each technique as simple random sample, strat-ified sample, systematic sample, cluster sample, or convenience sample.(a) Assign each business in the Island Business Directory a number, and then use
a random-number table to select the businesses to be included in the sample.(b) Use postal ZIP Codes to divide the state into regions. Pick a random sample
of 10 ZIP Code areas and then include all the businesses in each selected ZIPCode area.
(c) Send a team of five research assistants to Bishop Street in downtown Hon-olulu. Let each assistant select a block or building and interview an em-ployee from each business found. Each researcher can have the rest of theday off after getting responses from 20 different businesses.
(d) Use the Island Business Directory. Number all the businesses. Select a start-ing place at random, and then use every 50th business listed until you have100 businesses.
(e) Group the businesses according to type: medical, shipping, retail, manufac-turing, financial, construction, restaurant, hotel, tourism, other. Then selecta random sample of 10 businesses from each business type.
16. Sampling Methods: Health Care Modern Managed Hospitals (MMH) is a na-tional for-profit chain of hospitals. Management wants to survey patients dis-charged this past year to obtain patient satisfaction profiles. They wish to use asample of such patients. Several sampling techniques are described below. Cate-gorize each technique as simple random sample, stratified sample, systematicsample, cluster sample, or convenience sample.(a) Obtain a list of patients discharged from all MMH facilities. Divide the pa-
tients according to length of hospital stay (2 days or less, 3–7 days, 8–14days, more than 14 days). Draw simple random samples from each group.
(b) Obtain lists of patients discharged from all MMH facilities. Number thesepatients, and then use a random-number table to obtain the sample.
(c) Randomly select some MMH facilities from each of five geographic regions,and then include all the patients on the discharge lists of the selected hospitals.
(d) At the beginning of the year, instruct each MMH facility to survey every500th patient discharged.
(e) Instruct each MMH facility to survey 10 discharged patients this week andsend in the results.
1048629_Brase_CH01_p002-033 8/4/08 4:16 PM Page 19
Copyright 2010 Cengage Learning, Inc. All Rights Reserved.May not be copied, scanned, or duplicated, in whole or in part.
Licensed to:

20 Chapter 1 GETTING STARTED
PROCEDURE BASIC GUIDELINES FOR PLANNING A STATISTICAL STUDY
1. First, identify the individuals or objects of interest.
2. Specify the variables as well as protocols for taking measurements ormaking observations.
3. Determine if you will use an entire population or a representativesample. If using a sample, decide on a viable sampling method.
4. In your data collection plan, address issues of ethics, subject confi-dentiality, and privacy. If you are collecting data at a business, store,college, or other institution, be sure to be courteous and to obtainpermission as necessary.
5. Collect the data.
6. Use appropriate descriptive statistics methods (Chapters 2, 3, and 4)and make decisions using appropriate inferential statistics methods(Chapters 8–11).
7. Finally, note any concerns you might have about your data collectionmethods and list any recommendations for future studies.
One issue to consider is whether to use the entire population in a study or arepresentative sample. If we use data from the entire population, we have a census.
When the population is small and easily accessible, a census is very useful be-cause it gives complete information about the population. However, obtaining acensus can be both expensive and difficult. Every 10 years, the U.S. Departmentof Commerce Census Bureau is required to conduct a census of the United States.However, contacting some members of the population—such as the homeless—is almost impossible. Sometimes members of the population will not respond. Insuch cases, statistical estimates for the missing responses are often supplied.
If we use data from only part of the population of interest, we have a sample.
In a census, measurements or observations from the entire populationare used.
In a sample, measurements or observations from part of the population are used.
S EC T I O N 1 . 3 Introduction to Experimental Design
FOCUS POINTS
• Discuss what it means to take a census.• Describe simulations, observational studies, and experiments.• Identify control groups, placebo effects, completely randomized experiments, and randomized block
experiments.• Discuss potential pitfalls that might make your data unreliable.
Planning a Statistical StudyPlanning a statistical study and gathering data are essential components of ob-taining reliable information. Depending on the nature of the statistical study, agreat deal of expertise and resources may be required during the planning stage.In this section, we look at some of the basics of planning a statistical study.
Census
Sample
1048629_Brase_CH01_p002-033 8/4/08 4:16 PM Page 20
Copyright 2010 Cengage Learning, Inc. All Rights Reserved.May not be copied, scanned, or duplicated, in whole or in part.
Licensed to:

In the previous section, we examined several sampling strategies: simple random,stratified, cluster, systematic, multistage, and convenience. In this text, we willstudy methods of inferential statistics based on simple random samples.
As discussed in Section 1.2, a simulation is a numerical facsimile of a real-world phenomenon. Sometimes simulation is called a “dry lab” approach, inthe sense that it is a mathematical imitation of a real situation. Advantages ofsimulation are that numerical and statistical simulations can fit real-worldproblems extremely well. The researcher can explore procedures through simu-lation that might be very dangerous in real life.
Experiments and ObservationWhen gathering data for a statistical study, we want to distinguish between ob-servational studies and experiments.
Section 1.3 Introduction to Experimental Design 21
EXAMPLE 4 ExperimentIn 1778, Captain James Cook landed in what we now call the Hawaiian Islands.He gave the islanders a present of several goats, and over the years these animalsmultiplied into wild herds totaling several thousand. They eat almost anything,including the famous silver sword plant, which was once unique to Hawaii. Atone time, the silver sword grew abundantly on the island of Maui (in Haleakala,a national park on that island, the silver sword can still be found), but each yearthere seemed to be fewer and fewer plants. Biologists suspected that the goatswere partially responsible for the decline in the number of plants and conducteda statistical study that verified their theory.
(a) To test the theory, park biologists set up stations in remote areas ofHaleakala. At each station, two plots of land similar in soil conditions, cli-mate, and plant count were selected. One plot was fenced to keep out thegoats, while the other was not. At regular intervals a plant count was made ineach plot. This study involves an experiment because a treatment (the fence)was imposed on one plot.
(b) The experiment involved two plots at each station. The plot that was notfenced represents the control plot. This is the plot on which a treatment wasspecifically not imposed, although the plot was similar to the fenced plot inevery other way.
Statistical experiments are commonly used to determine the effect of a treat-ment. However, the design of the experiment needs to control for other possiblecauses of the effect. For instance, in medical experiments, the placebo effect is theimprovement or change that is the result of patients just believing in the treat-ment, whether or not the treatment itself is effective.
In an observational study, observations and measurements of individuals areconducted in a way that doesn’t change the response or the variable beingmeasured.
In an experiment, a treatment is deliberately imposed on the individualsin order to observe a possible change in the response or variable beingmeasured.
Simulation
Silver sword plant, Haleakala National Park
Placebo effect
1048629_Brase_CH01_p002-033 8/4/08 4:16 PM Page 21
Copyright 2010 Cengage Learning, Inc. All Rights Reserved.May not be copied, scanned, or duplicated, in whole or in part.
Licensed to:

To account for the placebo effect, patients are divided into two groups. Onegroup receives the prescribed treatment. The other group, called the controlgroup, receives a dummy or placebo treatment that is disguised to look like thereal treatment. Finally, after the treatment cycle, the medical condition of thepatients in the treatment group is compared to that of the patients in the con-trol group.
A common way to assign patients to treatment and control groups is by using arandom process. This is the essence of a completely randomized experiment.
22 Chapter 1 GETTING STARTED
The placebo effect occurs when a subject receives no treatment but(incorrectly) believes he or she is, in fact, receiving treatment and respondsfavorably.
A completely randomized experiment is one in which a random process isused to assign each individual to one of the treatments.
A block is a group of individuals sharing some common features that mightaffect the treatment.
In a randomized block experiment, individuals are first sorted into blocks,and then a random process is used to assign each individual in the block toone of the treatments.
EXAMPLE 5 Completely randomized experimentCan chest pain be relieved by drilling holes in the heart? For more than a decade,surgeons have been using a laser procedure to drill holes in the heart. Many pa-tients report a lasting and dramatic decrease in angina (chest pain) symptoms. Isthe relief due to the procedure, or is it a placebo effect? A recent research projectat Lenox Hill Hospital in New York City provided some information about thisissue by using a completely randomized experiment. The laser treatment was ap-plied through a less invasive (catheter laser) process. A group of 298 volunteerswith severe, untreatable chest pain were randomly assigned to get the laser treat-ment or not. The patients were sedated but awake. They could hear the doctorsdiscuss the laser process. Each patient thought he or she was receiving thetreatment.
The experimental design can be pictured as
Patientswith chestpain
Randomassignments
Group 1149 patients
Group 2149 patients
Treatment 1Laser holes in heart
Comparepain relief
Treatment 2No holes in heart
The laser patients did well. But shockingly, the placebo group showed moreimprovement in pain relief. The medical impacts of this study are still beinginvestigated.
It is difficult to control all the variables that might influence the response to atreatment. One way to control some of the variables is through blocking.
Completely randomized experiment
Randomized block design
1048629_Brase_CH01_p002-033 8/4/08 4:16 PM Page 22
Copyright 2010 Cengage Learning, Inc. All Rights Reserved.May not be copied, scanned, or duplicated, in whole or in part.
Licensed to:
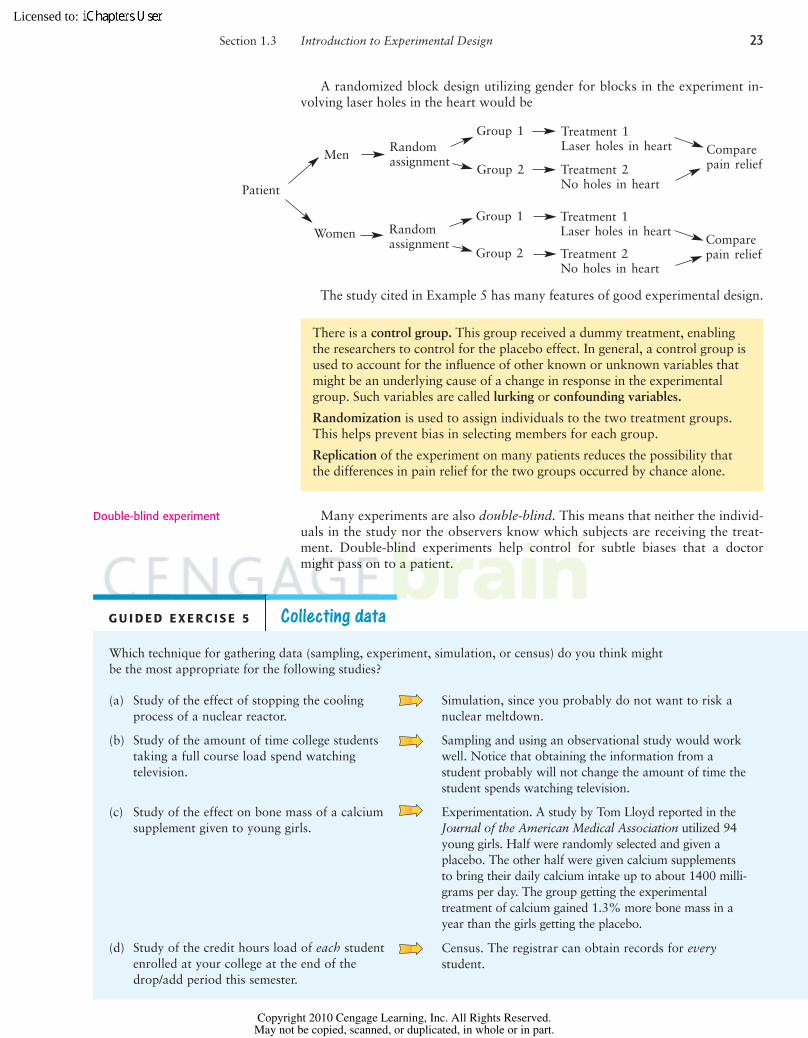
A randomized block design utilizing gender for blocks in the experiment in-volving laser holes in the heart would be
Section 1.3 Introduction to Experimental Design 23
The study cited in Example 5 has many features of good experimental design.
Many experiments are also double-blind. This means that neither the individ-uals in the study nor the observers know which subjects are receiving the treat-ment. Double-blind experiments help control for subtle biases that a doctormight pass on to a patient.
Patient
Men
Women
Randomassignment
Randomassignment
Group 1
Group 2
Group 1
Group 2
Treatment 1Laser holes in heart Compare
pain relief
Comparepain relief
Treatment 2No holes in heart
Treatment 1Laser holes in heart
Treatment 2No holes in heart
There is a control group. This group received a dummy treatment, enablingthe researchers to control for the placebo effect. In general, a control group isused to account for the influence of other known or unknown variables thatmight be an underlying cause of a change in response in the experimentalgroup. Such variables are called lurking or confounding variables.
Randomization is used to assign individuals to the two treatment groups.This helps prevent bias in selecting members for each group.
Replication of the experiment on many patients reduces the possibility thatthe differences in pain relief for the two groups occurred by chance alone.
G U I D E D E X E R C I S E 5 Collecting data
Which technique for gathering data (sampling, experiment, simulation, or census) do you think mightbe the most appropriate for the following studies?
(a) Study of the effect of stopping the coolingprocess of a nuclear reactor.
(b) Study of the amount of time college studentstaking a full course load spend watchingtelevision.
(c) Study of the effect on bone mass of a calciumsupplement given to young girls.
(d) Study of the credit hours load of each studentenrolled at your college at the end of thedrop/add period this semester.
Simulation, since you probably do not want to risk anuclear meltdown.
Sampling and using an observational study would workwell. Notice that obtaining the information from astudent probably will not change the amount of time thestudent spends watching television.
Experimentation. A study by Tom Lloyd reported in theJournal of the American Medical Association utilized 94young girls. Half were randomly selected and given aplacebo. The other half were given calcium supplementsto bring their daily calcium intake up to about 1400 milli-grams per day. The group getting the experimentaltreatment of calcium gained 1.3% more bone mass in ayear than the girls getting the placebo.
Census. The registrar can obtain records for everystudent.
Double-blind experiment
1048629_Brase_CH01_p002-033 8/4/08 4:16 PM Page 23
Copyright 2010 Cengage Learning, Inc. All Rights Reserved.May not be copied, scanned, or duplicated, in whole or in part.
Licensed to:
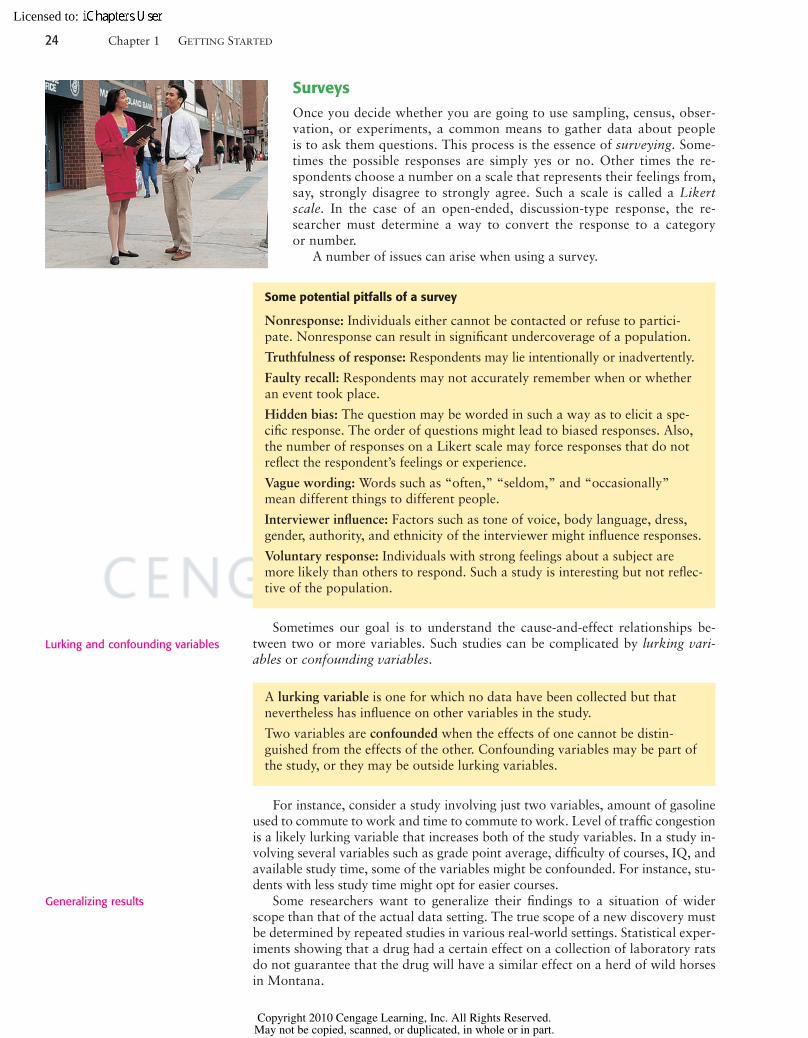
SurveysOnce you decide whether you are going to use sampling, census, obser-vation, or experiments, a common means to gather data about peopleis to ask them questions. This process is the essence of surveying. Some-times the possible responses are simply yes or no. Other times the re-spondents choose a number on a scale that represents their feelings from,say, strongly disagree to strongly agree. Such a scale is called a Likertscale. In the case of an open-ended, discussion-type response, the re-searcher must determine a way to convert the response to a categoryor number.
A number of issues can arise when using a survey.
24 Chapter 1 GETTING STARTED
Some potential pitfalls of a survey
Nonresponse: Individuals either cannot be contacted or refuse to partici-pate. Nonresponse can result in significant undercoverage of a population.
Truthfulness of response: Respondents may lie intentionally or inadvertently.
Faulty recall: Respondents may not accurately remember when or whetheran event took place.
Hidden bias: The question may be worded in such a way as to elicit a spe-cific response. The order of questions might lead to biased responses. Also,the number of responses on a Likert scale may force responses that do notreflect the respondent’s feelings or experience.
Vague wording: Words such as “often,” “seldom,” and “occasionally”mean different things to different people.
Interviewer influence: Factors such as tone of voice, body language, dress,gender, authority, and ethnicity of the interviewer might influence responses.
Voluntary response: Individuals with strong feelings about a subject aremore likely than others to respond. Such a study is interesting but not reflec-tive of the population.
Sometimes our goal is to understand the cause-and-effect relationships be-tween two or more variables. Such studies can be complicated by lurking vari-ables or confounding variables.
For instance, consider a study involving just two variables, amount of gasolineused to commute to work and time to commute to work. Level of traffic congestionis a likely lurking variable that increases both of the study variables. In a study in-volving several variables such as grade point average, difficulty of courses, IQ, andavailable study time, some of the variables might be confounded. For instance, stu-dents with less study time might opt for easier courses.
Some researchers want to generalize their findings to a situation of widerscope than that of the actual data setting. The true scope of a new discovery mustbe determined by repeated studies in various real-world settings. Statistical exper-iments showing that a drug had a certain effect on a collection of laboratory ratsdo not guarantee that the drug will have a similar effect on a herd of wild horsesin Montana.
A lurking variable is one for which no data have been collected but thatnevertheless has influence on other variables in the study.
Two variables are confounded when the effects of one cannot be distin-guished from the effects of the other. Confounding variables may be part ofthe study, or they may be outside lurking variables.
Generalizing results
Lurking and confounding variables
1048629_Brase_CH01_p002-033 8/4/08 4:16 PM Page 24
Copyright 2010 Cengage Learning, Inc. All Rights Reserved.May not be copied, scanned, or duplicated, in whole or in part.
Licensed to:

The sponsorship of a study is another area of concern. Subtle bias may be in-troduced. For instance, if a pharmaceutical company is paying freelance re-searchers to work on a study, the researchers may dismiss rare negative findingsabout a drug or treatment.
Section 1.3 Introduction to Experimental Design 25
Choosing Data Collection TechniquesWe’ve briefly discussed three common techniques for gathering data: observationalstudies, experiments, and surveys. Which technique is best? The answer depends onthe number of variables of interest and the level of confidence needed regardingstatements of relationships among the variables.
• Surveys may be the best choice for gathering information across a wide rangeof many variables. Many questions can be included in a survey. However,great care must be taken in the construction of the survey instrument and inthe administration of the survey. Nonresponse and other issues discussed ear-lier can introduce bias.
• Observational studies are the next most convenient technique for gatheringinformation on many variables. Protocols for taking measurements or record-ing observations need to be specified carefully.
• Experiments are the most stringent and restrictive data-gathering technique.They can be time-consuming, expensive, and difficult to administer. In exper-iments, the goal is often to study the effects of changing only one variable at atime. Because of the requirements, the number of variables may be more lim-ited. Experiments must be designed carefully to ensure that the resulting dataare relevant to the research questions.
G U I D E D E X E R C I S E 6 Cautions about data
Comment on the usefulness of the data collected as described.
(a) A uniformed police officer interviews a group of20 college freshmen. She asks each one his or hername and then if he or she has used an illegaldrug in the last month.
(b) Jessica saw some data that show that cities withmore low-income housing have more homelesspeople. Does building low-income housing causehomelessness?
(c) A survey about quality of food in the studentcafeteria was conducted by having formsavailable for customers to pick up at the cashregister. A drop box for completed forms wasavailable outside the cafeteria.
(d) Extensive studies on coronary problems wereconducted using men over age 50 as the subjects.
Respondents may not answer truthfully. Some mayrefuse to participate.
There may be some confounding or lurkingvariables, such as the size of the city. Larger citiesmay have more low-income housing and morehomeless.
The voluntary response likely will produce morenegative comments.
Conclusions for men over age 50 may or may notgeneralize to other age and gender groups. Theseresults may be useful for women or younger people,but studies specifically involving these groups mayneed to be performed.
Study sponsor
1048629_Brase_CH01_p002-033 8/4/08 4:16 PM Page 25
Copyright 2010 Cengage Learning, Inc. All Rights Reserved.May not be copied, scanned, or duplicated, in whole or in part.
Licensed to:
COMMENT An experiment is the best technique for reaching valid conclu-sions. By carefully controlling for other variables, the effect of changing onevariable on a treatment group and comparing it to a control group yields re-sults carrying high confidence.
The next most effective technique for obtaining results that have high con-fidence is the use of observational studies. Care must be taken that the act ofobservation does not change the behavior being measured or observed.
The least effective technique for drawing conclusions is the survey. Surveyshave many pitfalls and by their nature cannot give exceedingly precise results.A medical survey asking patients if they feel better after taking a specific druggives some information, but not precise information about the drug’s effects.However, surveys are widely used to gauge attitudes, gather demographic in-formation, study social and political trends, and so on.
26 Chapter 1 GETTING STARTED
VIEWPOINT Is the Placebo Effect a Myth?
Henry Beecher, former Chief of Anesthesiology at Massachusetts General
Hospital, published a paper in the Journal of the American Medical Association (1955) in which he
claimed that the placebo effect is so powerful that about 35% of patients would improve simply if they
believed a dummy treatment (placebo) was real. However, two Danish medical researchers refuted
this widely accepted claim in the New England Journal of Medicine. They said the placebo effect is
nothing more than a “regression effect,” referring to a well-known statistical observation that patients
who feel especially bad one day will almost always feel better the next day, no matter what is done for
them. However, other respected statisticians question the findings of the Danish researchers.
Regardless of the new controversy surrounding the placebo effect, medical researchers agree that
placebos are still needed in clinical research. Double-blind research using placebos prevents the
researchers from inadvertently biasing results.
SECTION 1.3 PROBLEMS
1. Statistical Literacy A study involves three variables: income level, hours spentwatching TV per week, and hours spent at home on the Internet per week. Listsome ways the variables might be confounded.
2. Statistical Literacy Consider a completely randomized experiment in which acontrol group is given a placebo for congestion relief and a treatment group isgiven a new drug for congestion relief. Describe a double-blind procedure forthis experiment and discuss some benefits of such a procedure.
3. Ecology: Gathering Data Which technique for gathering data (observationalstudy or experiment) do you think was used in the following studies?(a) The Colorado Division of Wildlife netted and released 774 fish at Quincy
Reservoir. There were 219 perch, 315 blue gill, 83 pike, and 157 rainbowtrout.
(b) The Colorado Division of Wildlife caught 41 bighorn sheep on Mt. Evansand gave each one an injection to prevent heartworm. A year later, 38 ofthese sheep did not have heartworm, while the other three did.
(c) The Colorado Division of Wildlife imposed special fishing regulations on theDeckers section of the South Platte River. All trout under 15 inches had to bereleased. A study of trout before and after the regulation went into effectshowed that the average length of a trout increased by 4.2 inches after thenew regulation.
(d) An ecology class used binoculars to watch 23 turtles at Lowell Ponds. It wasfound that 18 were box turtles and 5 were snapping turtles.
1048629_Brase_CH01_p002-033 8/4/08 4:16 PM Page 26
Copyright 2010 Cengage Learning, Inc. All Rights Reserved.May not be copied, scanned, or duplicated, in whole or in part.
Licensed to:
4. General: Gathering Data Which technique for gathering data (sampling, exper-iment, simulation, or census) do you think was used in the following studies?(a) An analysis of a sample of 31,000 patients from New York hospitals sug-
gests that the poor and the elderly sue for malpractice at one-fifth the rate ofwealthier patients (Journal of the American Medical Association).
(b) The effects of wind shear on airplanes during both landing and takeoff werestudied by using complex computer programs that mimic actual flight.
(c) A study of all league football scores attained through touchdowns and fieldgoals was conducted by the National Football League to determine whetherfield goals account for more scoring events than touchdowns (USA Today).
(d) An Australian study included 588 men and women who already had someprecancerous skin lesions. Half got a skin cream containing a sunscreen witha sun protection factor of 17; half got an inactive cream. After 7 months,those using the sunscreen with the sun protection had fewer new precancer-ous skin lesions (New England Journal of Medicine).
5. General: Completely Randomized Experiment How would you use a com-pletely randomized experiment in each of the following settings? Is a placebo be-ing used or not? Be specific and give details.(a) A veterinarian wants to test a strain of antibiotic on calves to determine their
resistance to common infection. In a pasture are 22 newborn calves. There isenough vaccine for 10 calves. However, blood tests to determine resistanceto infection can be done on all calves.
(b) The Denver Police Department wants to improve its image with teenagers. Auniformed officer is sent to a school one day a week for 10 weeks. Each daythe officer visits with students, eats lunch with students, attends pep rallies,and so on. There are 18 schools, but the police department can visit onlyhalf of these schools this semester. A survey regarding how teenagers viewpolice is sent to all 18 schools at the end of the semester.
(c) A skin patch contains a new drug to help people quit smoking. A group of 75cigarette smokers have volunteered as subjects to test the new skin patch. Forone month, 40 of the volunteers receive skin patches with the new drug. Theother volunteers receive skin patches with no drugs. At the end of two months,each subject is surveyed regarding his or her current smoking habits.
6. Surveys: Manipulation The New York Times did a special report on polling thatwas carried in papers across the nation. The article pointed out how readily the re-sults of a survey can be manipulated. Some features that can influence the results ofa poll include the following: the number of possible responses, the phrasing of thequestion, the sampling techniques used (voluntary response or sample designed to berepresentative), the fact that words may mean different things to different people,the questions that precede the question of interest, and finally, the fact that respon-dents can offer opinions on issues they know nothing about.(a) Consider the expression “over the last few years.” Do you think that this ex-
pression means the same time span to everyone? What would be a more pre-cise phrase?
(b) Consider this question: “Do you think fines for running stop signs should bedoubled?” Do you think the response would be different if the question“Have you ever run a stop sign?” preceded the question about fines?
(c) Consider this question: “Do you watch too much television?” What do youthink the responses would be if the only responses possible were yes or no?What do you think the responses would be if the possible responses wererarely, sometimes, or frequently?
7. Critical Thinking An agricultural study is conducted to compare the harvestvolumes of two types of barley. The site for the experiment is bordered by ariver. The field is divided into eight plots of approximately the same size. The ex-periment calls for the plots to be blocked into four plots per block. Then, twoplots of each block will be randomly assigned to one of the two barley types.
Section 1.3 Introduction to Experimental Design 27
1048629_Brase_CH01_p002-033 8/4/08 4:16 PM Page 27
Copyright 2010 Cengage Learning, Inc. All Rights Reserved.May not be copied, scanned, or duplicated, in whole or in part.
Licensed to:
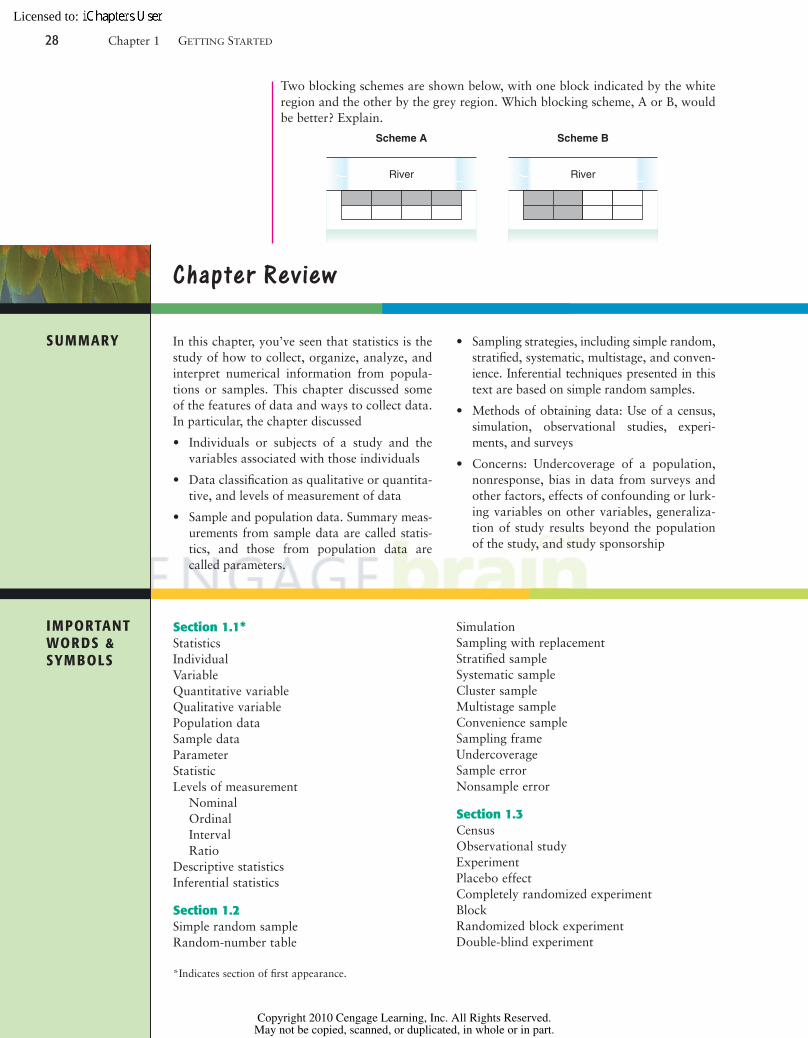
Two blocking schemes are shown below, with one block indicated by the whiteregion and the other by the grey region. Which blocking scheme, A or B, wouldbe better? Explain.
Scheme A
River
Scheme B
River
28 Chapter 1 GETTING STARTED
In this chapter, you’ve seen that statistics is thestudy of how to collect, organize, analyze, andinterpret numerical information from popula-tions or samples. This chapter discussed someof the features of data and ways to collect data.In particular, the chapter discussed
• Individuals or subjects of a study and thevariables associated with those individuals
• Data classification as qualitative or quantita-tive, and levels of measurement of data
• Sample and population data. Summary meas-urements from sample data are called statis-tics, and those from population data arecalled parameters.
• Sampling strategies, including simple random,stratified, systematic, multistage, and conven-ience. Inferential techniques presented in thistext are based on simple random samples.
• Methods of obtaining data: Use of a census,simulation, observational studies, experi-ments, and surveys
• Concerns: Undercoverage of a population,nonresponse, bias in data from surveys andother factors, effects of confounding or lurk-ing variables on other variables, generaliza-tion of study results beyond the populationof the study, and study sponsorship
Chapter Review
Section 1.1*StatisticsIndividualVariableQuantitative variableQualitative variablePopulation dataSample dataParameterStatisticLevels of measurement
NominalOrdinalIntervalRatio
Descriptive statisticsInferential statistics
Section 1.2Simple random sampleRandom-number table
SimulationSampling with replacementStratified sampleSystematic sampleCluster sampleMultistage sampleConvenience sampleSampling frameUndercoverageSample errorNonsample error
Section 1.3CensusObservational studyExperimentPlacebo effectCompletely randomized experimentBlockRandomized block experimentDouble-blind experiment
SUMMARY
IMPORTANTWORDS &SYMBOLS
*Indicates section of first appearance.
1048629_Brase_CH01_p002-033 8/4/08 4:16 PM Page 28
Copyright 2010 Cengage Learning, Inc. All Rights Reserved.May not be copied, scanned, or duplicated, in whole or in part.
Licensed to:

Chapter Review Problems 29
Control groupTreatment groupConfounding variableLurking variableRandomization
ReplicationSurveyNonresponseVoluntary responseHidden bias
VIEWPOINT Is Chocolate Good for Your Heart?
A study of 7841 Harvard alumni showed that the death rate was 30% lower in
those who ate candy compared with those who abstained. It turns out that candy, especially chocolate,
contains antioxidants that help slow the aging process. Also, chocolate, like aspirin, reduces the activity
of blood platelets that contribute to plaque and blood clotting. Furthermore, chocolate seems to raise
levels of high-density lipoprotein (HDL), the good cholesterol. However, these results are all preliminary.
The investigation is far from complete. A wealth of information on this topic was published in the
August 2000 issue of the Journal of Nutrition. Statistical studies and reliable experimental design are
indispensable in this type of research.
CHAPTER REVIEW PROBLEMS
1. Statistical Literacy You are conducting a study of students doing work-studyjobs on your campus. Among the questions on the survey instrument are:
A. How many hours are you scheduled to work each week? Answer to thenearest hour.
B. How applicable is this work experience to your future employment goals?
Respond using the following scale: 1 � not at all, 2 � somewhat, 3 � very
(a) Suppose you take random samples from the following groups: freshmen,sophomores, juniors, and seniors. What kind of sampling technique are youusing (simple random, stratified, systematic, cluster, multistage, convenience)?
(b) Describe the individuals of this study.(c) What is the variable for question A? Classify the variable as qualitative or
quantitative. What is the level of the measurement?(d) What is the variable for question B? Classify the variable as qualitative or
quantitative. What is the level of the measurement?(e) Is the proportion of responses “3 � very” to question B a statistic or a
parameter?(f) Suppose only 40% of the students you selected for the sample respond.
What is the nonresponse rate? Do you think the nonresponse rate might in-troduce bias into the study? Explain.
(g) Would it be appropriate to generalize the results of your study to all work-study students in the nation? Explain.
2. Radio Talk Show: Sample Bias A radio talk show host asked listeners to re-spond either yes or no to the question, Is the candidate who spends the most ona campaign the most likely to win? Fifteen people called in and nine said yes.What is the implied population? What is the variable? Can you detect any bias inthe selection of the sample?
3. Simulation: TV Habits One cable station knows that approximately 30% of itsviewers have TIVO and can easily skip over advertising breaks. You are to de-sign a simulation of how a random sample of seven station viewers would re-spond to the question, “Do you have TIVO?” How would you assign therandom digits 0 through 9 to the responses “Yes” and “No” to the TIVO ques-tion? Use your random digit assignment and the random-number table to gener-ate the responses from a random sample of seven station viewers.
1048629_Brase_CH01_p002-033 8/4/08 4:16 PM Page 29
Copyright 2010 Cengage Learning, Inc. All Rights Reserved.May not be copied, scanned, or duplicated, in whole or in part.
Licensed to:

4. General: Type of Sampling Categorize the type of sampling (simple random, strat-ified, systematic, cluster, or convenience) used in each of the following situations.(a) To conduct a preelection opinion poll on a proposed amendment to the state
constitution, a random sample of 10 telephone prefixes (first three digits ofthe phone number) was selected, and all households from the phone prefixesselected were called.
(b) To conduct a study on depression among the elderly, a sample of 30 patientsin one nursing home was used.
(c) To maintain quality control in a brewery, every 20th bottle of beer comingoff the production line was opened and tested.
(d) Subscribers to the magazine Sound Alive were assigned numbers. Then asample of 30 subscribers was selected by using a random-number table. Thesubscribers in the sample were invited to rate new compact disc players for a“What the Subscribers Think” column.
(e) To judge the appeal of a proposed television sitcom, a random sample of 10people from each of three different age categories was selected and thosechosen were asked to rate a pilot show.
5. General: Gathering Data Which technique for gathering data (observationalstudy or experiment) do you think was used in the following studies? Explain.(a) The U.S. Census Bureau tracks population age. In 1900, the percentage of
the population that was 19 years old or younger was 44.4%. In 1930, thepercentage was 38.8%; in 1970, the percentage was 37.9%; and in 2000, thepercentage in the age group was down to 28.5% (The First Measured Century,T. Caplow, L. Hicks, B. J. Wattenberg).
(b) After receiving the same lessons, a class of 100 students was randomly di-vided into two groups of 50 each. One group was given a multiple-choiceexam covering the material in the lessons. The other group was given an es-say exam. The average test scores for the two groups were then compared.
6. General: Experiment How would you use a completely randomized experimentin each of the following settings? Is a placebo being used or not? Be specific andgive details.(a) A charitable nonprofit organization wants to test two methods of fundrais-
ing. From a list of 1000 past donors, half will be sent literature about thesuccessful activities of the charity and asked to make another donation. Theother 500 donors will be contacted by phone and asked to make another do-nation. The percentage of people from each group who make a new dona-tion will be compared.
(b) A tooth-whitening gel is to be tested for effectiveness. A group of 85 adultshave volunteered to participate in the study. Of these, 43 are to be given a gelthat contains the tooth-whitening chemicals. The remaining 42 are to be givena similar-looking package of gel that does not contain the tooth-whiteningchemicals. A standard method will be used to evaluate the whiteness of teethfor all participants. Then the results for the two groups will be compared.How could this experiment be designed to be double-blind?
(c) Consider the experiment described in part (a). Describe how you would usea randomized block experiment with blocks based on age. Use three blocks:donors under 30 years old, donors 30 to 59 years old, donors 60 and over.
7. Student Life: Data Collection Project Make a statistical profile of your own sta-tistics class. Items of interest might be(a) Height, age, gender, pulse, number of siblings, marital status(b) Number of college credit hours completed (as of beginning of term); grade
point average(c) Major; number of credit hours enrolled in this term(d) Number of scheduled hours working per week(e) Distance from residence to first class; time it takes to travel from residence to
first class(f) Year, make, and color of car usually driven
30 Chapter 1 GETTING STARTED
1048629_Brase_CH01_p002-033 8/4/08 4:16 PM Page 30
Copyright 2010 Cengage Learning, Inc. All Rights Reserved.May not be copied, scanned, or duplicated, in whole or in part.
Licensed to:

What directions would you give to people answering these questions? For in-stance, how accurate should the measurements be? Should age be recorded as oflast birthday?
8. Census: Web Site Census and You, a publication of the Census Bureau, indicatesthat “Wherever your Web journey ends up, it should start at the Census Bureau’ssite.” Visit the Online Study Center at www.cengage.com/statistics/Brase/UBS5e andfind a link to the Census Bureau’s site, as well as to Fedstats, another extensivesite offering links to federal data. The Census Bureau site touts itself as the sourceof “official statistics.” But it is willing to share the spotlight. The web site nowhas links to other “official” sources: other federal agencies, foreign statisticalagencies, and state data centers. If you have access to the Internet, check out theCensus Bureau’s site.
9. Focus Problem: Fireflies Suppose you are conducting a study to compare fireflypopulations exposed to normal daylight/darkness conditions with firefly popula-tions exposed to continuous light (24 hours a day). You set up two firefly coloniesin a laboratory environment. The two colonies are identical except that one colonyis exposed to normal daylight/darkness conditions and the other is exposed to con-tinuous light. Each colony is populated with the same number of mature fireflies.After 72 hours, you count the number of living fireflies in each colony.(a) Is this an experiment or an observation study? Explain.(b) Is there a control group? Is there a treatment group?(c) What is the variable in this study?(d) What is the level of measurement (nominal, interval, ordinal, or ratio) of the
variable?
Linking Concepts: Writing Projects 31
DATA H IGHLIGHTS:GROUP PROJECTS
1. Use a random-number table or random-number generator to simulate tossing afair coin 10 times. Generate 20 such simulations of 10 coin tosses. Compare thesimulations. Are there any strings of 10 heads? of 4 heads? Does it seem that inmost of the simulations half the outcomes are heads? half are tails? In Chapter 6,we will study the probabilities of getting from 0 to 10 heads in such a simulation.
2. Use a random-number table or random-number generator to generate a randomsample of 30 distinct values from the set of integers from 1 to 100. Instructionsfor doing this using the TI-84Plus/TI-83Plus, Excel, Minitab, or SPSS are given inUsing Technology at the end of this chapter. Generate five such samples. Howmany of the samples include the number 1? the number 100? Comment about thedifferences among the samples. How well do the samples seem to represent thenumbers between 1 and 100?
LINKING CONCEPTS:WRITING PROJECTS
Discuss each of the following topics in class or review the topics on your own. Thenwrite a brief but complete essay in which you summarize the main points. Please in-clude formulas and graphs as appropriate.
1. What does it mean when we say that we are going to use a sample to draw an in-ference about a population? Why is a random sample so important to thisprocess? If we wanted a random sample of students in the cafeteria, why couldn’twe just take the students who order Diet Pepsi with their lunch? Comment on thestatement, “A random sample is like a miniature population, whereas samplesthat are not random are likely to be biased.” Why would the students who orderDiet Pepsi with lunch not be a random sample of students in the cafeteria?
2. In your own words, explain the differences among the following sampling tech-niques: simple random sample, stratified sample, systematic sample, cluster sam-ple, multistage sample, and convenience sample. Describe situations in whicheach type might be useful.
1048629_Brase_CH01_p002-033 8/4/08 4:16 PM Page 31
Copyright 2010 Cengage Learning, Inc. All Rights Reserved.May not be copied, scanned, or duplicated, in whole or in part.
Licensed to:

Using Technology
General spreadsheet programs such as Microsoft Excel,specific statistical software packages such as Minitab orSPSS, and graphing calculators such as the TI-84Plus andTI-83Plus all offer computing support for statistical meth-ods. Applications in this section may be completed usingsoftware or calculators with statistical functions. Selectkeystroke or menu choices are shown for the TI-84Plusand TI-83Plus calculators, Minitab, Excel, and SPSS in theTechnology Hints portion of this section. More details canbe found in the software-specific Technology Guide thataccompanies this text.
ApplicationsMost software packages sample with replacement. Thatis, the same number may be used more than once in thesample. If your applications require sampling without re-placement, draw more items than you need. Then use sortcommands in the software to put the data in order, anddelete repeated data.
1. Simulate the results of tossing a fair die 18 times. Re-peat the simulation. Are the results the same? Did youexpect them to be the same? Why or why not? Dothere appear to be equal numbers of outcomes 1through 6 in each simulation? In Chapter 5, we willencounter the law of large numbers, which tells us thatwe would expect equal numbers of particular out-comes only when the simulation is very large.
2. A college has 5000 students, and the registrar wishesto use a random sample of 50 students to examinecredit hour enrollment for this semester. Write a briefdescription of how a random sample can be drawn.Draw a random sample of 50 students. Are you sam-pling with or without replacement?
Technology Hints: Random Numbers
TI-84Plus/TI-83PlusTo select a random set of integers between two specifiedvalues, press the MATH key and highlight PRB with5:randInt (low value, high value, sample size). Press Enterand fill in the low value, high value, and sample size. Tostore the sample in list L1, press the STO� key and thenL1. The screen display shows two random samples of size5 drawn from the integers between 1 and 100.
ExcelTo select a random number between two specified values,type the command�Randbetween(low value, high value)in the formula bar. Alternatively, access a dialogue box forthe command by clicking on the paste function keyon the menu bar. Then choose All in the left drop-downmenu and RANDBETWEEN in the right menu. Fill in thedialogue box.
MinitabTo generate random integers be-tween specified values, use themenu selection Calc � RandomData � Integer. Fill in the dia-logue box to get five randomnumbers between 1 and 100.
SPSSSPSS is a research statistical package for the social sciences.Data are entered in the data editor, which has a spread-sheet format. In the data editor window, you have a choice of data view (default) or variable view. In thevariable view, you name variables, declare type (numericfor measurements, string for category), determine format,and declare measurement type. The choices for measure-ment type are scale (for ratio or interval data), ordinal, or nominal. Once you have entered data, you can use themenu bar at the top of the screen to select activities,graphs, or analysis appropriate to the data.
12345
9958698613
A5A B C D E
=RANDBETWEEN(1,100)=
fx
32
C1
1048629_Brase_CH01_p002-033 8/4/08 4:16 PM Page 32
Copyright 2010 Cengage Learning, Inc. All Rights Reserved.May not be copied, scanned, or duplicated, in whole or in part.
Licensed to:
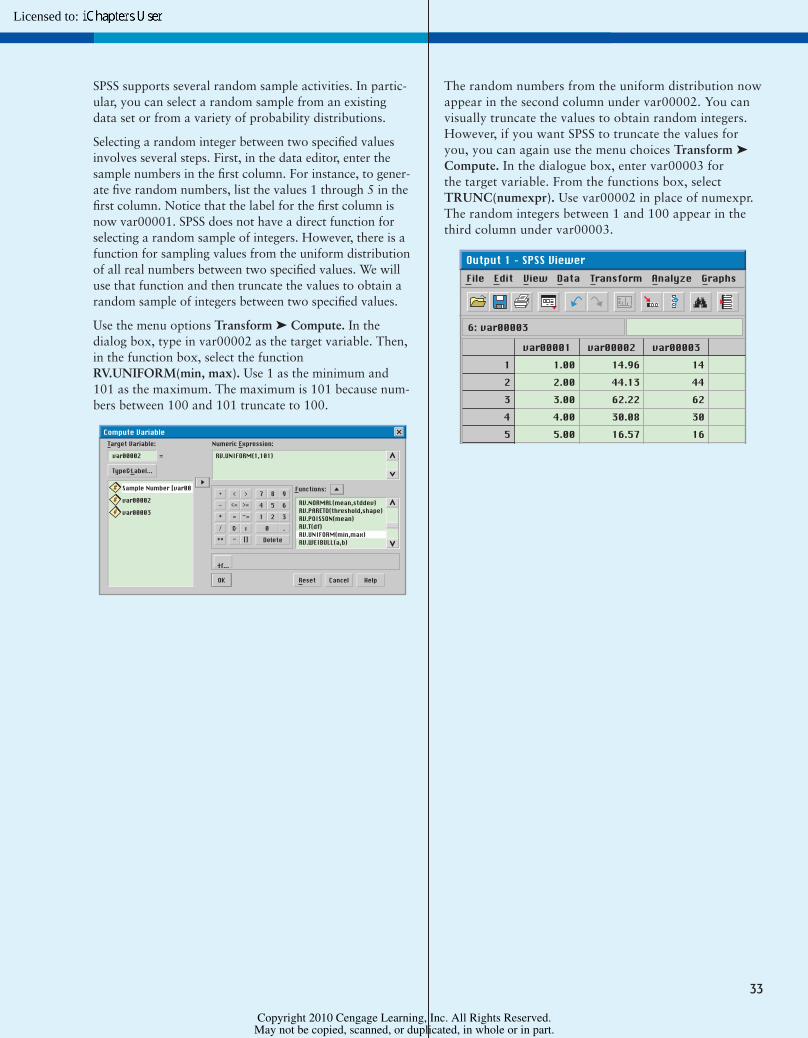
The random numbers from the uniform distribution nowappear in the second column under var00002. You canvisually truncate the values to obtain random integers.However, if you want SPSS to truncate the values foryou, you can again use the menu choices Transform �Compute. In the dialogue box, enter var00003 for the target variable. From the functions box, selectTRUNC(numexpr). Use var00002 in place of numexpr.The random integers between 1 and 100 appear in thethird column under var00003.
33
SPSS supports several random sample activities. In partic-ular, you can select a random sample from an existingdata set or from a variety of probability distributions.
Selecting a random integer between two specified valuesinvolves several steps. First, in the data editor, enter thesample numbers in the first column. For instance, to gener-ate five random numbers, list the values 1 through 5 in thefirst column. Notice that the label for the first column isnow var00001. SPSS does not have a direct function forselecting a random sample of integers. However, there is afunction for sampling values from the uniform distributionof all real numbers between two specified values. We willuse that function and then truncate the values to obtain arandom sample of integers between two specified values.
Use the menu options Transform � Compute. In thedialog box, type in var00002 as the target variable. Then,in the function box, select the functionRV.UNIFORM(min, max). Use 1 as the minimum and101 as the maximum. The maximum is 101 because num-bers between 100 and 101 truncate to 100.
Target Variable:Compute Variable
var00002 =
Numeric Expression:
RV.UNIFORM(1,101)
Type&Label...
OK
#
var00002#
var00003#
Cancel Help
Sample Number [var00 Functions:
Reset
If...
7 8 94 5 61 2 3
+ < >- <= >=
* = ~=
/ & ı** ~ []
0Delete
.
RV.NORMAL(mean,stddev)RV.PARETO(threshold,shape)RV.POISSON(mean)RV.T(df)RV.UNIFORM(min,max)RV.WEIBULL(a,b)
1048629_Brase_CH01_p002-033 8/4/08 4:16 PM Page 33
Copyright 2010 Cengage Learning, Inc. All Rights Reserved.May not be copied, scanned, or duplicated, in whole or in part.
Licensed to:
ANSWERS AND KEY STEPS TOODD-NUMBERED PROBLEMS
C H A P T E R 1
Section 1.1
1. An individual is a member of the population of interest.A variable is an aspect of an individual to be measuredor observed.
3. A parameter is a numerical measurement describing datafrom a population. A statistic is a numericalmeasurement describing data from a sample.
5. (a) Response regarding frequency of eating at fast-foodrestaurants. (b) Qualitative. (c) Responses for alladults in the U.S.
7. (a) Nitrogen concentration (mg nitrogen/l water).(b) Quantitative. (c) Nitrogen concentration (mgnitrogen/l water) in the entire lake.
9. (a) Ratio. (b) Interval. (c) Nominal. (d) Ordinal.(e) Ratio. (f) Ratio.
11. (a) Nominal. (b) Ratio. (c) Interval. (d) Ordinal.(e) Ratio. (f) Interval.
13. Answers vary.(a) For example: Use pounds. Round weights to thenearest pound. Since backpacks might weigh as much as30 pounds, you might use a high-quality bathroom scale.(b) Some students may not allow you to weigh theirbackpacks for privacy reasons, etc. (c) Possibly. Somestudents may want to impress you with the heaviness oftheir backpacks, or they may be embarrassed about the“junk” they have stowed inside and thus may clean outtheir backpacks.
Section 1.2
1. In a stratified sample, random samples from each strataare included. In a cluster sample, the clusters to beincluded are selected at random and then all members ofeach selected cluster are included.
3. The advice is wrong. A sampling error only accounts forthe difference in results based on the use of a samplerather than the entire population.
5. Use a random-number table to select four distinctnumbers corresponding to people in your class.(a) Reasons may vary. For instance, the first fourstudents may make a special effort to get to class ontime. (b) Reasons may vary. For instance, fourstudents who come in late might all be nursing studentsenrolled in an anatomy and physiology class that meetsthe hour before in a far-away building. They may bemore motivated than other students to complete adegree requirement. (c) Reasons may vary. Forinstance, four students sitting in the back row might beless inclined to participate in class discussions.
(d) Reasons may vary. For instance, the tallest studentsmight all be male.
7. Answers vary. Use groups of two digits.9. Select a starting place in the table and group the digits in
groups of four. Scan the table by rows and include thefirst six groups with numbers between 0001 and 8615.
11. (a) Yes, when a die is rolled several times, the samenumber may appear more than once. Outcome on thefourth roll is 2. (b) No, for a fair die, the outcomes arerandom.
13. Since there are five possible outcomes for each question,read single digits from a random-number table. Select astarting place and proceed until you have 10 digits from1 to 5. Repetition is required. The correct answer foreach question will be the letter choice corresponding tothe digit chosen for that question.
15. (a) Simple random sample. (b) Cluster sample.(c) Convenience sample. (d) Systematic sample.(e) Stratified sample.
Section 1.3
1. Answers vary. People with higher incomes are morelikely to have high-speed Internet access and to spendmore time on-line. People with high-speed Internetaccess might spend less time watching TV news orprogramming. People with higher incomes might spendless time watching TV because of access to otherentertainment venues.
3. (a) Observational study. (b) Experiment.(c) Experiment. (d) Observational study.
5. (a) Use random selection to pick 10 calves to inoculate;test all calves; no placebo. (b) Use random selection topick 9 schools to visit; survey all schools; no placebo.(c) Use random selection to pick 40 volunteers for skinpatch with drug; survey all volunteers; placebo used.
7. Based on the information given, Scheme A is bestbecause it blocks all plots bordering the river togetherand all plots not bordering the river together. The blocksof Scheme B do not seem to differ from each other.
Chapter 1 Review
1. (a) Stratified. (b) Students on your campus with work-study jobs. (c) Hours scheduled; quantitative; ratio.(d) Rating of applicability of work experience to futureemployment; qualitative; ordinal. (e) Statistic.(f) 60%; The people choosing not to respond may havecertain characteristics, such as not working many hours,that would bias the study. (g) No. The sample frame isrestricted to one campus.
A13
1048629_Brase_ODDANS_A13-A36.qxd 9/18/08 7:46 AM Page 13
Copyright 2010 Cengage Learning, Inc. All Rights Reserved.May not be copied, scanned, or duplicated, in whole or in part.
Licensed to:

A14 ANSWERS AND KEY STEPS TO ODD-NUMBERED PROBLEMS
3. Assign digits so that 3 out of the 10 digits 0 through 9correspond to the answer “Yes” and 7 of the digitscorrespond to the answer “No.” One assignment isdigits 0, 1, and 2 correspond to “Yes” whereas digits 3,4, 5, 6, 7, 8, and 9 correspond to “No.” Starting withline 1, block 1 of Table 1, this assignment of digits givesthe sequence No, Yes, No, No, Yes, No, No.
5. (a) Observational study. (b) Experiment.7. Possible directions on survey questions: Give height in
inches, give age as of last birthday, give GPA to onedecimal place, and so forth. Think about the types ofresponses you wish to have on each question.
9. (a) Experiment, since a treatment is imposed on onecolony. (b) The control group receives normal daylight/darkness conditions. The treatment group has light 24hours per day. (c) The number of fireflies living at theend of 72 hours. (d) Ratio.
1048629_Brase_ODDANS_A13-A36.qxd 9/18/08 7:46 AM Page 14
Copyright 2010 Cengage Learning, Inc. All Rights Reserved.May not be copied, scanned, or duplicated, in whole or in part.
This page contains answers for this chapter only.
Licensed to:

A12
Photo Credits
Chapter 1 p. 2: (top) Paul Spinelli/MLB Photos via Getty Inages; (middle) Bettmann/Corbis; p. 3: (top) Ivan Polunin/Bruce Coleman Images;
(bottom) Courtesy of the authors; p. 6: Geoffrey Bryant/Photo Researchers, Inc.; p. 13: Bay Ismoyo/Getty Images; p. 21: Tim Davis/Photo
Researchers, Inc.; p. 24: Richard Lord Enterprises, Inc./Image Works.
Chapter 2 p. 34: (top) Fyodor Savintsev/ITAR-TASS/Corbis; (middle) Brown Brothers; p. 35: (top) Judy Gelles/Stock Boston; (bottom)
Vandystat/Photo Researchers, Inc.; p. 37: Bob Turner/Alamy; p. 52: Myrleen Ferguson Cate/PhotoEdit; p. 57: Corbis; p. 58: Michael
Doolittle/Image Works.
Chapter 3 p. 72: (top) PARAMOUNT TELEVISION / THE KOBAL COLLECTION; (middle) Imagno/Getty; p. 73: (top) Nancy Sheehan/
PhotoEdit; (bottom) Myrleen Ferguson Cate/PhotoEdit; p. 75: Skjold Photographs/PhotoEdit; p. 77: Jose Carillo/PhotoEdit; p. 84: David Young-
Wolff/PhotoEdit; p. 86: Tony Freeman/PhotoEdit; p. 90: Ron Watts/Corbis; p. 92: Bob Daemmrich Photography/Image Works; p. 101: Gary
Conner/PhotoEdit; p. 111: Peter Southwick/Stock Boston; p. 115: Dave G. Houser/Corbis.
Chapter 4 p. 118: (top) Getty; (middle) Archivo Iconografico, S.A./Corbis; p. 119: (top) David Young-Wolff/PhotoEdit; (bottom) Peter
Menzel/Stock Boston; p. 121: Cindy Kassabi/Corbis; p. 125: David Muench/Corbis; p. 137: Joe McDonald/Corbis; p. 140: Joe McDonald/Corbis.
Chapter 5 p. 156: (top) Scot Frei/Corbis; (middle) NorthWind Picture Archives; p. 157: (top) David Young-Wolff/PhotoEdit; (bottom) John
Neubauer/PhotoEdit; p. 161: Bonnie Kamin/PhotoEdit; p. 168: Philip Harvey/Corbis; p. 177: Jupiter Images.
Chapter 6 p. 202: (top) AP/Wide World Photos; (middle) National Portrait Gallery, Smithsonian Institution, Art Resource, NY; p. 203: (top) Peter
Vandermark/Stock Boston; (bottom) Mitch Wojnarowicz/Image Works; p. 208: Kelly-Mooney Photography/Corbis; p. 220: Ted Curtin/Stock
Boston; p. 226: Mark Richards/PhotoEdit; p. 240: Hubert Stadler/Corbis; p. 241: Jupiter Images.
Chapter 7 p. 242: (top) Picture-Desk; (middle) Stock Montage, Inc.; p. 243: (top) Dana White/PhotoEdit; (bottom) Syracuse Newspapers/Image
Works; p. 252: Lois Ellen Frank/Corbis; p. 264: Pierre Arsenault/Alamy; p. 275: Philip James Corwin/Corbis; p. 280: Corbis; p. 293: William
Mullins/Photo Researchers, Inc.; p. 300: Mike Mazzaschi/Stock Boston.
Chapter 8 p. 306: (top) Rusty Jarrett/Getty; (middle) The Granger Collection; p. 307: (top) Ed Bock/Corbis; (bottom) Philip James/Corbis; p. 312:
Myrleen Ferguson Cate/PhotoEdit; p. 325: Francois Gohier/Photo Researchers, Inc.; p. 333: Bob Daemmrich/Stock Boston; p. 344: Judy
Griesedieck/Corbis.
Chapter 9 p. 350: (top) Mary Evans Picture Library/Arthur Rackham/The Image Works; (middle) Brown Brothers; p. 351: (top) Comstock RF;
(bottom) Reuters/Corbis; p. 356: Jupiter Images; p. 368: Comstock RF; p. 387: John Elk/Stock Boston; p. 401: Omni Photo/Index Stock Imagery.
Chapter 10 p. 404: (top) Printed by permission of the Norman Rockwell Family Agency Copyright © 1953 the Norman Rockwell Family
Entities; (middle) John Bryson/Getty; p. 405: (top) Robert Erwin/Photo Researchers, Inc.; (bottom) Peter Southwick@Stock Boston; p. 409: Fritz
Hoffman/Image Works; p. 421: Bob Winsett/Corbis; p. 440: Bob Daemmrich Photography/Image Works; p. 443: Bob Daemmrich/Stock Boston.
Chapter 11 p. 456: (top) Business Wire/Getty; (middle) Keystone Press Agency/SUMA; p. 457: (top) Nancy Richmond/Image Works; (bottom)
Robert Brenner/Photo Edit; p. 4460: Tony Freeman/PhotoEdit; p. 467: Getty Images; p. 474: Skjold Photographs/PhotoEdit; p. 484: Mark
Richards/PhotoEdit; p. 497: Erwin and Peggy Bauer/Animals, Animals/Earth Scenes; p. 499: Jeffrey Greenberg/Photo Researchers, Inc.; p. 511:
Douglas Faulkner/Photo Researchers, Inc.; p. 513: Image 100/Royalty-Free/Corbis.
1048629_CREDITS.qxd 9/18/08 7:52 AM Page A12
Copyright 2010 Cengage Learning, Inc. All Rights Reserved.May not be copied, scanned, or duplicated, in whole or in part.