library - discover economic history | st. louis fed · 35l> 378 376 367 357 296 286 306 3a76...
TRANSCRIPT


%
L I B R A F
LIBRARYROOM 5030
JUN 9. 1 1972
TREASURY DEPARTMENT

mEASHMV,'BdJUJLIETniN
JUNE-I35D
UNITED STATES TREASURY DEPARTMENTOFFICE OF THE SECRETHRV

June 1950
Table of Contents
PageTreasury financing operations A-l
Summary of Federal fiscal operations 1
Budget receipts and expenditures 2
Trust accounts, etc g
Treasury cash Income and outgo 12
General Fund of the Treasury 15
Debt outstanding lg
Statutory debt limitation 20
Debt operations 21
United States savings bonds 26
Treasury savings notes 30
Ownership of Federal securities 31
Treasury survey of ownership of Federal securities 33
Market quotations 37
Yields of Treasury and corporate bonds ko
Internal revenue collections k2
Monetary statistics I|£
Capital movements 50
Cumulative table of contents 63
Note: In those tables where figures have been rounded to aspecified unit, all calculations (Including percent-ages) have been made from unrounded figures. Conse-quently the details may not add to the totals shown.


Juno 1950 A-l
Treasury Financing Operations
June Certificate MaturityOn May 4, 1950, the 3ecretary of the Treasury
announced that new Issues of 13-month 1-1/4 percent
Treasury notes dated June 1 and July 1 would be
offered In exchange for the one-year 1-1/4- percent
certificates of Indebtedness maturing on those dates.
The June maturity amounted to $5,019 million and the
July maturity to $5,601 million.
Subsequently, subscription books were opened on
May 22 for a new Issue of 13-month 1-1/14- percent
Treasury notes, Series D-195L Exchanges were made,
par for par, for the one-year 1-1/4 percent certifi-
cates of Indebtedness, Series E-I95O, maturing
June 1. Cash subscriptions were not received.
Subscription books were closed at the close of
business on May 25.
The new notes are dated June 1, 1950, and bear
Interest from that date at the rate of 1-1/4 percent
per annum, payable with the principal at maturity on
July 1, 1951- The notes were issued In bearer form
only, in denominations of $1,000, $5,000, $10,000,
$100,000, and $1,000,000. The Issue Is not subject
to redemption before maturity.
Reports to the Treasury on the ownership of
Government securities indicate that on March J\
195°> about 57 percent of the maturing certificates
were owned by reporting oommerclal banks and
Federal Reserve Banks. The ownership figures for
March 31 are the latest published for the holdings
of commercial banks.
Subscriptions to the new notes amounted to $4,817
million, leaving $201 million to be paid In oaeh.
Call of Two Issues of Treasury BondsOn May 12, the Secretary of the Treasury an-
nounced that the bonds of two outstanding Issues which
may be redeemed at the option of the United States on
September 15, 1950. are called for redemption on that
date. These issues are the 2-1/2 percent Treasury
bonds of 1950-52, dated September 15, I93S, due
September 15, 195^, and the 2 percent Treasury bonds
of 1950-52, dated April 15, 1943, due September 15,
1952. The announcements stated that holders of these
bonds, In advance of their redemption date, may be
offered the privilege of exchanging all or any part
of their called bonds for other interest-bearing
obligations of the United States, in which event
public notice will hereafter be given.
Treasury Bills Refunded and Increased
Treasury bills matured In May In the amount of
$4.0 billion, and new offerings totaled $4.4 bil-
lion. Each of the four maturing Issues amounted
approximately to $1,000 million and each of the
four new Issues to $1,100 million. The average
rates of discount on the May offerings were 1.166
percent on May 4 and 11, I.I65 percent on May IS,
and I.I67 percent on May 25.
Note: Details of Treasury market financing operations areshown in the tables on "Offerings"and"Disposition",respectively, of marketable issues of bonds, notes,
and certificates of indebtedness, and in the table "Offer-ings of Treasury Bills", in this Issue of the "TreasuryBulletin"
.


Jane W50
SUMMARY OF FEDERAL FISCAL OPERATIONS
Treasury Bulletin
BUDGET RECEIPTS AND EXPENDITURES
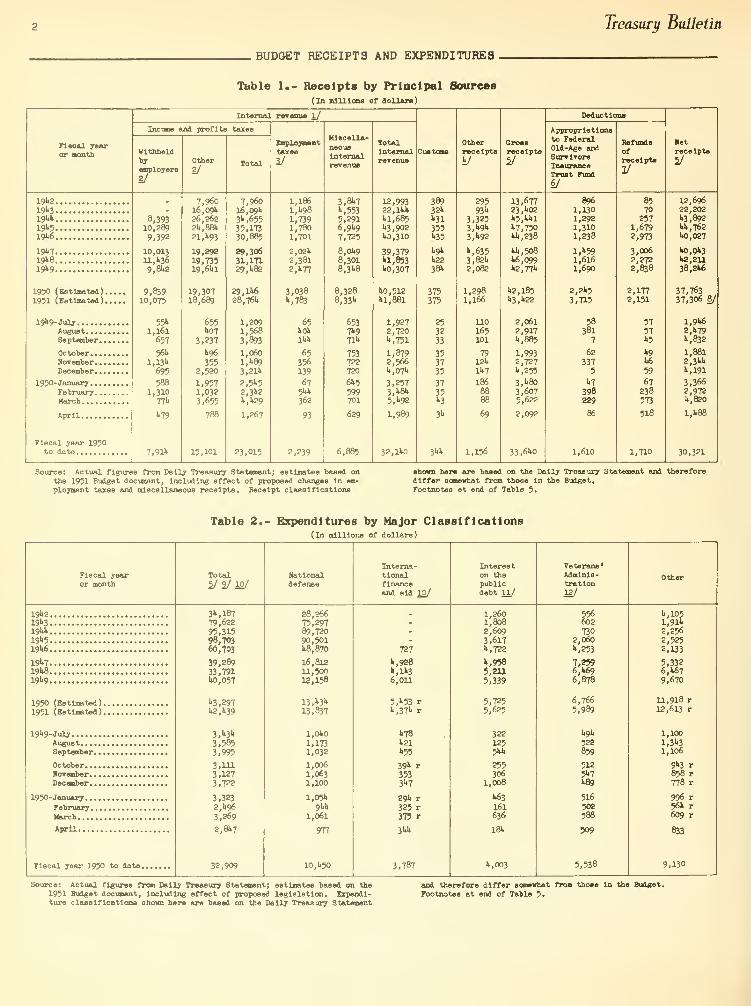
Table 1.- Receipts by Principal Sources(In mill Ions of dollars)
Fiscal yearor month
Internal revenue l/
Income and profits taxes
Withheldbyemployers
2/
Other
2/
Employmenttaxes
Miscella-neousInternalrevenue
TotalInternalrevenue
Otherreceipts
yCrossreceipts
Deductions
Appropriationsto FederalOld-Age andSurvivorsInsuranceTrust Fund
«/
^TRefundsofreceipts
1/
letreceipt*
1/
19*2.19k3.19kk.19k5.19k6.
19k?.
i9k8.19k9.
1950 (Estimated).
1951 (Eatlmated).
19119-Julj
Auguat. . ..
September
.
October. .
.
November .
.
December .
.
1950-January . .
.
February.
.
March
April.
Fiscal year 1950to date
8,39310,2899,392
10,013ll,k369.8U2
9,83910,075
55k
1,161657
56k1,13k
695
5881,310
77k
k79
7,91k
7,96016,09k26,2622k, 88k21,k93
19,29219,73519,6kl
19,30718,689
655k07
3,237
k96
3552,520
1,9571,0323,655
788
15,101
7,96016,09k3k,65535,17330,885
29,30631,17129,k82
29,lk628,76k
1,2091,5683,893
1,060l,k893,21k
2,5k52,3k2k,k29
1,267
23,015
1,186l,k981,7391,7801,701
2,02k
2,3812,k77
3,038k,783
65koklkk
65356139
675kk362
93
2,239
3,8k7k,553
5,2916,9k9
7,725
8,Ok9
8,3018,3k8
8,3288,33k
6537k971k
753722
720
6k5
599701
629
6,885
12,99322, lkkkl,685k3,902k0,310
39,379kl,853kO,307
k0,512kl,88l
1,9272,720k,751
1,8792,566k,07k
3,2573,k8k5,k92
1,989
32,lkO
38932kk31
355k35
k9kk2238k
375375
2532
33
353735
3735k3
3k
3kk
29593k
3,3253,k9k3,k92
k,6353,82k2,082
1,2981,166
110165lfll
7912k
lk7
1868888
69
1,156
13,67723,k02k5,kklk7,750kk,238
kk,508k6,099k2,77k
k2,l85k3,k22
2,0612,917k,885
1,9932,727k,255
3,k80
3,6075,622
2,092
33,6kO
8961,1301,2921,3101,238
l,k59
1,6161,690
2,2k5
3,715
58381
7
62
3375
k7
398229
86
1,610
8570
2571,6792,973
3,0062,2722,838
2,1772,151
5757k5
k9k6
59
67238573
518
1,710
12,69622,202k3,892kk,762k0,027
k0,0k3k2,21138,2k6
37,76337,306 8/
l,9k62,k79k,832
1,8812,3kkk,191
3,3662,972k,820
l,k88
30,321
Source: Actual figures from Dally Treasury Statement; estimates based onthe 1951 Budget document, including effect of proposed changes In em-
ployment taxes and miscellaneous receipts. Receipt classifications
shown here are based on the Dally Treasury Statement and therefore
differ eamevhat from those In the Budget.Footnotes at end of Table 5.
Table 2.- Expenditures by Major Classifications(In millions of dollars)
Fiscal yearor month
Total
57 5710/Nationaldefense
Interna-tionalfinanceand aid 10/
Intereston thepublicdeht 11/
Veterans*Adminis-tration12/
19k2.19k3.19kk.
19k5.19k6.
19k7.19k8.19k9.
1950 (Estimated).
1951 (Estimated).
19k9-JulyAugust. . .
.
September
.
October...November .
.
December.
.
1950-January...
February.
.
March
April.....
Fiscal year 1950 to date.
3k,l8779,62295,31598,70360,703
39,28933,791kO,057
k3,297k2,k39
3,k3k
3,5853,995
3,1113,1273,722
3,3232,k96
3,269
2,8k7
32,909
28,26675,29789,72090,501k8,870
16,81211,50012,158
13,k3k
13,837
l,0k0
1,1731,032
1,0061,0631,100
1,05k
9kk1,061
977
10,k50
727
k,9281.H36,011
5,k53 rk,37k r
k78k21k55
39k r3533k7
29k r
325 r
375 r
3kk
3,787
1,2601,8082,6093,617k,722
k,958
5,2115,339
5,7255,625
3221255kk
255306
1,008
k63
161636
18k
k,003
g6602
7302, 060k,253
7,2596,k696,878
6,766
5,9&9
k9lt
522859
5125k7k89
516502588
509
5,538
k,1051,91k
2,2562,5252,133
5,3326,k679,670
11,918 r
12,613 r
1,100l,3k31,106
9k3 r858 r
778 r
996 r56k r609 r
833
9,130
Source: Actual figures from Dally Treasury Statement; estimates baaed on the
1951 Budget document. Including effect of proposed legislation. Expendi-ture classifications shown here are based on the Dally Treasury Statement
and therefore differ somewhat from those In the Budget.
Footnotes at end of Table 5.
June 1950
BUDGET RECEIPTS AND EXPENDITURES
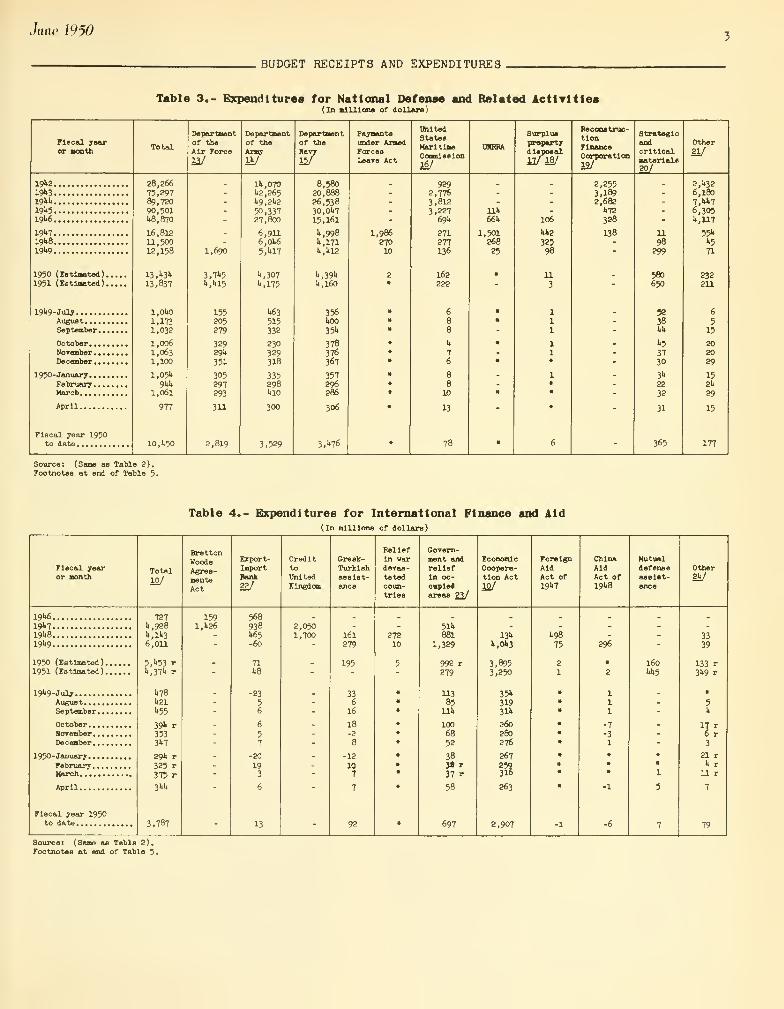
Table 3.- Expendituree for National Defense and Related Activities(In miUlona of dollars)
Fiscal yearor Booth
Departmentof theAir Force
Departmentof the
Army
it/
Departmentof the
Navy
15/
Paymentsunder ArmedForcesLeave Act
UnitedStatesMaritimeCommission16/
Surpluspropertydisposal
Reconstruc-tionFinanceCorporation
12/
Strategicand
criticalmaterials20/
Other
21/
191*2.
19**3.
191* 1*.
19">5.
191*6.
191*7.
19k8.19"*9.
1950 (Estimated).1951 (Estimated).
191*9-JulyAugust. . .
.
September.
October. .
.
November .
.
December..
1950-January...February.
.
March
April
.
Fiscal year 1950to date
28,26675,29789,72090,5011*8,870
16,81211,50012,158
13, U3U
13,837
1,01*0
1,1731,032
1,0061,0631,100
l,05li
9Utl,06l
977
10,1*50
1,690
3,7**5
155205279
32929k
351
305297293
311
2,819
lit,0701*2,265
U9,2U2
50,33727,800
6,9116,01*6
5,1*17
!*,307
1*,175
1*63
515332
230329318
3352981*10
300
3,529
8,58020,88826,53830,01*7
15,l6l
I..998
1,171I*, It12
It, 391*
It, 160
3561*00
35l>
378376367
357296286
306
3A76
1,98627010
9292,7763,8123,227
691*
271277136
162222
688
It
76
8810
13
78
lilt
66>t
1,50126825
106
32598
11
3
2,2553,1892,682
1*72
328
138 11
98299
580650
5238kit
1*5
3730
3**
22
32
31
365
2,1*32
6,1807.U.7
6,305*, 117
55k1*5
71
232211
6
515
SO20
29
152*t
29
15
177
Source: (Same as Table 2).Footnotes at end of Table 5.
Table 4.- Expenditures for International Finance and Aid(In millions of dollars)
Fiscal yearor month
Total
10/
BrettonWoodsAgree-mentsAct
Export-ImportBank22/
Creditto
UnitedKingdom
Greek-Turkishassist-ance
ReliefIn wardevas-tatedcoun-tries
Govern-ment andreliefIn oc-cupiedareas 23/
EconomicCoopera-tion Act
10/
ForeignAidAct of19"t7
ChinaAidAct of19U8
Mutualdefenseassist-ance
Other
191*6.
19*7.19W.W19.
1950 (Estimated).1951 (Estimated).
19l*9-July
August. ...
September.
October..November
.
December
.
1950-January..February.March
April
.
Fiscal year 1950to date
7271*,9281*,1U3
6,011
5,"»53 rl*,37l* r
It781*21
1*55
39"» r35331.7
29lt r325 r
375 r
31*1*
3,787
1591,1*26
5689381*65
-60
711*8
-23
56
6
57
-20
193
6
13
2,0501,700 161
279
195
33616
18-2
-12
107
92
27210
51k881
1,329
992 r279
11385
111.
100
6852
383« r
37 r
58
697
13**»,<*3
3,8953,250
351*
31931U
260280276
267
IS263
2,907
1.98
75
2
1
296
•
Treasury Bulletin
BUDGET RECEIPTS AND EXPENDITURES
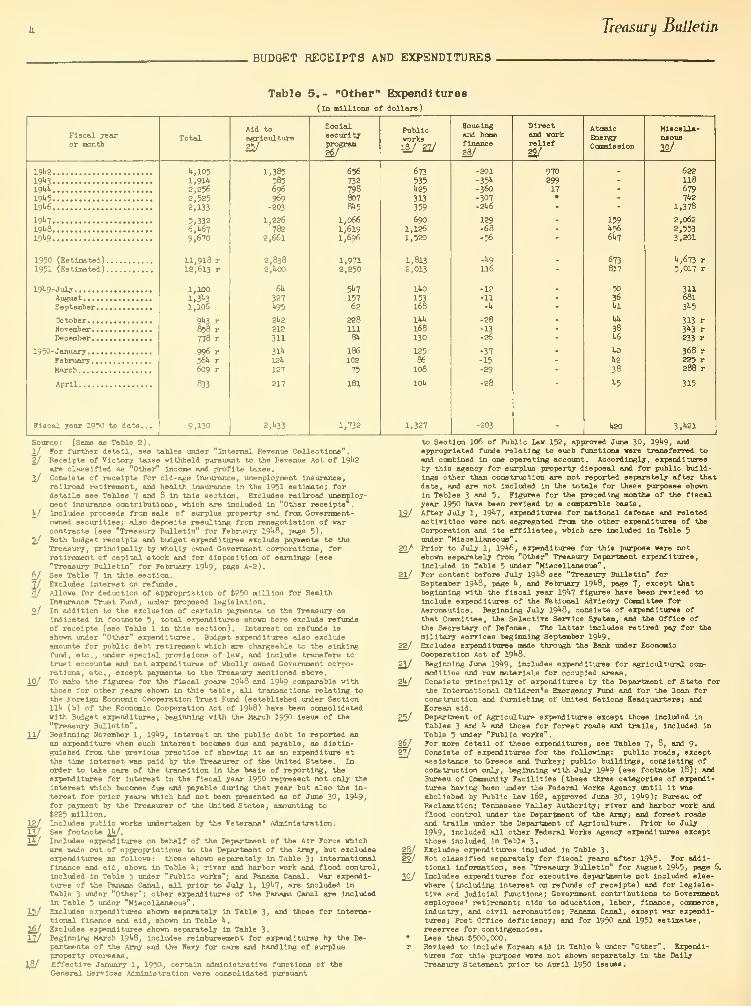
Table 5.- "Other" Expenditures(In millions of dollars)
Fiscal yearor month
Aid toagrioulture
22/
Socialsecurityprogramw
Publicworks
18/ £2/
Housingand haute
finance
28/
Directand workreliefW
AtomicEnergyCommission
Miscella-neous
32/
I9U219U319M*
1*519W
19"t7
19"t8
19k9
1950 (Estimated)1951 (Estimated)
19>t9-JulJAugust., . ...
September. .
.
OctoberNovemberDecember. . .
.
1950-JanuaryFebruary. , .
.
March
April
Fiscal year 1950 to date.
k,W51.91A2,2562,5252,133
5,3326,1*67
9,670
11,918 r12,613 r
1,100
1,106
9*3 r858 r778 r
996 r56U r609 r
833
9,130
1,385585696969
-203
1,226782
2,661
2,8382,U00
61.
327U95
2U2212311
311*
12ll
127
217
2, ^33
656
732798807»5
1,0661,6191,696
1,9712,250
5I17
15762
2281118U
186
102
75
181
1,732
673
535U25
313359
6901,1261,520
1,8132,013
1U0
153168
m168
130
12586
108
10k
1,327
-201-35"t
-360
-307-2U6
129-68-56
-kg116
-12-11
-k
-28-13-26
-37-15
-29
-28
-203
97029917
159U566U7
673817
5036Ul
V.
38U6
to
ks
38
*5
k20
6221186797U2
1,378
2,062
2,5533,201
k.frn r
5,017 r
311681
31*5
313 r3"»3 r
233 r
368 r
225 r288 r
315
3,ll21
Source: (Same as Table 2).
1/
y
2/
2/
10/
w
±2/
12/
16/
11/
18/
For further detail, see tables under Internal Revenue Collections .
Receipts of Victory taxes withheld pursuant to the Revenue Act of 19^2are classified as "Other" Income and profits taxes.Consists of receipts for old-age insurance, unemployment Insurance,railroad retirement, and health insurance In the 1951 estimate; fordetails see Tables 7 and 8 In this section. Excludes railroad unemploy-ment insurance contributions, which are Included In "Other receipts".Includes proceeds from sale of surplus property end from Government-owned securities; also deposits resulting from renegotiation of warcontracts (see "Treasury Bulletin" for February 19*»8, page 5).Both budget receipts and budget expenditures exclude payments to the
Treasury, principally by wholly owned Government corporations, forretirement of capital stock and for disposition of earnings (see
"Treasury Bulletin" for February 19^9, page A-2).See Table 7 in this section.Excludes Interest on refunds.AIIowb for deduction of appropriation of $250 million for HealthInsurance Trust Fund, under proposed legislation.In addition to the exclusion of certain payments to ths Treasury as
indicated in footnote 5, total expenditures shown here exclude refundsof receipts (see Table 1 in this section). Interest on refunds Is
shown under "Other" expenditures. Budget expenditures also excludeamounts for public debt retirement which are chargeable to the sinkingfund, etc., under special provisions of law, and include transfers totrust accounts and net expenditures of wholly owned Government corpo-rations, etc., except paymente to the Treasury mentioned above.To make the figures for the fiscal years 19^8 and 19^9 comparable withthose for other years shown In this tabls, all transactions relating tothe Foreign Economic Cooperation Trust Fund (established under SectionUU (b) of tho Economic Cooperation Act of 19*»8) have been consolidatedwith Budget expenditures, beginning with the March 1950 issue of the
"Treasury Bulletin"
.
Beginning November 1, 19^9, Interest on the public debt Is reported as
an expenditure when such interest becomes due and payable, as distin-guished from the previous practice of showing it as an expenditure atthe time interest was paid by the Treasurer of the United States. Inorder to take care of the transition In the basis of reporting, theexpenditures for interest in the fiscal year 1950 repreesnt not only the
Interest which becomes due and payable during that year but also the in-
terest for prior years which had not been presented as of June 30, 19^9
»
for payment by the Treasurer of the United States, amounting to
$225 million.Includes public works undertaken by the Veterans* Administration.See footnote lh/ .
Includes expenditures on behalf of the Department of the Air Force whichare made out of appropriations to the Department of the Army, but excludesexpenditures as follows: those shown separately in Table 3; internationalfinance and aid, shown in Table h; river and harbor work and flood control,Included In Table 5 undsr "Public works"; *rm Panama Canal. War expendi-tures of the Panama Canal, all prior to July 1, 19^*1, are Included in
Table 3 under "Other"; other expenditures of the Panama Canal are IncludedIn Table 5 under "Miscellaneous"
.
Excludes expenditures shown separately In Table 3, and those for Interna-tional finance and aid, shown In Table 1*.
Excludes expenditures shown separately In Table 3*Beginning March 19^8, Includes reimbursement for expenditures by the De-partments of the Army and the Navy for care and handling of surplusproperty overseas.Effective January 1, 1950, certain administrative functions of the
General Services Administration were consolidated pursuant
23/
20/
21/
22/
237
2jt/
25/
26/27/
28/
22/
32/
to Section 106 of Public Law 152, approved June 30, 19**9, andappropriated funds relating to such functions were transferred to
and combined In one operating account. Accordingly, expendituresby this agency for surplus property disposal and for public build-
ings other than construction are not reported separately after thatdate, and are not Included in the totals for these purposes shown
In Tables 3 and 5. Figures for the preceding months of the fiscalyear 1950 have been revised to a comparable basis.After July 1, 19^7, expenditures for national defense and relatedactivities were not segregated from the other expenditures of the
Corporation and its affiliates, which are included In Table 5under "Miscellaneous".Prior to July 1, 19W>, expenditures for this purpose were notshown separately from "Other" Treasury Department expenditures,Included In Table 5 under "Miscellaneous".For content before July 19W see "Treasury Bulletin" forSeptember 19^8, page U, and February 19^8, page 7, except thatbeginning with the fiscal year 19*t7 figures have been revised to
include expenditures of tho National Advisory Committee forAeronautics. Beginning July 19**8, consists of expenditures ofthat Committee, the Selective Service System, and the Office ofthe Secretary of Defense. The latter includes retired pay for the
military services beginning September 19^9.Excludes expenditures made through the Bank under EconomicCooperation Act of 19^8.
Beginning June 19^9, includes expendituree for agricultural com-modities and raw materials for occupied areas.Consists principally of expenditures by the Department of State forthe International Children's Emergency Fund and for the loan forconstruction and furnishing of United Nations Headquarters; andKorean aid.Department of Agriculture expenditures except those Included in
Tables 3 and h and thoes for forest roads and trails, Included In
Table 5 under "Public works".
For more detail of these expenditures, see Tables 7, 8, and 9.Consists of expenditures for the following: public roads, exceptassistance to Greece and Turkey; public buildings, consisting ofconstruction only, beginning with July 19**9 (see footnote 18); andBureau of Community Facilities (these three categories of expendi-tures having been under the Federal Works Agency until It wasabolished by Public Law 162, approved June 30, 19 1*9); Bureau ofReclamation; Tennessee Valley Authority; river and harbor work andflood control under the Dsper'taient of the Army; and forest roadsand trails under the Department of Agriculture. Prior to July
19 1*9, Included all other Federal Works Agency expenditures exceptthose Included In Table 3.Excludes expenditures included In Table 3.Not classified separately for fiscal years after 19^5. For addi-
tional information, see "Treasury Bulletin" for August 19^5, page 6.
Includes expendituree for executive departanente not included else-where (Including Interest on refunds of receipts) and for legisla-tive «nd Judicial functions; Government contributions to Governmentemployees' retirement; aide to education, labor, finance, commerce,
Industry, and civil aeronautics; Panama Canal, except war expendi-tures; Poet Office deficiency; and for 1950 and 1951 estimates,reserves for contlngsncies.Lees than $500,000.Revised to include Korean aid in Table h under "Other". Expendi-tures for this purpose were not shown separately In the DallyTreasury Statement prior to April 1950 issues.

June 1950
BUDGET RECEIPTS AND EXPENDITURES
Table 6.- Summary by Months and Calendar Years(In million!) of dollars)
Calendar year Feb. Apr. May July Aug. Sept. Not.
Net budget receipts \J
1938.
1939194019*1.
1942,
1943,
1944,
1945,1946,
1947,
1948,
1949,
1950,
1938,
1939.1940,
1941,1942,
19113.
19UI1,
1945,1946.
1947.
1948,
1949.
1950.
1938.
1939.1940,
1941.
1942,
19*3.1944,19l>5.
19U6.
1947.
1948.
1949.
1950.
267309334571
7832,7403,4593,7703,725
4,1963,5793,366
363"•39
411751
9U92,4943,6133,5844,196
4,1583,3812,972
7911,5573,538
5,2026,5326,6615,5015,342
5,874
5,4354,820
208296383686
1,5083,0472,786
2,1591,962
2,2391,3401,488
340393386556
1,4722,8952,9002,2432,297
2,324
1,945
552
5991,2702,469
4,5676,1825,7023,9634,929
4,8594,767
267260
325407
739
2,0012,0782,4352,1822,281
2,0961,946
444365440
390581
2,7142,4322,6562,2462,438
2,5052,479
672671703
1,1282,5U
5,4415,8034,8754,3864,612
4,5434,832
295272327437599
2,0241,9002,4532,4402,339
2,1011,881
345357356
558594
2,0932,1052,3222,2882,692
2,5402,344
668513734
1,2052,695
5,7305,3244,0674,0504,197
4,0144,191
4,8515,7128,46716,290
34,48343,53143,92838,81041,010
41,45038,122
Budget expenditures 2/
653677
1,1332,680
6,7287,7378,1424,8113,019
2,800
3,2053,323
585624
1,0762,652
6,3588,0127,1273,3403,731
2,2242,9722,496
785798
1,482
3,515
7,74610,4129,0343,5983,239
3,0863,6513,269
665710
1,404
3,939
7,3007,3377,7583,7503,407
2,5413,1512,847
694605
1,3524,400
7,4756,8798,9273,3743,284
2,2223,104
884884
1,5914,810
8,2608,6319,5404,8364,996
4,0184,656
666
956843
1,6315,257
7,4998,0148,5613,2873,553
3,7413,434
703
1,020801
1,6685,456
7,8318,2086,9492,7452,962
2,3353,585
751692
7381,9895,921
7,6677,7796,3722,6632,673
3,0663,995
777752891
2,3286,184
7,6198,0345,6192,8602,394
2,9113,111
967631888
1,8906,012
7,9477,8114,5302,4532,143
3,1633,127
835835
1,1872,684
6,926
7,7448,3274,962
3,6053,176
4,102
3,722
9,1519,645
20,22957,751
90,17497,18187,52241,32238,576
36,20941,714
Budget surplus, or deficit (-) 3_/
-385-368
-7992,109
5,946
4,9974,6831,042
706
1,39637444
-222-184-665
-1,901
-5,409-5,518-3,514
243464
1,934409476
-103-7
7523
-2,543-3,880-2,3731,9022,102
2,7881,7831,551
-457-414
-1,022
-3,253
-5,792-4,291-4,972-1,591-1,445
-302-1,811-1,358
-354-213-966
-3,844
-6,002-3,984-6,028-1,131
-987
103-1,159
-332-285-321
-2,341
-3,693-2,449-3,838
-873-67
841111
-399-696
-519-1,224-4,518
-5,498-5,937-6,126-1,105-1,272
-1,645-1,488
-259-655-361
-1,278-4,875
-5,117-5,776-4,293
-499-524
169-1,106
-80-21-34
-861
-3,410
-2,227-1,976-1,4971,7231,940
1,477837
-483-480
-564
-1,891-5,585
-5,595-6,134-3,165
-420
-55
-810
-1,230
-622
-273-532
-1,332-5,417
-5,&54-5,706-2,208
-165
549
-623
-783
-166
-321-452
-1,479-4,231
-2,014-3,004
-895445
1,022
-88469
-4,300
-3,934-11,762-41,461
-55,691-53,650-43,594-2,5122,434
5,241-3,592
Source: Dally Treasury Statement.
1/ Gross receipts lees deductions for appropriations to Federal Old-Age andSurvivors Insurance Trust Fund and for refunds of receipts.
£_/ Excludes refunds of receipts, which are ehovn as a deduction from receipts(see footnote 1), oertaln payments to the Treasury, principally by whollyowned Government corporations, and amounts for public debt retirementwhich are chargeable to the sinking fund, etc., under special provisionsof law; Includes transfers to trust acoounts, and net expenditures of
wholly owned Government corporations, etc., except payments to
the Treasury mentioned above. In order to make the figures for
the fiscal years 1948 and 1949 comparable with those for other
years shown In this table, all transactions relating to the
Foreign Economic Cooperation Trust Fund (established underSection 114 (b) of the Economic Cooperation Aot of 1948) have
been consolidated with Budget expenditures, beginning with the
March 1950 Issue of the "Treasury Bulletin".
\J Ret receipts lees expenditures
.
Treasury Bulletin
BUDGET RECEIPTS AND EXPENDITURES
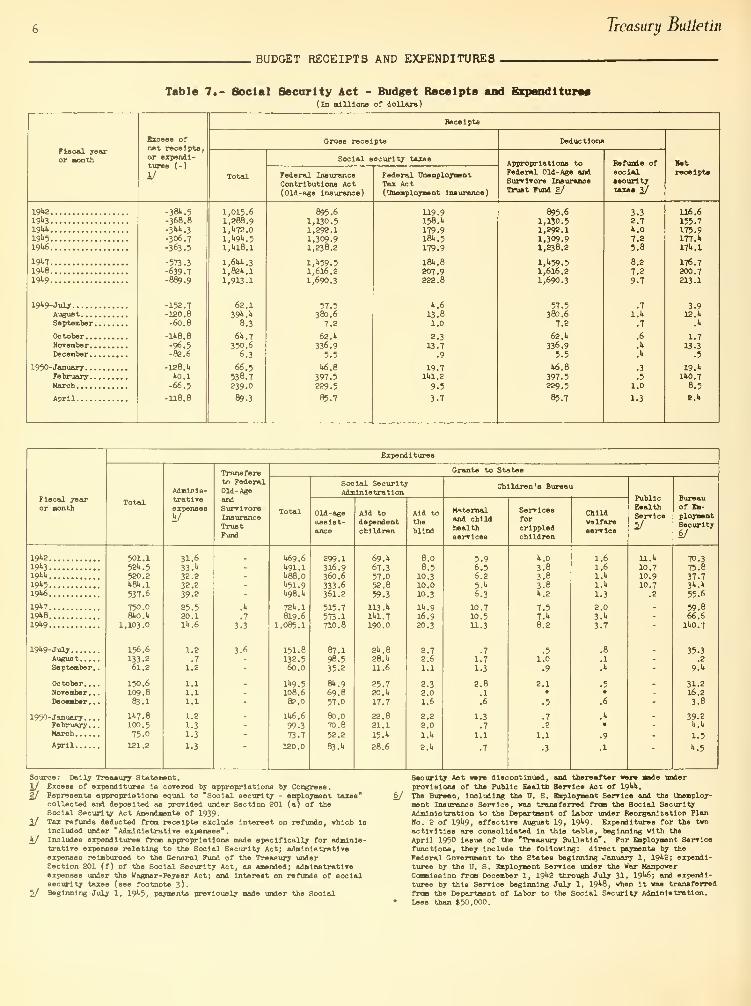
Table 7.- Social Security Act - Budget Receipts and Expenditure*(In millions of dollars)
Fiscal yearor nonth
June moBUDGET RECEIPTS AND EXPENDITURES
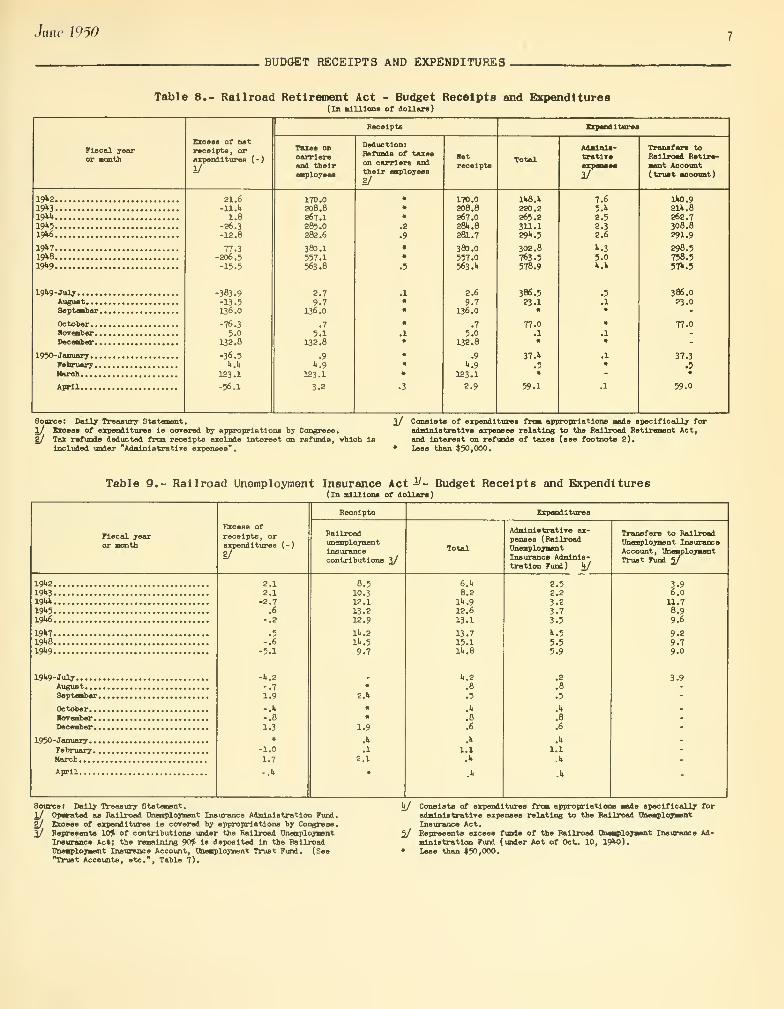
Table 8.- Railroad Retirement Act - Budget Receipts and Expenditures(In ml 11 Ions of dollars)
Flecal yearor nonth
Excess of netreceipts, orexpenditures (-)
1/
Receipts
Taxes oncarriersand theiremployees
Deduction:Refunds of taxeson carriers andtheir employees
s/
Retreceipts
Expenditures
Total tratlv.expense.
y
Transfers toRailroad Retire-ment Account(trust aoootmt)
19*21943194419451946
1947 ,
1948 ,
1949 ,
1949-July ,
August. . ..
September,
October.
.
Rorember.,Dec ember.
.
1950-January...February.
.
March
April
21.6-11.4
1.8-26.3-12.8
77.3-206.5
-15.5
-383.9-13.5136.0
-76.35.0
132.8
-36.54.4
123.1
-56.1
170.0208.8267.I285.0282.6
380.1557.1563.8
2.79.7
136.0
.7
5.1132.8
.9
4.9123.1
3.2
170.0208.8267.0284.8281.7
380.O
557.0563.4
2.6
9.7136.0
.7
5.0132.8
.9
4.9123.1
2.9
148.>i
220.2265.2311.1294.5
302.8763.5578.9
386.523.1
77.0.1
37.4
.5
59.1
7.65.42.52.32.6
4.35.0M
140.921*.
8
262.7308.8291.9
298.5758.5574.5
386.023.0
77.0
37.3.5
59-0
Source: Dally Treasury Statement.l/ Excess of expenditures Is corered by appropriations by Congress.2/ Tax refunds deducted from receipts exclude interest on refunds, which Is
Included under "Administrative expenses".
2/ Consists of expenditures from appropriations aade specifically forAdministrative expenses relating to the Railroad Retirement Act.and Interest on refunds of taxes (see footnote 2).
• Lees than $50,000.
Table 9.- Railroad Unemployment Insurance Act ^- Budget Receipts and Expenditures(In alUlons of dollars)
Fiscal yearor month
Excess of
receipts, orexpenditures (-
2/
Receipts
RailroadunemploymentInsurancecontributions 3V
Expenditures
Administrative ex-penses (RailroadUnemploymentInsurance Adminis-tration Fund) 4/
Transfers to Railroadunemployment InsuranceAccount, UnemploymentTrust Fund 57
19*219*319Wi191*5
1946
19»719*81949
19*9-JulyAugust....September.
October...Rotember..December.
.
1950-January . .
.
February.
.
March
April
2.12.1
-2.7.6
-.2
.5-.6
-5.1
-4.2-.7
1.9
-.4-.8
1.3
»
-1.0
1.7
-.4
8.510.312.113.212.9
111 .2
14.5
9.7
2.4
1.9
.4
.1
2.1
6.48.2
14.912.613.1
13.715.114.8
4.2.8
.5
.U
.8
.6
.4
1.1.4
2.52.23.23.73.5
4.55.55.9
.2
.8
.5
.4
.8
.6
.U
1.1
.4
3.96.011.78.99.6
9.29.79.0
3.9
Source! Dally Treasury Statement.l/ Oparated as Railroad Unemployment Insurance Administration Fund.
2/ Excess of expenditures Is corered by appropriations by Congress
.
2/ Represents 10% of contributions under the Railroad UnemploymentInsurance Act; the remaining 90% is deposited in the RailroadUnemployment Insurance Account, Unemployment Trust Fund. (Sse"Trust Accounts, etc.", Table 7).
4/ Consists of expenditures from appropriations made specifically foradministrative expenses relating to the Railroad unemploymentInsurance Act.
5V Represents excess funds of the Railroad Unemployment Insurance Ad-
ministration Fund (under Aot of Oct. 10, 1940).• Less than $50,000.
Treasury Bulletin
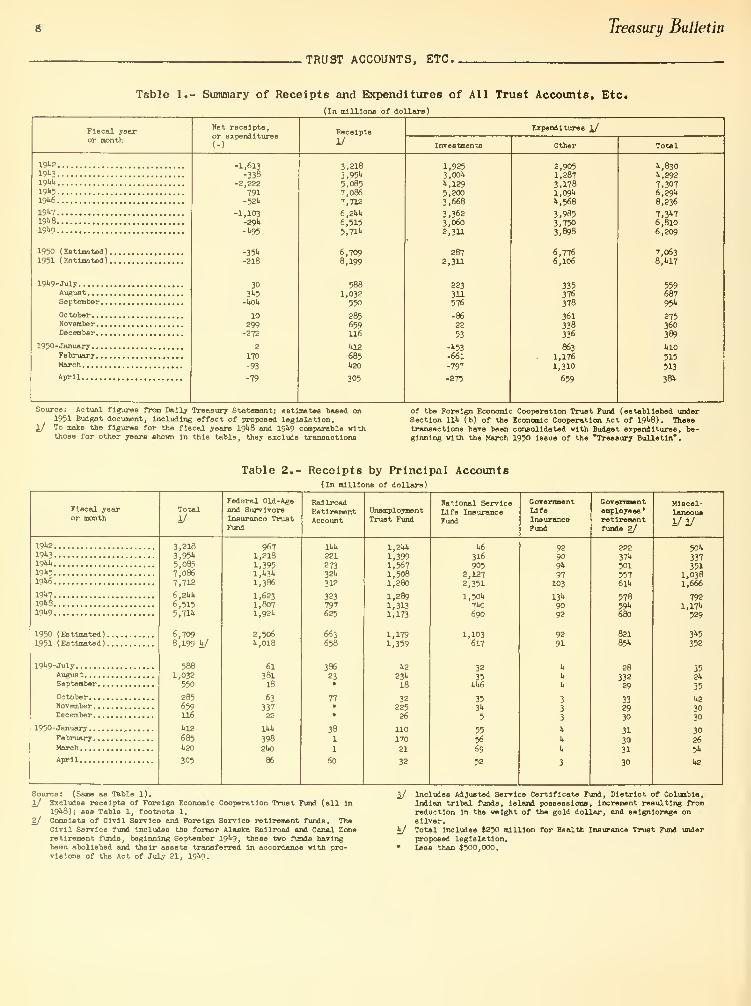
TRUST ACCOUNTS, ETC.,
Table 1.- Summary of Receipts and Expenditures of All Trust Accounts, Etc.
(In millions of dollars)
Fiscal yearor month
Net receipts,or expenditures
Receipts
1/
Expenditures 1/
InvestanentB Other Total
19421941944
19451946
194719481949
1950 (Estimated)1951 (Estimated)
1949-JulyAugustSeptember.
.
October. . .
.
November . .
.
December. .
.
1950-JanuaryFebruaryMarch
April
-1,613-338
-2,222
791-524
-1,103-294-U95
-354-218
30
10
299-272
2
170
-93
-79
3,2183,9545,0857,0867,712
6,244
6,5155, Tlli
6,7098,199
5881,032
550
285659116
412
685420
305
1,9253,0044,1295,2003,668
3,3623,0602,311
2872,311
223311576
-86
22
53
-453-661
-797
-275
2,9051,2873,1781,0944,568
3,9853,7503,898
6,7766,106
335376378
361338336
863
1,176
1,310
659
4,8304,292
7,3076,2948,236
7,3 1'7
6,8106,209
7,0638,417
559687954
275360
389
410
515513
384
Source: Actual figures from Daily Treasury Statement; estimates 'based on1951 Budget document, including effect of proposed legislation.
l/ To make the figures for the fiscal years I9U8 and I9U9 comparable withthose for other years shown in this table, they exclude transactions
of the Foreign Economic Cooperation Trust Fund (established underSection 11U (b) of the Economic Cooperation Act of 19^8) . Thesetransactions have been consolidated with Budget expenditures, be-ginning with the March 1950 issue of the "Treasury Bulletin".
Table 2.- Receipts by Principal Accounts(In millions of dollars)
Fiscal yearor month

June mo
TRUST ACCOUNTS, ETC.
Table 3.- Investments by Principal Accounts(In millions of dollars; negative figures are exceee of redemptions)
Fiscal yearor month
Federal Old-Ageand SurvivorsInsurance TruBtFund
RailroadRetirementAccount
UnemploymentTruBt Fund
NationalServiceLifeInsuranceFund
Gove:
LifeInsuranceFund
nt Governmentemployees
•
retirementfunds 1/
AdjustedServiceCertificateFund
I9U2
19>>3
I9W119k5I9U6
19k719k819k9
1950 (Estimated)1951 (Estimated)
19^9-JulyAugustSeptember .
.
October. . .
.
November . .
.
December. ..
1950-January. ...
February . .
.
March
April,
1,9253,00U
14,129
5,2003,668
3,36s3,0602,311
2872,311 2/
223311576
22
53
-U53-661
-797
-275
821
1,0351,1721,1371,002
19k19k,29U
1,7291,715
-57
315
-30
269
ko
130
250
130
1886
1U0182
156
1U85693k6
3"*9
312
361-1
-2k
52-2k-25
11
-2k-26
32
866
,228
,503,k37
102
1*3kk6-160
-833-216
-1051.7
-lko
-11U
37-167
-80
-21
-177
-110
3531*862
1,971>
2,053
1,23kk6l
353
-1,518-311
5
3
kl8
-23
-U32
-753
-853
-332
U76160
73k7
60
3232
-1920
-ita
-2
-2
-2
-2
-2
-3
-2
IkO280
393399309
282
363kk7
579577
1930k
9
3
11*
11
10
11
-1-2
-2
*
-6
Source: (Same as Table 1).l/ See Table 2, footnote 2.
2/ Total Includes $215 million by Health Insurance Trust Fund underproposed legislation.
* Lees than $500,000.
Table 4.- Expenditures Other Than Investments by Principal Accounts
(in millions of dollars; negative figures are excess of credits)
Fiscal yearor month
Total
If
FederalOld -Age andSurvivorsInsuranceTrust Fund
RailroadBetlrementAccount
Unemploy-mentTrustFund
NationalServiceLifeInsuranceFund
GovernmentLifeInsuranceFund
Governmentemployees
•
retirementfunds 2/
Miscel-
laneous
1/
Specialdepositaccounts(net)
Redemption , or sale (-),
of securities of Govern-ment corporations , etc .
,
In the market (net)
GuaranteedNotguaranteed
19>>2
19">3
19kk19k519k6
19&719k819k9
1950 (Estimated).
1951 (Estimated).
19k9-JulyAugustSeptember .
.
October.November. .
.
December. .
.
1950-January ....
FebruaryMarch
April
2,9051,2873,1781,09kU,568
3,9853,7503,898
6,7766,106 y
335376378
361338336
863
1,176
1,310
659
137177217267358
k66
559661
7832,300
616262
63636k
67
6768
69
126
13013klkl
152
173222278
31k3k6
21*
2525
252525
25
2526
26
37717661
71l,lk6
869859
1,31k
2,03k
1,570
158175178
lkk
168I87
203
175217
lk3
1
6
31128280
2823023k8
2,620928
293029
292929
It80
818
917
37k
k5
303k
2550
677061
11172
7
5U6
66
5
6
6
6
6
7885
103151267
3232kk222
255277
192120
2122
25
2U
23
23
23
1.61
260233U28
1,57k
1,0731,23k
526
U25
387
26
3328
27212k
k2
kO
27
2k
-129-271-508
-1,6696U7
372367klk
287278
-36
25-11
1136
-2k
-6
9
23
1,809599
2,6831,276
160
38716
k6
-12
-5
2-2
-2
2-2
95190277-66
-28-12328
k6
1k
-70
19
13
Source: (Same as Table 1).l/ Excludes expenditures of Forslgn Economic Cooperation Trust Fund (all In
I9U9); see Table 1, footnote 1.
2/ See Table 2, footnote 2.
y Includes Adjusted Service Certificate Fund, District of Columbia, Indian
tribal funds, expenditures chargeable against increment on gold,
etc.
y Total Includes $35 million by Health Insurance Trust Fund underproposed legislation.
• Leas than $500,000.
10 Treasury Bulletin
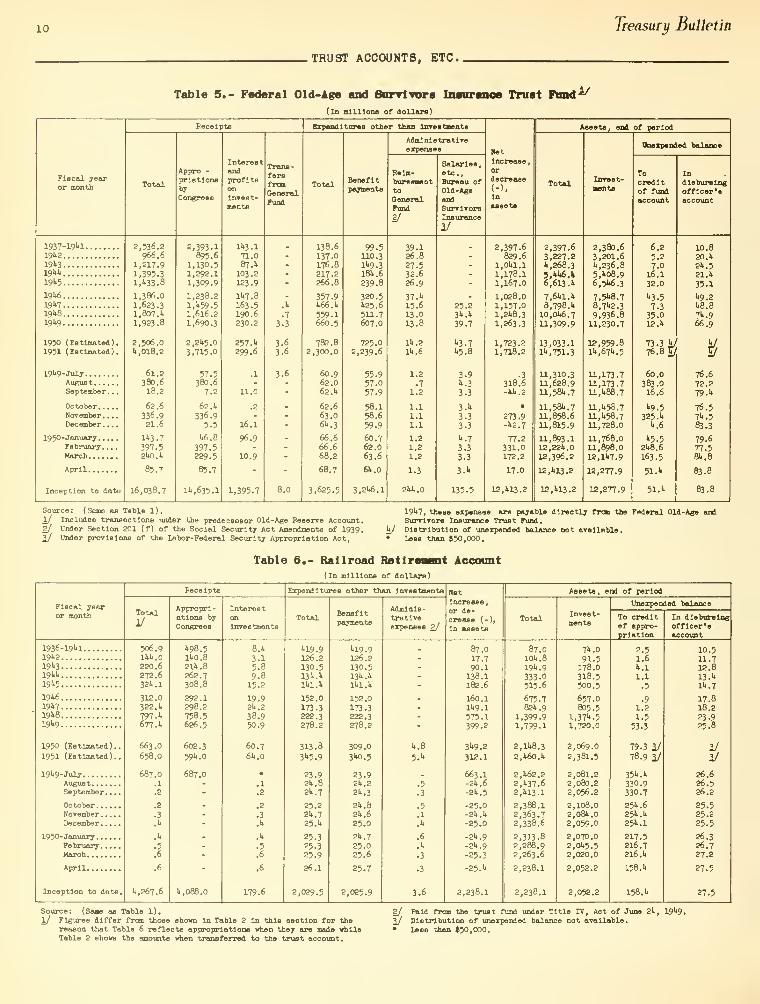
TRUST ACCOUNTS, ETC..
Table 5.- Federal Old-Age and Survivors Inaur
(In million* of dollars
)
Trust Pond 1/
Flecal yearor month
Fecelpts
Appro -
priatlons
Congress
InterestandprofitsonInvest-ments
Trans-fersfromGeneralFund
Expenditures other than lnTeetmente
Benefitpayments
Adminlstratlreeipeneee
Relm-bun»eoer.
toGeneralFund
2/
Salaries,etc. ,
Bureau ofOld-AgeandSurrlTorBInsurance
a/
BetIncrease
,
ordecrease
In
assets
Aeeete, and of period
TotalInvest-ment*
Unexpended balance
Tocreditof fundaccount
Indleburalngoffleer'
a
account
1937- 19*.1
19**2
19*i3
19>tli
19">5
191*6
19*»7
19**8
19**9
1950 (Estimated).
1951 (Estimated).
19^9-JulyAugustSeptember. .
.
OctoberNovember. . .
.
December. . .
.
I95O-JanuaryFebruary ....
March
April
Inception to date
2,536.2966.6
1,217.91,395.3
1A33.8
1,386.01,623.31,807. l>
1,923.8
2,506.0It, 018.
2
61.2380.618.2
62.6336.921.6
11*3.7
397.52ltO.lt
16,038.7
2,393.1895.6
1,130.51,292.11,309.9
1,238.21, It 59.
5
1,616.21,690.3
2,2ll5.0
3,715.0
57.5380.6
7.2
62. It
336.95.5
U6.8
397.5229.5
85.7
111,635.1
llt3.1
71.087 .U
103.2123.9
11*7.8
163.5190.6230.2
257.lt
299.6
.1
11.0
.2
16.1
96.9
10.9
1,395.7
.It
.7
3.3
3.63.6
3.6
138.6137.0176.8217.2266.8
357.9It66.lt
559.1660.5
782.82,300.0
60.962.062 .It
62.663.O61*.
3
66.666.668.2
68.7
3,625.5
99.5110.3H»9 .318U.6
239.8
320.5U25.6
511.7607.O
725.02,239.6
55.957.057.9
58.158.6
59.9
60.762.063.6
6U.0
3,21*6.1
39.126.8
27.532.626.9
37.1.
15.613.013.8
111 .2
lit .6
1.2
.7
1.2
1.11.11.1
1.21.21.2
1.3
2U4.0
25.23U.U
39.7
"•3.7
1*5-8
3.9k.3
3.3
3.1*
3.33.3
U.
7
3.3
3.3
3.1.
135.5
2,397.6829.6
l.Oltl.l
1,178.11,167.0
1,028.01,157.01,2U8.3
1,263.3
1,723.21,718.2
.3
318.6-W..2
273.9-1.2.7
77.2331.0172.2
17.0
12,1.13.2
2,397.63,227.2l>,268.3
5,W^.»6,613.1.
7,61.1. Ii
8,798.1.
10,01*6.7
11,309.9
13,033.1H.,751.3
11,310.311,628.911.58I..7
11,581..
7
11,858.611,815.9
11,893.112, 22k.
12,396.2
12,1.13.2
12,1.13.2
2,380.63,201.6".,236.8
5,"t08.9
6,5**6.3
7,51*8.7
8,71.2.3
9,936.811,230.7
12,959.8H..671..5
11,173.711,173.711,1.88.7
11,1.58.7
11,1.58.7
11,728.0
11, 768.O11, 898.O12,11.7.9
12,277.9
12,277.9
6.25.27.016.1
32.0
1.3.5
7.335.012.1.
73.3 "t/
76.8 y
60.0383.016.6
"•9.5
325.1.
».6
k5.521*8.6
163.5
51.1.
51.li
10.820.1.
21..
5
21.
U
35.1
U9.21*8.8
7**.
9
66.9
y76.672.279. ">
76.57"..
5
83.3
79.677.58».8
83.8
83.8
Source: (Same as Table 1).
1/ Includes transactions under the predecessor Old -Age Reserve Account.2/ Under Section 201 (f) of the Social Security Act Amendments of 1939.3_/ Under provisions of ths Labor-Federal Security Appropriation Act,
191.7, these expenses are payable directly from the Federal Old-AgeSurvlTora Insurance Trust Fund.
hj Distribution of unexpended balance not available.• Less than $50,000.
Table 6.- Railroad Retirement Account(In millions of dollars)
Flecal yearor month
Receipts
Total
1/
Appropri-ations byCongress Investments
Expenditures other than Investments
Benefitpayments
Adminis-trativeexpenses 2/
Netincrease
,
or de-crease (-),
in assets
Assets, end of period
Invest-ments
Unexpended balance
To creditof appro-
priation
In dleburalngofflcer'aaccount
I936-19I1119>t2
19"*3
19W19"t5
19lt6
191.7
19W19"t9
1950 (Estimated).
1951 (Estimated).
191.9-JulyAugustSeptember. .
.
OctoberNovember ....
December. . .
.
1950-JanuaryFebruary . . .
.
March
April
Inception to date.
506.91U.0220.6272.632lt.l
312.0322.lt
797.1*
677.lt
663.0
658.0
687.0.1
.2
.2
.3
.U
.it
.5
.6
It,267.6
1*98.5
HO. 8211*.8262.7308.8
292.1298.2758.5626.5
602.3
59*1.0
687.0
it,088.0
8.1.
3.15.89.815.2
19.921*. 2
38.950.9
60.76lt.o
.1
.2
.2
.3
.It
.it
.5
.6
.6
179.6
1*19.9
126.2
130.513lt.lt
lltl.lt
152.0
173.3222.3278.2
313.83lt5.9
23.921*.
8
21*.
7
25.221*.
7
25. It
25.325.325.9
26.1
2,029.5
1*19.9
126.2130.513I1.I1
1U1.U
152.0173.3222.3278.2
309.0
3k0.5
23.92I1.2
2*..
3
21*.
8
2U.6
25.0
2b.
7
25.025.6
25.7
2,025.9
U.8
5.1.
.5
.3
.5
.1
.It
.6
.!>
.3
3.6
87.017.790.1138.1182.6
160.111.9.1
575.1399.2
3U9.2
312.1
663.1-21*.
6
-21*. 5
-25.0-2lt.il
-25.0
-2lt.9
-2*1.9
-25.3
-25.lt
2,238.1
87.0101..8I9I1.9
333.0515.6
675.782 It.
9
1,399.91,799.1
2,11.8.3
2,lt6o.l*
2,1*62.22,ii37.6
2,1.13.1
2,388.12,363.72,338.6
2,313.82,288.92,263.6
2,238.1
2,238.1
7*1.0
91.5178.0318.5500.5
657.0805.5
1,37*1.5
1,720.0
2,069.0
2,381.5
2,081.22,080.22,056.2
2,108.02,08U.O
2,059.0
2,070.02,01.5.5
2,020.0
2,052.2
2,052.2
2.51.6k.l1.1
79.3 1/78.9 37
35**.*.
330.9330.7
251*.
6
25I1.I1
251..
1
217.5216.7216.
U
158.1.
158.1.
10.511.712.813.1.
Ik.
7
17.818.223.925.8
1/
1/
26.626.526.2
25.525.225.5
26.326.727.2
27.5
27.5
Source: (Same aa Table 1).1/ Figures differ from those shovn In Table 2 In thle eection for the
reason that Table 6 reflects appropriatlona vhen they are made vhileTable 2 shows the amounts vhen transferred to the trust account.
2/ Paid from the trust fund under Title IV, Act of June 2**, 19U9.
3_/ Distribution of unexpended balance not available.• Less than $50,000.

Jane 1950 11
TRUST ACCOUNTS, ETC..
Table 7.- Unemployment Trust Fund
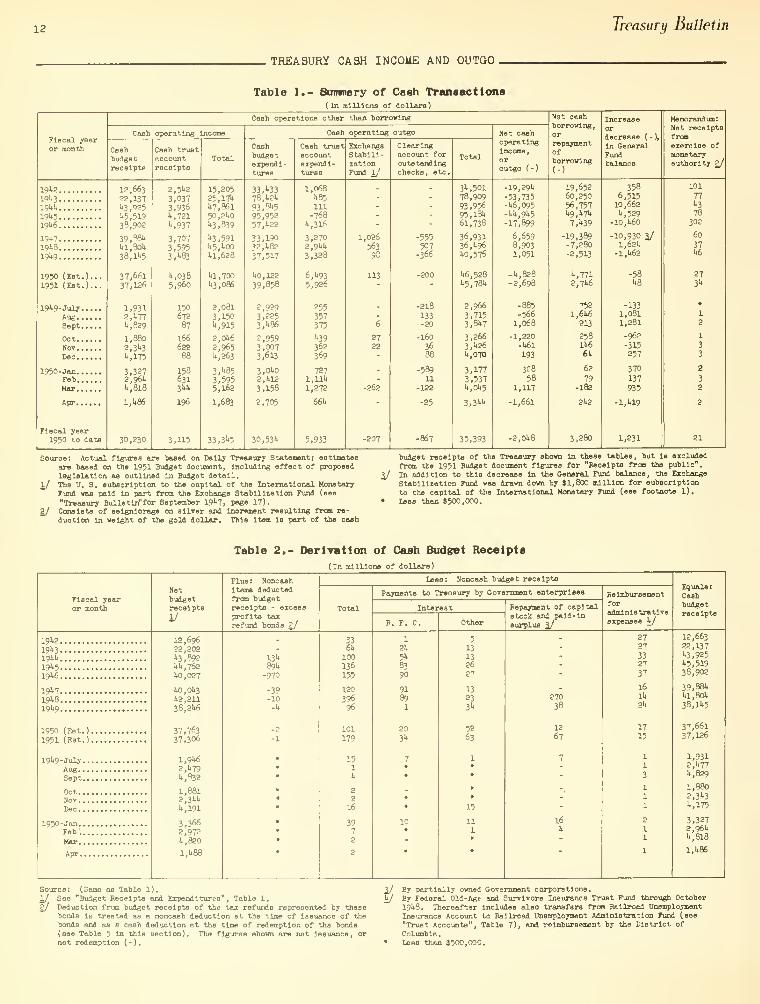
12 Treasury Bulletin
TREASURY CASH INCOME AND OUTGO
,
Table 1.- Summary of Cash Transact Ions
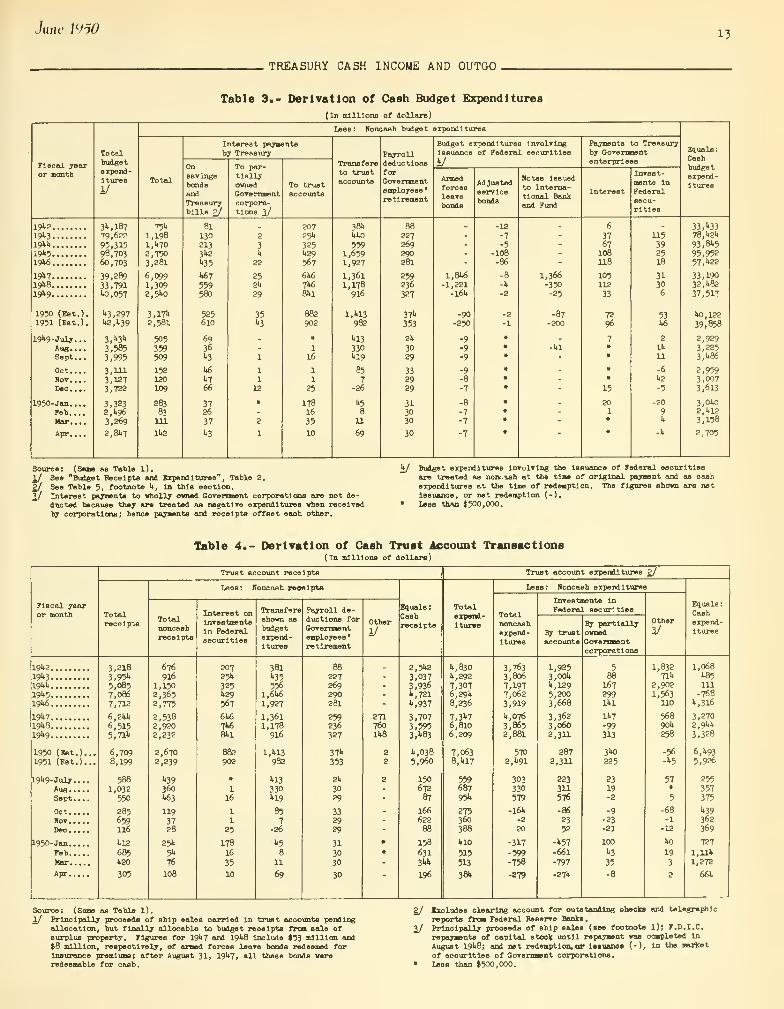
June mo 13
TREASURY CASH INCOME AND OUTGO,
Table 3.- Derivation of Cash Budget Expenditures

Ik Treasury Bulletin
TREASURY CASH INCOME AND OUTGO.
Table 5.- Derivation of Cash Borrowing or Repayment of Borrowing(In millions of dollars)
Fiscal yearor month
June WO 15
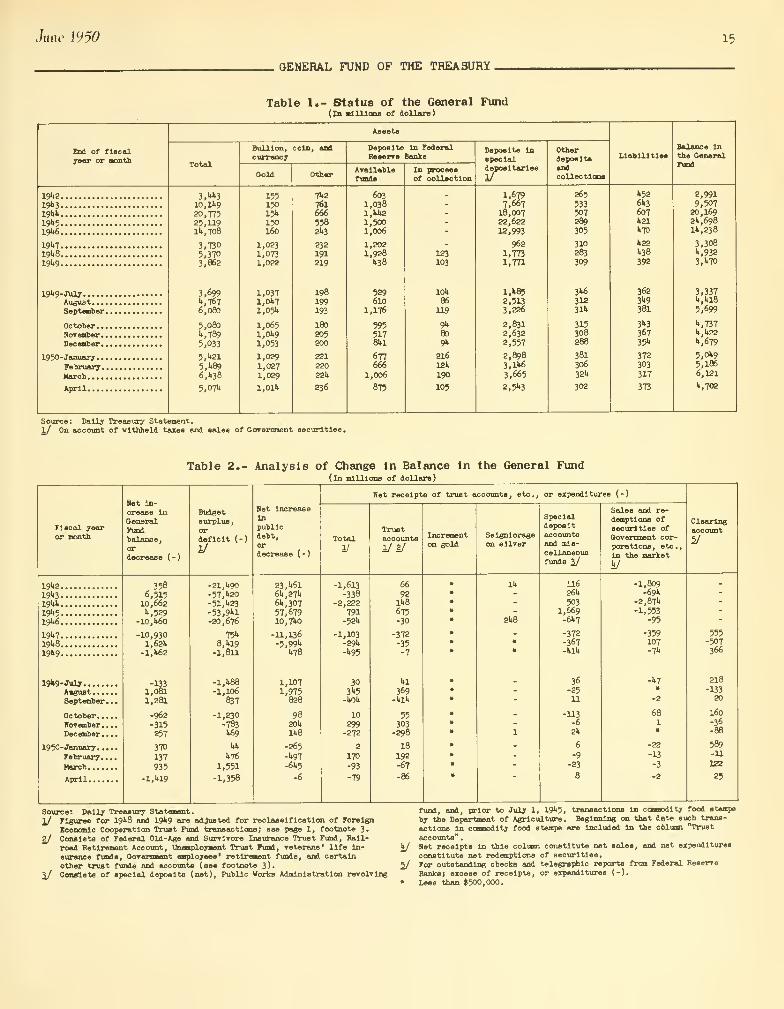
GENERAL FUND OF THE TREASURY.
Table 1.- Status of the General Fund(In millions of dollars)
End of flsoalyear or month
Bullion, coin, andcurrency
Other
Deposits In FederalReserre Banks
Availablefunds
In processof collection
Deposits inspecialdepositaries
Otherdeposits
collections
LiabilitiesBalance inthe Generalfund
19"»2
19»319W>19>>5
19U6
19»719>t8
19"»9
19U9-JulyAugust . . .
.
September,
October...November.
,
December.
.
1950-January...
February.Maroh
April
3,W>310,lli9
20,77525,119lit,708
3,7305,3703,862
3,699".,767
6,080
5,080>*,789
5,033
5.U21
5,»896,1.38
5,07lt
15515015*150160
1,0231,0731,022
1,0371.0V71,05k
1,0651,01.9
1,053
1,029
1,0271,029
1,01*
7U2
761666
5582U3
232191219
198199193
180205200
22122022U
236
6031,0381,1*2
1,5001,006
1,2021,928»38
529610
1,176
5955178U1
677666
1,006
875
123103
10U86
119
9»809k
21612k
190
105
1,6797,667
18,00722,62212,993
9621,7731,771
1.W52,5133,226
2,8312,6322,557
2,8983,1U6
3,665
2,5>>3
265
533507289305
310283309
31*6
3123H
315308288
38130632k
302
"•52
6»3607»21llTO
»22U38
392
3623k9381
3»3
36735>>
372303
317
373
2,9919,507
20,1692k,698Ik, 238
3,308•,9323,"»70
3,337k,kl8
5,699
"•,737
k,k22k,679
5,OU9
5,1866,121
ll, 702
Sourcs: Dally Treasury Statement.
1/ On account of withheld taxes and sales of Govsrament securities.

16 Treasury Bulletin
DEBT OUTSTANDING,
Table 1.- Summary of Federal Securities
(In millions of dollars)
End offiscalyear ormonth
Total outstanding
Publicdebt
Guaran-teedsecuri-ties
Interest-bearing debt
Publicdebt
Guaran-teedsecuri-ties
1/
Matured debt and debt bearing no interest
Public debt
Inter-nationalBank
MonetaryFund
Other
2/
Guaran-tesd
securi-ties 1/(matured)
19k2
19*319kk
19>>5
19k6
19U719k8
1W1950 ( Estimated)
1951 (Estimated)
Debt peak.Fsb. 19k6
19k9-JulyAugustSeptember.
.
October. ..
.
November. .
.
December..
.
1950-January. . .
.
February...March
April
76,991lliO,796
202,626259,115269,898
258,376252,366252,798
258,li39
263,81*
279, 76k
253,902255,879256,709
256,805257,011257,160
256,892256,395255,7li7
255, 7M>
72,ll22
136,696201,003258,682269,ll22
258,286252,292252,770
258,1100
263,800
279,21''
253,877255,852256,680
256,778256,982257,130
256,865256,368255,72"!
255,718
»,568k,100
1,623k33It76
907327
39kk
551
26
2729
232930
27272lt
76,517139,1*72
201,059256,766268,578
255,197250,132250,785
n.a.n.a.
278,li51
251,903253,91*5
25!*,783
2511,901
255,150255,0116
25"*, 89325k, 1*30
253,527
253,536
71,968135,380199,5">3
256,357268,111
255,113250,063250,762
n.a.n.a.
277,912
251,880253,92125">,756
2511,876255,12li
255,019
2511,869
25li,l*06
253,506
253,516
It, 5U9*>,092
1,516k091*67
83
692k
539
222k26
2526
27
Si*
2k21
19
k7k1,321*
1,5672,3501,321
3,1792,23l»
2,012
1,313
2,0001,931*
1,926
1,901*
1,8612,111*
1,999
1,9652,220
2,201*
1*51*
1,3161,1*60
2,3261,311
3,1732,2292,009
1,301
1,9961,9311,923
1,9011,8582,111
1,997
1,9622,218
2,202
9811*1
201269376
2312802l»5
n.a.n.a.
238
237218221
2292111*67
356
325321*
310
1*16
661.1
n.a.n.a.
1*1
1,72"*
1,1611,063
n.a.n.a.
1,0631,0631,057
1,0301,0081,008
1,008
1,008
1,270
1,270
3561,1751,2592,057
935
802722660
n.a.n.a.
1,063
65565061*5
61*2
639636
632
62962U
621
208
1072k
10
6
5
3
Source: Actual figures from Dally Treasury Statement; estimates baaed on
1951 Budget document, Including effect of proposed legislation.
Footnotes at end of Table 2.
Table 2.- Net Change In Federal Securities
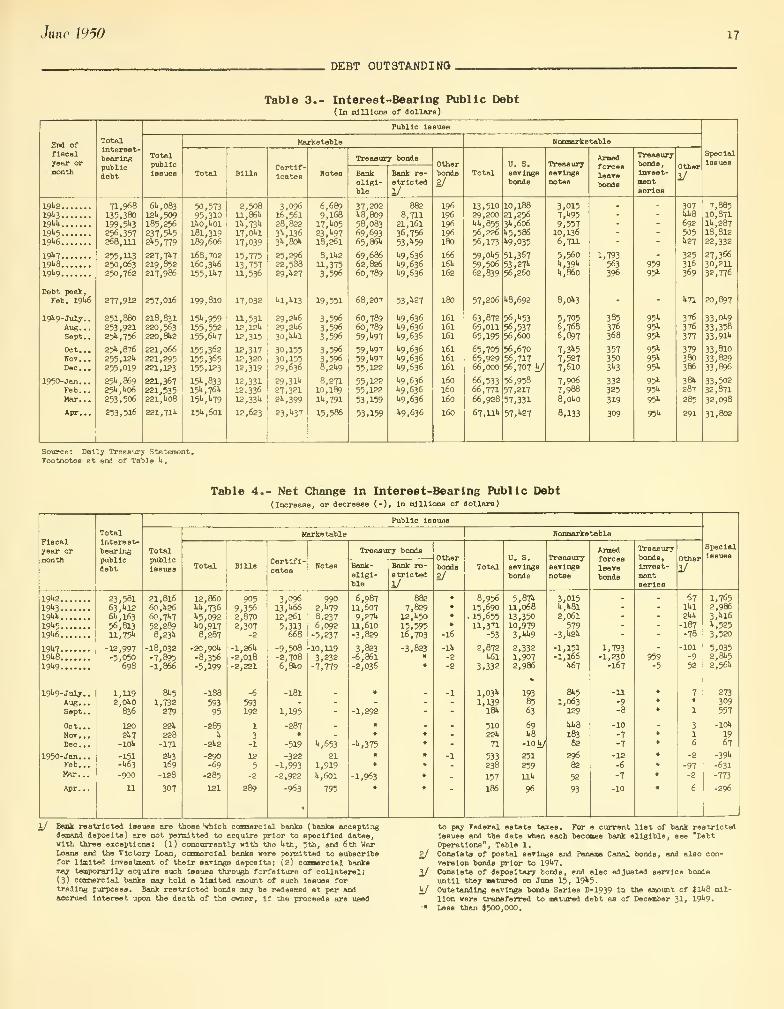
June 1V50 17
DEBT OUTSTANDING
.
Table 3.- Interest-Bearing Public Debt
IS Treasury Bulletin
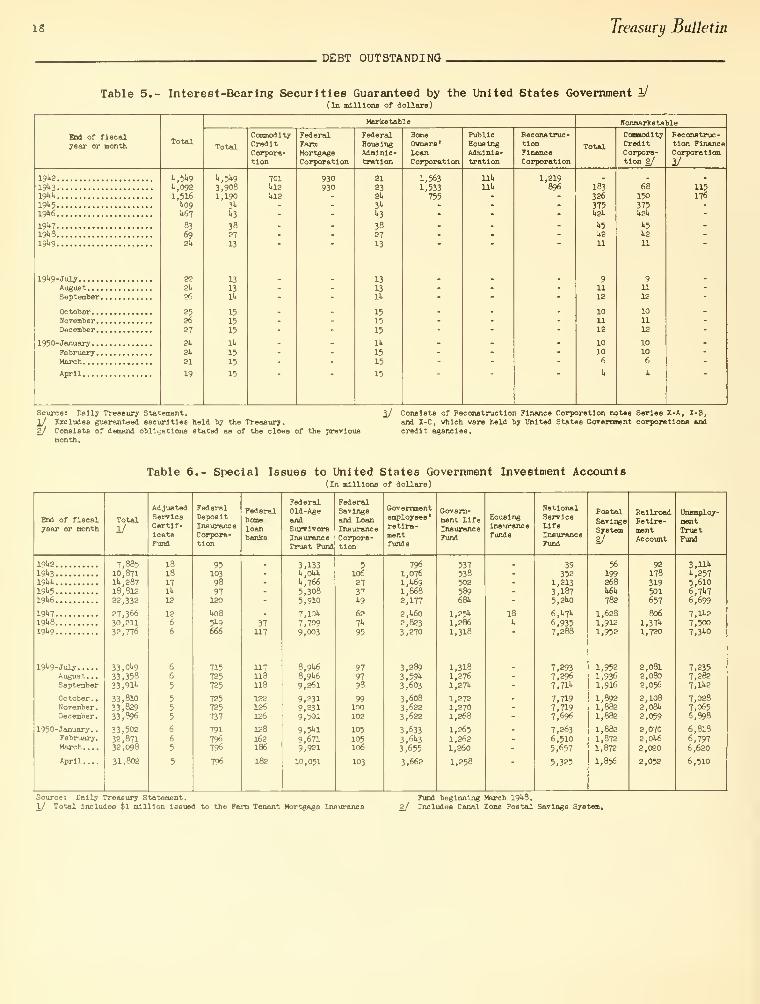
DEBT OUTSTANDING.
Table 5.- Interest-Bearing Securities Guaranteed by the United States Government 1/
(In millions of dollars)
End of fiscalyear or month
Marketable
CommodityCreditCorpora-tion
FederalFarmMortgageCorporation
FederalBousingAdminis-tration
HomeOwners*LoanCorporation
PublicHousingAdminis-tration
Reconstruc-tionFinanceCorporation
Nonmarlre table
CommodityCreditCorpora-tion 2/
Reconstruc-tion FinanceCorporation
U.
19U2,
191*3 ,
19W191*5
,
19W
19**7
I9U819**9
191.9-JulyAugust . . .
,
September
.
October. .
.
November .
.
December.
.
1950-January . .
.
February .
,
March
April
U,5l»9
U,092
1,516W>9U67
83
69Sk
2221*
26
2526
27
2U
2U21
19
**,5"*9
3,9081,190
3*1*3
3827
13
13
131U
15
1515
11*
1515
15
7011*12
1*12
930930
21
2321*
3"*
**3
382713
1313lit
1515
15
li»
1515
15
1,5631,533
755
111*
11U1,219
896 183
326
3751»2U
U5U2
11
1112
10
1112
1010
6
68150
375U2U
1*5
U2
11
911
12
10
1112
10106
115176
Source: Dally Treasury Statement.
1/ Excludes guaranteed securities held by the Treasury.2/ Consists of demand obligations stated as of the close of the previous
month.
3/ Consists of Reconstruction Finance Corporation notes Series X-A, J.-B,
and X-C, which were held by United States Government corporations andcredit agencies
.
Table 6.- Special Issues to United States Government Investment Accounts(In millions of dollars)
End of fiscalyear or month
June J-V50 19
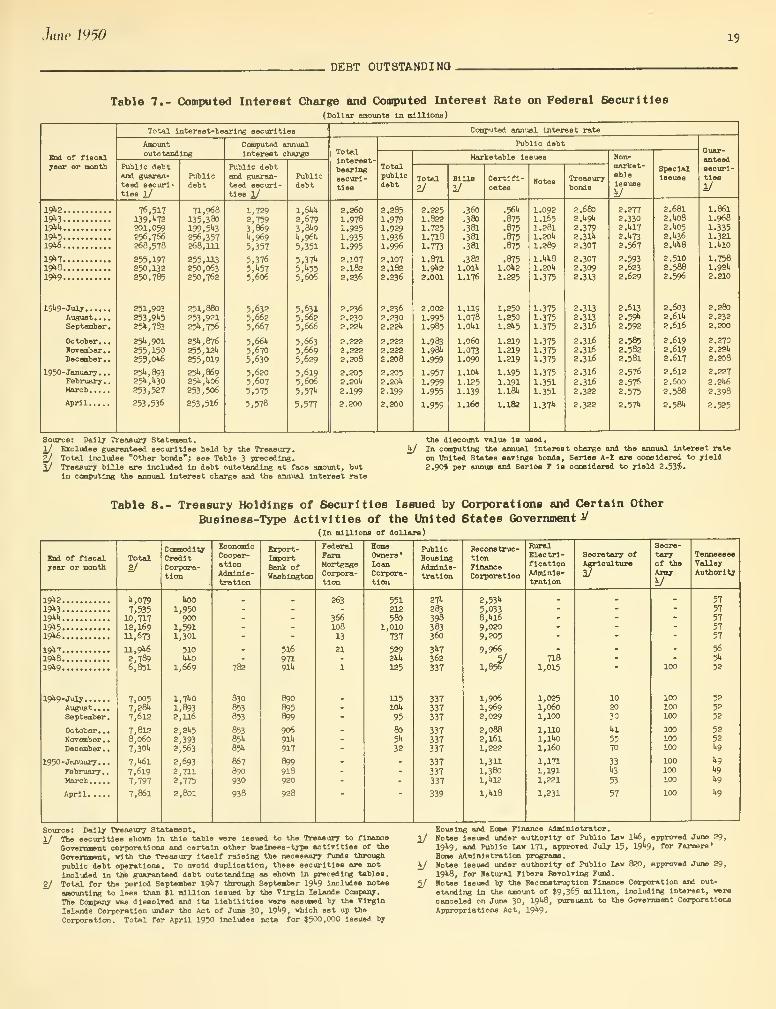
DEBT OUTSTANDING.
Table 7.- Computed Interest Charge and Computed Interest Rate on Federal Securities
(Dollar amounts In millions)
End of fiscalyear or month
Total Interest-bearing securities
Amountoutstanding
Public debtand guaran-teed securi-ties 1/
Publicdebt
Computed annualInterest charge
Public debtwn^ guaran-teed securi-ties 1/
Publicdebt
Computed annual interest rate
TotalInterest-bearingsecuri-ties
Public debt
Totalpublicdebt
Marketable Issues
Total
2/
Bills
UCertifi-cates
Treasurybonds
Bon-market-ableIssues
y
Specialissues
Guar-anteedsecuri-tiesi/
19k2.
19*3
.
19kk.
19*5.19k6.
19>>7.
19k8.19li9.
19119-julyAugust. .
.
September
October,
.
Rotember.December.
1950-January..February.March....
April.
76,517139, k72201,059256,766868,578
255,197250,132250,785
251,903253,91*5
25»,783
25k,901
255,150255,Ok6
25k, 89325U.U30
253,527
253,536
71,968135,380199, 5k3
256,357268,101
255,U3250,063250,762
251,880253,92125>>,756
2511,876
255,12k
255,019
2511,86925k, ko6
253,506
253,516
1,7292,7593,869"1,969
5,357
5,3765,>t57
5,6o6
5,6325,6625,667
5,661.
5,6705,630
5,6205,6075,575
5,578
1,61.14
2,6793,81.9
k,96k
5,351
5,37b
5A555,606
5,6315,6625,666
5,6635,6695,629
5,6195,6065,571.
5,577
2.2601.9781.9251.9351.995
2.1072.1822.236
2.2362.2302.221.
2.2222.2222.208
2.2052.20U2.199
2.200
2.285
1.9791.9291.9361.996
2.1072.1822.236
2.2362.2302.22k
2.2222.222£.208
2.2052.201.
2.199
2.200
2.2251.822
1.7251.7181.773
1.8711.9*22.001
2.0021.9951.985
1.9831.98k
1.959
1.9571.9591.955
1.959
.360
.380
.381
.381
.381
.3821.01k
1.176
1.1191.0781.01.1
1.060
1.0731.090
1.10k
1.1251.139
1.169
.56k
.875
.875
.875
.875
.8751.0U2
1.225
1.2501.2501.2U5
1.2191.2191.219
1.1951.1911.181.
1.182
I.092I.1651.2811.80 1.
1.289
1.1.1.8
1.201.
1.375
1.3751.3751.375
1.3751.3751.375
1.375
1.3511.351
1.37*
2.6802.lt°A
2.3792.31k2.307
2.3072.3092.313
2.3132.3132.316
2.3162.3162.316
2.316
2.3162.322
2.322
2.2772.3302.U17
2.VF32.567
2.5932.6232.629
2.6132.59k
2.592
2.5852.5822.581
2.576
2.5762.575
2.57k
2.6812.ko82.k052.k362.kk8
2.5102.5882.596
2.6032.6lk2.616
2.6192.6192.617
2.612
2.600
2.588
2.58k
1.8611.9681.3351.321l.klO
1.7581.92k2.210
2.2802.2322.200
2.2702.22k2.208
2.227
2.2k6
2.398
2.525
Source: Dally Treasury Statement.1/ Excludes guaranteed securities held by the Treasury.2/ Total Includes "Other bonds"; see Table 3 preceding.
\J Treasury bills are Included In debt outstanding at face amount, butIn computing the annual Interest charge and the annual Interest rate
the discount value ie ueed.k/ In computing the wnniiftl Interest charge and the annual Interest rate
on United states savings bonds, Serlee A-E are considered to yield
2.90^ per annum and Serlee F Is considered to yield 2.53$.
Table 8.- Treasury Holdings of Securities Issued by Corporations and Certain Other
Business-Type Activities of the United States Government ^(In mlUlons of dollars)
End of fiscalyear or month
20 Treasury Bulletin
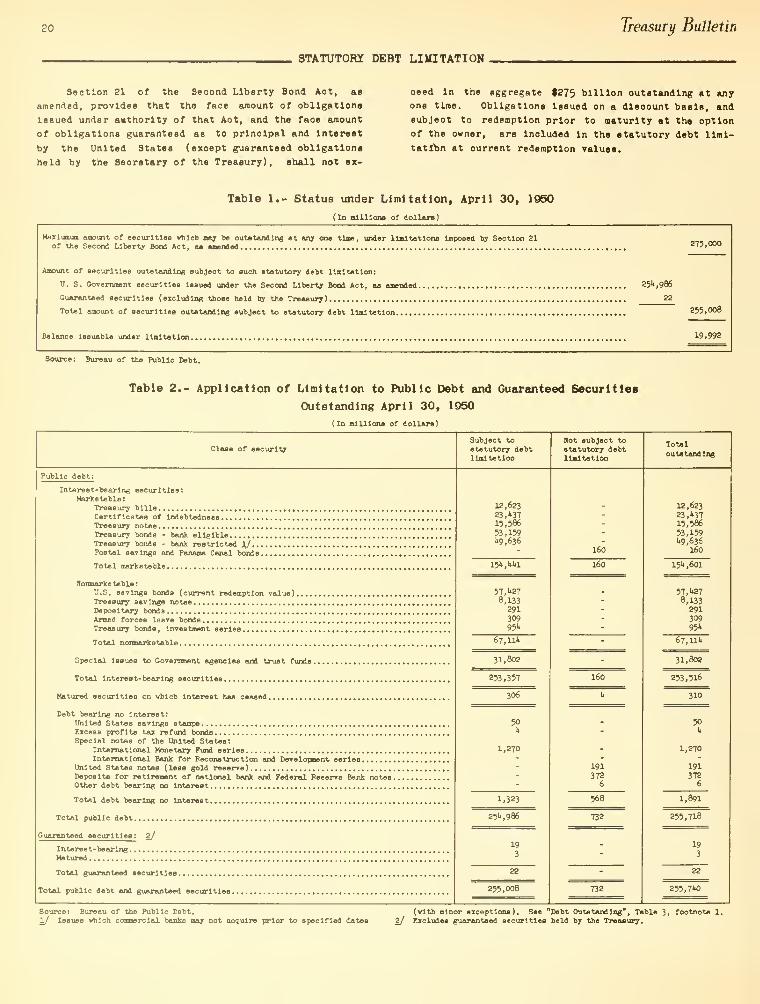
STATUTORY DEBT LIMITATION
Section 21 of the Seoond Liberty Bond Aot, as
amended, provides that the face amount of obligations
Issued under authority of that Aot, and the faoe amount
of obligations guaranteed as to principal and Interest
by the United States (exoept guaranteed obligations
held by the Seoretary of the Treasury), shall not ex-
oeed In the aggregate |275 billion outstanding at anyone time. Obligations Issued on a dlsoount basis, and
subjeot to redemption prior to maturity at the option
of the owner, are Included In the statutory debt limi-
tation at current redemption values.
Table 1.- Status under Limitation, April 30, 1950
(la millions of dollars)
Mnxlumum amount of securities which may be outstanding at any one time, under limitations Imposed by Section 21of the Second Liberty Bond Act, as amended
Amount of securities outstanding subject to such statutory debt limitation:
U. S. Government securities Issued under the Second Liberty Bond Act, as amended 25k, 986
Guaranteed securities (excluding those held by the Treasury) 22
Total amount of securities outstanding subject to statutory debt limitation
Balance Issuable under limitation
Source: Bureau of the Public Debt.
275,000
255,008
19,992
Table 2.- Application of Limitation to Public Debt and Guaranteed Securities
Outstanding April 30, 1950
[In millions of dollars)
Class of security
June mO 21
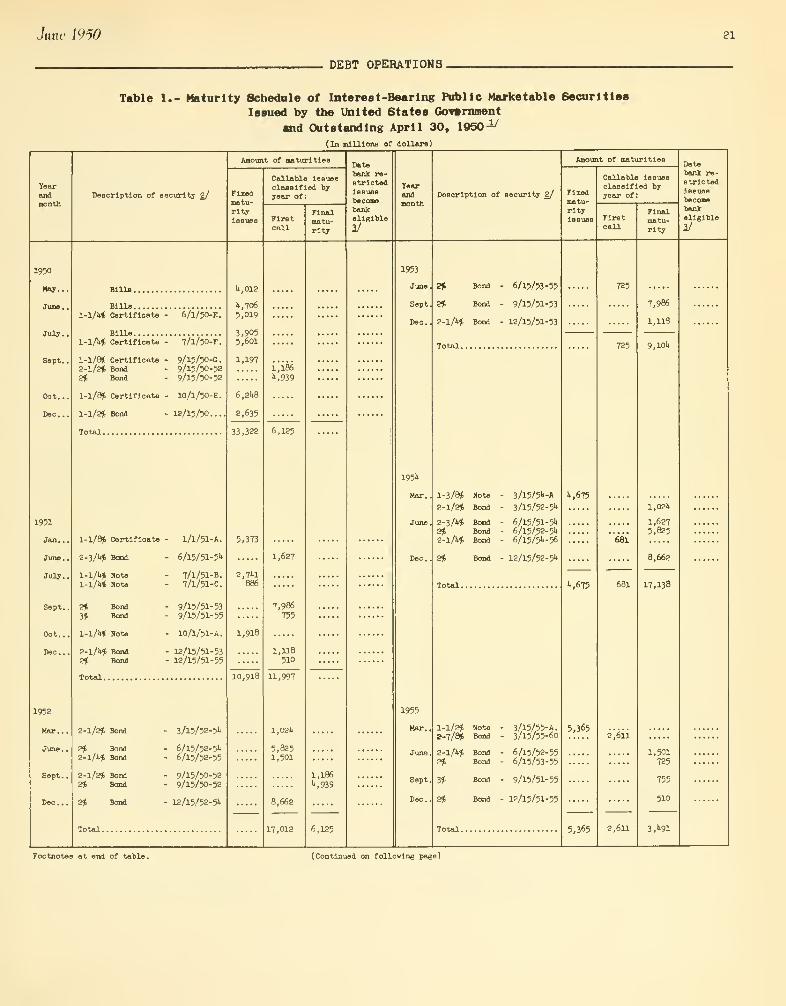
DEBT OPERATIONS.
Table 1.- Maturity Schedule of Interest-Bearing Public Marketable Securities
Issued by the United States Government
and Outstanding April 30, 1950^(In millions of dollars)
Yearandmonth
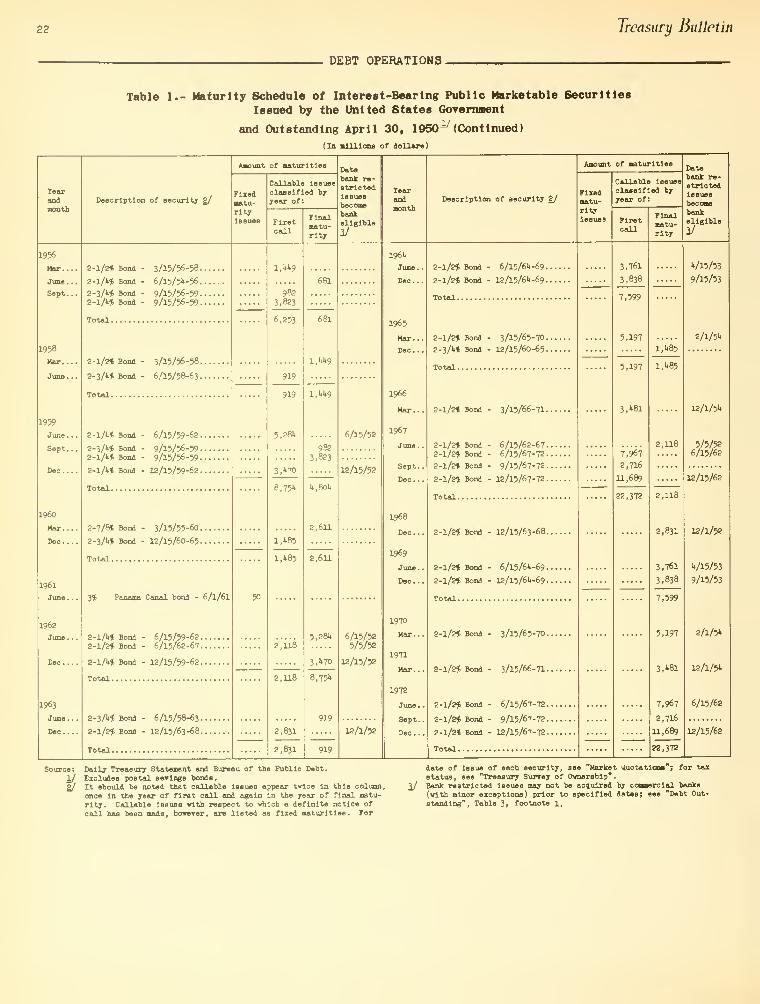
22 Treasury Bulletin
DEBT OPERATIONS.
Table 1.- Maturity Schedule of Interest-Bearing Public Marketable Securities
Issued by the United States Government
and Outstanding April 30, 1950y (Continued)
(In millions of dollars')
Tearand
monthDescription of security 2/
Amount of maturities
Fixedmatu-rityIssues
Callable Issuesclassified byyear of:
Firstcall
Finalmatu-rity
Datebank re-strictedIssuesbecomebankeligible
if
Tear
monthDescription of security 2/
Amount of maturities
Fixedmatu-rityissues
Callable lBsuesclassified by
year of:
Firstcall
Finalmatu-rity
Datebank re-strictedIssues
becomebankeligible
1/
1956
Mar...
June.
.
Sept .
.
1958
Mar..
June.
1959
June
.
Sept.
Dec.
.
I960
Mar.
Dec.
1961
June.
1962
.Tim* ,
1963
June .
.
Dec . .
.
2-1/2* Bond - 3/15/56-58
2-1/1** Bond - 6/15/5I1-56
2-3A* Bond - 9/15/56-592-l/lt* Bond - 9/15/56-59
Total
2-1/2* Bond - 3/15/56-58
2-3A* Bond - 6/15/58-63
2-l/lt* Bond - 6/15/59-62.
2-3A* Bond - 9/15/56-59-2-l/U* Bond - 9/15/56-59.
2-1A* Bond - 12/15/59-62.
Total.
2-7/8* Bond
2-3/U* Bond
3/15/55-60...
12/15/60-65...
3* Panama Canal bond - 6/1/61
2-l/U* Bond -
2-1/2* Bond -
2-1A* Bond
Total
6/15/59-626/15/62-67
12/15/59-62
2-3A* Bond - 6/15/58-63.
2-1/2* Bond - 12/15/63-68.
Total.
50
1,1*1*9
9823,823
6,253
919
919
5,28k
3,1*70
8,75''
1,1*85
1,1*85
2,118
2,118
2,831
2,831
681
681
1,1*1*9
1,1*1*9
9823,823
,801*
2,611
2,611
5,281*
3,1»70
8,751*
919
919
6/15/52
12/15/52
6/15/525/5/52
12/15/52
12/1/52
196U
June.
Dec . .
1965
Mar..
Dec .
.
1966
Mar..
1967
June.
Sept.
Dec.
.
1968
Dec.
1969
June.
Dec.
.
1970
Mar...
1971
Mar...
1972
June.
Sept .
.
Dec . .
.
2-1/2* Bond
2-1/2* Bond
6/I5/6U-69.
12/15M-69
.
2-1/2* Bond
2- 3A* Bond
3/15/65-70.
I2/I5/6O-65.
2-1/2* Bond - 3/15/66-71.
2-1/2* Bond - 6/15/62-67.2-1/2* Bond - 6/15/67-72.
2-1/2* Bond - 9/15/67-72.
2-1/2* Bond - 12/15/67-72.
Total.
2-1/2* Bond - 12/15/63-68.
2-1/2* Bond
2-1/2* Bond
6/15M-69.12/15/6U-69
.
2-1/2* Bond - 3/15/65-70.
2-1/2* Bond - 3/15/66-71.
2-1/2* Bond - 6/15/67-72.
2-1/2* Bond - 9/15/67-72.
2-1/2* Bond - 12/15/67-72
•
Total
3,761
3.838
7,599
5,197
5,197
3,1*81
7,967
2,716
11,689
22,372
1,1*85
l.l<85
2,118
2,118
2,831
3,761
3,838
7,599
5,197
3,1*81
7,967
2,716
11,689
22,372
>*/l5/53
9/15/53
2/1/51*
12/1/51*
5/5/526/15/62
12/15/62
12/1/52
t/15/53
9/15/53
2/1/5"*
12/1/5**
6/15/62
12/15/62
Source: Dally Treasury Statement and Bureau of the Public Debt.
1/ Excludes postal savings bonds.
2/ It should be noted that callable issues appear twice in this column,
once in the year of first call and again in ths year of final matu-
rity. Callable Issues with respect to which a definite notice of
call has been made, however, are listed as fixed maturities. For
date of issue of each security, Bee "Market quotations ; for tax
status, see "Treasury Survey of Ownership"
.
3_/ Bank restricted Issusb may not be acquired by commercial banks
(with minor exceptions) prior to specified dates; see "Debt Out-
standing", Table 3* footnote 1.
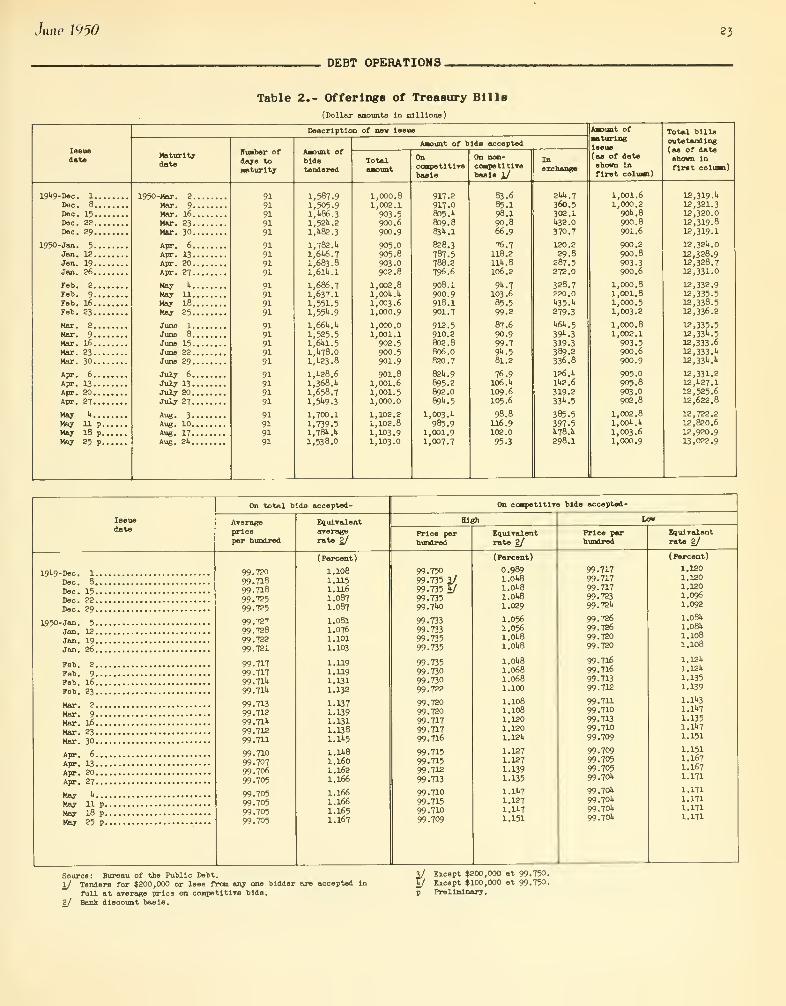
Jane 1V50 23
DEBT OPERATIONS.
Table 2.- Offerings of Treasury Bills
2h Treasury Bulletin
DEBT OPERATIONS.
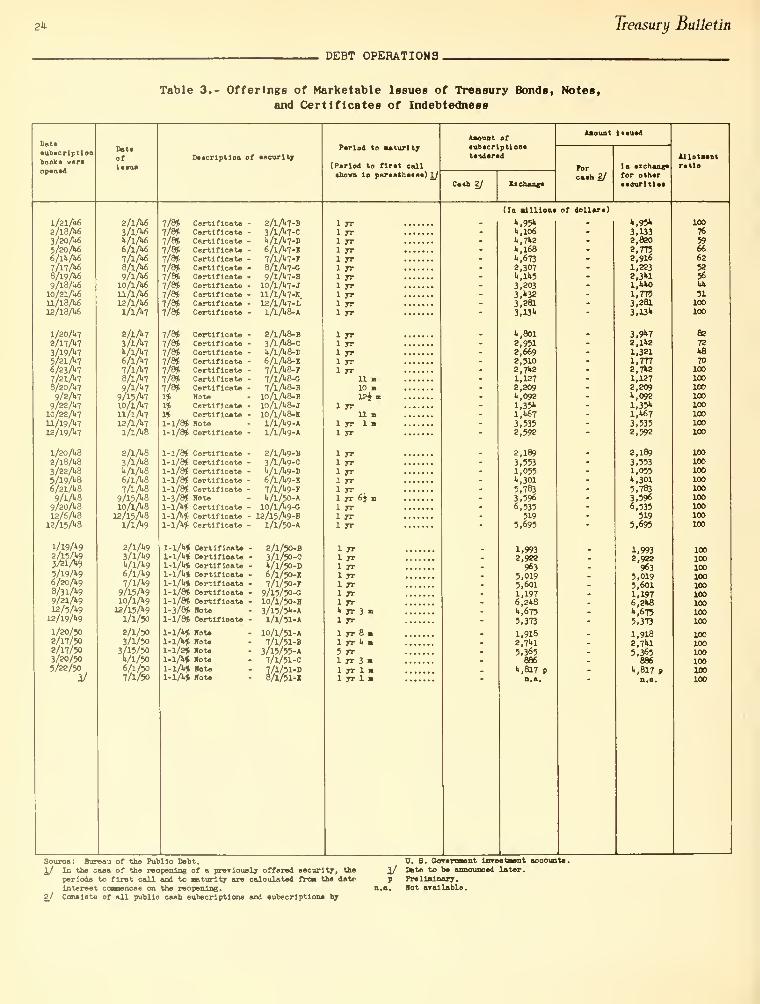
Table 3.- Offerings of Marketable Issues of Treasury Bonds, Notes,
and Certificates of Indebtedness

June 1950 25
DEBT OPERATIONS,
Table 4.- Disposition of Matured Marketable Issues of Treasury Bonds, Notes, and Certificates
of Indebtedness and Securities Guaranteed by the United States Government
26 Treasury Bulletin
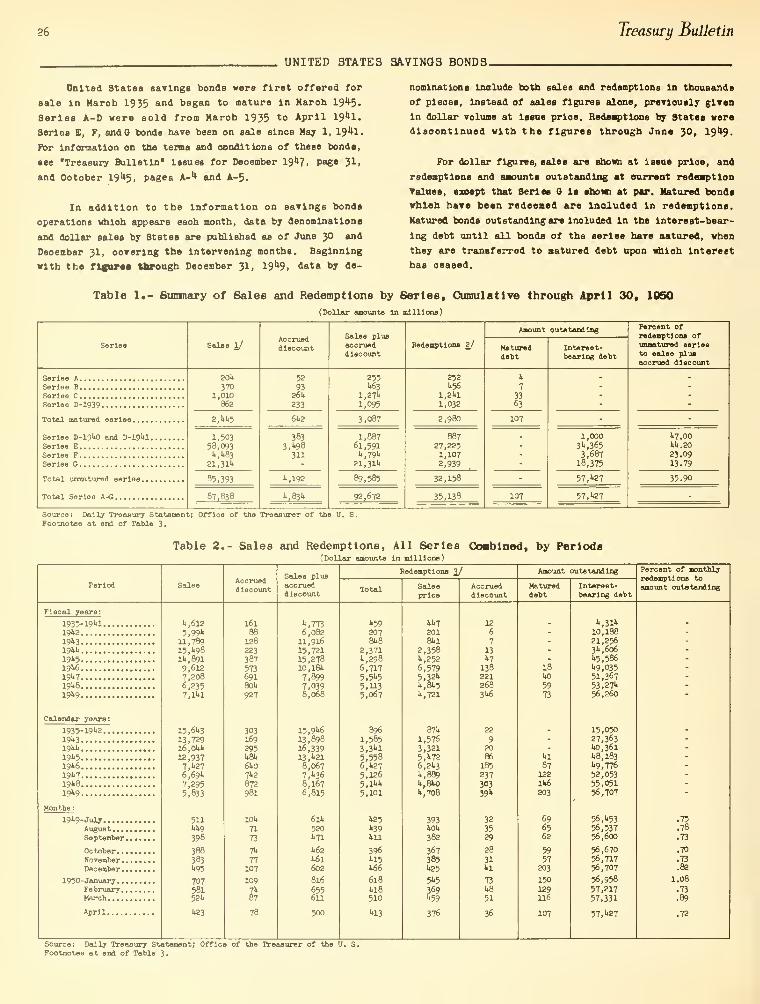
UNITED STATES SAVINGS BONDS.
United States savings bonds were first offered for
sale In Marob 1935 *nd began to mature In Haroh 19^5.
Series A-D were sold from Maroh 1935 to April I9M.
Series E, F, and bonds have been on sale since Hay 1, 19^1
.
For Information on the terms and oendltlons of these bonds,
see "Treasury Bulletin" Issues for Deoember 19^7, page ")!,
and Ootober ^"l^, pages A- 1* and A-5.
In addition to the Information on savings bonds
operations whloh appears eaoh month, data by denominations
and dollar sales by States are published as of June 3° and
Deoember 31, ooverlng the Intervening months. Beginning
with the figures through Deoember 31, 19*19, data by de-
nominations Include both sales and redemptions in thousands
of pieces, Instead of sales figures alone, previously given
In dollar volume at Issue prloe. Redemptions by States were
discontinued with the figures through June 30, 1949.
For dollar figures, sales are shown at Issue prloe, and
redemptions and amounts outstanding at current redemption
Values, except that Series G is shown at par. Matured bonds
whloh have been redeemed are Included In redemptions.
Matured bonds outstanding are Included In the Interest-bear-
ing debt until all bonds of the series have matured, when
they are transferred to matured debt upon whloh Interest
has oeased.
Table 1.- Summary of Sales and Redemptions by Series, Cumulative through April 30, 1050
f Dollar amounts In millions)
Series

June mO 27
UNITED STATES SAVINGS BONDS.
Table 3.- Sales and Redemptions of Series A-D, E, F, and G by Periods
(Dollar amounts In millions)
Period
2g Treasury Bulletin
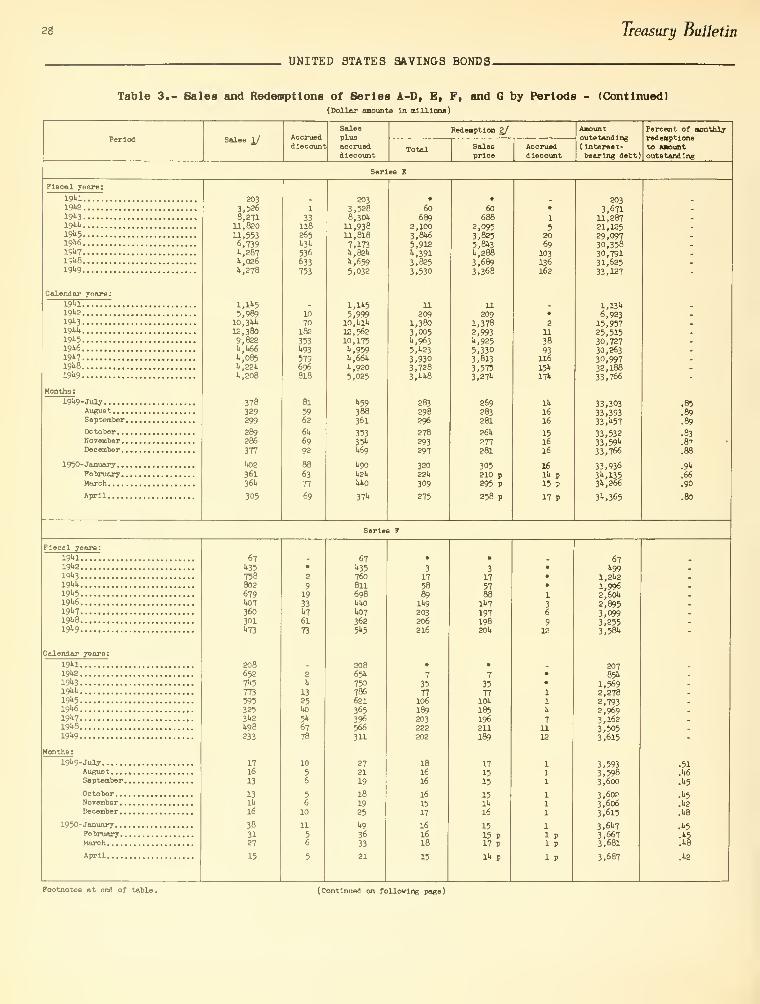
UNITED STATES SAVINGS BONDS.
Table 3.- Sales and Redemptions of Series A-D, E, F, and G by Periods - (Continued)(Dollar amounts in millions)
Period

nine mo 29
UNITED STATES SAVINGS BONDS.
Table 3.- Sales and Redemptions of Series A-D, E, F, and G by Periods - (Continued)
30 Treasury Bulletin
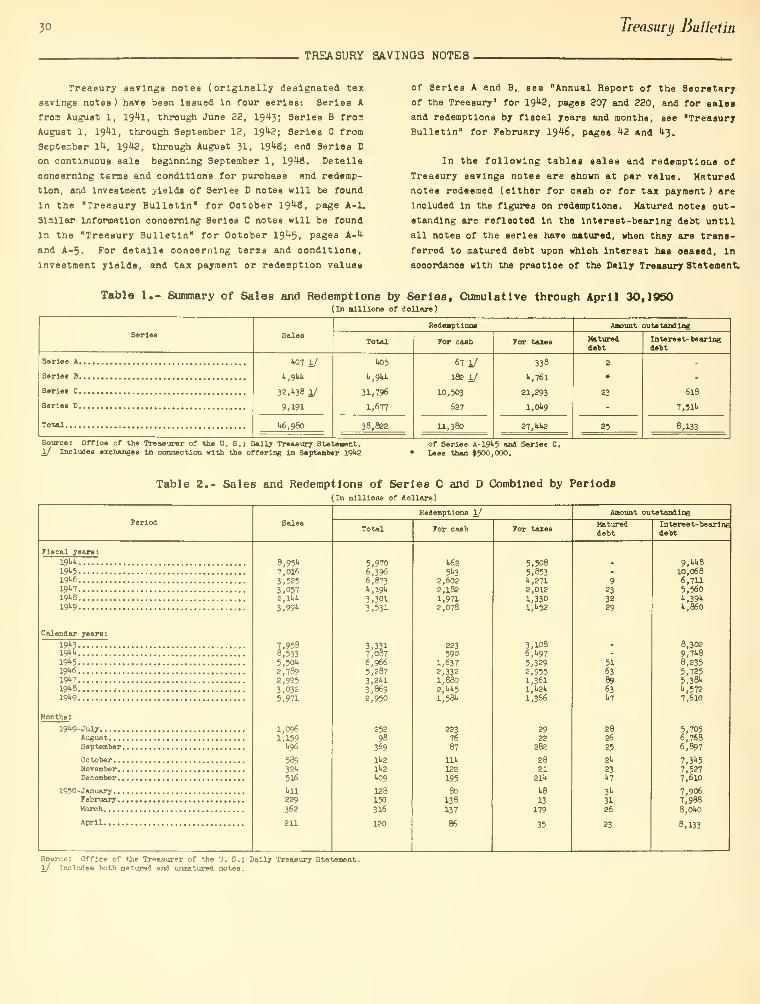
TREASURY SAVINGS NOTES,
Treasury savings notes (originally designated tax
savings notes ) have been Issued In four series: Series A
from August 1, 194l, through June 22, 1943; Series B from
August 1, 194l, through September 12, 1942; Series C from
September 14, 1942, through August 31, 1948; and Series D
on continuous sale beginning September 1, 1948. Details
concerning terms and conditions for purchase and redemp-
tion, and Investment yields of Series D notes will be found
In the "Treasury Bulletin" for Ootober 1948, page A-l.
Similar Information concerning Series C notes will be found
In the "Treasury Bulletin" for Ootober 1945, pages A-4
and A-5. For details oonoernlng terms and oondltlons,
Investment yields, and tax payment or redemption values
of Series A and B, see "Annual Report of the Secretary
of the Treasury" for 1942, pages 207 and 220, and for sales
and redemptions by fiscal years and months, see "Treasury
Bulletin" for February 1946, pages 42 and 43.
In the following tables sales and redemptions of
Treasury savings notes are shown at par value. Matured
notes redeemed (either for cash or for tax payment) are
Included in the figures on redemptions. Matured notes out-
standing are refleoted in the interest-bearing debt until
all notes of the series have matured, when they are trans-
ferred to matured debt upon which interest has oeased, in
aooordanoe with the praotloe of the Daily Treasury Statement.
Table 1.- Summary of Sales and Redemptions by Series, Cumulative through April 30,1950( In millions of dollars )
Series

June W50 31
OWNERSHIP OF FEDERAL SECURITIES.
Table 1.- Distribution of Federal Securities by Classes of Investors and Types of Issues

32 Treasury Bulletin
OWNERSHIP OF FEDERAL SECURITIES
Table 3.- Estimated Ownership of Federal Securities by Bankand Nonbank Investors
(Par values 1/ - in billions of dollars)
June 1950 33
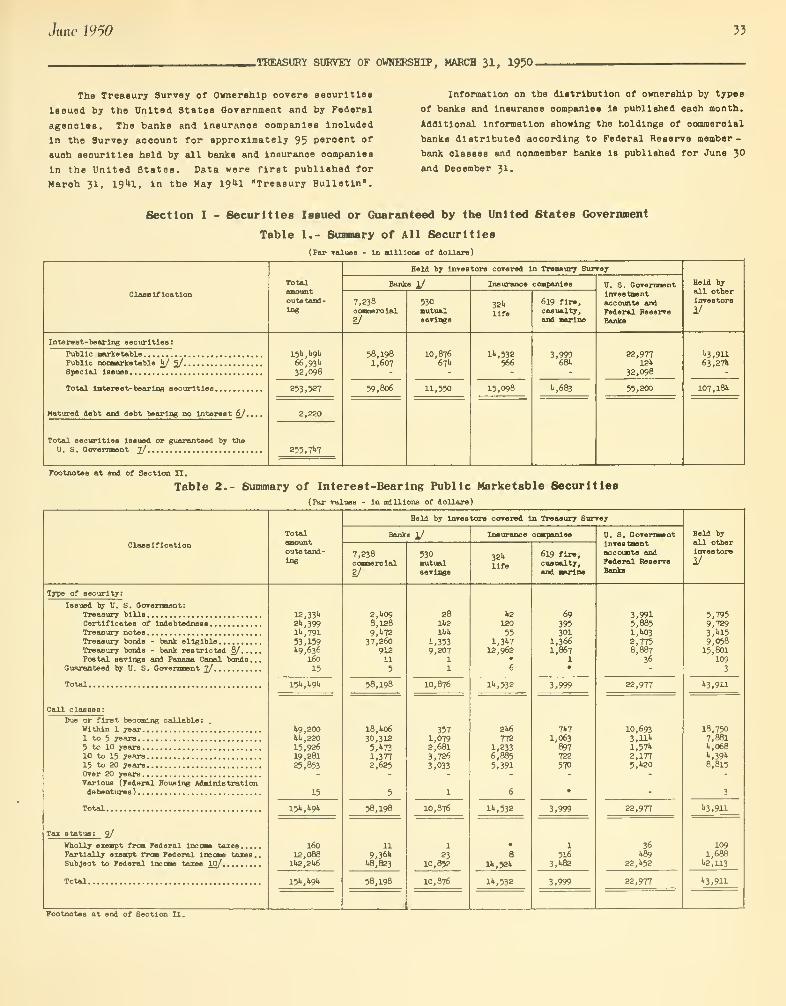
.TREASURY SURVEY OF OWNERSHIP, MARCH 31, 1950.
The Treasury Survey of Ownership covers seourltles
Issued by the United States Government and by Federal
agenoles. The banks and lnsuranoe companies lnoluded
In the Survey aooount for approximately 95 peroent of
suoh seourltles held by all banks and Insurance oompanles
In the United States. Data were first published for
Maroh 31, 1941, In the May 19^1 "Treasury Bulletin".
Information on the distribution of ownership by types
of banks and Insurance oompanles Is published eaoh month.
Additional Information showing the holdings of commercial
banks distributed aooordlng to Federal Reserve member -
bank olasees and nonmember banks Is published for June 3°
and December 31.
Section I - Securities Issued or Guaranteed by the United 6tates Government
Table 1.- Summary of All Securities
(Par values - In millions of dollars)
Class If 1cation
3* Treasury Bulletin
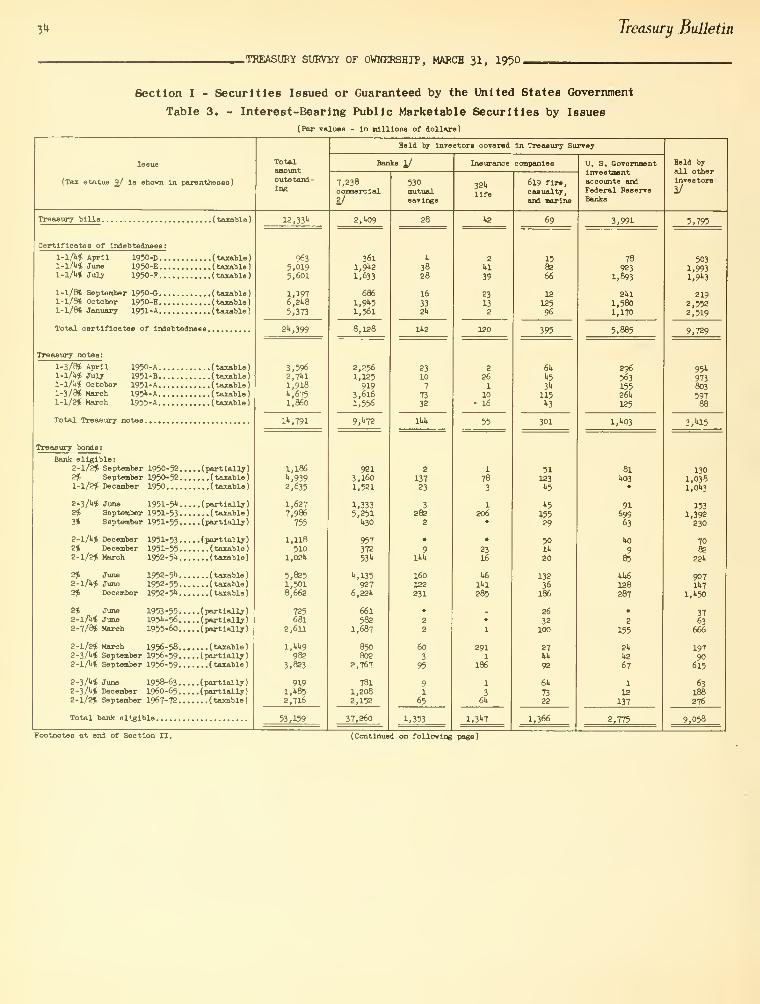
.TREASURY SURVEY OF OWNERSHIP, MARCH 31, 1950.
Section I - Securities Issued or Guaranteed by the United States Government
Table 3. - Interest-Bearing Public Marketable Securities by Issues
(Par values - In millions of dollars)
Issue
(Tax statue %J Is shown In parentheses)
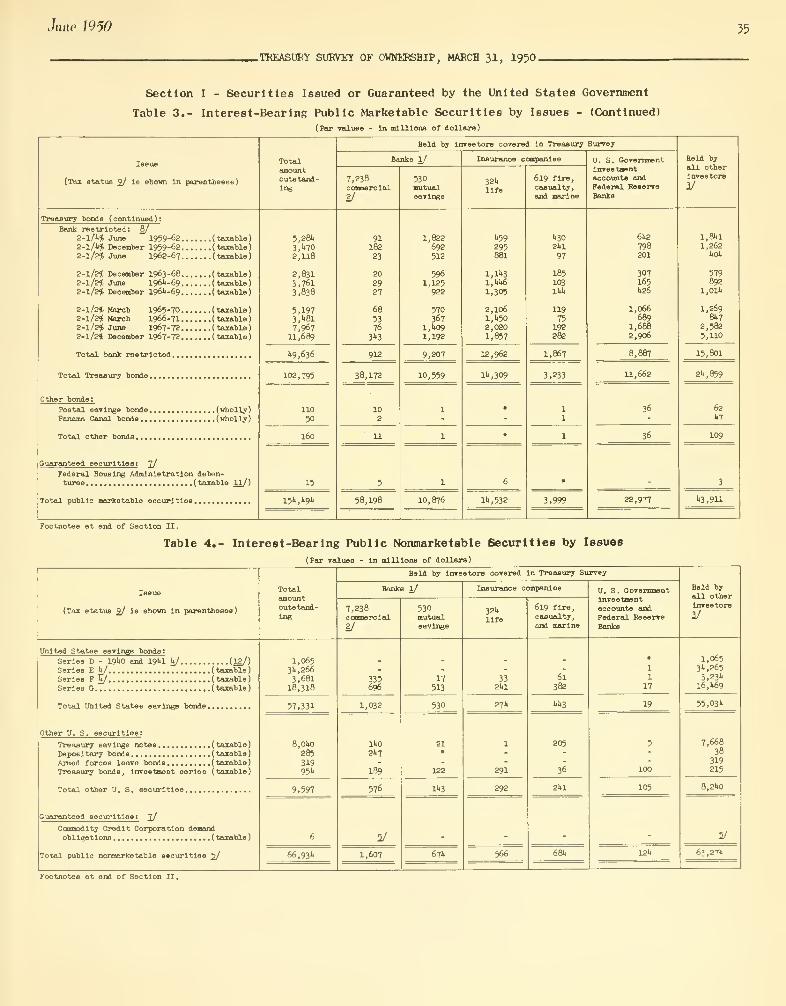
June 1950 35
.TREASURY SURVEY OF OWNERSHIP, MARCH 31, 1950.
Section I - Securities Issued or Guaranteed by the United States Government
Table 3.- Interest-Bearing Public Marketable Securities by Issues - (Continued)
(Par values - In millions of dollars)
Issue
(Tax status 9j/ is shown In parentheses)
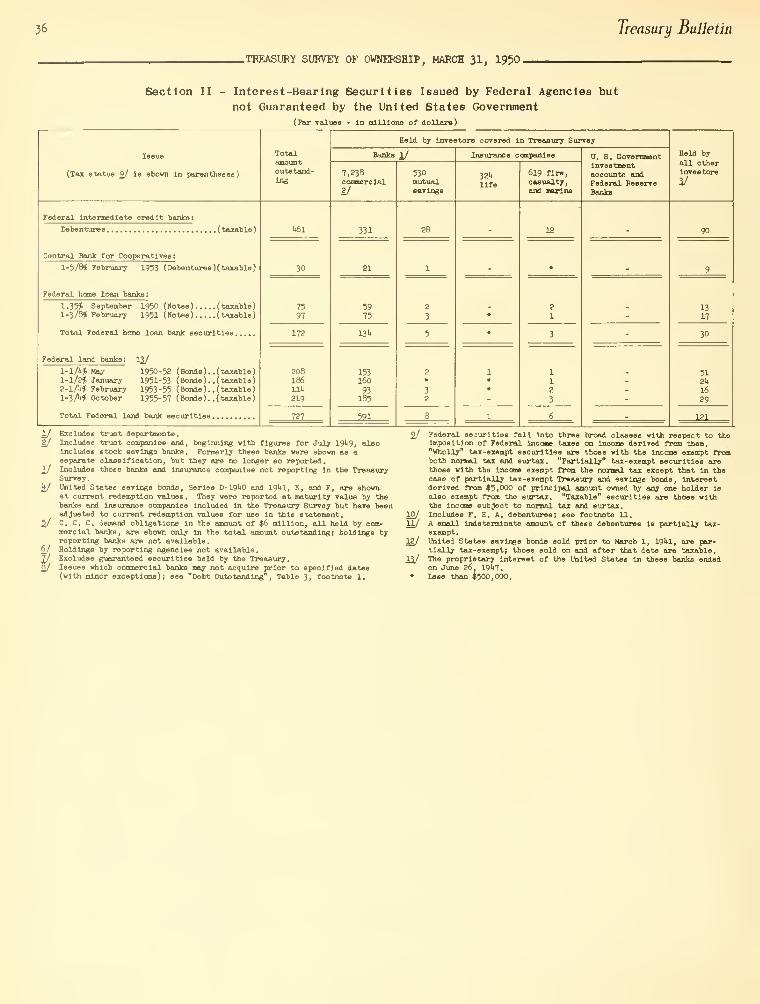
36 Treasury Bulletin
.TREASURY SURVEY OF OWNERSHIP, MARCH 31, 1950.
Section II - Interest-Bearing Securities Issued by Federal Agencies but
not Guaranteed by the United States Government
(Par values - In millions of dollars)
Issue
(Tax status %J Is shown In parentheses)
June \L>50 37
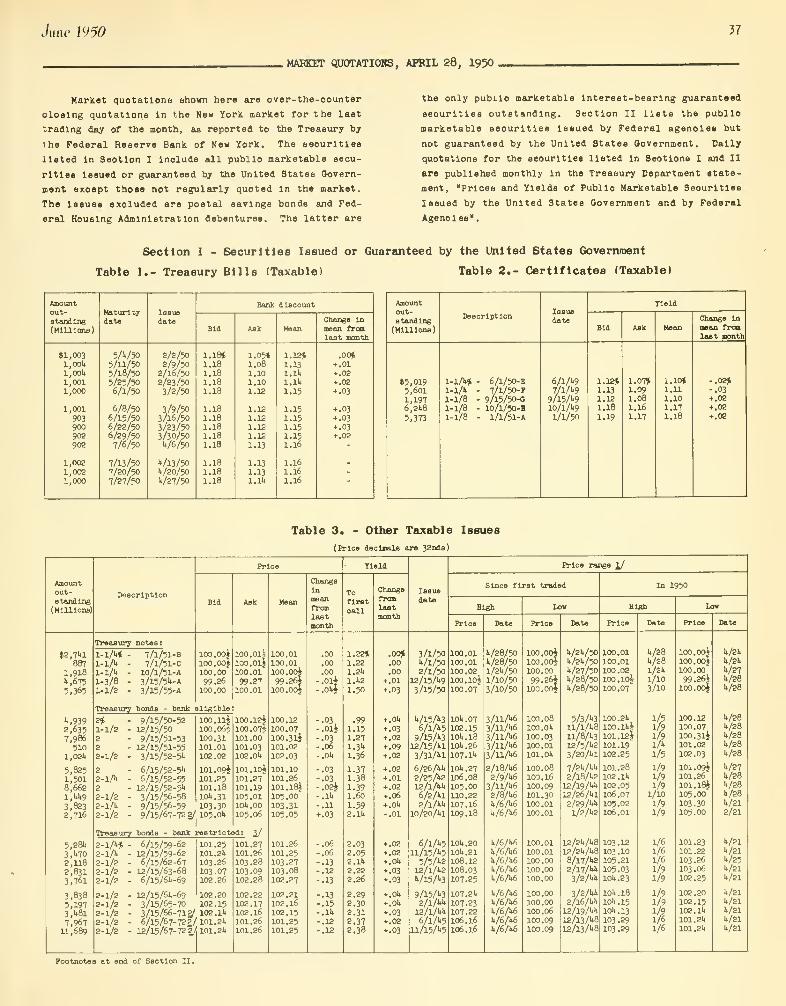
.MARKET QUOTATIONS, APRIL 28, 1950
Market quotations shown here are over-the-oounter
oloslng quotations in the New York market for the last
trading day of the month, as reported to the Treasury by
the Federal Reserve Bank of New York. The securities
listed In Seotlon I include all publlo marketable secu-
rities Issued or guaranteed by the United 8tates Govern-
ment except those not regularly quoted In the market.
The Issues excluded are postal savings bonds and Fed-
eral Housing Administration debentures. The latter are
the only pubilo marketable Interest-bearing guaranteed
securities outstanding. Section II lists the publlo
marketable seourltlee Issued by Federal agenoles but
not guaranteed by the United States Government. Dally
quotations for the seourltlee listed In Sections I and II
are published monthly In the Treasury Department state-
ment, "Prices and Yields of Publlo Marketable Seourltlee
Issued by the United States Government and by Federal
Agencies"
.
Section I - Securities Issued or Guaranteed by the United States Government
Table 1.- Treasury Bills (Taxable) Table 2.- Certificates (Taxable)
Amountout-standing(Millions)
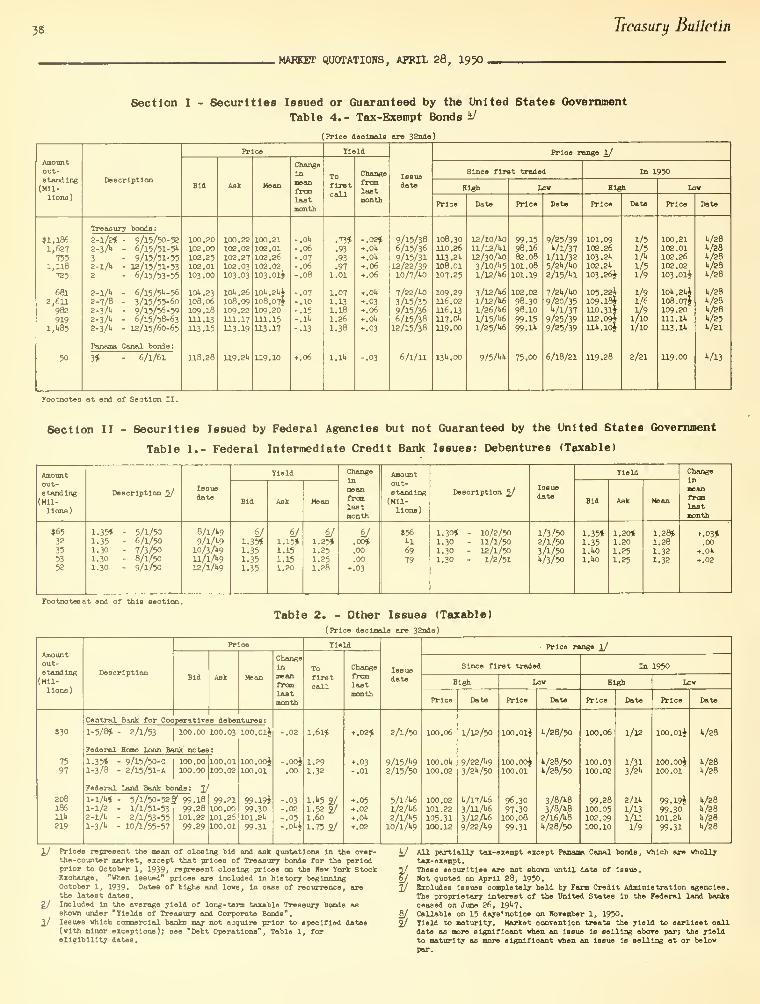
38 Treasury Bulletin
MARKET QUOTATIOHS, APRIL 28, 1950 ,
Section I - Securities Issued or Guaranteed by the United States Government
Table 4.- Tax-Exempt Bonds i/
June mO 39
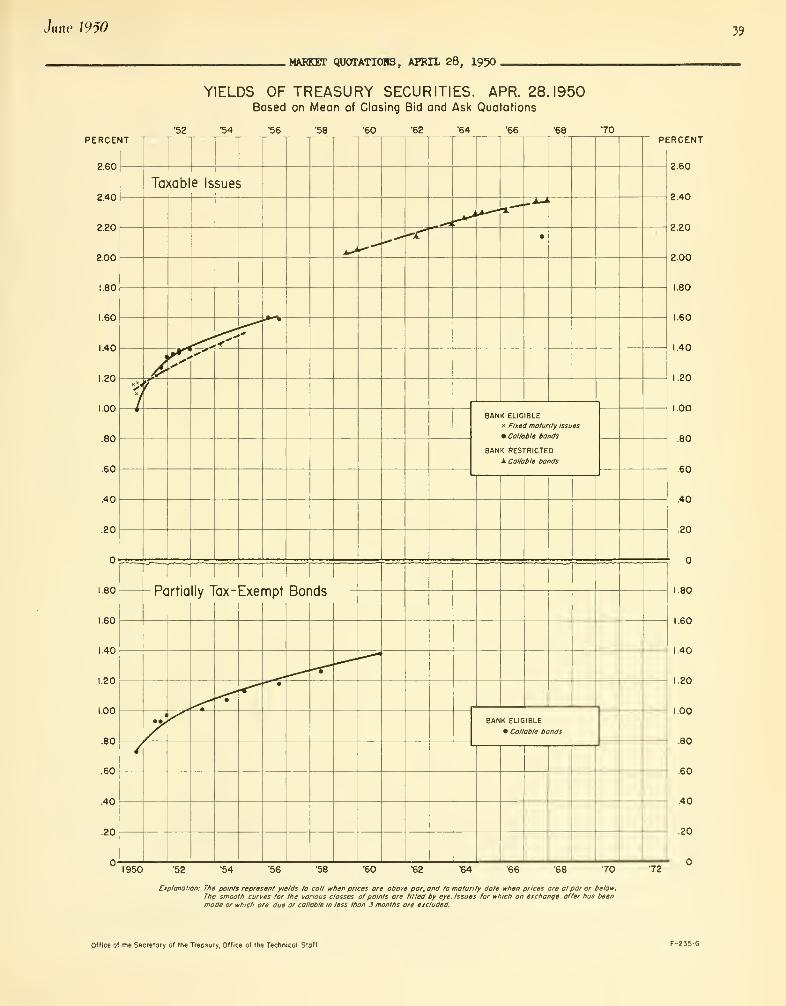
MARKET QUOTATIONS, APRIL 28, 1950
YIELDS OF TREASURY SECURITIES. APR. 28, 1950Based on Mean of Closing Bid and Ask Quotations
•52 •54 56 '58 •60 •62 '64 66 •68 70PERCENT -
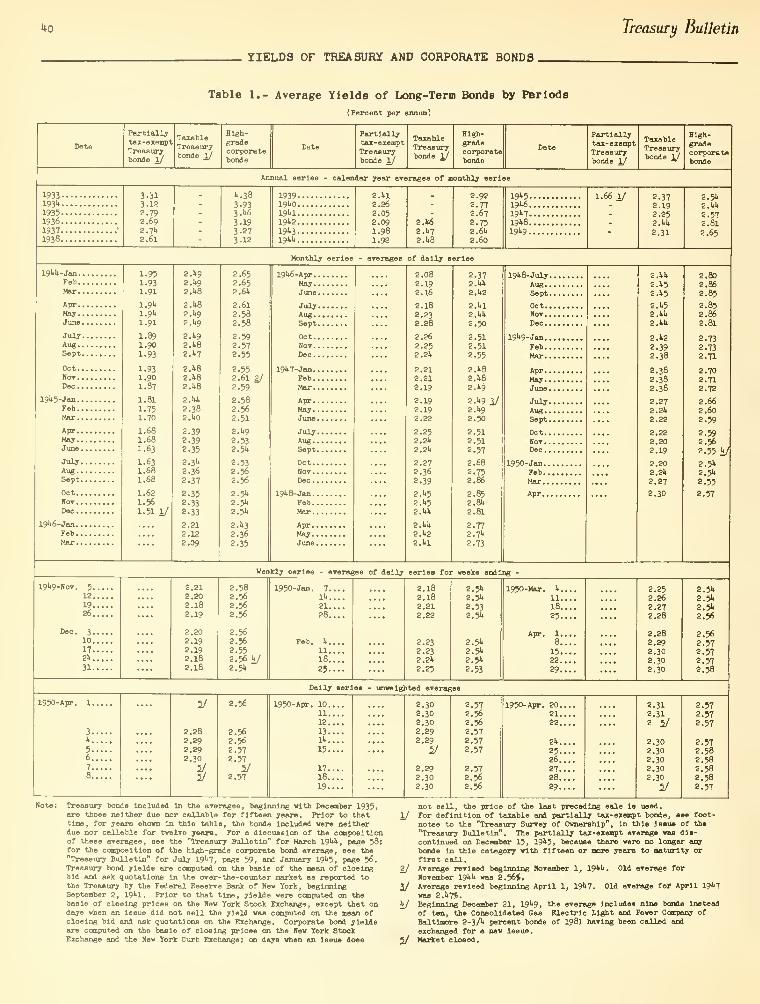
40 Treasury Bulletin
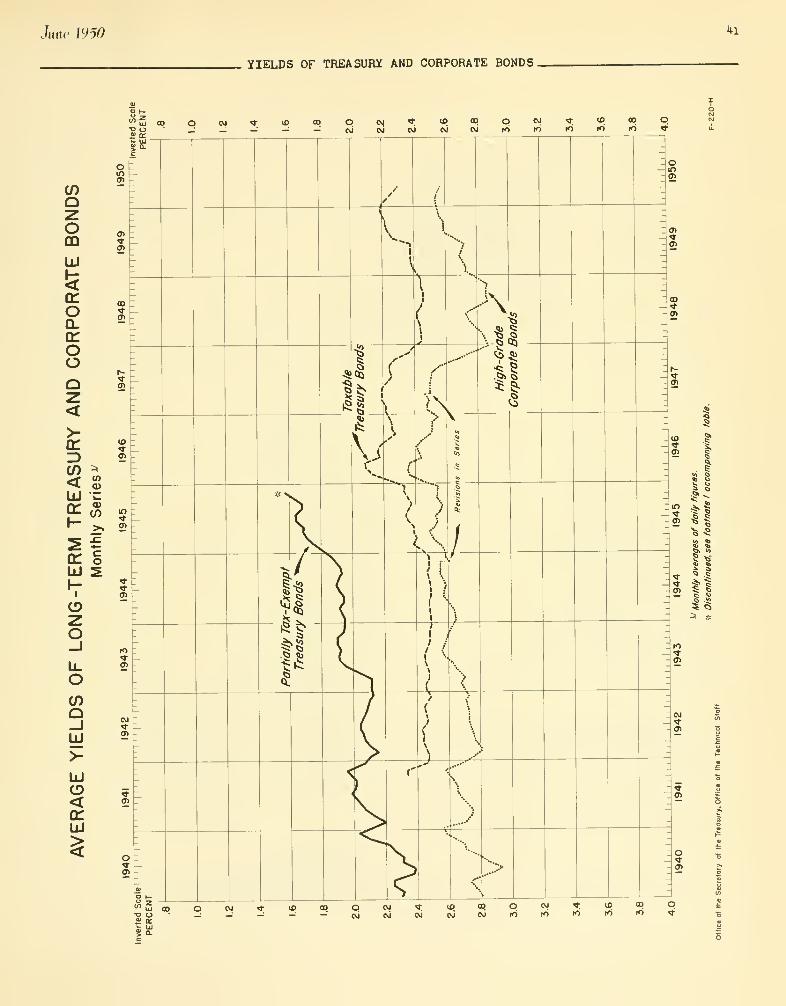
YIELDS OF TREASURY AND CORPORATE BONDS
Table 1.- Average Yields of Long-Term Bonds by Periods
(Percent per annum)
Partiallytax-exemptTreasurybonds 1/
TaxableTreasurybonds 1/
High-gradecorporatebonds
Partiallytax-exemptTreasurybonds 1/
TaxableTreasurybonds 1/
High-gradecorporatebonds
Partiallytax-exemptTreasurybonds 1/
TaxableTreasurybonds 1/
High-gradecorporatebonds
Annual series - calendar year averages of monthly series
1933193 1*
1935193619371938
19Wi-Jan.Feb.Mar.
Apr.May.June
JulyAug.Sept
Oct.,
Nov.
,
Dec,
19^5-Jan..Feb.,Mar..
Apr.
.
May..June.
July.Aug..Sept.
Oct..Not..Dec.
19l*6-Jan..
Feb..Mar..
3.313.122.792.692.7>*
2.61
U.38
3-933.1*6
3.193.273-12
1939191*0
19>»1
19l»2
191*3
19Wt
Monthly series
19l*6-Apr
May ,
June
JulyAugSept ,
OctNotDec
19"t7-Jan
FebMar
AprMayJune
JulyAugSept
OctNotDec
19"*8-Jan
FebMar
AprMayJune
2.1*1
2.262.052.091.981.92
2.1*6
2.1*7
2.1>3
2.922.772.672.752.6k2.60
19"<5.
191*6.
mi-191*8.
19*19.
1.66 1/ 2.37
June \Lm ki
YIELDS OF TREASURY AND CORPORATE BONDS,
ozomUJ
ooroo
>-
1+2 Treasury Bulletin
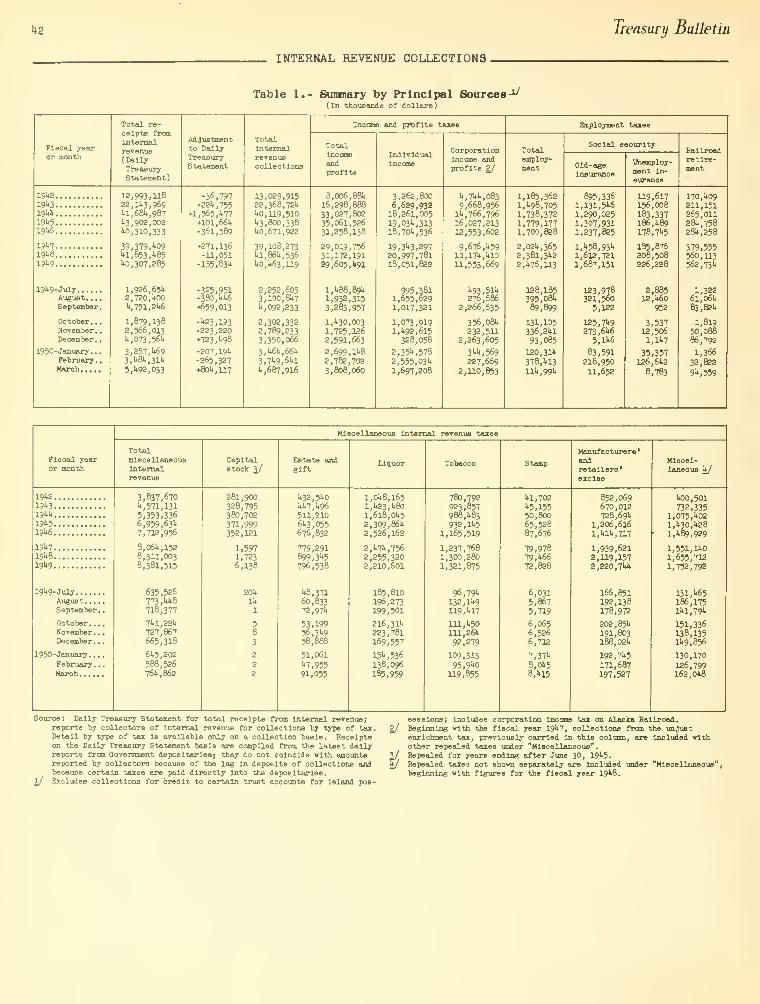
INTERNAL REVENUE COLLECTIONS.
Table 1.- Summary by Principal Sources -^
( In thousands of dollars
)
Fiscal yearor month

June WO *3
INTERNAL REVENUE COLLECTIONS.
INTERNAL REVENUE COLLECTIONS BY PRINCIPAL SOURCES
4
1* Treasury Bulletin
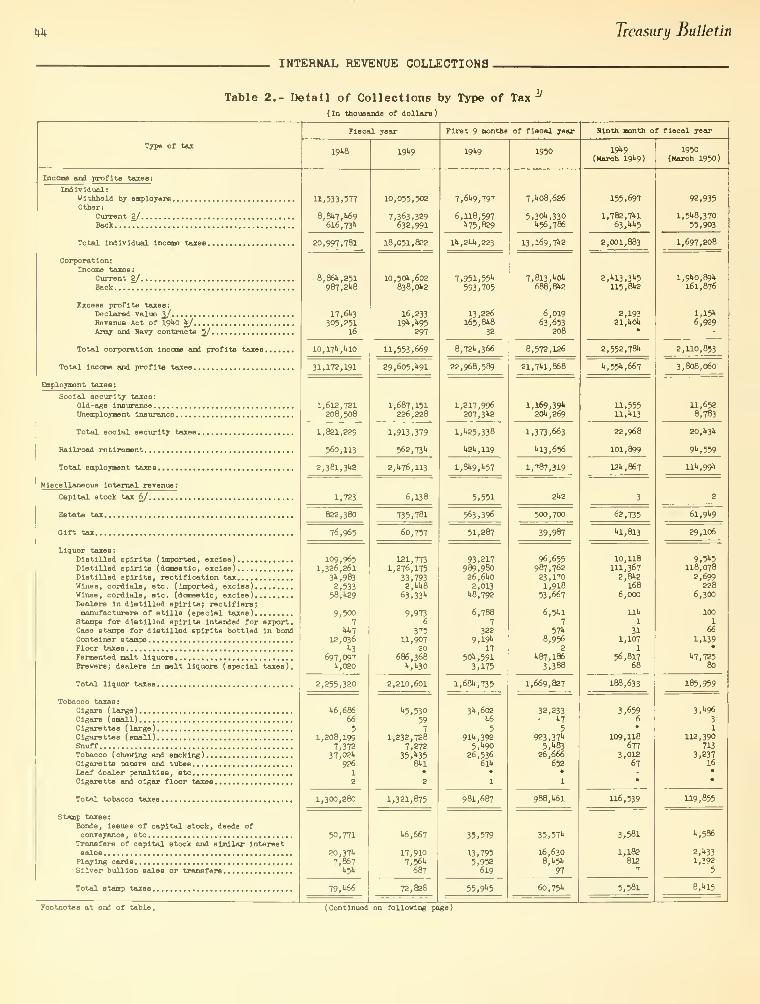
INTERNAL REVENUE COLLECTIONS
Table 2.- Detail of Collections by Type of Tax(In thousands of dollars)
Type of tax
Fiscal year
19k8 191.9
First 9 months of fiscal year
I9U9 1950
Ninth month of fiscal year
19k9(March 19«9)
1950(March 1950)
Income and profits taxes:
Individual:Withheld by employersOther:
Current 2/Back
Total individual Income taxes
Corporation:Income taxes
:
Current 2/Back
Excess profits taxes:Declared value %/Revenue Act of 19k0 k/Army and Navy contracts %/
Total corporation Income and profits taxes
Total Income and profits taxes
Employment taxes:
Social security taxes:
Old-age insuranceUnemployment Insurance
Total social security taxes
Fallroad retirement
Total employment taxes
Miscellaneous Internal revenue:
Capital stock tax 6/
Estate tax
01ft tax
Liquor taxes:Distilled spirits (Imported, excise)Distilled spirits (domestic, excise)DiBtllled spirits, rectification taxWineB, cordials, etc. (Imported, excise)Wines, cordials, stc. (domestic, excise)Dealers in distilled spirits; rectifiers;manufacturers of stills (special taxes)
Stamps for distilled spirits Intended for export.Case stamps for distilled spirits bottled in bondContainer stampsFloor taxesFermented malt liquorsBrewers; dealers in malt liquors (special taxes).
Total liquor taxes
Tobacco taxes:Cigars ( large )
Cigars ( small )
Cigarettes (large)Cigarettes ( small )
SnuffTobacco ( chewing and smoking )
Cigarette papers and tubesLeaf dealer penalties , etcCigarette and cigar floor taxes
Total tobacco taxes
Stamp taxes:
Bonds, Issues of capital stock, deeds ofconveyance , etc
Transfers of capital stock and similar interestsales
Playing cardsSilver bullion sales or transfers
Total stamp taxes
Footnotes at end of table
.
11,533,577
8,8k7,k69616,73''
20,997,781
,86k,251987,2k8
17,613305,251
16
10,17k,kl0
31,172,191
1,612,721208,508
1,821,229
560,113
2,381,31.2
1,723
822,380
76,965
109,9651,326,261
3k,9832,533
58,1.29
9,5007
W.712,036
"•3
697,097k,020
2,255,320
1.6,686
66
51,208,199
7,37237,021.
9261
2
1,300,280
50,771
20,371.
7,867I.5I.
79,k66
10,055,502
7,363,329632,991
18,051,822
10, 501., 602
838, 0U2
16,2331911,1.95
297
11,553,669
29,605,1.91
1,687,151226,228
1,913,379
562,73''
2,1.76,113
6,138
735,781
60,757
121,7731,276,175
33,7932,kk8
63,33''
9,9736
37511,907
20686,368
lt,l»30
2,210,601
•5,530597
1,232,7287,272
35,><3581.1
1,321,875
U6,667
17,9107,561.
687
72,828
7,61.9,797
6,118,5971.75,829
lk,2kk,223
7,951,55"'
593,705
13,226165, 8U8
32
8, 72'', 366
22,968,589
1,217,996207, 3U2
1,^5,338
U21., 119
1,81.9, l»57
5,551
563,396
51,287
93,217989,98026,6U02,013
1.8,792
6,7887
3229,19k
1750k, 5913,175
1,68k, 735
3k ,602k6
591k, 392
5,k90
26,5366lk
981,687
35,579
13,7955,952619
55,9k5
7,k08,626
5, 30k,330k56,786
13,l69,7k2
7,8l3,kOk688,8ka
6,01963,653
208
8,572,126
21,7kl,868
1,169,39k20k ,269
1,373,663
kl3,656
1,787,319
2k2
500,700
39,987
96,655987,76223,1701,91853,667
6,5kl
757k
8,9562
k87,l86
3,388
1,669,827
32,233k7
5923,37k
5,k8326,666
652
988, k6l
35,57k
16,6308,k5k
97
6o,75k
155,697
l,782,7kl63,kk5
2,001,883
2,kl3,3k5115, 8k2
2,19321,k0k
J, 55?, 78k
k,55k,667
11,555ll,kl3
22,968
101,899
12k, 867
3_
62,735
kl,8l3
10,118111,3672,8k2
1686,000
Ilk1
311,107
56,81768
188,633
3,6596•
109,118677
3,01267
116,539
3,581
1,182812
7
5,581
92,935
l,5k8,370
55,903
1,697,208
l,9k0,89k161,876
1,15k
6,929
2,110,853
3,808,060
11,6528,783
20,k3k
9k, 559
Ilk, 99k
6l,9k9
29,106
9,5k5
118,0782,699
2286,300
1001
66
1,139«
k7,72580
185,959
3,k96
3
1
112,390713
3,23716
119,855
k,586
2,k33
1,3925
8,kl5
( Continued on folloving page
)

Jnnc mO *5
INTERNAL REVENUE COLLECTIONS.
Table 2.- Detail of Collections by Type of Tax^ - (Continued)
(In thousands of dollars)
Type of tax
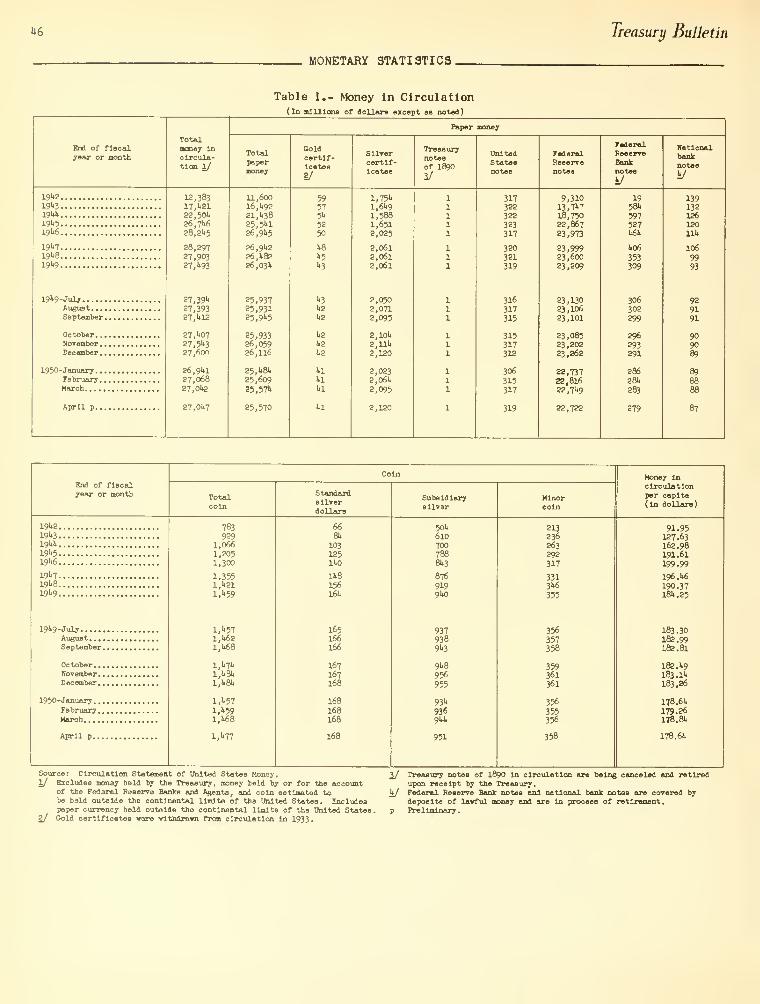
U6 Treasury Bulletin
MONETARY STATISTICS.
Table 1.- Money in Circulation(In millions of dollara except as noted)
End of fiscalyear or month
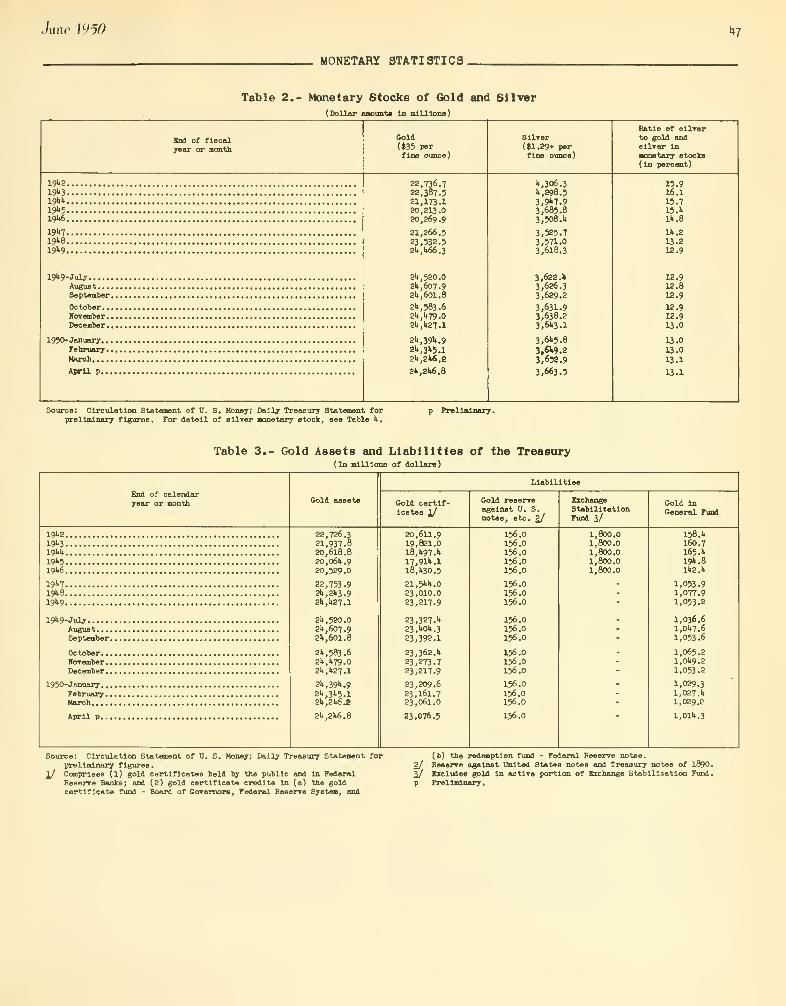
June mo *7
MONETARY STATISTICS
Table 2.- Monetary Stocks of Gold and Silver
(Dollar amount* In ml 11 lone)
Snd of fiscalyear or month
Cold
(*35 perfine ounce)
SllTer(»1.29+ perfine ounce)
Ratio of ellTorto gold andsilver IsMonetary etocka( In percent)
19*2 ,
19*3 ,
19** ,
19*5 ,
19*6
19*719*819*9
19*9-JulyAugust.. .,
September
,
October. .
,
November .
,
December .
,
1950-January. .
.
February*.March
April p. .
.
22,736.722,387.521,173.120,213.020,269.9
21,266.523,532.52*,*66.3
2*, 520.0
2*,607.92*, 601.
8
2*, 583 .6
2*,*79.02*,*27.1
2*, 39*.
9
2*,3*5.l2*,2*6.e
2*, 2*6.
8
*,306.3*,298.53,9*7.93,685.83,508.*
3,525.73,571.03,618.3
3,622.*3,626.33,629.2
3,631.93,638.23,6*3.1
3,6*5.8
3,6*9.83.658.9
3,663.5
15.916.115.715.*1*.8
1*.213.812.9
12.912.812.9
12.912.913.0
13.0
13.0
13.1
13.1
Source: Circulation Statement of U. S. Money; Dally Treasury Statement forpreliminary figures. For detail of silver monetary stock, see Table *.
p Preliminary.
Table 3.- Gold Assets and Liabilities of the Treasury(In millions of dollars)
End of calendaryear or month Gold assets
Liabilities
Gold certif-icates 1/
Gold reserveagainst U. S.notes, etc. 2/
ExchangeStabilisationFund 37
Gold InGeneral Fund
19*219*319**
19*519*6
19*719*819*9
19*9-JulyAugust.. ..
September
.
October. .
.
November .
.
December.
.
1950-January...February.
.
March
April p...
22,726.321,937.820,618.820,06l».9
20,529.0
22,753.92*, 2*3 .9
2*,*27.1
2*, 520.02*,607.92*, 601.
8
2*, 583 .6
2*,*79.02*,*27.1
2*, 39* .92*,3*5.12*,2*6.2
2* ,2*6.
8
20,611.919,821.01S,*97.*17,91*.
1
18,*30.5
21,5**.023,010.023,217.9
23,327.*23,*o*.3
23,392.1
23,362.*23,273.723,217.9
23,209.623,161.723,061.0
23,076.5
156.0156.0156.0156.0156.0
156.0156.0156.0
156.0156.0156.0
156.0156.0156.0
156.0
156.0156.0
156.0
1,800.01,800.01,800.01,800.01,800.0
158.*160.7165.*
19*. 81*2.*
1,053.91,077.91,053.2
1,036.61,0*7.61,053.6
1,065.21,0*9.21,053.2
1,029.31,027.*1,029.2
1,01*.
3
Source: Circulation Statement of U. S. Money; Dally Treasury Statement forpreliminary figures.
1/ Comprises (1) gold certificates held by the public and In FederalReserve Banks; and (2) gold certificate credits In (a) the goldcertificate fund - Board of Governors, Federal Reserve System, and
(b) the redemption fund - Federal Reserve notes.
2/ Haaervo against United States notes and Treasury notes of 1890.
2/ Excludes gold In active portion of Exchange Stabilization Fund,
p Preliminary.

KS Treasury Bulletin
MONETARY STATISTICS.
Table 4.- Components of Silver Monetary Stock(In Billions of dollar*)
End of calendaryear or month
Silver held In Treasury
Securing silver certificates l/
Silverbullion 2/
Sliverdollars
In General Fund
Subsidiarycoin ^/
Bullion forrecolnage kj
Bullionat cost 2/
Sliver outsideTreasury
Sliverdollars 1/
Subsidiarycoin 3/
Totalb liverat $1.29+per fineounce
19&219*319Ui
19">5
19W
19U719W19>»9
19^9-JulyAugust. .
.
September
October.
.
November
.
December.
1950-January.
.
February.Maroh....
April p .
.
1,516.21,520.01,520.11,703.91,911.2
1,937.61,971.52,003.2
1,989.21,992.1.
1,995.7
1,997.22,001.12,003.2
2,006.52,008.32,010.9
2,013.1.
"•68.3
U00.U
376.5356.1.
337.2328.1321.9
325.332fc.l
323.2
322.9322.1.
321.9
321.8321.8321.7
321.6
9.21«.">
12.510.2llt.O
13.15.9
11.1.
II. .9
1».3
13.5
12 .U
11.6ll.U
13.015.015.7
15.9
19.1
.1
628.2551.81.05 .6
185.693.1
91.189.39"..l>
90.891.290.8
91.
U
92.09U.U
93.593.89».l
97.1
78.896.8117.5137.5150.1
156.3165.0171.0
167.6168.7169.6
170.0170.1.
171.0
171.0171.1171.2
171.2
587.368U.7771.68U6.7901.1
928.7971.5982.2
97k .6
975.1.
976.6
978.0980.7982.2
982,0982,1.
983.0
983.9
1., 317.6l», 207.
3
3,870.63,512.83, 51"..
2
3,51.7.9
3,596.73,61.3.1
3,622.1.
3,626.33,629.2
3,631.93,638.23.6U3.1
3,61.5.8
3,652.9
3,663.5
Source: Circulation Statement of U. S. Money; Dally Treasury Statement forcertain preliminary figures.
l/ Valued at $1.29+ per fine ounce.2/ Includes silver held by certain agencies of the Federal Government (Bee
Daily Treasury Statement for amount). Does not include sliver lend-leased to foreign governments (these transactions ell took place duringthe fiscal years 191*2 through 19^; see 19W Annual Report of the
Secretary of the Treasury for amounts).Valued at $1.38+ per fine ounce.Valued at $1.38+ per fine ounce or at $1.29+ per fine ounce accord-ing to whether the bullion Is held for recolnage of subsidiarysilver coins or for recolnage of standard sliver dollars.Preliminary.Lees than $50,000.
Table 5.- Silver Production In the United States and Acquisitions by Mints and Assay Offices^
(In millions of ounces or don****')
Calendar yearor month
Sliverproduction InUnited States
Ounces
Sliver acquisitions by mints and assay offices
Newly mined domesticsliver 2/
Foreign sliver $j
191.2
191.3
19W191.5
19^
191.7
191.8
19*9
l9l.9-.July
August. ..
.
September
.
October. .
.
November.
.
December.
.
1950-January . .
.
February.
.
March
55.9U0.8
35.729.321. •
36.136.13U.6
2.32.92.2
2.93.13.2
3.02.5
3.7
1.7.9
5.5•
.9
1..9
30.3 y36.833.0
3.23.02.2
2.11.9U.o
2.02.62.8
31. .0
3.9•
.6M27.1. y33.329.9
2.92.82.0
1.91.73.6
1.82.U
2.5
iM 6.0 62.1
5.5•
.91..9
30.336.833.0
3.23.02.2
2.11.91..0
2.02.62.8
y
Uo.o
3.9#
.6
k.h
27.1.
33.329.9
2.92.82.0
1.91.73.6
1.82.U
2.5
y
Source: Annual figures from the Bureau of the Mint. Monthly figures on U. S.silver production from releasee of the American Bureau of Metal Statiatice;theee vlll not agree with the annual figures
.
1/ For information on silver production In other oountries, see atttuiaI reportsof the Director of the Mint. Data from 1933 through 19X1 are summarised inthe "Treasury Bulletin" for August 19^3, page 71*.
2/ Acquired at 6U.6U cents per fine ounce until April 9, 1935; at 71.U centsper fine ounce from that date until April 23, 1935; at 77.57 oenta per fineounce from April 23, 1935, to December 31, 1937; at 6U.6U oenta per fine
ounce from December 31, 1937, to July 1, 1939lat 71.11 centapsrfineounce from July 1, 1939, to July 2, 19**6; and at 90.5 cents perfine ounce since July 2, 19^6.
2/ Acquired at various prices averaging approximately 51 cents perfine ounce.
hj Includes 0.2 million ounces valued at 71.11 cents per fine ouncetotalling $0.2 million, and 30.1 million ounces valued at 90.5cents per fine ounce totalling $27.2 million.
• Lees than 50,000 ounces or $50,000.
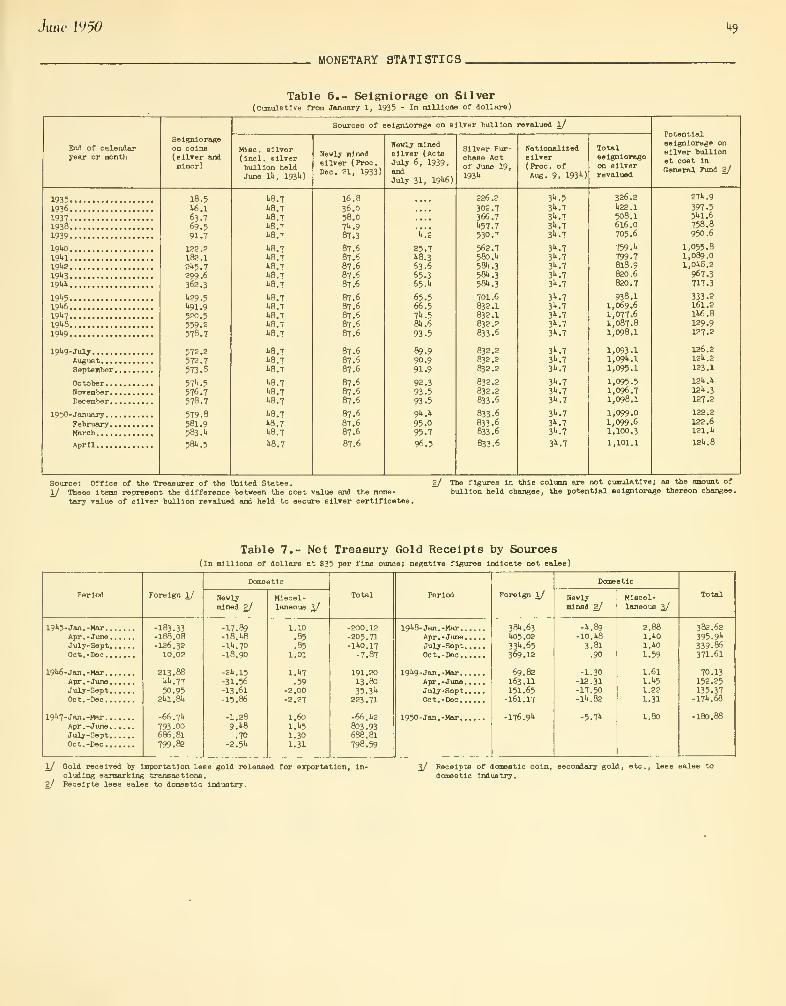
June WO 1*9
MONETARY STATISTICS.
Table 6.- Seigniorage on Silver(Cumulative from January 1, 1935 - In millions of dollars)
End of calendaryear or month

50 Treasury Bulletin
CAPITAL MOVEMENTS,
Data relating to claims on foreigners and liabili-
ties to foreigners, and capital movements between the
United States and foreign countries, have been colleoted
on Treasury Foreign Exohange Forms since 1935. pursuant
to Executive Order 656O of January 15, 193'1', and Treasury
regulations thereunder. Information covering the principal
types of data and the principal countries la reported
monthly, and is published regularly In the "Treasury
Bulletin". Supplementary information is published at
less frequent Intervals. All reports are made initially
to the Federal Reserve Banks, which forward consolidated
figures to the Treasury.
The term "foreigners" as used in these reports oovers
all institutions and individuals (including United States
citizens) domiciled outside the United States. "Short-term"
refers to original maturities of one year or less, and
"long-term" refers to all other maturities. A detailed
discussion of the reporting coverage, basis of reporting,
and derivation of capital movements figures appeared In
the April 1950 Issue of the "Treasury Bulletin", pages 5O-52.
Certain changes In report forms and regulations became
effective with the data for January 1950, which first
appeared in that issue. Included in these changes was the
discontinuance of reports on outstanding contracts for
forward purchases and sales of foreign exchange.
The supplementary information, now appearing as
Section IV, Is presented in three tables, appearing at
different times. Table 1 gives data by countries on
short-term claims on and liabilities to foreigners as
reported quarterly by exporters, Importers, and industrial
and commercial concerns in the United States. This infor-
mation was published for the first time in the October 1949
issue of the "Treasury Bulletin" and begins with data for
September 30, 1946. Table 2 supplies Information by
countries on long-term claims on and liabilities to
foreigners as reported by banks and bankers in the
United States. This table appeared for the first time
in the December 1949 issue. Data are for the end of the
calendar year beginning with 194-2. Table 3 gives Infor-
mation on short-term liabilities to countries not regu-
larly reported separately by banks and bankers. This
table appeared for the first time in the April 195° issue.
The data have been requested at irregular intervals, the
earliest date being October 194-3.
The January figures are the first series oomplled
under the revised foreign exohange forms. (See the
"Treasury Bulletin" for April 1950). Attention is oalled
to the fact that although the grand total figures for
January (final) are reasonably comparable with those for
Deoember 19^9, data for individual countries in some
Instances are not comparable beoause of certain changes
in ooverage and geographical classification.
Publication of detailed figures In the various
monthly series relating to capital movements was dis-
continued between the March 194-2 and the November 19^5
Issues of the "Treasury Bulletin". Data omitted during
that period, however, were published in the November 1945
issue and supplement.
Section I - Historical Summary
Table 1.- Net Capital Movement between the United States and Foreign Countries
(In thousands of dollars; negative figures Indicate a net outflov of capital fron the United States)
Calendar yearor month
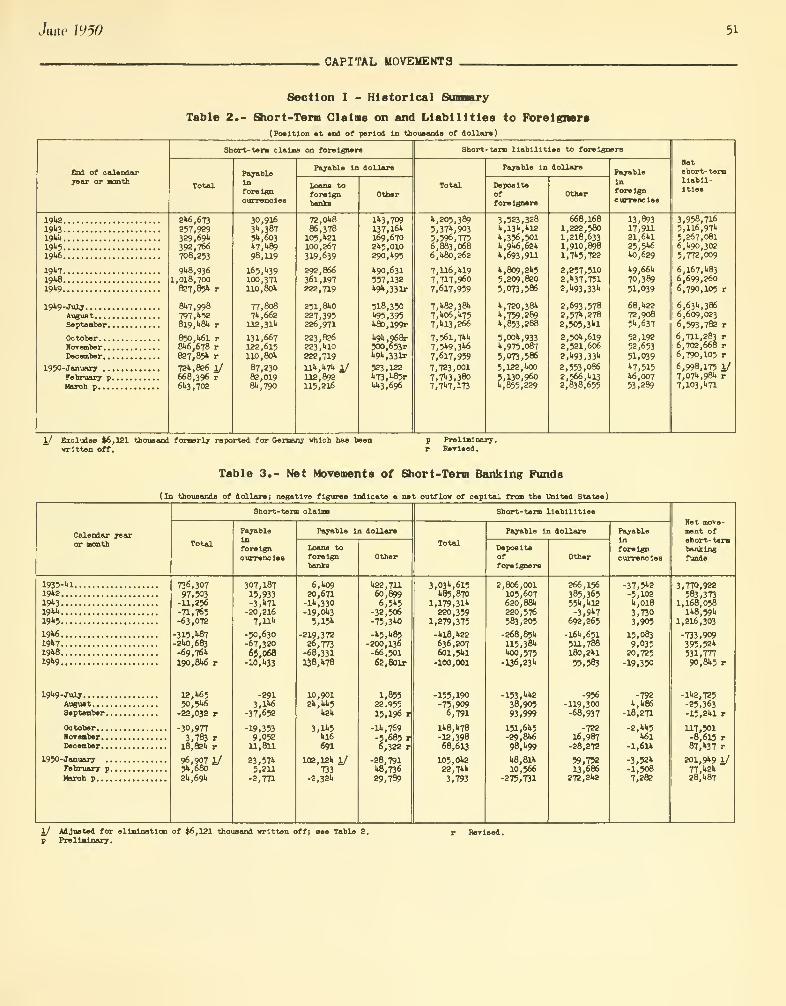
June 1950 51
CAPITAL MOVEMENTS
Section I - Historical Summary
Table 2.- Short-Tern Claims on and Liabilities to Foreigners
(Position at end of period In thousands of dollars)
End of calendarTear or month
Short-term claims on foreigners
PayableInforeigncurrencies
Payable In dollars
Loans toforeignbanks
Short-term liabilities to foreigners
Payable In dollars
Ds positsofforeigners
Payable
Inforeigncurrencies
Setshort- termliabil-ities
19k2
19»319kk19k519k6
19k719k819k9
19149-july
AugustSeptember.
.
Ootober. . .
.
November. .
.
December. .
.
1950-January . .
.
February p.
March p....
2146,673
257,929329,69't
392,766708,253
91.8,936
1,018,700827,85* r
8U7,998797, k52819, k8k r
850,U6l r8^,678 r827,851. r
7211,826 1/668,396 r61.3,702
30,9163"»,387
54,603k7,k89
98,119
165, ">39
100,371110,80k
77,8o871..662
112, 31k
131,667122,615110,801.
87,23082,0198k, 790
72,0k886,378
105, U21100,267319,639
292,866361,197222,719
251,8W227,395226,971
223,826223,1.10
282,719
Ill4.ll.7l4 1/112,892115,216
lk3,709137,16k169,67021.5,010
290,1*95
1.90,631
557,132k9k,331r
518,350k95,3951*80, 199r
U9U,§68r500,653r»9»,331*
523,122k73,k85rW.3,696
14,205,3895,37l.,903
5,596,7756,883,0686,U8o,262
7,116,1419
7,717,9607,617,959
7, 1482,38k
7,ko6,k757,kl3,266
7,56l,7kk7,5k9,3k6
7,617,959
7,723,0017,7k3,3807,7k7,173
3,523,328k,13k,kl2k, 356, 501k,9k6,62kk, 693,911
k,809,2k55,209,820
5,073,586
k, 720,38kk, 759,289k, 853 ,288
5, 00k,933k, 975,087
5,073,586
5,122,kO0
5,130,960k, 855,229
668,1681,222,5801,218,6331,910,898l,7k5,722
2,257,5102,k37,7512,k93,33k
2,693,5782, 57k,2782,50?,3kl
2, 50k,6192,521,6062,k93,33k
2,553,0862,566,kl32,838,655
13,89317,91121,6kl25,5k61*0,629
k9,66k
70,389
51,039
68,k2272,9085k,637
52,19252.653
51,039
k7,515k6,00753,289
3,958,7165,ll6,97k
5,267,0816,1190,302
5,772,009
6,l67,k836,699,260
6,790,105 r
6, 63k, 386
6,609,023
6,593,782 r
6,711,283 r
6,702,668 r
6,790,105 r
6,998,175 1/7, 07k, 98k r7,103,k71
1/ Excludes $6,121 thousand formerly reported for Germany which has beenwritten Off,
Preliminary.Revised
.
Table 3.- Net Movements of Short-Term Banking Funds
(In thousands of dollars; negative figures lndloate a net outflow of capital from the United States)
Calendar yearor month
Short-term claims
Total
PayableInforeigncurrencies
Payable in dollars
Loans to
foreignbanks
Short- term llabllltlss
Total
Payabls In dollars
Depositsoffore lgners
PayablsIn
foreigncurrencies
Hst move-ment ofshort-termbankingfunds
1935-kl19k219k319kk
19*5
19k619k719k819k9
19k9-JulyAugust. ..
,
September.
Ootober. .
.
November.
.
December.
.
1950-January .
February pMarch p...,
736,30797,503-11,256-71,765-63,072
•315,k872k0,683-69,76k
190,81*6 r
12,k6550,5k6
-22,032 r
-30,977
3,783 r18,82k p
96,907 i/5k,6802k,69k
307,18715,933-3,k71
-20,2167,11k
-50,630-67,320
65,068-10,k33
-2913,lk6
-37,652
-19,3539,052
11, 811
23,57k5,211
-2,771
6,1*09
20,671-lk,330-19,Ok3
5,15k
219,37226,773-68,331138,k78
10,9012k,kk5
l*2k
3,lk5kl6
691
102,12k i/733
-2,32k
k22,7U60,8996,5k5
-32,506-75,3kO
-k5,k85-200,136-66,501
62,801r
1,85522.955
15,196 r
-Ik, 769
-5,685 r
6,322
-28,791k8,736
29,789
3, 03k, 615k85,870
1,179,31k
220,3591,279,375
-kl8,k22
636,207601, 5kl
-100,001
-155,190-75,9096,791
Ik8,k78-12,39868,613
105,Ok222,7kk
3,793
2,806,001105,607620,88k
220,576583,205
-268,85k115,38kkOO,575
-136,23k
-153, kk2
38,90593,999
151,6k5-29,8k698,k99
k8,8lk10,566
-275,731
266,156385,36555k, kl2-3,9k7
692,265
-16k,651511,788180,2kl
55,583
-956
-119,300-68,937
-722
16,987-28,272
59,75213,686
272,2k2
-37,5k2
-5,102k,0l8
3,7303,905
15,0839,035
20,725
-19,350
-792k,k86
-18,271
-2,k»51*61
-1,61*
-3,52k-1,5087,282
3,770,922583,373
1,168,05811*8, 59k
1,216,303
-733,909395,52k
531,77790,8k5 r
-11*2,725
-25,363-15,2kl r
117,501-8,615 r87,k37 r
201,9k9 1/77,k2k28,k87
1/ Adjusted for elimination of $6,121 thousand written off; see Table 2.
p Preliminary.
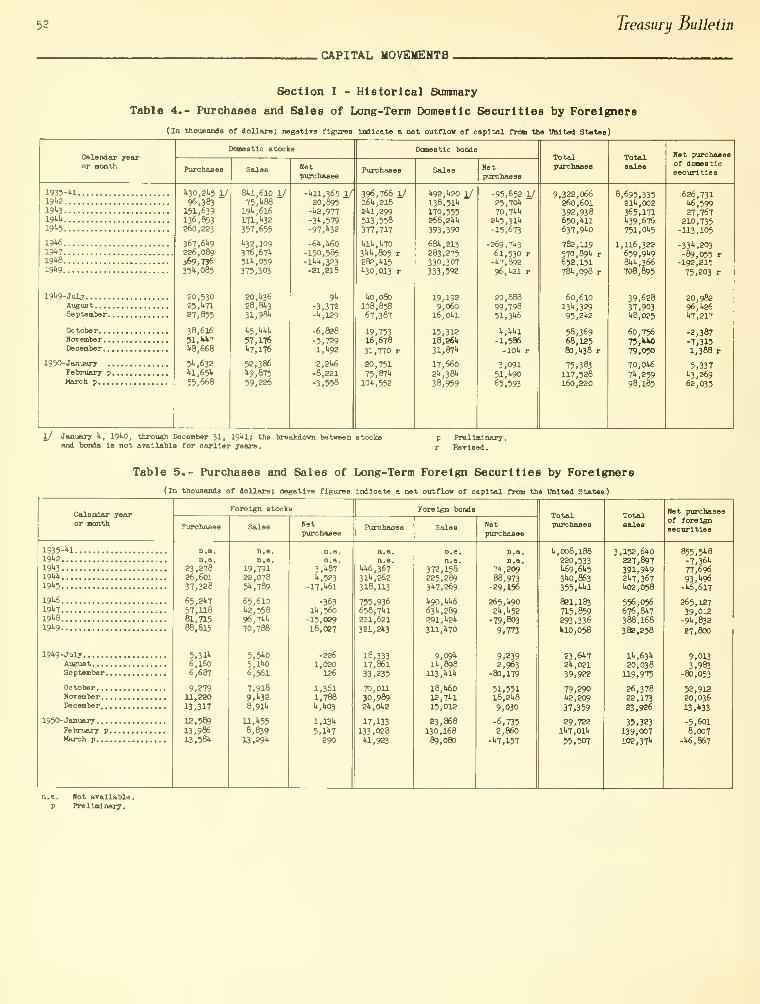
Treasury Bulletin
CAPITAL MOVEMENTS.
Section I - Historical Summary
Table 4.- Purchases and Sales of Long-Term Domestic Securities by Foreigners
(In thousands of dollars; negative figures Indicate a not outflow of capital from the United States)
Calendar yearor month
Domestic stocks
Sales Netpurchases
Domestic bonds
Purchases Netpurchases
Totalpurchases
Totalsales
Net purchasesof domesticsecurities
1935-M19U219">3
19W»
19»5
19^19"i7
19li8
19">9
19>t9-Julj
August. . .
.
September.
October. .
.
November .
.
December.
.
1950-January .
February pMarch p. ..
It30,2lt5 1/96,383151,639136,853260,223
367,6119
226,089369,73635l»,085
20,53025, •7127,855
38,61651,*»71.8,668
5i»,632
Ul,65lt
55,668
81.1,610 1/75.U88
19l.,6l6
171,1.32
357,655
1.32,109
376,671.
511., 059375,303
20,1»36
28,81.3
31,981.
U5.UUU
57,1761.7,176
52,3861.9,875
59,226
-1.11,365 1/20,895
-1.2,977
-3U.579-97,1.32
-6k,Wo-150,585-IW.,323-21,218
9U
-3,372-U,129
-6,828
-5,7291,1.92
2.2U6
-8,221
-3,558
396,768 1/16I..218
21.1,299
513,558377,717
Ull.,1.70
31.1., 805 r282,1.15
1.30,013 r
to,080
108,85867,387
19,75316,678
31,770 r
20,75175,871.
101., 552
l»92,ltf0
138,511.
170,555268,2M.
393,390
681., 213283,275330,307333,592
19,1929,060
16,01.1
15,31218,261.
31,871.
17,6602U.38U
38,959
-95,652 1/25,701.
70, 7l.lt
2l*5,31U
-15,673
-269,7113
61,530 r-1.7,892
96,1.21 r
20,88899,79851, 3^
It, 1.1.1
-1,586-10li r
3,09151,1.90
65,593
9,322,066260,601
392,938650,1.11
637,91.0
782,119570,891. r652,151781., 098 r
60,61013li,329
95,2lt2
58,36968,12580,lt38 r
75,383
117,528160,220
8,695,33521lt,002
365,1711139,676751,01i5
1,116,322659,91198Ult,366
708,895
39,62837,903U8.025
60,75675.U079,050
70,ow7lt,259
98,185
626,731Ii6,599
27,767210,735-113,105
-3311,203
-89,055 :
-192,215
75,203 i
20,98296,1126
>i7,217
-2,387-7,3151,388,
5,337113,269
62,035
1/ January It, 19lt0, through December 31, 19ltl; the breakdown between stocksand bonds la not available for earlier years
.
Preliminary.
Revised,
Table 5.- Purchases and Sales of Long-Term Foreign Securities by Foreigners
(In thousands of dollars; negative figures Indicate a net outflow of capital from the United States)
Calendar yearor month
Foreign stocks
Netpurchases
Foreign bonds
Netpurchases
Totalpurchases
Totalsales
Net purchasesof foreignsecurities
1935-ltl
19U219lt3
191*19115
19lt6
19W19U819U9
19U9-JulyAugust.. ..
September.
OctoberNovember..December. .
,
1950-JanuaryFebruary p,
March p. ...
23,27826,60137,328
65,2117
57,11881,71588,815
5,31lt
6,1606,687
9,27911,220
13,317
12,58913,98613,58lt
19,79122,078511,789
65,610te,55896,7ltli
70,788
5,51.0
5,lU0
6,561
7,918
9, "i32
8,9U
ll,!t55
8,83913,29lt
3, "187
It, 523-17,Wl
-363lit, 560-15,029
18,087
-226
1,020126
1,3611,7881,1103
l,13ll
5,llt7
290
1016,367
31U.262318, 113
755,936658, 7"tl
211,621321,2lt3
18,33317,861
33,235
70,01130,9892!l,0lt2
17,133133,028H.923
372,158225,2893117,269
U90,1»U6
6311,289
291, Wit311, It70
9,09li
111,898113,lilli
l8,lt6o
12,7ltl
15,012
23,868130,16889,080
n.a.7<t,209
88,973-29,156
265,11902ll,lt52
-79,803
9,773
9,2392,963
-80,179
51,551I8,2lt8
9,030
-6,7352,860
->t7,157
,008,188220,5331169,6115
3110,863355, Wtl
821,183715,859293,336Itl0,058
23,61i7
2k, 021
39,922
79,290U2,209
37,359
29,722llt7,011t
55,507
3,152,61i0
227,897391,9"t9
2117,367Ii02,058
556,056676,8lt7
388,168
382,258
lU,63li
20,038119,975
26,37822,17323,926
35,323139,007
102, 37k
855,5lt8
-7,36lt
77,69693,li96
-U6.617
265,12739,012
-911,832
27,800
9,0133,983
-80,053
52,91220,03613,'t33
-5,601
8,007-116,867
Hot available.Preliminary.

Juno 1950 53
CAPITAL MOVEMENTS
Section II - Sumnary by Countries
Table 1.- Net Movement of Capital and of Short-Term Banking Funds
(In thousands of dollars; negative figures Indicate a net outflow of capital fron the United States)
Country
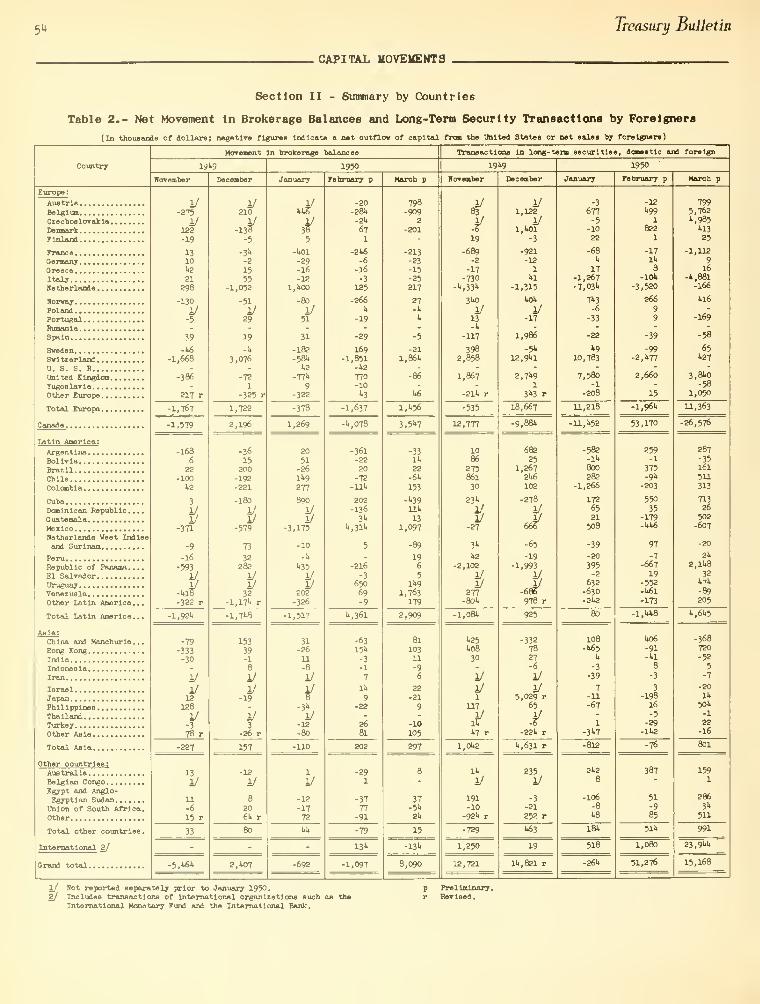
5* Treasury Bulletin
CAPITAL MOVEMENTS
Section II - Summary by Countries
Table 2.- Net Movement In Brokerage Balances and Long-Term Security Transactions by Foreigners
(In thousands of dollars; negative figures Indicate a net outflow of capital from the United States or net sales by foreigners)
1/ Not reported separately prior to January 1950.2/ Includes transactions of International organizations such as the
International Monetary Fund and the International Bank.
Preliminary.Revised.
Country

June mo55
CAPITAL MOVEMENTS
Section II - Summary by Countries
Table 3.- Short-Term Claims on
(Position at end of month
and Liabilities to Foreigners
In thousands of dollars
)
Country
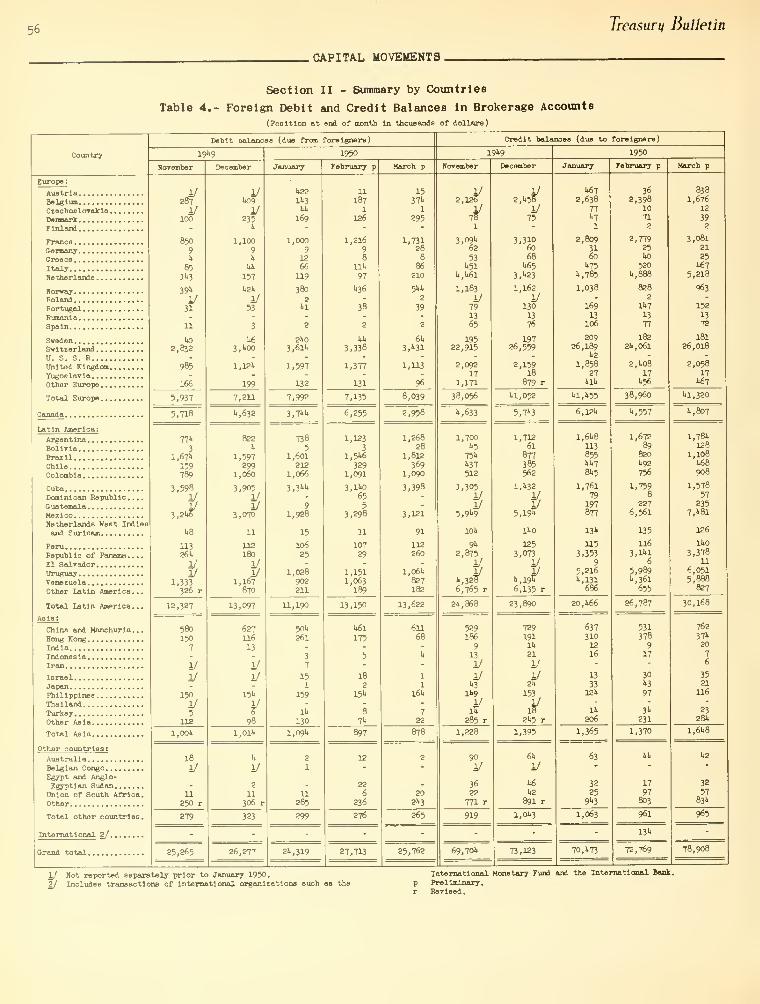
56 Treasury Bulletin
CAPITAL MOVEMENTS.
Section II - Summary by CountrieB
Table 4.- Foreign Debit and Credit Balances in Brokerage Accounts
(Position at end of month In thousands of dollars)
Country
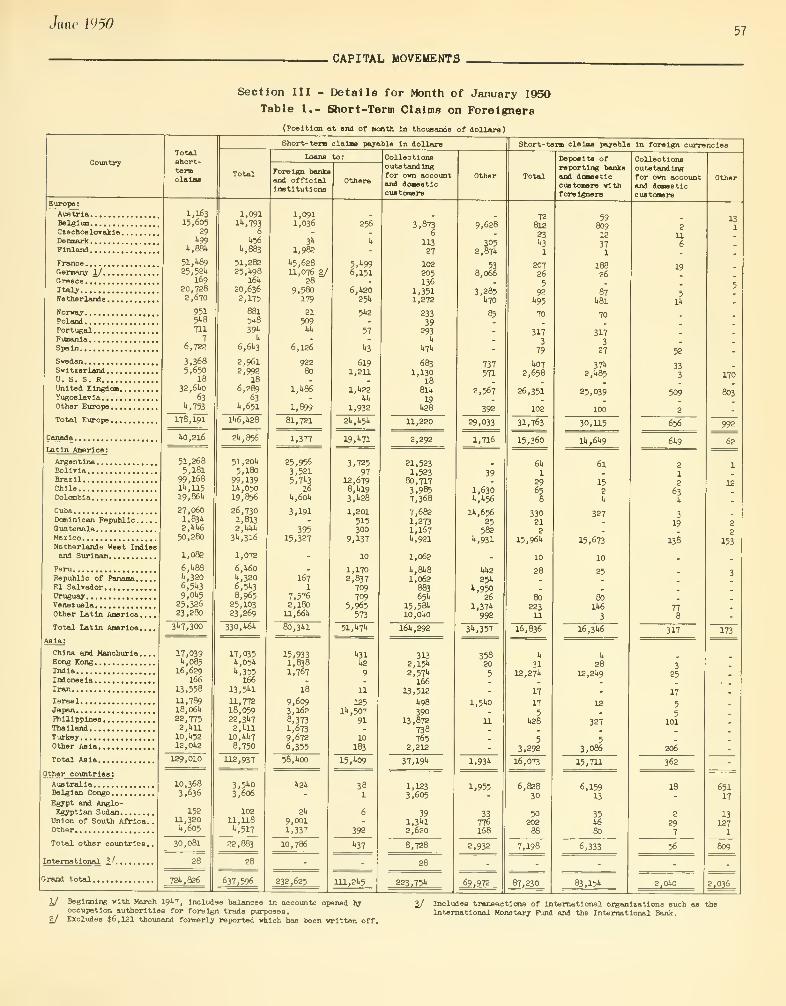
June mO57
CAPITAL MOVEMENTS
Section III - Details for Month of January 1950
Table 1.- Short-Term Claims on Foreigners
(Position at end of month In thousands of dollars)
Country

5* Treasury Bulletin
CAPITAL MOVEMENTS
Section III - Details for Month of January 1050
Table 2.- Short-Term Liabilities to Foreigners(Position at end of Booth In fto<—Bta of dollar*)
Country
Totalshort-
tarmliabili-ties
Short- tera liabilities payable in dollar*
To foreign banks and official Institutions
Ds posits
U.S. Trsaaury billsand oertlf-loatas
To all other foreigners
Dsposlts
U.S.ury billsand osrtlf'
loatss
Other
Short-term Uabllltlaa pay-abls In far»l*D onrrsnolss
To foreign>**^|Tf sod
offlolalInstitu-tion*
Toothers
Europe*
AustriaBelgianCzechoeloraklaDenmarkFinland
FranceGermany l/G roece
ItaljNetherlands
arvayPolandPortugalRumaniaSpain
SvedenSvi tierlandU. S. S. RUnited KingdomYugoslaviaOther Europe
Total Europe
Canada
Latin America:
ArgentinaBollrlaBrat 11ChileColombia
CubaDominican Republic..Guatemala. ..........Mexico
,
Netherlands Vest Indiesand Surinam
PeruRepublic of Panama ....El SalradorUruguayVenezuelaOther Latin America...
Total Latin America...
Asia:
China and Manchuria...Hong KongIndiaIndonesiaIran
IsraelJapanPhilippinesThailandTurkeyOther Asia
Total Asia
Other oountrlest
AustraliaBelgian CongoEgypt and Anglo-Egyptian SudanUnion of South Africa.Other
Total other countries.
International 2/
Grand total
U*,268123,89U17,70835,21823,805
152IU930
296177
766
1Ik
,326,7k0
,317,7U3
,330
kkl
,017
,99150k008
96,099507, "»39
609,1163
7,08258,">95
2,k82,322
919,3s 1*
210,1*213,911
161»,36?
57,52297,3">7
169,7U6
35,81625,752
l8lt,076
26,501
k8,707
73,80735,72362,293117,35763,356
1,386,14.3
110, lkk
89,89369,51112,21816,819
20,993238,766286,1252k,29511,958
101,k5k
982,176
29,78127,202
72,77922,92957,092
209,783
l,7k2,913
7,723,001
k3,3k566,82917,23023,60021,891
9k, 0591^6,9892k,6k5
276,930lk5,711
57,0835,367
3k,266k,955
7,833
90,569381,325
8,802
511,3156,02539,732
2,008,501
733,138
163,0505,276
131,9k029,88876,991
117,12619,29k12,86076,887
20,660
2k,98822,k92
27,83117,80669,30132,783
8k9,173
76,875k6,k256k, 59312,00k
11,509
17,926235, Okk267,0kk22,7677,161
7k,83k
836,182
25,9k726,691
68,32520,6okk9,k33
191,000
l,7k2,913
6,360,907
7,97352,61813,k5611,95019,891
7k, 53611.5,1191.
2k,622211,93k13k,2k8
22,3355,36k
3k,105k,953
7,579
27,kk928l,87k
8,798k86,5216,02332,058
1,613,781
178,029
160,1885,269
121,k6928,61676,527
115,78k
19,1328,182
75,902
11,655
2k,62022,2716,20616,3796k,67928,370
7&5,2k9
75,120k5,63862,92k11,86011,373
17,889231, k9326k,825
8,3087,100
66,291
802,821
25,13013,687
68,07720,593k6,78l
17k,268
352,107
3,906,255
31,3759,2783,0005,000
18,086
63,k2010,3k0
31,2k5
k3,000
26,996
19,98k
7,121
268,8k5
55k,160
»
250
3,800158
9,000
20,5001,000
2,5kl
37,30k
1,020
25
3,275
13,996
8,000
26,316
13,000
1,700
Ik, TOO
l,3kO,9kl
3,997k,933
77k
6,6502,000
l,k37l,k95
231,5761,123
3,5033
1612
25k
20,12072,k55
k
k,8l02
553
125,875
9k9
2,8077
10,kn1,272k6k
1,092162878827
368221
1,125k27
k,622
1,872
26,620
735787
1,669119136
37276
2,219k63615k3
7,Ok5
817k
2k811
952
2,032
k9 ,865
2,2k2,266 212,386
87956,816
k59
11,6091,91k
58,0292,7k5
5,67019,80331,575
19,3576k9
5,7061,5*06,156
5,51112k, lk8
61160,lk01,057
I8,7k9
k33,123
182,522
k7,0538,63k
32,kl2
27,63320,356
52,61716,52212,892
106,959
5,8kl
23,71651,3117,892
kk,125k7,909
30,569
536,kkl
33,268k3,233k,565
2095,310
3,0633,65518,876l,kl£k,797
25,921
lkk,313
3,k62
511
k,k51
2,1887,568
18,180
1,31k, 579
8k555,k05
k58
9,3181,91k
55,3982,5655,555
19,k2928,722
19,0616k6
5,509l,5k06,098
5,392103,576
611k3,8921,056
18,682
385,672
163,996
k6,88k
8,63332,09227,31520,333
52,08816,52212,870
100,887
5,5kl
23,55035,0507,131
kO,837k7,607
30,019
507,359
32,607k2,978k,220205
5,225
3,0503,k56
18,367l,kl6k,785
25,389
IW.,898
2,902511
k,k51
2,1277,229
17,220
1,816, lk5
211,328
1,78k
2,599126Ilk2k2
2,8kO
296
23
55
11710,969
lk,7k9
6k
35,327
I8,k39
92
2222
300
6,003
300
100lk,690
1,270300371
23,k70
lko
1
82
lk6
375
515
60192
767
78,378
13831
507
325*1
13213
317k
2
9,603
l,k99
1
3
12,12k
87
771
29829623
229
22
69
66
1,571761
2,0182
179
5,612
32125k263
k
85
13
193509
12386
2,0k0
k5
1lk7
193
20,056
kk2k9
199
2386210kk
11
199
19
191,966
2138,008
Ik
ko,698
3,70k
»1
15
1
230
3k
362lk7
k
829
1
235353
5
k
67205112
699
1,681
372
3
13791
603
k7,515
201
199
2216
10Ik
1
111
18
191,67k
2137,560
Ik
39,799
1,273
3k
1
151
38
361lk7
k
60k
1
1903k9
5
k
67205
699
1,520
372
2
13791
602
k3,798
kk
k8
17
2
30
8
91
292
kk8
899
2,k31
25
3
192
225
k5
k
161
3,717
1/ Beginning vlth March 19k7, includes balances in accounts opened byoccupation authorities for foreign trade purposes.
2/ Includes transactions of International organizations such as the
International Monetary Fund and the International Bank.

June W50 59
CAPITAL MOVEMENTS
Section III - Details for Month of January 1950
Table 3.- Purchases and Sales of Long-Term Securities by Foreigners
(In thousands of dollars)
Includes transactions of International organizations such as the
International Monetary Fund and the International Bank.
Country
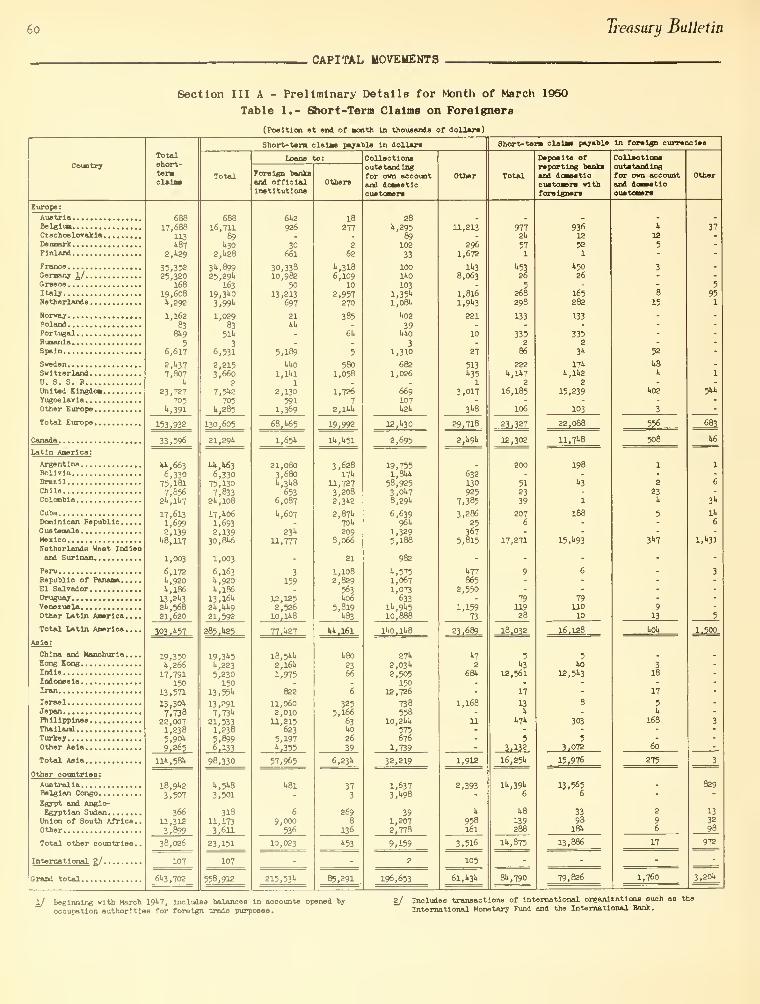
60 Treasury Bulletin
CAPITAL MOVEMENTS
Section III A - Preliminary Details for Month of March 1950
Table 1.- Short-Term Claims on Foreigners
(Position at end of Booth In thousands of dollars)
Country
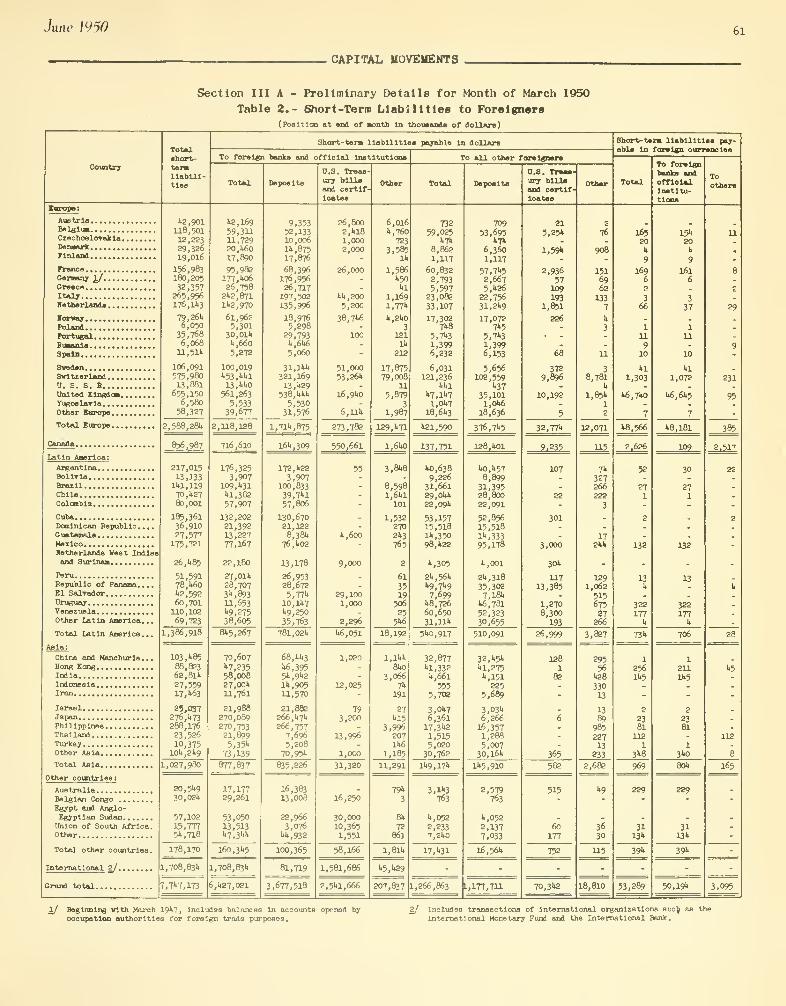
Jane mO 61
CAPITAL MOVEMENTS
Section III A - Preliminary Details for Month of March 1950
Table 2.- Short-Term Liabilities to Foreigners(Position at end of Month In thousands of dollars)
Country
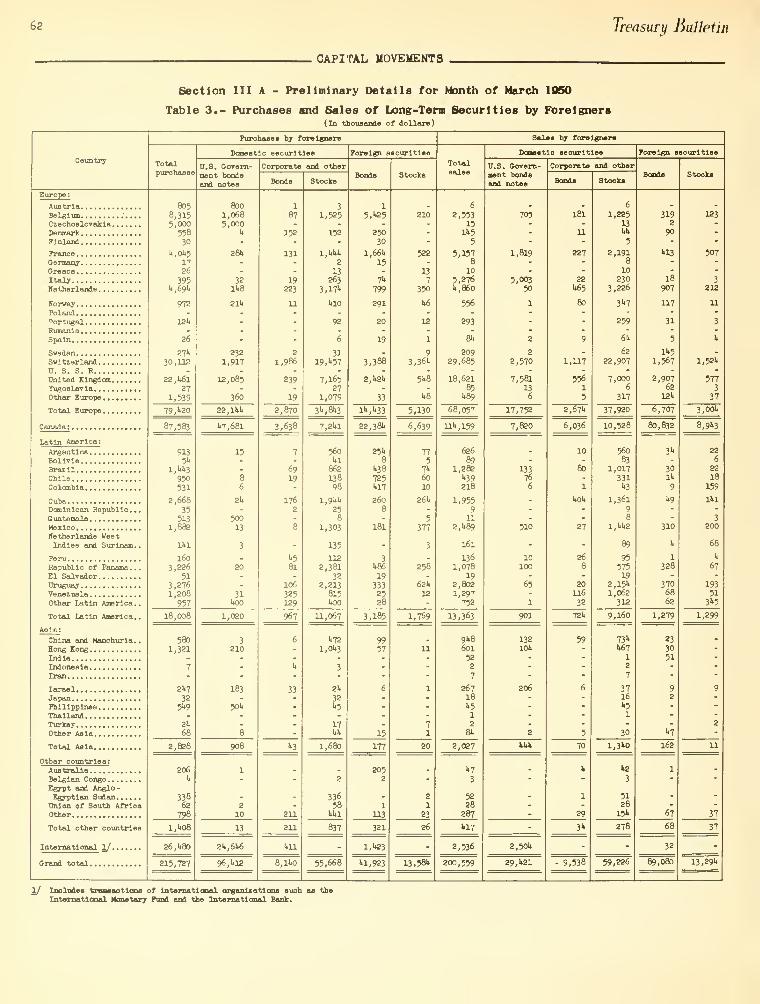
62 Treasury Bulletin
CAPITAL MOVEMENTS
Section III A - Preliminary Details for Month of March 1060
Table 3.- Purchases and Sales of Long-Tern Securities by Foreigners(In thousands of dollars)
Country
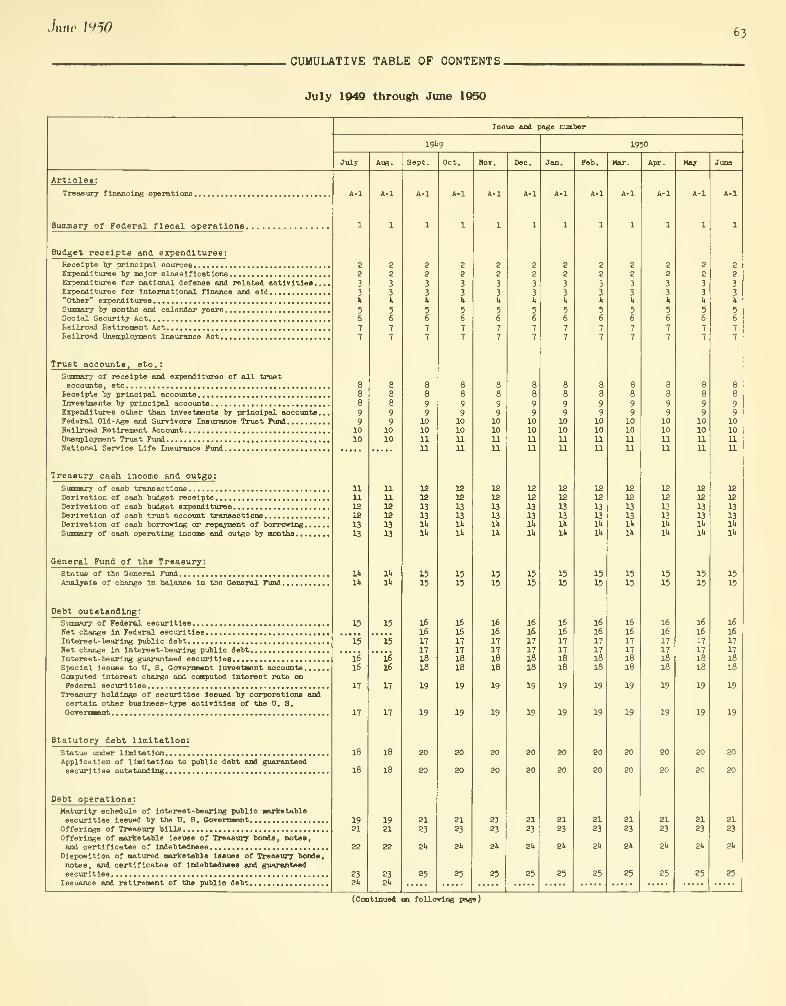
Juno mo 63
CUMULATIVE TABLE OF CONTENTS.
July 1940 through June 1950

6i+ Treasury Bulletin
CUMULATIVE TABLE OF CONTENTS.
July 1940 through June 1950 - (Continued)


BUYAND
HOLDUNITEDS TAT E S
SAVINGS
BONDS


Treas.
HJ10
.A2
1950c.2
U.S. Treasury Dept,
Treasury Bulletin