libqual canada - library.queensu.ca · revised 9/17/07 3 libqual canada contributors colleen cook...
TRANSCRIPT

Revised 9/17/07
1
LibQUAL Canada Revised 9/17/07 __________________________________________________________ Association of Research Libraries / Texas A&M University www.libqual.org

Revised 9/17/07
2

Revised 9/17/07
3
LibQUAL Canada Contributors Colleen Cook MaShana Davis Texas A&M University Association of Research Libraries Fred Heath Martha Kyrillidou University of Texas Association of Research Libraries BruceThompson Duane Webster Texas A&M University Association of Research Libraries
Revised 9/17/07
4
Association of Research Libraries 21 Dupont Circle NW Suite 800 Washington, DC 20036 Phone 202-296-2296 Fax 202-872-0884 http://www.libqual.org Copyright © 2007 Association of Research Libraries 59407-772-X (paperback) ISBN 1-59407-773-8 (PDF)

Revised 9/17/07
5
Table of Contents 1 Introduction..............................................................................................................................................................8
1.1 Acknowledgements .........................................................................................................................................8 1.2 LibQUAL+®: a Project from StatsQUAL™......................................................................................................9 1.3 LibQUAL+®: Defining and Promoting Library Service Quality......................................................................11 1.4 Web Access to Data......................................................................................................................................12 1.5 A Few Words about LibQUAL+® 2007 .........................................................................................................14
2 Respondents by Institution for LibQUAL Canada..............................................................................................23 3 Canadian Government Results for LibQual Canada..........................................................................................25
3.1 Demographics Summary...............................................................................................................................25 3.1.1 Population and Respondent Profiles by Standard Discipline....................................................................25 3.1.2 Respondent Profile by Age .......................................................................................................................26 3.1.3 Population and Respondent Profiles by Sex ............................................................................................26 3.1.4 Population and Respondent Profiles by Employment Status ...................................................................27 3.1.5 Respondent Profile by Level of Education................................................................................................28 3.1.6 Population and Respondent Profiles by Profession..................................................................................28 3.1.7 Population and Respondent Profiles by Internal Network ........................................................................29 3.1.8 Population and Respondent Profiles by Primary Access Method ............................................................30
3.2 Survey Item Summary...................................................................................................................................31 3.2.1 Core Question Summary ..........................................................................................................................31 3.2.2 Core Question Dimension Summary ........................................................................................................37 3.2.3 Local Questions Summary........................................................................................................................40 3.2.4 General Satisfaction Questions Summary................................................................................................42 3.2.5 Information Literacy Outcomes Questions Summary ...............................................................................43 3.2.6 Library Use Summary ...............................................................................................................................44
4 College or University Libraries Results for LibQual Canada............................................................................47 4.1 College or University Libraries - All ...............................................................................................................47
4.1.1 Respondents by User Group ....................................................................................................................47 4.1.2 Population and Respondent Profiles by User Sub-Group ........................................................................50 4.1.3 Population and Respondent Profiles by Standard Discipline....................................................................53 4.1.4 Respondent Profile by Age .......................................................................................................................56 4.1.5 Population and Respondent Profile by Sex ..............................................................................................57 4.1.6 Core Question Summary ..........................................................................................................................58 4.1.7 Core Question Dimension Summary ........................................................................................................65 4.1.8 Local Questions Summary........................................................................................................................69 4.1.9 General Satisfaction Questions Summary................................................................................................75 4.1.10 Information Literacy Outcomes Questions Summary ...............................................................................76 4.1.11 Library Use Summary ...............................................................................................................................77
4.2 College or University Libraries - Undergraduate ...........................................................................................80 4.2.1 Population and Respondent Profiles by Standard Discipline....................................................................80 4.2.2 Respondent Profile by Age .......................................................................................................................83 4.2.3 Population and Respondent Profile by Sex ..............................................................................................84 4.2.4 Core Question Summary ..........................................................................................................................85 4.2.5 Core Question Dimension Summary ........................................................................................................92 4.2.6 Local Questions Summary........................................................................................................................95 4.2.7 General Satisfaction Questions Summary..............................................................................................102 4.2.8 Information Literacy Outcomes Questions Summary .............................................................................102 4.2.9 Library Use Summary .............................................................................................................................104
4.3 College or University Libraries - Graduate ..................................................................................................107 4.3.1 Population and Respondent Profiles by Standard Discipline..................................................................107 4.3.2 Respondent Profile by Age .....................................................................................................................110 4.3.3 Population and Respondent Profile by Sex ............................................................................................111 4.3.4 Core Question Summary ........................................................................................................................112 4.3.5 Core Question Dimension Summary ......................................................................................................118 4.3.6 Local Questions Summary......................................................................................................................121 4.3.7 General Satisfaction Questions Summary..............................................................................................127 4.3.8 Information Literacy Outcomes Questions Summary .............................................................................128

Revised 9/17/07
6
4.3.9 Library Use Summary .............................................................................................................................129 4.4 College or University Libraries - Faculty .....................................................................................................132
4.4.1 Population and Respondent Profiles by Standard Discipline..................................................................132 4.4.2 Respondent Profile by Age .....................................................................................................................135 4.4.3 Population and Respondent Profile by Sex ............................................................................................136 4.4.4 Core Question Summary ........................................................................................................................137 4.4.5 Core Question Dimension Summary ......................................................................................................143 4.4.6 Local Questions Summary......................................................................................................................147 4.4.7 General Satisfaction Questions Summary..............................................................................................153 4.4.8 Information Literacy Outcomes Questions Summary .............................................................................154 4.4.9 Library Use Summary .............................................................................................................................155
4.5 College or University Libraries - Library Staff..............................................................................................158 4.5.1 Respondent Profile by Age .....................................................................................................................158 4.5.2 Population and Respondent Profile by Sex ............................................................................................159 4.5.3 Core Question Summary ........................................................................................................................160 4.5.4 Core Question Dimension Summary ......................................................................................................166 4.5.5 Local Questions Summary......................................................................................................................169 4.5.6 General Satisfaction Questions Summary..............................................................................................175 4.5.7 Information Literacy Outcomes Questions Summary .............................................................................176 4.5.8 Library Use Summary .............................................................................................................................177
4.6 College or University Libraries - Staff..........................................................................................................180 4.6.1 Respondent Profile by Age .....................................................................................................................180 4.6.2 Population and Respondent Profile by Sex ............................................................................................181 4.6.3 Core Question Summary ........................................................................................................................182 4.6.4 Core Question Dimension Summary ......................................................................................................188 4.6.5 Local Questions Summary......................................................................................................................192 4.6.6 General Satisfaction Questions Summary..............................................................................................198 4.6.7 Information Literacy Outcomes Questions Summary .............................................................................199 4.6.8 Library Use Summary .............................................................................................................................200
5 Community College Libraries Results for LibQual Canada............................................................................203 5.1 Community College Libraries - All ...............................................................................................................203
5.1.1 Respondents by User Group ..................................................................................................................203 5.1.2 Population and Respondent Profiles by User Sub-Group ......................................................................204 5.1.3 Population and Respondent Profiles by Standard Discipline..................................................................206 5.1.4 Respondent Profile by Age .....................................................................................................................207 5.1.5 Population and Respondent Profile by Sex ............................................................................................208 5.1.6 Core Question Summary ........................................................................................................................208 5.1.7 Core Question Dimension Summary ......................................................................................................211 5.1.8 Local Questions Summary......................................................................................................................213 5.1.9 General Satisfaction Questions Summary..............................................................................................214 5.1.10 Information Literacy Outcomes Questions Summary .............................................................................214 5.1.11 Library Use Summary .............................................................................................................................215
5.2 Community College Libraries – Student......................................................................................................216 5.2.1 Population and Respondent Profiles by Standard Discipline..................................................................216 5.2.2 Respondent Profile by Age .....................................................................................................................217 5.2.3 Population and Respondent Profile by Sex ............................................................................................217 5.2.4 Core Question Summary ........................................................................................................................218 5.2.5 Core Question Dimension Summary ......................................................................................................221 5.2.6 Local Questions Summary......................................................................................................................222 5.2.7 General Satisfaction Questions Summary..............................................................................................223 5.2.8 Information Literacy Outcomes Questions Summary .............................................................................224 5.2.9 Library Use Summary .............................................................................................................................225
5.3 Community College Libraries – Faculty ......................................................................................................226 5.3.1 Population and Respondent Profiles by Standard Discipline..................................................................226 5.3.2 Respondent Profile by Age .....................................................................................................................227 5.3.3 Population and Respondent Profile by Sex ............................................................................................228 5.3.4 Core Question Summary ........................................................................................................................229

Revised 9/17/07
7
5.3.5 Core Question Dimension Summary ......................................................................................................231 5.3.6 Local Questions Summary......................................................................................................................233 5.3.7 General Satisfaction Questions Summary..............................................................................................234 5.3.8 Information Literacy Outcomes Questions Summary .............................................................................234 5.3.9 Library Use Summary .............................................................................................................................234
5.4 Community College Libraries – Library Staff...............................................................................................236 5.4.1 Respondent Profile by Age .....................................................................................................................236 5.4.2 Population and Respondent Profile by Sex ............................................................................................236 5.4.3 Core Question Summary ........................................................................................................................236 5.4.4 Core Question Dimension Summary ......................................................................................................239 5.4.5 Local Questions Summary......................................................................................................................241 5.4.6 General Satisfaction Questions Summary..............................................................................................242 5.4.7 Information Literacy Outcomes Questions Summary .............................................................................242 5.4.8 Library Use Summary .............................................................................................................................242
5.5 Community College Libraries – Staff...........................................................................................................244 5.5.1 Respondent Profile by Age .....................................................................................................................244 5.5.2 Population and Respondent Profile by Sex ............................................................................................244 5.5.3 Core Question Summary ........................................................................................................................244 5.5.4 Core Question Dimension Summary ......................................................................................................247 5.5.5 Local Questions Summary......................................................................................................................249 5.5.6 General Satisfaction Questions Summary..............................................................................................250 5.5.7 Information Literacy Outcomes Questions Summary .............................................................................250 5.5.8 Library Use Summary .............................................................................................................................250
6 Appendix A: LibQUAL+® Dimensions ..............................................................................................................252
Revised 9/17/07
8
1 Introduction
1.1 Acknowledgements This notebook contains information from the 2007 administration of the LibQUAL+® protocol. The material on the following pages is drawn from the analysis of responses from the participating institutions collected in 2007.
The LibQUAL+® project requires the skills of a dedicated group. We would like to thank several members of the LibQUAL+® team for their key roles in the development of this service. From Texas A&M University, the qualitative leadership of Yvonna Lincoln has been key to the project's integrity. The behind-the-scenes roles of Bill Chollet and others from the library Systems and Training units were also formative in the early years. From the Association of Research Libraries, we are appreciative of the past contributions of Consuella Askew, Richard Groves, Amy Hoseth, Mary Jackson, Jonathan Sousa, and Benny Yu.
A New Measures initiative of this scope is possible only as the collaborative effort of many libraries. To the directors and liaisons at all participating libraries goes the largest measure of gratitude. Without your commitment, the development of LibQUAL+® would not have been possible. We would like to extend a special thank you to all administrators at the participating consortia and libraries that are making this project happen effectively across various institutions.
We would like to acknowledge the role of the Fund for the Improvement of Post-secondary Education (FIPSE), U.S. Department of Education, which provided grant funds of $498,368 over a three-year period (2001-03). We would also like to acknowledge the support of the National Science Foundation (NSF) for its grant of $245,737 over a three-year period (2002-04) to adapt the LibQUAL+® instrument for use in the science, math, engineering, and technology education digital library community, an assessment tool in development now called DigiQUAL. We would like to express our thanks for the financial support that has enabled the researchers engaged in this project to exceed all of our expectations in stated goals and objectives and deliver a remarkable assessment tool to the library community.
Colleen Cook MaShana Davis Texas A&M University Association of Research Libraries Fred Heath Martha Kyrillidou University of Texas Association of Research Libraries Bruce Thompson Duane Webster Texas A&M University Association of Research Libraries

Revised 9/17/07
9
1.2 LibQUAL+®: a Project from StatsQUAL™
I would personally like to say a word about the development of LibQUAL+® over the last few years and to thank the people that have been involved in this effort. LibQUAL+® would not have been possible without the many people who have offered their time and constructive feedback over the years for the cause of improving library services. In a sense, LibQUAL+® has built three kinds of partnerships: one between ARL and Texas A&M University, a second one among the participating libraries and their staff, and a third one comprising the thousands of users who have provided their valuable survey responses over the years. LibQUAL+® was initiated in 2000 as an experimental project for benchmarking perceptions of library service quality across 13 ARL libraries under the leadership of Fred Heath and Colleen Cook, then both at Texas A&M University Libraries. It matured quickly into a standard assessment tool that has been applied at more than 1,000 libraries, collecting information on more than half a million library users. Each year since 2003, we have had more than 200 libraries conduct LibQUAL+®, more than 100,000 users respond, and annually more than 50,000 users provide rich comments about the ways they use their libraries. There have been numerous advancements over the years. In 2005, libraries were able to conduct LibQUAL+® over a two session period (Session I: January to May and Session II: July to December). The LibQUAL+® servers were moved from Texas A&M University to an external hosting facility under the ARL brand known as StatsQUAL™. Through the StatsQUAL™ gateway we will continue to provide innovative tools for libraries to assess and manage their environments in the coming years. In 2006, we added the LibQUAL+® Analytics (for more information, see Section 1.6). LibQUAL+® findings have engaged thousands of librarians in discussions with colleagues and ARL on what these findings mean for local libraries, for their regions, and for the future of libraries across the globe. Consortia have supported their members’ participation in LibQUAL+® in order to offer an informed understanding of the changes occurring in their shared environment. Summary highlights have been published on an annual basis showcasing the rich array of information available through LibQUAL+®: LibQUAL+® 2006 Survey Highlights <http://www.libqual.org/documents/admin/LibQUALHighlights2006.pdf> LibQUAL+® 2005 Survey Highlights <http://www.libqual.org/documents/admin/LibQUALHighlights20051.pdf> LibQUAL+® 2004 Survey Highlights <http://www.libqual.org/documents/admin/ExecSummary%201.3.pdf> LibQUAL+® 2003 Survey Highlights <http://www.libqual.org/documents/admin/ExecSummary1.1_locked.pdf> Summary published reports have also been made available: <http://www.arl.org/pubscat/libqualpubs.html> The socio-economic and technological changes that are taking place around us are affecting the ways users interact with libraries. We used to think that libraries could provide reliable and reasonably complete access to published and

Revised 9/17/07
10
scholarly output, yet we now know from LibQUAL+® that users have an insatiable appetite for content. No library can ever have sufficient information content that would come close to satisfying this appetite. The team at ARL and beyond has worked hard to nurture the community that has been built around LibQUAL+®. We believe that closer collaboration and sharing of resources will bring libraries nearer to meeting the ever changing needs of their demanding users. It is this spirit of collaboration and a willingness to view the world of libraries as an organic, integrated, and cohesive environment that can bring forth major innovations and break new ground. Innovation and aggressive marketing of the role of libraries in benefiting their communities strengthen libraries. In an example of collaboration, LibQUAL+® participants are sharing their results within the LibQUAL+® community with an openness that nevertheless respects the confidentiality of each institution and its users. LibQUAL+® participants are actively shaping our Share Fair gatherings, our in-person events, and our understanding of how the collected data can be used. LibQUAL+® offers a rich resource that can be viewed using many lenses, should be interpreted in multiple ways, and is a powerful tool libraries can use to understand their environment. LibQUAL+® is a community mechanism for improving libraries and I hope we see an increasing number of libraries utilizing it successfully in the years to come. I look forward to your continuing active involvement in helping us understand the many ways we can improve library services. With warm regards, Martha Kyrillidou Director, ARL Statistics and Service Quality Programs
Revised 9/17/07
11
1.3 LibQUAL+®: Defining and Promoting Library Service Quality What is LibQUAL+®?
LibQUAL+® is a suite of services that libraries use to solicit, track, understand, and act upon users’ opinions of service quality. These services are offered to the library community by the Association of Research Libraries (ARL). The program’s centerpiece is a rigorously tested Web-based survey bundled with training that helps libraries assess and improve library services, change organizational culture, and market the library. The goals of LibQUAL+® are to:
• Foster a culture of excellence in providing library service • Help libraries better understand user perceptions of library service quality • Collect and interpret library user feedback systematically over time • Provide libraries with comparable assessment information from peer institutions • Identify best practices in library service • Enhance library staff members’ analytical skills for interpreting and acting on data
As of spring 2007, more than 1,000 libraries have participated in the LibQUAL+® survey, including Canadian government libraries, colleges and universities, community colleges, health sciences and hospital/medical libraries, law libraries, public libraries, and secondary school libraries---some through various consortia, others as independent participants. LibQUAL+® has expanded internationally, with participating institutions in Canada, the U.K. and other European countries as well as Australia and South Africa. It has been translated into a number of languages, including Afrikaans, Chinese (Traditional), Danish, Dutch, Finnish, French, German, Norwegian, and Swedish. The growing LibQUAL+® community of participants and its extensive dataset are rich resources for improving library services. How will LibQUAL+® benefit your library?
Library administrators have successfully used LibQUAL+® survey data to identify best practices, analyze deficits, and effectively allocate resources. Benefits to participating institutions include:
• Institutional data and reports that enable you to assess whether your library services are meeting user expectations
• Aggregate data and reports that allow you to compare your library’s performance with that of peer institutions • Workshops designed for participants • Access to an online library of LibQUAL+® research articles • The opportunity to become part of a community interested in developing excellence in library services
LibQUAL+® gives your library users a chance to tell you where your services need improvement so you can respond to and better manage their expectations. You can develop services that better meet your users’ expectations by comparing your library’s data with that of peer institutions and examining the practices of those libraries that are evaluated highly by their users. How is the LibQUAL+® survey conducted?
Conducting the LibQUAL+® survey requires little technical expertise on your part. You invite your users to take the survey by distributing the URL for your library’s Web form via e-mail. Respondents complete the survey form and their
Revised 9/17/07
12
answers are sent to a central database. The data are analyzed and presented to you in reports describing your users’ desired, perceived, and minimum expectations of service.
What are the origins of the LibQUAL+® survey?
The LibQUAL+® survey evolved from a conceptual model based on the SERVQUAL instrument, a popular tool for assessing service quality in the private sector. The Texas A&M University Libraries and other libraries used modified SERVQUAL instruments for several years; those applications revealed the need for a newly adapted tool that would serve the particular requirements of libraries. ARL, representing the largest research libraries in North America, partnered with Texas A&M University Libraries to develop, test, and refine LibQUAL+®. This effort was supported in part by a three-year grant from the U.S. Department of Education’s Fund for the Improvement of Post-Secondary Education (FIPSE).
1.4 Web Access to Data A working knowledge of how to read and derive relevant information from the tables and charts used in your LibQUAL+® results notebook is essential. In addition to the explanatory text below, you can find a self-paced tutorial on the project web site at:
<http://www.libqual.org/Information/Tools/index.cfm>
Both the online tutorial and the text below are designed to help you understand your survey results and present and explain those results to others at your library. Radar Charts
Radar charts are commonly used throughout the following pages to display both aggregate results and results from individual institutions. Basic information about radar charts is outlined below, and additional descriptive information is included throughout this notebook. What is a radar chart? Radar charts are useful when you want to look at several different factors all related to one item. Sometimes called “spider charts” or “polar charts”, radar charts feature multiple axes or “spokes” along which data can be plotted. Variations in the data are shown by distance from the center of the chart. Lines connect the data points for each series, forming a spiral around the center. In the case of the LibQUAL+® survey results, each axis represents a different survey question. Questions are identified by a code at the end of each axis. The three dimensions measured by the survey are grouped together on the radar charts, and each dimension is labeled: Affect of Service (AS), Information Control (IC), and Library as Place (LP). Radar charts are used in this notebook to present the item summaries (the results from the 22 core survey questions). How to read a radar chart Radar charts are an effective way to show strengths and weaknesses graphically by enabling you to observe symmetry or uniformity of data. Points close to the center indicate a low value, while points near the edge indicate a high value. When interpreting a radar chart, it is important to check each individual axis as well as the chart’s overall shape in order to gain a complete understanding of its meaning. You can see how much data fluctuates by observing whether the spiral is smooth or has spikes of variability.

Revised 9/17/07
13
Respondents’ minimum, desired, and perceived levels of service quality are plotted on each axis of your LibQUAL+® radar charts. The resulting “gaps” between the three levels are shaded in blue, yellow, green, and red. Generally, a radar graph shaded blue and yellow indicates that users’ perceptions of service fall within the “zone of tolerance”; the distance between minimum expectations and perceptions of service quality is shaded in blue, and the distance between their desired and perceived levels of service quality is shown in yellow. When users’ perceptions fall outside the “zone of tolerance,” the graph will include areas of red and green shading. If the distance between users’ minimum expectations and perceptions of service delivery is represented in red, that indicates a negative service adequacy gap score. If the distance between the desired level of service and perceptions of service delivery is represented in green, that indicates a positive service superiority gap score. Means
The mean of a collection of numbers is their arithmetic average, computed by adding them up and dividing by their total number. In this notebook, means are provided for users’ minimum, desired, and perceived levels of service quality for each item on the LibQUAL+® survey. Means are also provided for the general satisfaction and information literacy outcomes questions. Standard Deviation
Standard deviation is a measure of the spread of data around their mean. The standard deviation (SD) depends on calculating the average distance of each score from the mean. In this notebook, standard deviations are provided for every mean presented in the tables. Service Adequacy
The service adequacy gap score is calculated by subtracting the minimum score from the perceived score on any given question, for each user. Both means and standard deviations are provided for service adequacy gap scores on each item of the survey, as well as for each of the three dimensions of library service quality. In general, service adequacy is an indicator of the extent to which you are meeting the minimum expectations of your users. A negative service adequacy gap score indicates that your users’ perceived level of service quality is below their minimum level of service quality and is printed in red.
Service Superiority
The service superiority gap score is calculated by subtracting the desired score from the perceived score on any given question, for each user. Both means and standard deviations are provided for service superiority gap scores on each item of the survey, as well as for each of the three dimensions of library service quality. In general, service superiority is an indicator of the extent to which you are exceeding the desired expectations of your users. A positive service superiority gap score indicates that your users’ perceived level of service quality is above their desired level of service quality and is printed in green.
Sections with charts and tables are omitted from the following pages when there are three or fewer individuals in a specific group.

Revised 9/17/07
14
In consortia notebooks, institution type summaries are not shown if there is only one library for an institution type. Individual library notebooks are produced separately for each participant.
1.5 A Few Words about LibQUAL+® 2007 Libraries today confront escalating pressure to demonstrate impact. As Cullen (2001) has noted,
Academic libraries are currently facing their greatest challenge since the explosion in tertiary education and academic publishing which began after World War II... [T]he emergence of the virtual university, supported by the virtual library, calls into question many of our basic assumptions about the role of the academic library, and the security of its future. Retaining and growing their customer base, and focusing more energy on meeting their customers' expectations is the only way for academic libraries to survive in this volatile environment. (pp. 662-663)
Today, "A measure of library quality based solely on collections has become obsolete" (Nitecki, 1996, p. 181). These considerations have prompted the Association of Research Libraries (ARL) to sponsor a number of "New Measures" initiatives. The New Measures efforts represent a collective determination on the part of the ARL membership to augment the collection-count and fiscal input measures that comprise the ARL Index and ARL Statistics, to date the most consistently collected statistics for research libraries, with outcome measures such as assessments of service quality and satisfaction. One New Measures Initiative is the LibQUAL+® service (Cook, Heath & B. Thompson, 2002, 2003; Heath, Cook, Kyrillidou & Thompson, 2002; Thompson, Cook & Heath, 2003; Thompson, Cook & Thompson, 2002). Within a service-quality assessment model, "only customers judge quality; all other judgments are essentially irrelevant" (Zeithaml, Parasuraman, Berry, 1990, p. 16). LibQUAL+® was modeled on the 22-item SERVQUAL tool developed by Parasuraman, Berry and Zeithaml (Parasuraman, Berry & Zeithaml, 1991). However, SERVQUAL has been shown to measure some issues not particularly relevant in libraries, and to not measure some issues of considerable interest to library users. The final 22 LibQUAL+® items were developed through several iterations of studies involving a larger pool of 56 items. The selection of items employed in the LibQUAL+® survey has been grounded in the users' perspective as revealed in a series of qualitative studies involving a larger pool of items. The items were identified following qualitative research interviews with student and faculty library users at several different universities (Cook, 2002a; Cook & Heath, 2001). LibQUAL+® is not just a list of 22 standardized items. First, LibQUAL+® offers libraries the ability to select five optional local service quality assessment items. Second, the survey includes a comments box soliciting open-ended user views. Almost half of the people responding to the LibQUAL+® survey provide valuable feedback through the comments box. These open-ended comments are helpful for not only (a) understanding why users provide certain ratings, but also (b) understanding what policy changes users suggest, because many users feel the obligation to be constructive. Participating libraries are finding the real-time access to user comments one of the most useful devices in challenging library administrators to think outside of the box and develop innovative ways for improving library services. LibQUAL+® is one of 11 ways of listening to users, called a total market survey. As Berry (1995) explained,

Revised 9/17/07
15
When well designed and executed, total market surveys provide a range of information unmatched by any other method... A critical facet of total market surveys (and the reason for using the word 'total') is the measurement of competitors' service quality. This [also] requires using non-customers in the sample to rate the service of their suppliers. (p. 37)
Although (a) measuring perceptions of both users and non-users, and (b) collecting perceptions data with regard to peer institutions can provide important insights Berry recommended using multiple listening methods and emphasized that "Ongoing data collection... is a necessity. Transactional surveys, total market surveys, and employee research should always be included" (Berry, 1995, p. 54). Score Scaling
"Perceived" scores on the 22 LibQUAL+® core items, the three subscales, and the total score, are all scaled 1 to 9, with 9 being the most favorable. Both the gap scores ("Adequacy" = "Perceived" - "Minimum"; "Superiority" = "Perceived" - "Desired") are scaled such that higher scores are more favorable. Thus, an adequacy gap score of +1.2 on an item, subscale, or total score is better than an adequacy gap score of +1.0. A superiority gap score of -0.5 on an item, subscale, or total score is better than a superiority gap score of -1.0. Using LibQUAL+® Data
In some cases LibQUAL+® data may confirm prior expectations and library staff will readily formulate action plans to remedy perceived deficiencies. But in many cases library decision-makers will seek additional information to corroborate interpretations or to better understand the dynamics underlying user perceptions. For example, once an interpretation is formulated, library staff might review recent submissions of users to suggestion boxes to evaluate whether LibQUAL+® data are consistent with interpretations, and the suggestion box data perhaps also provide user suggestions for remedies. User focus groups also provide a powerful way to explore problems and potential solutions. A university-wide retreat with a small-group facilitated discussion to solicit suggestions for improvement is another follow-up mechanism that has been implemented in several LibQUAL+® participating libraries. Indeed, the open-ended comments gathered as part of LibQUAL+® are themselves useful in fleshing out insights into perceived library service quality. Respondents often use the comments box on the survey to make constructive suggestions on specific ways to address their concerns. Qualitative analysis of these comments can be very fruitful. In short, LibQUAL+® is not 22 items. LibQUAL+® is 22 items plus a comments box
Cook (2002b) provided case study reports of how staff at various libraries have employed data from prior renditions of LibQUAL+®. Heath, Kyrillidou, and Askew edited a special issue of the Journal of Library Administration (Vol. 40, No. 3/4) reporting additional case studies on the use of LibQUAL+® data to aid the improvement of library service quality. This special issue has also been published by Hayworth Press as a monograph. These publications can be ordered by sending an email to [email protected]. 2007 Data Screening
The 22 LibQUAL+® core items measure perceptions of total service quality, as well as three sub-dimensions of perceived library quality: (a) Service Affect (9 items, such as "willingness to help users"); (b) Information Control (8 items, such as "a library Web site enabling me to locate information on my own" and "print and/or electronic journal collections I require for my work"); and (c) Library as Place (5 items, such as "a getaway for study, learning, or research").

Revised 9/17/07
16
However, as happens in any survey, in 2007 some users provided incomplete data, inconsistent data, or both. In compiling the summary data reported here, several criteria were used to determine which respondents to omit from these analyses. 1. Complete Data. The Web software that presents the 22 core items monitors whether a given user has completed all items. On each of these items, in order to submit the survey successfully, users must provide a rating of (a) minimally-acceptable service, (b) desired service, and (c) perceived service or rate the item "not applicable" ("NA"). If these conditions are not met, when the user attempts to leave the Web page presenting the 22 core items, the software shows the user where missing data are located, and requests complete data. The user may of course abandon the survey without completing all the items. Only records with complete data on the 22 items and where respondents chose a "user group," if applicable, were retained in summary statistics. 2. Excessive "NA" Responses. Because some institutions provided access to a lottery drawing for an incentive (e.g., a Palm PDA) for completing the survey, some users might have selected "NA" choices for all or most of the items rather than reporting their actual perceptions. Or, some users may have views on such a narrow range of quality issues that their data are not very informative. In this survey it was decided that records containing more than 11 "NA" responses should be eliminated from the summary statistics. 3. Excessive Inconsistent Responses. On the LibQUAL+® survey, user perceptions can be interpreted by locating "perceived" results within the "zone of tolerance" defined by data from the "minimum" and the "desired" ratings. For example, a mean "perceived" rating of 7.5 on the 1-to-9 (9 is highest) scale might be very good if the mean "desired" rating is 6.0. But a 7.5 perception score is less satisfactory if the mean "desired" rating is 8.6, or if the mean "minimum" rating is 7.7. One appealing feature of such a "gap measurement model" is that the rating format provides a check for inconsistencies (i.e., score inversions) in the response data (Thompson, Cook & Heath, 2000). Logically, on a given item the "minimum" rating should not be higher than the "desired" rating on the same item. For each user a count of such inconsistencies, ranging from "0" to "22," was made. Records containing more than 9 logical inconsistencies were eliminated from the summary statistics. LibQUAL+® Norms
An important way to interpret LibQUAL+® data is by examining the zones of tolerance for items, the three subscale scores, and the total scores. However, the collection of such a huge number of user perceptions has afforded us with the unique opportunity to create norms tables that provide yet another perspective on results. Norms tell us how scores "stack up" within a particular user group. For example, on the 1-to-9 (9 is highest) scale, users might provide a mean "perceived" rating of 6.5 on an item, "the printed library materials I need for my work." The same users might provide a mean rating on "minimum" for this item of 7.0, and a mean service-adequacy "gap score" (i.e., "perceived" minus "minimum") of -0.5.
The zone-of-tolerance perspective suggests that this library is not doing well on this item, because "perceived" falls below "minimally acceptable." This is important to know. But there is also a second way (i.e., normatively) to interpret the data. Both perspectives can be valuable. A total market survey administered to more than 100,000 users, as was LibQUAL+® in 2004 and 2005, affords the opportunity to ask normative questions such as, "How does a mean 'perceived' score of 6.5 stack up among all

Revised 9/17/07
17
individual users who completed the survey?", or "How does a mean service-adequacy gap score of -0.5 stack up among the gap scores of all institutions participating in the survey?" If 70 percent of individual users generated "perceived" ratings lower than 6.5, 6.5 might not be so bad. And if 90 percent of institutions had service-adequacy gap scores lower than -0.5 (e.g., -0.7, -1.1), a mean gap score of -0.5 might actually be quite good. Users simply may have quite high expectations in this area. They may also communicate their dissatisfaction by rating both (a) "perceived" lower and (b) "minimum" higher. This does not mean that a service-adequacy gap score of -0.5 is necessarily a cause for celebration. But a service-adequacy gap score of -0.5 on an item for which 90 percent of institutions have a lower gap score is a different gap score than the same -0.5 for a different item in which 90 percent of institutions have a higher service-adequacy gap score. Only norms give us insight into this comparative perspective. And a local user-satisfaction survey (as against a total market survey) can never provide this insight. Common Misconception Regarding Norms. An unfortunate and incorrect misconception is that norms make value statements. Norms do not make value statements Norms make fact statements. If you are a forest ranger, and you make $25,000 a year, a norms table might inform you of the fact that you make less money than 85 percent of the adults in the United States.
But if you love the outdoors, you do not care very much about money, and you are very service-oriented, this fact statement might not be relevant to you. Or, in the context of your values, you might interpret this fact as being quite satisfactory. LibQUAL+® Norms Tables. Of course, the fact statements made by the LibQUAL+® norms are only valuable if you care about the dimensions being evaluated by the measure. More background on LibQUAL+® norms is provided by Cook and Thompson (2001), and Cook, Heath and B. Thompson (2002). LibQUAL+® norms for earlier years are available on the Web at the following URLs:
<http://www.coe.tamu.edu/~bthompson/libq2005.htm> <http://www.coe.tamu.edu/~bthompson/libq2004.htm>
Response Rates
At the American Library Association (ALA) Midwinter Meeting in San Antonio in January 2000, participants were cautioned that response rates on the final LibQUAL+® survey would probably range from 25-33 percent. Higher response rates can be realized (a) with shorter surveys that (b) are directly action-oriented (Cook, Heath & R.L. Thompson, 2000). For example, a very high response rate could be realized by a library director administering the following one-item survey to users:
Instructions. Please tell us what time to close the library every day. In the future we will close at whatever time receives the most votes. Should we close the library at?
(A) 10 p.m. (B) 11 p.m. (C) midnight (D) 2 p.m.

Revised 9/17/07
18
Lower response rates will be expected for total market surveys measuring general perceptions of users across institutions, and when an intentional effort is made to solicit perceptions of both users and non-users. Two considerations should govern the evaluation of LibQUAL+® response rates. Minimum Response Rates. Response rates are computed by dividing the number of completed surveys at an institution by the number of persons asked to complete the survey. However, we do not know the actual response rates on LibQUAL+®, because we do not know the correct denominators for these calculations. For example, given inadequacy in records at schools, we are not sure how many e-mail addresses for users are accurate. And we do not know how many messages to invite participation were actually opened. In other words, what we know for LibQUAL+® is the "lower-bound estimate" of response rates. For example, if 200 out of 800 solicitations result in completed surveys, we know that the response rate is at least 25 percent. But because we are not sure whether 800 e-mail addresses were correct or that 800 e-mail messages were opened, we are not sure that 800 is the correct denominator. The response rate involving only correct e-mail addresses might be 35 or 45 percent. We don't know the exact response rate. Representativeness Versus Response Rate. If 100 percent of the 800 people we randomly selected to complete our survey did so, then we can be assured that the results are representative of all users. But if only 25 percent of the 800 users complete the survey, the representativeness of the results is not assured. Nor is unrepresentativeness assured. Representativeness is actually a matter of degree. And several institutions each with 25 percent response rates may have data with different degrees of representativeness. We can never be sure about how representative our data are as long as not everyone completes the survey. But we can at least address this concern by comparing the demographic profiles of survey completers with the population (Thompson, 2000). At which university below would one feel more confident that LibQUAL+® results were reasonably representative?
Alpha University Completers (n=200 / 800) Population (N=16,000) Gender Gender Students 53% female Students 51% female Faculty 45% female Faculty 41% female Disciplines Disciplines Liberal Arts 40% Liberal Arts 35% Science 15% Science 20% Other 45% Other 45% Omega University Completers (n=200 / 800) Population (N=23,000) Gender Gender Students 35% female Students 59% female Faculty 65% female Faculty 43% female Disciplines Disciplines Liberal Arts 40% Liberal Arts 15% Science 20% Science 35% Other 40% Other 50%

Revised 9/17/07
19
The persuasiveness of such analyses is greater as the number of variables used in the comparisons is greater. The LibQUAL+® software has been expanded to automate these comparisons and to output side-by-side graphs and tables comparing sample and population profiles for given institutions. Show these to people who question result representativeness. However, one caution is in order regarding percentages. When total n is small for an institution, or within a particular subgroup, huge changes in percentages can result from very small shifts in numbers. LibQUAL+® Interactive Statistics
In addition to the institution and group notebooks and the norms, LibQUAL+® has also provided an interactive environment for data analysis where institutions can mine institutional data for peer comparisons in 2003 and 2004. The LibQUAL+® Interactive Statistics for these years includes graphing capabilities for all LibQUAL+® scores (total and dimension scores) for each individual institution or groups of institutions. Graphs may be generated in either JPEG format for presentation purposes or flash format that includes more detailed information for online browsing. Tables may also be produced in an interactive fashion for one or multiple selections of variables for all individual institutions or groups of participating institutions. To access the LibQUAL+® Interactive Statistics online, go to:
<http://www.libqual.org/Manage/Results/index.cfm>
LibQUAL+® Analytics
The LibQUAL+® Analytics is a new tool that permits participants to dynamically create institution-specific tables and charts for different subgroups and across years. The current interface grants access to 2004-2006 statistical data and has two sections:
(a) Institution Explorer includes a summary of all questions and dimension means for any combination of user groups and disciplines.
(b) Longitudinal Analysis allows participants to perform longitudinal comparisons of their data across
survey years.
These two functionalities are only the beginning of our effort to provide more customized analysis. More features are in development based on feedback we receive from our participants. Survey Data
In addition to the notebooks, the norms, the Interactive Statistics, and the Analytics, LibQUAL+® also makes available (a) raw survey data in SPSS at the request of participating libraries, and (b) raw survey data in Excel for all participating libraries. Additional training using the SPSS data file is available as a follow-up workshop and through the Service Quality Evaluation Academy (see below), which also offers training on analyzing qualitative data. The survey comments are also downloadable in Excel format from the Web site. ARL Service Quality Evaluation Academy
LibQUAL+® is an important tool in the New Measures toolbox that librarians can use to improve service quality. But, even more fundamentally, the LibQUAL+® initiative is more than a single tool. LibQUAL+® is an effort to create a culture of data-driven service quality assessment and service quality improvement within libraries. Such a culture must be informed by more than one tool, and by more than only one of the 11 ways of listening to users. To facilitate a culture of service quality assessment, and to facilitate more informed usage of LibQUAL+® data,
Revised 9/17/07
20
the Association of Research Libraries has created the ARL Service Quality Evaluation Academy. For more information about the Academy, see the LibQUAL+® events page at
<http://www.libqual.org/Events/index.cfm>
The intensive, five-day Academy teaches both qualitative and quantitative skills that library staff can use to evaluate and generate service-quality assessment information. The Academy is one more resource for library staff who would like to develop enhanced service-quality assessment skills. For more information, about LibQUAL+® or the Association of Research Libraries’ Statistics and Measurement program, see:
<http://www.libqual.org/> <http://www.statsqual.org/> <http://www.arl.org/stats/>
References
Berry, L.L. (1995). On great service: A framework for action. New York: The Free Press. Cook, C.C., Heath F., Thompson, B. LibQUAL+® from the UK Perspective. 5th Northumbria International Conference
Proceedings, Durham, UK, July, 2003. Cook, C.C. (2002a). A mixed-methods approach to the identification and measurement of academic library service
quality constructs: LibQUAL+®. (Doctoral dissertation, Texas A&M University, 2001). Dissertation Abstracts International, 62: 2295A. (University Microfilms No. AAT3020024)
Cook, C. (Guest Ed.). (2002b). Library decision-makers speak to their uses of their LibQUAL+® data: Some
LibQUAL+® case studies. Performance Measurement and Metrics, 3. Cook, C., & Heath, F. (2001). Users' perceptions of library service quality: A "LibQUAL+®" qualitative study. Library
Trends, 49: 548-584. Cook, C., Heath, F. & Thompson, B. (2002). Score norms for improving library service quality: A LibQUAL+® study.
portal: Libraries and the Academy, 2: 13-26. Cook, C., Heath, F. & Thompson, B. (2003). "Zones of tolerance" in perceptions of library service quality: A
LibQUAL+® study. portal: Libraries and the Academy, 3: 113-123. Cook, C., Heath, F., & Thompson, R.L. (2000). A meta-analysis of response rates in Web- or Internet-based surveys.
Educational and Psychological Measurement, 60: 821-836. Cook, C., & Thompson, B. (2001). Psychometric properties of scores from the Web-based LibQUAL+® study of
perceptions of library service quality. Library Trends, 49: 585-604. Cullen, R. (2001). Perspectives on user satisfaction surveys. Library Trends, 49: 662-686. Heath, F., Kyrillidou, M. & Askew, C.A. (Guest Eds.). (2004). Libraries report on their LibQUAL+® findings: From Data
to Action. Journal of Library Administration (40) 3/4 (2004).
Revised 9/17/07
21
Heath, F., Cook, C., Kyrillidou, M., & Thompson, B. (2002). ARL Index and other validity correlates of LibQUAL+® scores. portal: Libraries and the Academy, 2: 27-42.
Kyrillidou, M. (2005). The globalization of library assessment and the role of LibQUAL+®. From library science to
information science: studies in honor of G. Kakouri (Athens, Greece: Tipothito-Giorgos Dardanos, 2005). [in Greek]
Kyrillidou, M. (2005/2006). Library assessment as a collaborative enterprise. Resource Sharing and Information
Networks, 18 ½: 73-87. Kyrillidou, M. (2006). Measuring library service quality: A perceived outcome for libraries. In Peter Hernon (Ed.),
Robert E. Dugan (Ed.), and Candy Schwartz (Ed.), Revisiting Outcomes Assessment in Higher Education (pp. 351-366). Westport, CT: Library Unlimited.
Kyrillidou, M., Olshen, T., Heath, F., Bonnelly, C., and Cote, J. P. Cross-cultural implementation of LibQUAL+®: the
French language experience. 5th Northumbria International Conference Proceedings, Durham, UK, July, 2003.
Kyrillidou, M. and Young, M. (2005). ARL Statistics 2003-04. Washington, DC: Association of Research Libraries. Nitecki, D.A. (1996). Changing the concept and measure of service quality in academic libraries. The Journal of
Academic Librarianship, 22: 181-190. Parasuraman, A., Berry, L.L., and Zeithaml, V.A. (1991). Refinement and reassessment of the SERVQUAL scale.
Journal of Retailing, 67: 420-450. Thompson, B. (2000, October). Representativeness versus response rate: It ain't the response rate . Paper presented
at the Association of Research Libraries (ARL) Measuring Service Quality Symposium on the New Culture of Assessment: Measuring Service Quality, Washington, DC.
Thompson, B., Cook, C., & Heath, F. (2000). The LibQUAL+® gap measurement model: The bad, the ugly, and the
good of gap measurement. Performance Measurement and Metrics, 1: 165-178. Thompson, B., Cook, C., & Heath, F. (2003). Structure of perceptions of service quality in libraries: A LibQUAL+®
study. Structural Equation Modeling, 10: 456-464. Thompson, B., Cook, C., & Thompson, R.L. (2002). Reliability and structure of LibQUAL+® scores: Measuring
perceived library service quality. portal: Libraries and the Academy, 2: 3-12. Thompson, B., Cook, C., & Kyrillidou, M. (2005). Concurrent validity of LibQUAL+® scores: What do LibQUAL+®
scores measure? Journal of Academic Librarianship, 31: 517-522. Thompson, B., Cook, C., & Kyrillidou, M. (2006). Using localized survey items to augment standardized
benchmarking measures: A LibQUAL+® study. portal: Libraries and the Academy, 6(2): 219-230. Thompson, B., Cook, C., & Kyrillidou, M. (2006). Stability of library service quality benchmarking norms across time
and cohorts: A LibQUAL+® study. Paper presented at the Asia-Pacific Conference of Library and Information Education and Practice (A-LIEP), Singapore.

Revised 9/17/07
22
Thompson, B., Cook, C., Kyrillidou, M. (2006). How can you evaluate the integrity of your library assessment data: Intercontinental LibQUAL+® analysis used as concrete heuristic examples. Paper presented at the Library Assessment Conference: Building Effective, Sustainable, and Practical Assessment, Charlottesville, VA.
Zeithaml, V.A., Parasuraman, A., Berry, L.L. (1990). Delivering quality service: Balancing customer perceptions and
expectations. New York: Free Press.

Revised 9/17/07
23
2 Respondents by Institution for LibQUAL Canada Below is a listing of all the consortium institutions that participated in the 2007 LibQUAL+® survey. Where applicable, they have been separated out by library type (e.g. Academic Health Sciences, College or University, Community College). The number of respondents from each institution and the percentage of the total number of consortium respondents that they represent are provided. Institution Type Institution Name Respondents
(N) Respondents %
Canadian Government Canada Institute for Scientific and Technical Information 431 0.90% Canadian Museum of Civilization 82 0.17% Cour suprême du Canada / Supreme Court of Canada 12 0.02% Institut canadien de l'information scientifique et technique 100 0.21% Musée canadien des civilisations 73 0.15% Supreme Court of Canada / Cour suprême du Canada 42 0.09% Canadian Government Total 740 1.54% College or University Acadia University 873 1.82% Bishop's University 387 0.80% Bishop's University - French 17 0.04% Carleton University 764 1.59% Concordia University Libraries 949 1.97% Concordia University Libraries - French 18 0.04% Dalhousie University 1,278 2.66% École de technologie supérieure 659 1.37% Ecole Polytechnique de Montréal 1,631 3.39% Grant MacEwan College 1,527 3.18% HEC Montréal 782 1.63% Lakehead University Library 1,377 2.86% Laurentian University 1,030 2.14% Malaspina University-College Library 1,411 2.93% McMaster University Libraries 716 1.49% Memorial University of Newfoundland 819 1.70% Mount Saint Vincent University 413 0.86% Mount Saint Vincent University - French 1 0.00% Nipissing University / Canadore College 499 1.04% Queen's University 1,594 3.31% Ryerson University Library 823 1.71% Université de Montréal 464 0.96% Université de Sherbrooke 2,230 4.64% Université du Québec à Montréal 1,893 3.94% Université du Québec à Trois-Rivières 815 1.69% Université du Québec en Outaouais 860 1.79% Université Laurentienne 130 0.27% Université Laval 1,177 2.45% University College of the Fraser Valley 485 1.01% University of Alberta - French 10 0.02% University of Alberta Libraries 528 1.10% University of British Columbia Library 711 1.48% University of British Columbia Okanagan 831 1.73% University of Calgary Libraries and Cultural Resources 686 1.43%

Revised 9/17/07
24
Institution Type Institution Name Respondents (N)
Respondents %
University of Guelph 1,332 2.77% University of Manitoba 963 2.00% University of Manitoba - French 4 0.01% University of New Brunswick 1,120 2.33% University of Northern British Columbia 537 1.12% University of Ottawa - English 444 0.92% University of Ottawa - French 178 0.37% University of Saskatchewan Library 500 1.04% University of Toronto Libraries 594 1.24% University of Toronto Mississauga 258 0.54% University of Toronto Scarborough Library 227 0.47% University of Victoria Libraries 562 1.17% University of Waterloo 565 1.18% University of Western Ontario 2,165 4.50% University of Windsor 1,476 3.07% UOIT-DurhamCollege-Trent in Oshawa 478 0.99% Wilfrid Laurier University 2,370 4.93% York University Libraries 879 1.83% College or University Total 43,040 89.51% Community College Centennial College Learning and Resource Centres 1,058 2.20% Nova Scotia Community College 1,211 2.52% Okanagan College 355 0.74% Red Deer College 704 1.46% Saskatchewan Institute of Applied Science and Technology 977 2.03% Community College Total 4,305 8.95%
Grand Total 48,085 100.00%

Revised 9/17/07
25
3 Canadian Government Results for LibQual Canada
3.1 Demographics Summary
3.1.1 Population and Respondent Profiles by Standard Discipline The chart and table below show a breakdown of survey respondents by discipline, based on user responses to the demographic questions and the demographic data provided by institutions in the online Representativeness section*. This section shows survey respondents broken down based on the LibQUAL+® standard discipline categories. The chart maps percentage of respondents for each discipline in red. Population percentages for each discipline are mapped in blue. The table shows the number and percentage for each discipline, for the general population (N) and for survey respondents (n). *Note: Participating institutions were not required to complete the Representativeness section. When population data is missing or incomplete, it is because this data was not provided.
0%
10%
20%
30%
40%
50%
60%
70%
80%
Humanities Law Other Science /Math
SocialSciences /Psychology
Discipline
Perc
enta
ge Population Profile byDiscipline
Respondent Profile byDiscipline
Discipline Population
(N) Population % Respondents
(n) Respondents
% %N-%n
Humanities 736 14.79% 106 14.34% 0.45% Law 133 2.67% 44 5.95% -3.28% Other 300 6.03% 67 9.07% -3.04% Science / Math 3,626 72.88% 472 63.87% 9.01% Social Sciences / Psychology
180 3.62% 50 6.77% -3.15%
Grand Total 4,975 100.00% 739 100.00% 0.00%

Revised 9/17/07
26
3.1.2 Respondent Profile by Age This table shows a breakdown of survey respondents by age; both the number of respondents (n) and the percentage of the total number of respondents represented by each group are displayed. Unified Age Group Respondents
(n) Under 18 0 18 - 22 14 23 - 30 83 31 - 45 304 46 - 65 322 Over 65 14
Grand Total 737 By Language Response Language Age Group Respondents
(n) American English Under 18 0 18 - 22 6 23 - 30 52 31 - 45 230 46 - 65 251 Over 65 14 Sub-total 553 Canadian French Under 18 0 18 - 22 8 23 - 30 31 31 - 45 74 46 - 65 71 Over 65 0 Sub-total 184
Grand Total 737
3.1.3 Population and Respondent Profiles by Sex The table below shows a breakdown of survey respondents by sex, based on user responses to the demographic questions and the demographic data provided by institutions in the online Representativeness section* . The number and percentage for each sex are given for the general population and for survey respondents. Note: Participating institutions were not required to complete the Representativness section. When population data is missing or incomplete, it is because this data was not provided. Unified Sex Population N Population % Respondent N Respondent % Male 3,438 34.69% 459 62.45% Female 6,472 65.31% 276 37.55%
Grand Total 9,910 100.00% 735 100.00%

Revised 9/17/07
27
By Response Language Response Language Sex Respondents
(n) American English Female 194
Male 357 American English Total 551 Canadian French Female 82
Male 102 Canadian French Total 184
Grand Total 735
3.1.4 Population and Respondent Profiles by Employment Status Users were asked to answer the question, “Please check your employment status.” The table below shows a breakdown of survey respondents by employment status, based on user responses to that demographic question and the demographic data provided by institutions through the online Representativness section*. The number and percentages for each option are given for both general population and survey respondents. * Note: Participating institutions were not required to complete the Representativeness section. When population data is missing or incomplete, it is because this data was not provided. Unified Status Population N Population % Respondents (n) Respondent % Permanent 5,542 61.36% 554 74.86% Term or casual 1,190 13.18% 121 16.35% Contractor 1,734 19.20% 36 4.86% Student 566 6.27% 29 3.92%
Grand Total 9,032 100.00% 740 100.00% By Response Language Response Language Status Respondents
(n) American English Contractor 18 Permanent 423 Student 18 Term or casual 96 American English Total 555 Canadian French Contractor 18 Permanent 131 Student 11 Term or casual 25 Canadian French Total 185
Grand Total 740

Revised 9/17/07
28
3.1.5 Respondent Profile by Level of Education Unified Level Respondents (n) High school 23 Associates degree 62 Bachelors degree 155 Masters degree 184 PhD 271 Professional degree 44
Grand Total 739 By Response Language Response Language Level Respondents
(n) American English High school 17 Associates degree 26 Bachelors degree 115 Masters degree 128 Professional degree 37 PhD 231 American English Total 554 Canadian French High school 6 Associates degree 36 Bachelors degree 40 Masters degree 56 Professional degree 7 PhD 40 Canadian French Total 185
Grand Total 739
3.1.6 Population and Respondent Profiles by Profession Unified Profession Population Population
% Respondents
(n) Respondents
% Library / Information Management / Museum collection specialist
536 5.41% 48 6.52%
Administration professional or support 1,802 18.18% 87 11.82% Senior Manager 110 1.11% 25 3.40% Manager 532 5.37% 58 7.88% Museum exhibition programs and planning
298 3.01% 34 4.62%
Research Scientist or professional 4,620 46.62% 363 49.32% Research Technician 944 9.53% 77 10.46% Lawyer 90 0.91% 30 4.08% Policy / Program analyst 978 9.87% 14 1.90%
Grand Total 9,910 100.00% 736 100.00%

Revised 9/17/07
29
By Response Language Response Language Profession Respondents (n)
American English Library / Information Management / Museum collection specialist
33
Administration professional or support 43 Senior Manager 22 Manager 41 Museum exhibition programs and planning 16 Research Scientist or professional 305 Research Technician 55 Lawyer 25 Policy / Program analyst 13 American English Total 553 Canadian French Library / Information Management / Museum
collection specialist 15
Administration professional or support 44 Senior Manager 3 Manager 17 Museum exhibition programs and planning 18
Research Scientist or professional 58 Research Technician 22 Lawyer 5 Policy / Program analyst 1 Canadian French Total 183
Grand Total 736
3.1.7 Population and Respondent Profiles by Internal Network Unified Response Population Population
% Respondents
(n) Respondents
% Yes 8,716 96.48% 396 53.59% No 318 3.52% 343 46.41%
Grand Total 9,034 100.00% 739 100.00% By Response Language Response Language Response Respondents
(n) American English No 254 Yes 300 American English Total 554 Canadian French No 89 Yes 96 Canadian French Total 185
Grand Total 739

Revised 9/17/07
30
3.1.8 Population and Respondent Profiles by Primary Access Method Unified Method Population Population
% Respondents (n)
Respondents %
E-mail 1,902 18.38% 59 7.97% Internet/Intranet/Virtual Library 6,342 61.29% 489 66.08% Phone 870 8.41% 7 0.95% Physical library 1,234 11.93% 185 25.00%
Grand Total 10,348 100.00% 740 100.00% By Response Language Response Language Method Respondents
(n) American English E-mail 48 Internet/Intranet/Virtual Library 397 Phone 5 Physical library 105 American English Total 555 Canadian French E-mail 11 Internet/Intranet/Virtual Library 92 Phone 2 Physical library 80 Canadian French Total 185
Grand Total 740

Revised 9/17/07
31
3.2 Survey Item Summary
3.2.1 Core Question Summary This radar chart shows aggregate results for the core survey questions. Each axis represents one question. A code to identify each question is displayed at the outer point of each axis. While questions for each dimension of library service quality are scattered randomly throughout the survey, on this chart they are grouped into sections: Affect of Service, Library as Place, and Information Control. On each axis, respondents' minimum, desired, and perceived levels of service quality are plotted, and the resulting "gaps" between the three levels (representing service adequacy or service superiority) are shaded in blue, yellow, green, and red. The two following tables show mean scores and standard deviations for each question, where n is the number of respondents for each particular question. (For a more detailed explanation of the headings, see the Introduction to this notebook.) Unified
Perceived Less Than Minimum Perceived Less Than Desired Perceived Greater than Minimum Perceived Greater than Desired
Question Minimum
Mean Desired
Mean Perceived
Mean Adequacy
Mean Superiority
Mean n
AS-1 Employees who instill confidence in users 6.37 7.74 7.52 1.15 -0.22 702 AS-2 Giving users individual attention 6.31 7.46 7.55 1.24 0.08 720 AS-3 Employees who are consistently courteous 7.06 8.01 8.20 1.14 0.19 726 AS-4 Readiness to respond to users' questions 6.86 7.91 7.90 1.04 -0.01 723 AS-5 Employees who have the knowledge to answer
user questions 6.95 8.01 7.87 0.92 -0.14 725
AS-6 Employees who deal with users in a caring fashion
6.61 7.72 7.85 1.24 0.12 713

Revised 9/17/07
32
Question Minimum Mean
Desired Mean
Perceived Mean
Adequacy Mean
Superiority Mean
n
AS-7 Employees who understand the needs of their users
6.81 7.87 7.73 0.91 -0.14 716
AS-8 Willingness to help users 6.82 7.94 7.97 1.15 0.03 721 AS-9 Dependability in handling users' service
problems 6.80 7.88 7.76 0.96 -0.12 615
IC-1 Making electronic resources accessible from my home or office
6.61 7.90 7.00 0.39 -0.90 678
IC-2 A library Web site enabling me to locate information on my own
6.81 8.02 6.88 0.08 -1.13 704
IC-3 The printed library materials I need for my work 6.40 7.47 7.32 0.92 -0.15 659 IC-4 The electronic information resources I need 6.92 8.11 7.37 0.45 -0.74 702 IC-5 Modern equipment that lets me easily access
needed information 6.82 7.91 7.45 0.64 -0.45 671
IC-6 Easy-to-use access tools that allow me to find things on my own
6.88 8.10 7.04 0.16 -1.06 699
IC-7 Making information easily accessible for independent use
6.84 7.98 7.33 0.49 -0.65 684
IC-8 Print and/or electronic journal collections I require for my work
6.99 8.07 7.40 0.41 -0.67 650
LP-1 Library space that inspires study and learning 5.50 6.69 6.40 0.90 -0.29 620 LP-2 Quiet space for individual activities 5.60 6.65 6.78 1.18 0.14 575 LP-3 A comfortable and inviting location 5.91 7.09 6.99 1.08 -0.10 625 LP-4 A getaway for study, learning, or research 5.99 7.11 6.83 0.84 -0.28 608 LP-5 Community space for group learning and group
study 4.83 5.90 5.88 1.05 -0.01 471
Grand Total 6.49 7.62 7.32 0.83 -0.30 669 Question Minimum
SD Desired
SD Perceived
SD Adequacy
SD Superiority
SD n
AS-1 Employees who instill confidence in users 1.70 1.39 1.50 1.67 1.46 702 AS-2 Giving users individual attention 1.79 1.46 1.56 1.74 1.47 720 AS-3 Employees who are consistently courteous 1.63 1.24 1.10 1.55 1.22 726 AS-4 Readiness to respond to users' questions 1.52 1.19 1.29 1.61 1.37 723
AS-5 Employees who have the knowledge to answer user questions 1.49 1.09 1.28 1.65 1.33 725
AS-6 Employees who deal with users in a caring fashion 1.74 1.35 1.31 1.67 1.36 713
AS-7 Employees who understand the needs of their users 1.58 1.22 1.30 1.62 1.41 716
AS-8 Willingness to help users 1.55 1.19 1.22 1.58 1.26 721
AS-9 Dependability in handling users' service problems 1.56 1.20 1.27 1.52 1.25 615
IC-1 Making electronic resources accessible from my home or office 1.82 1.52 1.90 2.02 1.99 678
IC-2 A library Web site enabling me to locate information on my own 1.58 1.27 1.72 2.08 1.88 704
IC-3 The printed library materials I need for my work 1.81 1.66 1.59 1.68 1.58 659 IC-4 The electronic information resources I need 1.51 1.16 1.50 1.82 1.64 702
IC-5 Modern equipment that lets me easily access needed information 1.58 1.28 1.40 1.78 1.59 671
IC-6 Easy-to-use access tools that allow me to find things on my own 1.51 1.12 1.58 1.97 1.76 699
IC-7 Making information easily accessible for independent use 1.49 1.13 1.51 1.84 1.61 684
IC-8 Print and/or electronic journal collections I require for my work 1.62 1.31 1.50 1.87 1.68 650
LP-1 Library space that inspires study and learning 2.20 2.08 1.91 2.34 2.39 620

Revised 9/17/07
33
Question Minimum SD
Desired SD
Perceived SD
Adequacy SD
Superiority SD
n
LP-2 Quiet space for individual activities 2.21 2.18 1.76 2.12 2.16 575 LP-3 A comfortable and inviting location 2.00 1.83 1.69 2.19 2.07 625 LP-4 "A getaway for study 1.99 1.94 1.69 1.95 1.93 608
LP-5 Community space for group learning and group study 2.26 2.33 1.99 2.25 2.29 471
Grand Total 1.73 1.46 1.53 1.84 1.67 669
American English
Perceived Less Than Minimum Perceived Less Than Desired Perceived Greater than Minimum Perceived Greater than Desired
Question Minimum
Mean Desired
Mean Perceived
Mean Adequacy
Mean Superiority
Mean n
AS-1 Employees who instill confidence in users 6.26 7.71 7.42 1.15 -0.30 518 AS-2 Giving users individual attention 6.30 7.47 7.55 1.25 0.08 540 AS-3 Employees who are consistently courteous 6.98 7.99 8.15 1.17 0.15 543 AS-4 Readiness to respond to users' questions 6.85 7.96 7.87 1.02 -0.09 542 AS-5 Employees who have the knowledge to answer
user questions 6.87 7.99 7.82 0.95 -0.17 543
AS-6 Employees who deal with users in a caring fashion
6.47 7.64 7.77 1.31 0.14 531
AS-7 Employees who understand the needs of their users
6.74 7.87 7.66 0.93 -0.20 537
AS-8 Willingness to help users 6.78 7.94 7.95 1.17 0.01 540 AS-9 Dependability in handling users' service
problems 6.74 7.88 7.71 0.97 -0.17 470
IC-1 Making electronic resources accessible from my home or office
6.60 7.91 6.95 0.35 -0.96 518

Revised 9/17/07
34
Question Minimum Mean
Desired Mean
Perceived Mean
Adequacy Mean
Superiority Mean
n
IC-2 A library Web site enabling me to locate information on my own
6.83 8.05 6.90 0.07 -1.15 537
IC-3 The printed library materials I need for my work 6.38 7.46 7.31 0.93 -0.15 515 IC-4 The electronic information resources I need 6.96 8.17 7.39 0.43 -0.77 542 IC-5 Modern equipment that lets me easily access
needed information 6.79 7.91 7.43 0.64 -0.47 504
IC-6 Easy-to-use access tools that allow me to find things on my own
6.88 8.12 7.02 0.14 -1.10 536
IC-7 Making information easily accessible for independent use
6.87 8.03 7.32 0.45 -0.71 514
IC-8 Print and/or electronic journal collections I require for my work
6.99 8.08 7.42 0.43 -0.66 510
LP-1 Library space that inspires study and learning 5.24 6.46 6.30 1.06 -0.16 452 LP-2 Quiet space for individual activities 5.35 6.39 6.67 1.32 0.29 417 LP-3 A comfortable and inviting location 5.73 6.91 6.94 1.21 0.03 458 LP-4 A getaway for study, learning, or research 5.94 7.08 6.81 0.87 -0.27 459 LP-5 Community space for group learning and group
study 4.54 5.62 5.80 1.26 0.18 343
Grand Total 6.41 7.58 7.28 0.87 -0.29 503 Question Minimum
SD Desired
SD Percieved
SD Adequacy
SD Superiority
SD n
AS-1 Employees who instill confidence in users 1.76 1.48 1.57 1.70 1.52 518 AS-2 Giving users individual attention 1.82 1.53 1.64 1.79 1.57 540 AS-3 Employees who are consistently courteous 1.67 1.28 1.14 1.58 1.24 543 AS-4 Readiness to respond to users' questions 1.57 1.21 1.36 1.65 1.41 542 AS-5 Employees who have the knowledge to answer
user questions 1.55 1.12 1.31 1.71 1.39 543
AS-6 Employees who deal with users in a caring fashion
1.83 1.43 1.38 1.76 1.42 531
AS-7 Employees who understand the needs of their users
1.63 1.25 1.36 1.71 1.48 537
AS-8 Willingness to help users 1.58 1.21 1.26 1.62 1.30 540 AS-9 Dependability in handling users' service
problems 1.61 1.22 1.36 1.59 1.30 470
IC-1 Making electronic resources accessible from my home or office
1.87 1.60 1.94 2.03 2.02 518
IC-2 A library Web site enabling me to locate information on my own
1.59 1.30 1.75 2.03 1.87 537
IC-3 The printed library materials I need for my work 1.90 1.74 1.65 1.75 1.66 515 IC-4 The electronic information resources I need 1.55 1.17 1.52 1.84 1.66 542 IC-5 Modern equipment that lets me easily access
needed information 1.65 1.33 1.44 1.83 1.63 504
IC-6 Easy-to-use access tools that allow me to find things on my own
1.55 1.12 1.64 2.02 1.83 536
IC-7 Making information easily accessible for independent use
1.56 1.15 1.61 1.93 1.70 514
IC-8 Print and/or electronic journal collections I require for my work
1.68 1.35 1.55 1.89 1.71 510
LP-1 Library space that inspires study and learning 2.25 2.21 1.98 2.38 2.50 452 LP-2 Quiet space for individual activities 2.28 2.31 1.83 2.18 2.28 417 LP-3 A comfortable and inviting location 2.10 1.94 1.77 2.26 2.16 458 LP-4 A getaway for study, learning, or research 2.08 2.06 1.78 1.98 1.99 459 LP-5 Community space for group learning and group
study 2.30 2.44 2.07 2.29 2.38 343
Grand Total 1.79 1.52 1.59 1.89 1.73 503

Revised 9/17/07
35
Canadian French
Perceived Less Than Minimum Perceived Less Than Desired Perceived Greater than Minimum Perceived Greater than Desired
Question Minimum
Mean Desired
Mean Perceived
Mean Adequacy
Mean Superiority
Mean n
AS-1 Employees who instill confidence in users 6.67 7.82 7.81 1.14 -0.01 184 AS-2 Giving users individual attention 6.33 7.44 7.54 1.22 0.10 180 AS-3 Employees who are consistently courteous 7.30 8.05 8.33 1.03 0.28 183 AS-4 Readiness to respond to users' questions 6.87 7.77 7.98 1.12 0.22 181 AS-5 Employees who have the knowledge to answer
user questions 7.18 8.07 8.01 0.83 -0.06 182
AS-6 Employees who deal with users in a caring fashion
7.03 7.97 8.06 1.03 0.09 182
AS-7 Employees who understand the needs of their users
7.04 7.89 7.92 0.88 0.03 179
AS-8 Willingness to help users 6.95 7.94 8.04 1.09 0.10 181 AS-9 Dependability in handling users' service
problems 6.97 7.88 7.93 0.96 0.06 145
IC-1 Making electronic resources accessible from my home or office
6.67 7.86 7.18 0.51 -0.68 160
IC-2 A library Web site enabling me to locate information on my own
6.72 7.90 6.84 0.11 -1.06 167
IC-3 The printed library materials I need for my work 6.47 7.50 7.34 0.88 -0.16 144 IC-4 The electronic information resources I need 6.77 7.90 7.28 0.51 -0.63 160 IC-5 Modern equipment that lets me easily access
needed information 6.90 7.90 7.51 0.62 -0.39 167
IC-6 Easy-to-use access tools that allow me to find things on my own
6.88 8.03 7.09 0.20 -0.94 163

Revised 9/17/07
36
Question Minimum Mean
Desired Mean
Perceived Mean
Adequacy Mean
Superiority Mean
n
IC-7 Making information easily accessible for independent use
6.78 7.85 7.36 0.58 -0.49 170
IC-8 Print and/or electronic journal collections I require for my work
6.99 8.02 7.31 0.32 -0.71 140
LP-1 Library space that inspires study and learning 6.18 7.30 6.67 0.48 -0.64 168 LP-2 Quiet space for individual activities 6.27 7.34 7.07 0.80 -0.27 158 LP-3 A comfortable and inviting location 6.39 7.57 7.13 0.74 -0.45 167 LP-4 A getaway for study, learning, or research 6.13 7.17 6.87 0.74 -0.30 149 LP-5 Community space for group learning and group
study 5.60 6.63 6.09 0.48 -0.54 128
Grand Total 6.69 7.72 7.43 0.74 -0.29 165 Question Minimum
SD Desired
SD Perceived
SD Adequacy
SD Superiority
SD n
AS-1 Employees who instill confidence in users 1.48 1.08 1.24 1.60 1.25 184 AS-2 Giving users individual attention 1.72 1.23 1.32 1.58 1.13 180 AS-3 Employees who are consistently courteous 1.48 1.13 0.97 1.47 1.16 183 AS-4 Readiness to respond to users' questions 1.38 1.11 1.04 1.46 1.18 181 AS-5 Employees who have the knowledge to answer
user questions 1.30 1.00 1.16 1.46 1.13 182
AS-6 Employees who deal with users in a caring fashion
1.34 1.07 1.06 1.36 1.18 182
AS-7 Employees who understand the needs of their users
1.38 1.13 1.06 1.34 1.13 179
AS-8 Willingness to help users 1.44 1.16 1.10 1.44 1.15 181 AS-9 Dependability in handling users' service
problems 1.35 1.15 0.94 1.27 1.05 145
IC-1 Making electronic resources accessible from my home or office
1.64 1.27 1.76 1.97 1.90 160
IC-2 A library Web site enabling me to locate information on my own
1.52 1.19 1.65 2.22 1.92 167
IC-3 The printed library materials I need for my work 1.47 1.31 1.34 1.43 1.23 144 IC-4 The electronic information resources I need 1.36 1.11 1.41 1.74 1.55 160 IC-5 Modern equipment that lets me easily access
needed information 1.38 1.12 1.28 1.61 1.45 167
IC-6 Easy-to-use access tools that allow me to find things on my own
1.35 1.10 1.38 1.80 1.51 163
IC-7 Making information easily accessible for independent use
1.25 1.06 1.16 1.56 1.31 170
IC-8 Print and/or electronic journal collections I require for my work
1.36 1.15 1.26 1.79 1.56 140
LP-1 Library space that inspires study and learning 1.88 1.56 1.65 2.17 2.03 168 LP-2 Quiet space for individual activities 1.86 1.63 1.54 1.90 1.78 158 LP-3 A comfortable and inviting location 1.62 1.39 1.44 1.95 1.74 167 LP-4 A getaway for study, learning, or research 1.68 1.52 1.37 1.84 1.74 149 LP-5 Community space for group learning and group
study 1.95 1.84 1.74 2.04 1.92 128
Grand Total 1.51 1.24 1.31 1.68 1.46 165
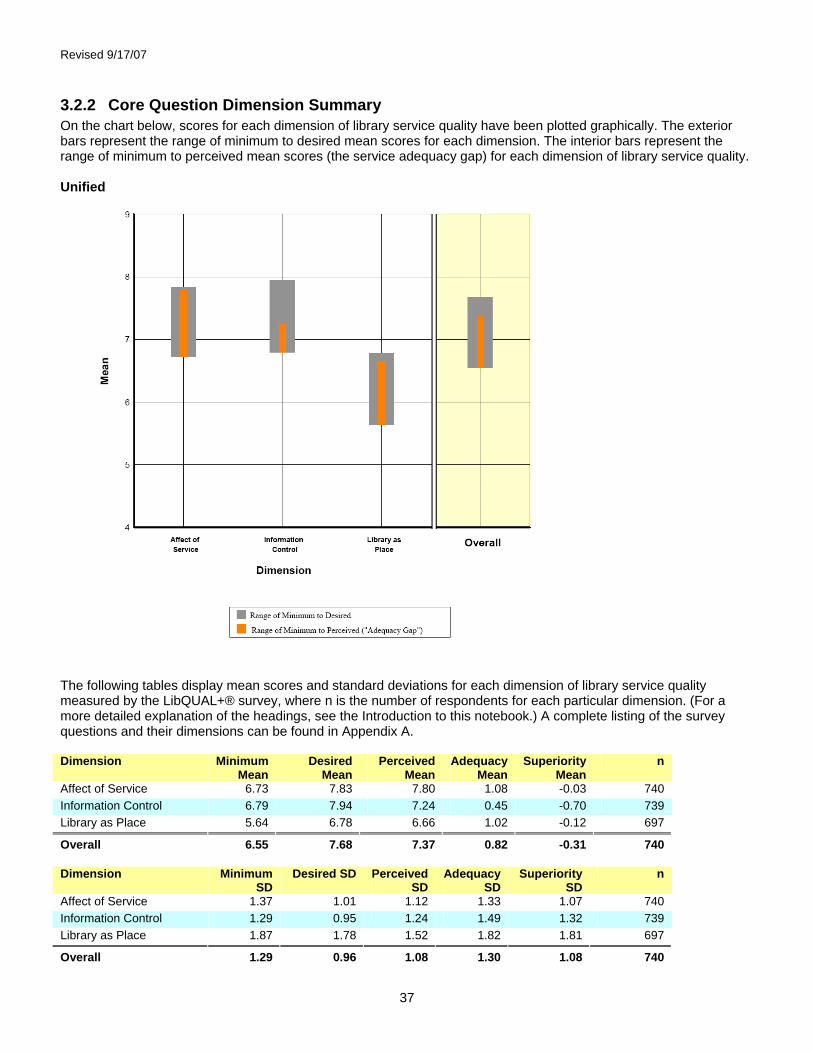
Revised 9/17/07
37
3.2.2 Core Question Dimension Summary On the chart below, scores for each dimension of library service quality have been plotted graphically. The exterior bars represent the range of minimum to desired mean scores for each dimension. The interior bars represent the range of minimum to perceived mean scores (the service adequacy gap) for each dimension of library service quality. Unified
The following tables display mean scores and standard deviations for each dimension of library service quality measured by the LibQUAL+® survey, where n is the number of respondents for each particular dimension. (For a more detailed explanation of the headings, see the Introduction to this notebook.) A complete listing of the survey questions and their dimensions can be found in Appendix A. Dimension Minimum
Mean Desired
Mean Perceived
Mean Adequacy
Mean Superiority
Mean n
Affect of Service 6.73 7.83 7.80 1.08 -0.03 740 Information Control 6.79 7.94 7.24 0.45 -0.70 739 Library as Place 5.64 6.78 6.66 1.02 -0.12 697
Overall 6.55 7.68 7.37 0.82 -0.31 740 Dimension Minimum
SD Desired SD Perceived
SD Adequacy
SD Superiority
SD n
Affect of Service 1.37 1.01 1.12 1.33 1.07 740 Information Control 1.29 0.95 1.24 1.49 1.32 739 Library as Place 1.87 1.78 1.52 1.82 1.81 697
Overall 1.29 0.96 1.08 1.30 1.08 740

Revised 9/17/07
38
American English
The following tables display mean scores and standard deviations for each dimension of library service quality measured by the LibQUAL+® survey, where n is the number of respondents for each particular dimension. (For a more detailed explanation of the headings, see the Introduction to this notebook.) A complete listing of the survey questions and their dimensions can be found in Appendix A. Dimension Minimum
Mean Desired
Mean Perceived
Mean Adequacy
Mean Superiority
Mean n
Affect of Service 6.66 7.82 7.75 1.09 -0.07 555 Information Control 6.79 7.97 7.23 0.44 -0.73 555 Library as Place 5.47 6.63 6.61 1.14 -0.03 523
Overall 6.48 7.66 7.34 0.86 -0.32 555 Dimension Minimum
SD Desired
SD Perceived
SD Adequacy
SD Superiority
SD n
Affect of Service 1.41 1.04 1.17 1.38 1.12 555 Information Control 1.31 0.97 1.29 1.51 1.36 555 Library as Place 1.91 1.86 1.58 1.84 1.87 523
Overall 1.31 0.99 1.14 1.33 1.14 555

Revised 9/17/07
39
Canadian French
The following tables display mean scores and standard deviations for each dimension of library service quality measured by the LibQUAL+® survey, where n is the number of respondents for each particular dimension. (For a more detailed explanation of the headings, see the Introduction to this notebook.) A complete listing of the survey questions and their dimensions can be found in Appendix A. Dimension Minimum
Mean Desired
Mean Perceived
Mean Adequacy
Mean Superiority
Mean n
Affect of Service 6.93 7.87 7.95 1.02 0.09 185 Information Control 6.80 7.88 7.27 0.47 -0.61 184 Library as Place 6.15 7.22 6.81 0.66 -0.41 174
Overall 6.75 7.76 7.47 0.73 -0.28 185 Dimension Minimum
SD Desired
SD Perceived SD Adequacy
SD Superiority
SD n
Affect of Service 1.23 0.92 0.91 1.19 0.89 185 Information Control 1.21 0.90 1.08 1.45 1.18 184 Library as Place 1.65 1.44 1.32 1.71 1.58 174
Overall 1.20 0.87 0.88 1.19 0.87 185

Revised 9/17/07
40
3.2.3 Local Questions Summary This table shows mean scores and standard deviations for each of the local questions added by the individual library or consortium, where n is the number of respondents for each particular question. (For a more detailed explanation of the headings, see the Introduction to this notebook.) Unified Question Minimum
Mean Desired
Mean Perceived
Mean Adequacy
Mean Superiority
Mean n
Ability to navigate library Web pages easily 6.93 8.10 6.77 -0.16 -1.33 511 Accuracy in the catalog, borrowing, and overdue records 7.18 8.00 7.78 0.60 -0.22 126 Adequate hours of service 6.24 7.40 7.38 1.14 -0.02 419 Assuring users of the accuracy and confidentiality of their transactions 6.68 7.83 8.02 1.34 0.19 47 Convenient service hours 6.44 7.47 7.57 1.13 0.10 88 Ease and timeliness in getting materials from other libraries 6.54 7.86 7.60 1.06 -0.26 558 Librarians teaching me how to effectively use the electronically available databases, journals, and books 6.57 7.71 7.45 0.88 -0.26 86 Library keeping me informed about all of its services 6.10 7.26 7.01 0.91 -0.25 100 Library orientations / instruction sessions 6.05 6.99 6.91 0.86 -0.08 165 Making me aware of library resources and services 6.18 7.42 7.03 0.85 -0.38 624 Resources added to library collections on request 6.57 7.61 7.58 1.02 -0.03 122 Teaching me how to access, evaluate, and use information 5.76 7.09 6.87 1.11 -0.23 416 Timely document delivery / interlibrary loan 6.82 8.14 7.86 1.04 -0.28 93 Question Minimum
SD Desired SD Perceived
SD Adequacy
SD Superiority
SD n
Ability to navigate library Web pages easily 1.46 1.14 1.77 2.01 1.94 511 Accuracy in the catalog, borrowing, and overdue records 1.42 1.04 1.34 1.72 1.42 126 Adequate hours of service 1.83 1.57 1.54 1.76 1.49 419 Assuring users of the accuracy and confidentiality of their transactions 2.08 1.37 1.15 2.00 0.92 47 Convenient service hours 1.47 1.69 1.17 1.33 1.42 88 Ease and timeliness in getting materials from other libraries 1.61 1.20 1.40 1.78 1.45 558 Librarians teaching me how to effectively use the electronically available databases, journals, and books 1.56 1.56 1.58 1.40 1.21 86 Library keeping me informed about all of its services 1.44 1.44 1.45 1.61 1.49 100 Library orientations / instruction sessions 1.92 1.75 1.86 2.27 1.90 165 Making me aware of library resources and services 1.80 1.54 1.68 1.92 1.84 624 Resources added to library collections on request 1.45 1.32 1.20 1.54 1.22 122 Teaching me how to access, evaluate, and use information 1.98 1.86 1.74 2.03 2.04 416 Timely document delivery / interlibrary loan 1.23 1.05 1.18 1.37 1.25 93
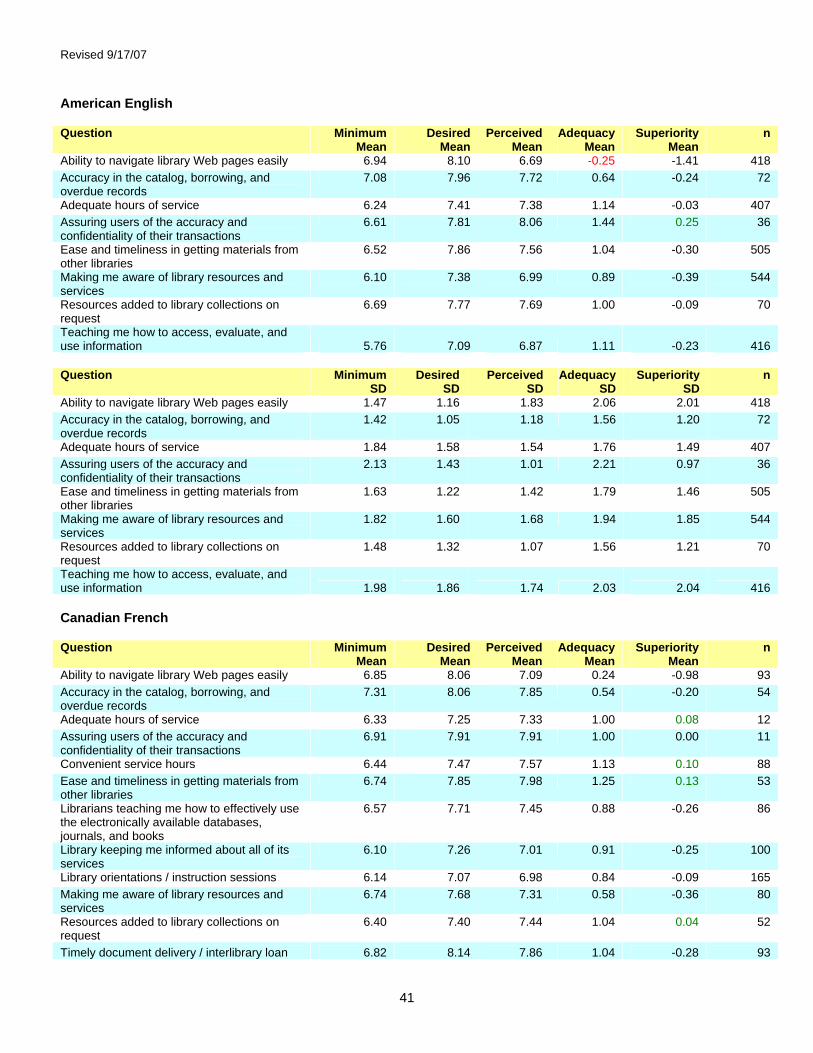
Revised 9/17/07
41
American English Question Minimum
Mean Desired
Mean Perceived
Mean Adequacy
Mean Superiority
Mean n
Ability to navigate library Web pages easily 6.94 8.10 6.69 -0.25 -1.41 418 Accuracy in the catalog, borrowing, and overdue records
7.08 7.96 7.72 0.64 -0.24 72
Adequate hours of service 6.24 7.41 7.38 1.14 -0.03 407 Assuring users of the accuracy and confidentiality of their transactions
6.61 7.81 8.06 1.44 0.25 36
Ease and timeliness in getting materials from other libraries
6.52 7.86 7.56 1.04 -0.30 505
Making me aware of library resources and services
6.10 7.38 6.99 0.89 -0.39 544
Resources added to library collections on request
6.69 7.77 7.69 1.00 -0.09 70
Teaching me how to access, evaluate, and use information 5.76 7.09 6.87 1.11 -0.23 416 Question Minimum
SD Desired
SD Perceived
SD Adequacy
SD Superiority
SD n
Ability to navigate library Web pages easily 1.47 1.16 1.83 2.06 2.01 418 Accuracy in the catalog, borrowing, and overdue records
1.42 1.05 1.18 1.56 1.20 72
Adequate hours of service 1.84 1.58 1.54 1.76 1.49 407 Assuring users of the accuracy and confidentiality of their transactions
2.13 1.43 1.01 2.21 0.97 36
Ease and timeliness in getting materials from other libraries
1.63 1.22 1.42 1.79 1.46 505
Making me aware of library resources and services
1.82 1.60 1.68 1.94 1.85 544
Resources added to library collections on request
1.48 1.32 1.07 1.56 1.21 70
Teaching me how to access, evaluate, and use information 1.98 1.86 1.74 2.03 2.04 416 Canadian French Question Minimum
Mean Desired
Mean Perceived
Mean Adequacy
Mean Superiority
Mean n
Ability to navigate library Web pages easily 6.85 8.06 7.09 0.24 -0.98 93 Accuracy in the catalog, borrowing, and overdue records
7.31 8.06 7.85 0.54 -0.20 54
Adequate hours of service 6.33 7.25 7.33 1.00 0.08 12 Assuring users of the accuracy and confidentiality of their transactions
6.91 7.91 7.91 1.00 0.00 11
Convenient service hours 6.44 7.47 7.57 1.13 0.10 88 Ease and timeliness in getting materials from other libraries
6.74 7.85 7.98 1.25 0.13 53
Librarians teaching me how to effectively use the electronically available databases, journals, and books
6.57 7.71 7.45 0.88 -0.26 86
Library keeping me informed about all of its services
6.10 7.26 7.01 0.91 -0.25 100
Library orientations / instruction sessions 6.14 7.07 6.98 0.84 -0.09 165 Making me aware of library resources and services
6.74 7.68 7.31 0.58 -0.36 80
Resources added to library collections on request
6.40 7.40 7.44 1.04 0.04 52
Timely document delivery / interlibrary loan 6.82 8.14 7.86 1.04 -0.28 93

Revised 9/17/07
42
Question Minimum
SD Desired SD Perceived
SD Adequacy
SD Superiority
SD n
Ability to navigate library Web pages easily 1.40 1.02 1.46 1.76 1.51 93 Accuracy in the catalog, borrowing, and overdue records
1.41 1.04 1.55 1.93 1.69 54
Adequate hours of service 1.37 1.36 1.61 1.86 1.56 12 Assuring users of the accuracy and confidentiality of their transactions
1.97 1.22 1.58 1.10 0.77 11
Convenient service hours 1.47 1.69 1.17 1.33 1.42 88 Ease and timeliness in getting materials from other libraries
1.46 0.97 1.22 1.66 1.30 53
Librarians teaching me how to effectively use the electronically available databases, journals, and books
1.56 1.56 1.58 1.40 1.21 86
Library keeping me informed about all of its services
1.44 1.44 1.45 1.61 1.49 100
Library orientations / instruction sessions 3.62 3.25 3.61 4.44 3.79 165 Making me aware of library resources and services
1.50 1.05 1.63 1.81 1.74 80
Resources added to library collections on request
1.42 1.30 1.36 1.53 1.24 52
Timely document delivery / interlibrary loan 1.23 1.05 1.18 1.37 1.25 93
3.2.4 General Satisfaction Questions Summary This table displays mean score and standard deviation for each of the general satisfaction questions: Satisfaction with Treatment, Satisfaction with Support, and Satisfaction with Overall Quality of Service, where n is the number of respondents for each particular question. These scores are calculated from responses to the general satisfaction questions on the LibQUAL+® survey, in which respondents rated their levels of general satisfaction on a scale from 1-9. Unified Question Response
Mean Response
SD n
How would you rate the overall quality of the service provided by the library?
7.82 1.14 740
In general, I am satisfied with library support for my learning, research, and/or teaching needs.
7.67 1.46 736
In general, I am satisfied with the way in which I am treated at the library. 8.04 1.20 739 American English Question Response
Mean Response
SD n
How would you rate the overall quality of the service provided by the library?
7.78 1.22 555
In general, I am satisfied with library support for my learning, research, and/or teaching needs.
7.63 1.49 554
In general, I am satisfied with the way in which I am treated at the library. 8.00 1.24 554 Canadian French Question Response
Mean Response
SD n
How would you rate the overall quality of the service provided by the library?
7.94 0.82 185
In general, I am satisfied with library support for my learning, research, and/or teaching needs.
7.79 1.37 182

Revised 9/17/07
43
Question Response Mean
Response SD
n
In general, I am satisfied with the way in which I am treated at the library. 8.16 1.05 185
3.2.5 Information Literacy Outcomes Questions Summary This table displays the mean score and standard deviation for each of the information literacy outcomes questions, where n is the number of respondents for each particular question. These scores are calculated from responses to the information literacy outcomes questions on the LibQUAL+® survey, in which respondents rated their levels of general satisfaction on a scale from 1-9 with 1 being "strongly disagree" and 9 representing "strongly agree". Unified Question Response
Mean Response
SD n
The library aids my advancement in my academic discipline. 6.93 1.83 737 The library enables me to be more efficient in my academic pursuits. 6.99 1.81 734 The library helps me distinguish between trustworthy and untrustworthy information.
6.11 1.96 737
The library helps me stay abreast of developments in my field(s) of interest. 7.07 1.71 739 The library provides me with the information skills I need in my work or study.
6.64 1.77 735
American English Question Response
Mean Response
SD n
The library aids my advancement in my academic discipline. 6.87 1.91 554 The library enables me to be more efficient in my academic pursuits. 7.02 1.85 553 The library helps me distinguish between trustworthy and untrustworthy information.
6.04 1.96 555
The library helps me stay abreast of developments in my field(s) of interest. 7.00 1.83 555 The library provides me with the information skills I need in my work or study. 6.65 1.82 554 Canadian French Question Response
Mean Response
SD n
The library aids my advancement in my academic discipline. 7.13 1.54 183 The library enables me to be more efficient in my academic pursuits. 6.91 1.67 181 The library helps me distinguish between trustworthy and untrustworthy information.
6.32 1.96 182
The library helps me stay abreast of developments in my field(s) of interest. 7.27 1.31 184 The library provides me with the information skills I need in my work or study. 6.61 1.62 181

Revised 9/17/07
44
3.2.6 Library Use Summary This chart shows a graphic representation of library use (both on the premises and electronically), as well as use of non-library information gateways such as Yahoo™ and Google™. Bars represent the frequency with which respondents report using these resources: Daily, Weekly, Monthly, Quarterly, or Never. The table below the chart displays the number and percentage of respondents who selected each option. Unified
0%
10%
20%
30%
40%
50%
60%
70%
80%
90%
100%
Daily Weekly Monthly Quarterly Never
Frequency
Perc
enta
ge How often do you access library resources through alibrary Web page?
How often do you use resources on library premises?
How often do you use Yahoo(TM), Google(TM), ornon-library gatew ays for information?
Master Question Daily Weekly Monthly Quarterly Never n How often do you access library resources through a library Web page?
198 235 125 96 85 739
How often do you use resources on library premises? 69 182 173 208 108 740 How often do you use Yahoo(TM), Google(TM), or non-library gateways for information?
501 148 41 25 25 740
Master Question Daily % Weekly
% Monthly
% Quarterly
% Never
% Total
How often do you access library resources through a library Web page?
27% 32% 17% 13% 12% 100%
How often do you use resources on library premises? 9% 25% 23% 28% 15% 100% How often do you use Yahoo(TM), Google(TM), or non-library gateways for information?
68% 20% 6% 3% 3% 100%

Revised 9/17/07
45
American English
0%
10%
20%
30%
40%
50%
60%
70%
80%
90%
100%
Daily Weekly Monthly Quarterly Never
Frequency
Perc
enta
ge How often do you access library resources through alibrary Web page?
How often do you use resources on library premises?
How often do you use Yahoo(TM), Google(TM), ornon-library gatew ays for information?
Master Question Daily Weekly Monthly Quarterly Never n How often do you access library resources through a library Web page?
166 185 90 59 54 554
How often do you use resources on library premises? 56 142 123 138 96 555 How often do you use Yahoo(TM), Google(TM), or non-library gateways for information?
386 105 33 13 18 555
Master Question Daily % Weekly
% Monthly
% Quarterly
% Never
% Total
How often do you access library resources through a library Web page?
30% 33% 16% 11% 10% 100%
How often do you use resources on library premises? 10% 26% 22% 25% 17% 100% How often do you use Yahoo(TM), Google(TM), or non-library gateways for information?
70% 19% 6% 2% 3% 100%
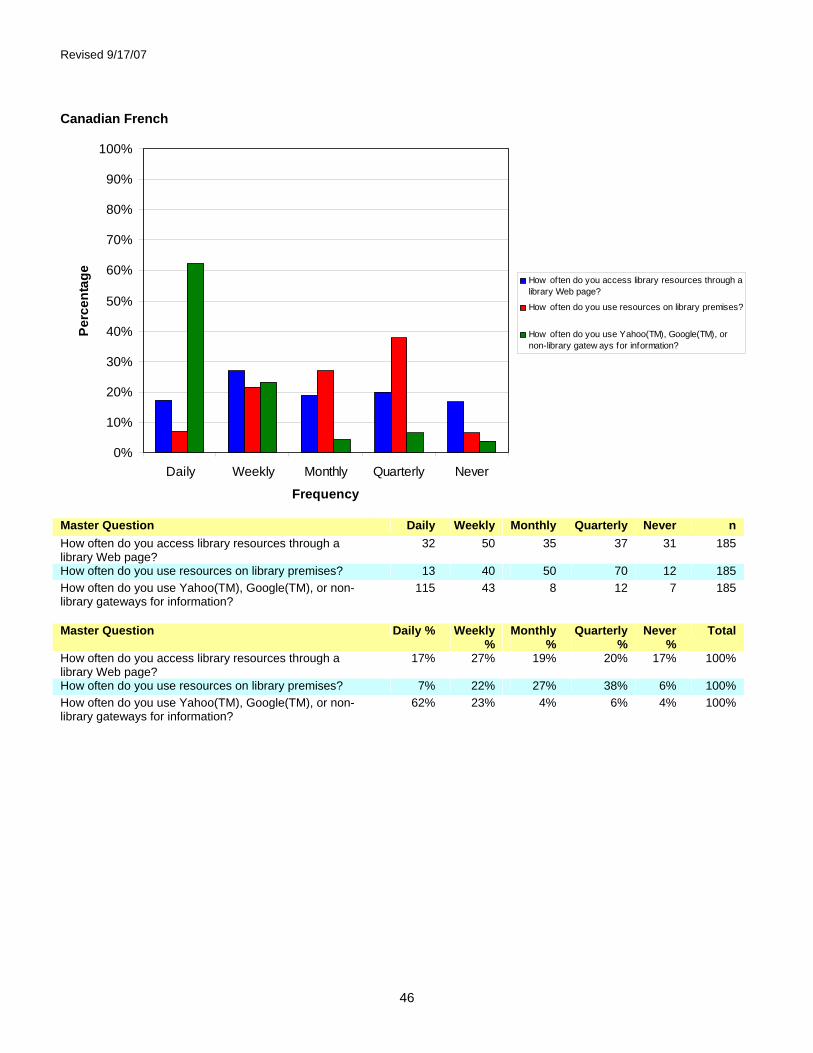
Revised 9/17/07
46
Canadian French
0%
10%
20%
30%
40%
50%
60%
70%
80%
90%
100%
Daily Weekly Monthly Quarterly Never
Frequency
Perc
enta
ge How often do you access library resources through alibrary Web page?
How often do you use resources on library premises?
How often do you use Yahoo(TM), Google(TM), ornon-library gatew ays for information?
Master Question Daily Weekly Monthly Quarterly Never n How often do you access library resources through a library Web page?
32 50 35 37 31 185
How often do you use resources on library premises? 13 40 50 70 12 185 How often do you use Yahoo(TM), Google(TM), or non-library gateways for information?
115 43 8 12 7 185
Master Question Daily % Weekly
% Monthly
% Quarterly
% Never
% Total
How often do you access library resources through a library Web page?
17% 27% 19% 20% 17% 100%
How often do you use resources on library premises? 7% 22% 27% 38% 6% 100% How often do you use Yahoo(TM), Google(TM), or non-library gateways for information?
62% 23% 4% 6% 4% 100%
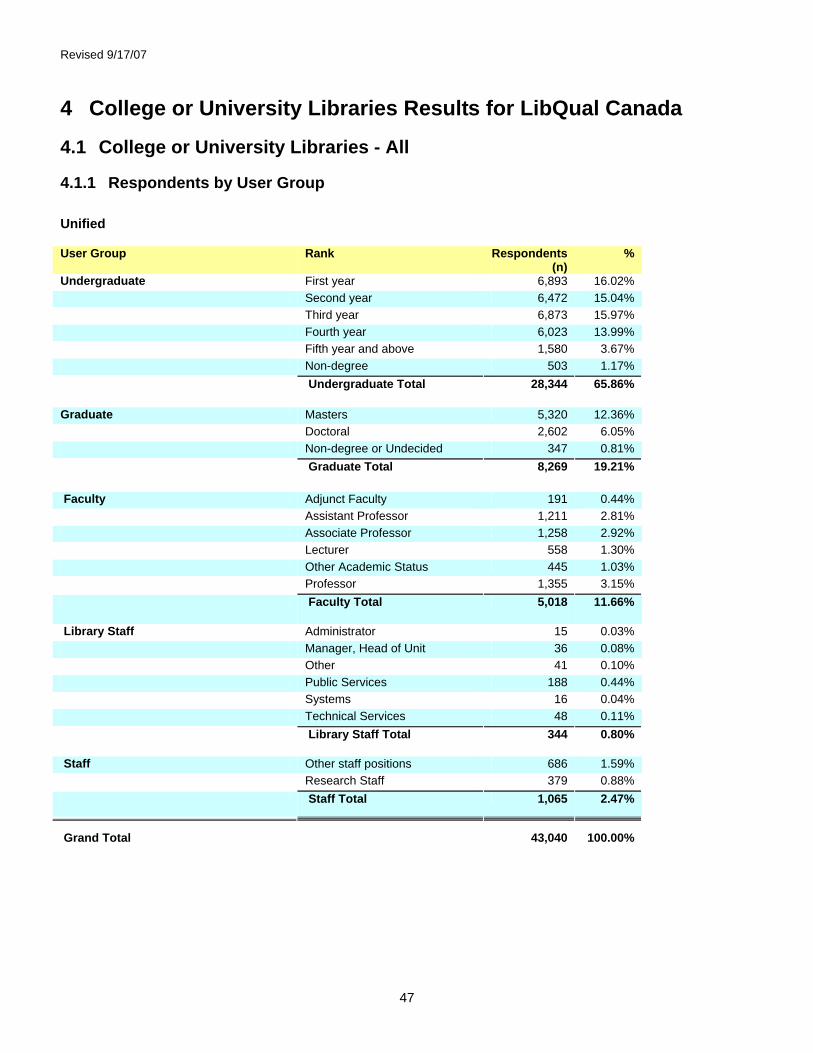
Revised 9/17/07
47
4 College or University Libraries Results for LibQual Canada
4.1 College or University Libraries - All
4.1.1 Respondents by User Group Unified User Group Rank Respondents
(n) %
Undergraduate First year 6,893 16.02% Second year 6,472 15.04% Third year 6,873 15.97% Fourth year 6,023 13.99% Fifth year and above 1,580 3.67% Non-degree 503 1.17% Undergraduate Total 28,344 65.86%
Graduate Masters 5,320 12.36% Doctoral 2,602 6.05% Non-degree or Undecided 347 0.81% Graduate Total 8,269 19.21%
Faculty Adjunct Faculty 191 0.44% Assistant Professor 1,211 2.81% Associate Professor 1,258 2.92% Lecturer 558 1.30% Other Academic Status 445 1.03% Professor 1,355 3.15% Faculty Total 5,018 11.66%
Library Staff Administrator 15 0.03% Manager, Head of Unit 36 0.08% Other 41 0.10% Public Services 188 0.44% Systems 16 0.04% Technical Services 48 0.11% Library Staff Total 344 0.80%
Staff Other staff positions 686 1.59% Research Staff 379 0.88% Staff Total 1,065 2.47%
Grand Total 43,040 100.00%
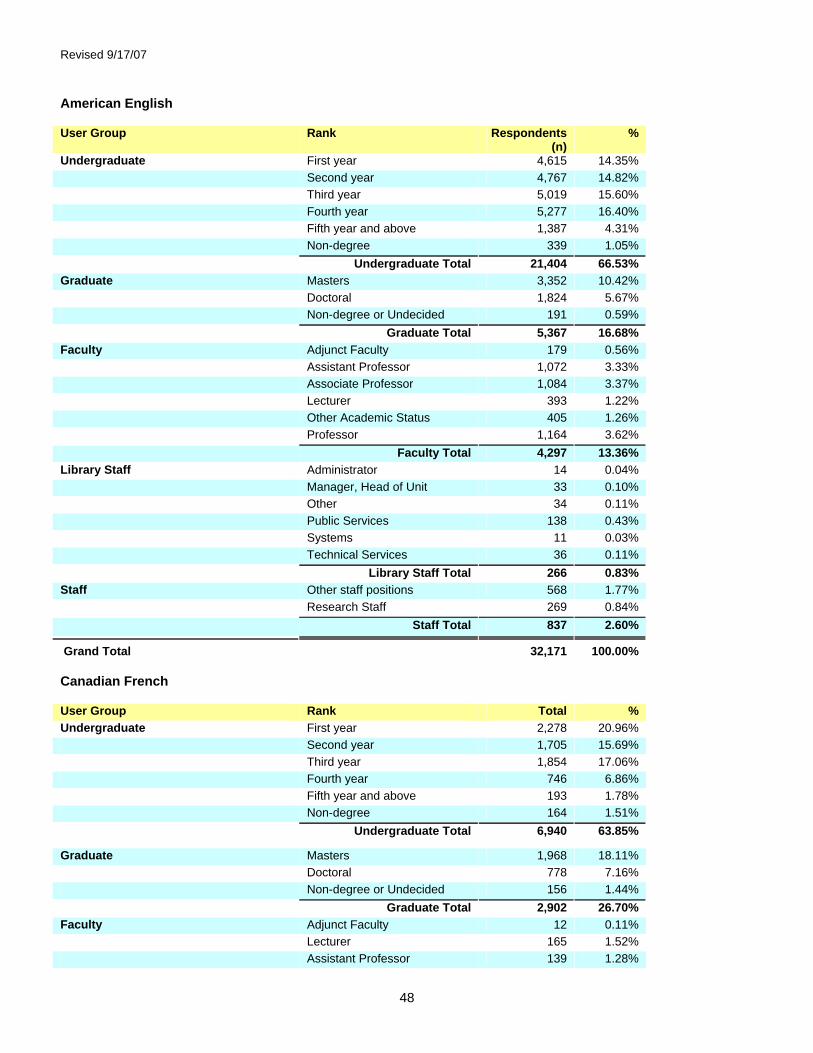
Revised 9/17/07
48
American English User Group Rank Respondents
(n) %
Undergraduate First year 4,615 14.35% Second year 4,767 14.82% Third year 5,019 15.60% Fourth year 5,277 16.40% Fifth year and above 1,387 4.31% Non-degree 339 1.05%
Undergraduate Total 21,404 66.53% Graduate Masters 3,352 10.42% Doctoral 1,824 5.67% Non-degree or Undecided 191 0.59%
Graduate Total 5,367 16.68% Faculty Adjunct Faculty 179 0.56% Assistant Professor 1,072 3.33% Associate Professor 1,084 3.37% Lecturer 393 1.22% Other Academic Status 405 1.26% Professor 1,164 3.62%
Faculty Total 4,297 13.36% Library Staff Administrator 14 0.04% Manager, Head of Unit 33 0.10% Other 34 0.11% Public Services 138 0.43% Systems 11 0.03% Technical Services 36 0.11%
Library Staff Total 266 0.83% Staff Other staff positions 568 1.77% Research Staff 269 0.84%
Staff Total 837 2.60%
Grand Total 32,171 100.00% Canadian French User Group Rank Total % Undergraduate First year 2,278 20.96% Second year 1,705 15.69% Third year 1,854 17.06% Fourth year 746 6.86% Fifth year and above 193 1.78% Non-degree 164 1.51% Undergraduate Total 6,940 63.85%
Graduate Masters 1,968 18.11% Doctoral 778 7.16% Non-degree or Undecided 156 1.44% Graduate Total 2,902 26.70% Faculty Adjunct Faculty 12 0.11% Lecturer 165 1.52% Assistant Professor 139 1.28%

Revised 9/17/07
49
User Group Rank Total % Associate Professor 174 1.60% Other Academic Status 40 0.37% Professor 191 1.76% Faculty Total 721 6.63% Library Staff Administrator 1 0.01% Manager, Head of Unit 3 0.03% Other 7 0.06% Public Services 50 0.46% Systems 5 0.05% Technical Services 12 0.11% Library Staff Total 78 0.72% Staff Other staff positions 118 1.09% Research Staff 110 1.01% Staff Total 228 2.10%
Grand Total 10,869 100.00%

Revised 9/17/07
50
4.1.2 Population and Respondent Profiles by User Sub-Group The charts and tables below show a breakdown of survey respondents by sub-group (e.g. First year, Masters, Professor), based on user responses to the demographic questions at the end of the survey instrument and the demographic data provided by institutions in the online Representativeness section*. The chart maps percentage of respondents for each user subgroup in red. Population percentages for each user subgroup are mapped in blue. The table shows the number and percentage for each user sub-group for the general population (N) and for survey respondents (n). *Note: Participating institutions were not required to complete the Representativeness section. When population data is missing or incomplete, it is because this data was not provided. Unified
0%
5%
10%
15%
20%
25%
First
year
Secon
d yea
r
Third
year
Fourt
h yea
r
Fifth
year
and a
bove
Non-de
gree
Master
s
Doctor
al
Non-de
gree o
r Und
ecide
d
Adjunc
t Fac
ulty
Lectu
rer
Assist
ant P
rofes
sor
Assoc
iate P
rofes
sor
Profes
sor
Other A
cade
mic Stat
us
Discipline
Perc
enta
ge
Population Profile by User Sub-Group
Respondent Profile by User Sub-Group
Level Rank Population
(N) Population
% Respondents
(n) Respondents
% N%-n%
Undergraduate First year 231,761 24.40% 6,893 16.56% 7.84% Second year 170,554 17.95% 6,472 15.55% 2.41% Third year 161,576 17.01% 6,873 16.51% 0.50% Fourth year 124,896 13.15% 6,023 14.47% -1.32% Fifth year and above 21,426 2.26% 1,580 3.80% -1.54% Non-degree 37,214 3.92% 503 1.21% 2.71% Undergraduate Total 747,427 78.68% 28,344 68.08% 10.60% Graduate Masters 93,457 9.84% 5,320 12.78% -2.94% Doctoral 38,701 4.07% 2,602 6.25% -2.18% Non-degree or Undecided 4,882 0.51% 347 0.83% -0.32% Graduate Total 137,040 14.43% 8,269 19.86% -5.44%
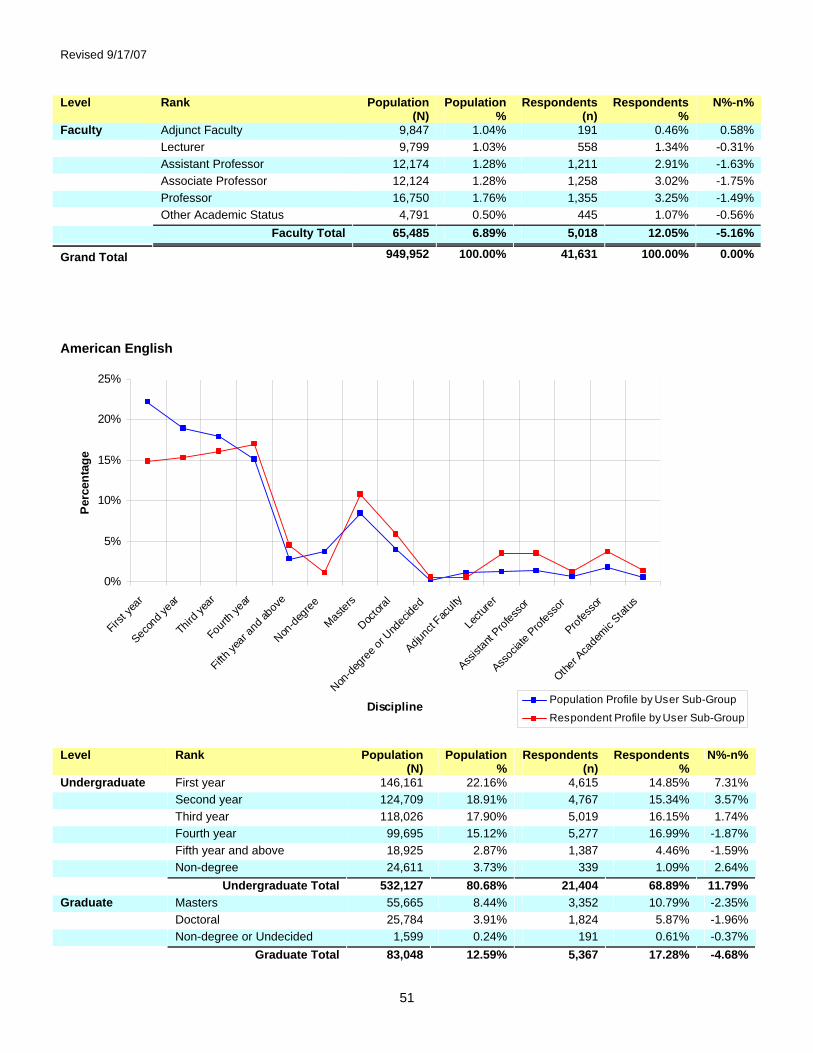
Revised 9/17/07
51
Level Rank Population (N)
Population %
Respondents (n)
Respondents %
N%-n%
Faculty Adjunct Faculty 9,847 1.04% 191 0.46% 0.58% Lecturer 9,799 1.03% 558 1.34% -0.31% Assistant Professor 12,174 1.28% 1,211 2.91% -1.63% Associate Professor 12,124 1.28% 1,258 3.02% -1.75% Professor 16,750 1.76% 1,355 3.25% -1.49% Other Academic Status 4,791 0.50% 445 1.07% -0.56% Faculty Total 65,485 6.89% 5,018 12.05% -5.16%
Grand Total 949,952 100.00% 41,631 100.00% 0.00% American English
0%
5%
10%
15%
20%
25%
First
year
Secon
d yea
r
Third
year
Fourt
h yea
r
Fifth
year
and a
bove
Non-de
gree
Master
s
Doctor
al
Non-de
gree o
r Und
ecide
d
Adjunc
t Fac
ulty
Lectu
rer
Assist
ant P
rofes
sor
Assoc
iate P
rofes
sor
Profes
sor
Other A
cade
mic Stat
us
Discipline
Perc
enta
ge
Population Profile by User Sub-Group
Respondent Profile by User Sub-Group
Level Rank Population
(N) Population
% Respondents
(n) Respondents
% N%-n%
Undergraduate First year 146,161 22.16% 4,615 14.85% 7.31% Second year 124,709 18.91% 4,767 15.34% 3.57% Third year 118,026 17.90% 5,019 16.15% 1.74% Fourth year 99,695 15.12% 5,277 16.99% -1.87% Fifth year and above 18,925 2.87% 1,387 4.46% -1.59% Non-degree 24,611 3.73% 339 1.09% 2.64% Undergraduate Total 532,127 80.68% 21,404 68.89% 11.79% Graduate Masters 55,665 8.44% 3,352 10.79% -2.35% Doctoral 25,784 3.91% 1,824 5.87% -1.96% Non-degree or Undecided 1,599 0.24% 191 0.61% -0.37% Graduate Total 83,048 12.59% 5,367 17.28% -4.68%

Revised 9/17/07
52
Level Rank Population (N)
Population %
Respondents (n)
Respondents %
N%-n%
Faculty Adjunct Faculty 7,699 1.17% 179 0.58% 0.59% Lecturer 8,251 1.25% 1,072 3.45% -2.20% Assistant Professor 8,591 1.30% 1,084 3.49% -2.19% Associate Professor 4,573 0.69% 393 1.26% -0.57% Professor 11,651 1.77% 1,164 3.75% -1.98% Other Academic Status 3,586 0.54% 405 1.30% -0.76% Faculty Total 44,351 6.72% 4,297 13.83% -7.11%
Grand Total 659,526 100.00% 31,068 100.00% 0.00% Canadian French
0%
5%
10%
15%
20%
25%
30%
First
year
Secon
d yea
r
Third
year
Fourt
h yea
r
Fifth
year
and a
bove
Non-de
gree
Master
s
Doctor
al
Non-de
gree o
r Und
ecide
d
Adjunc
t Fac
ulty
Lectu
rer
Assist
ant P
rofes
sor
Assoc
iate P
rofes
sor
Profes
sor
Other A
cade
mic Stat
us
Discipline
Perc
enta
ge
Population Profile by User Sub-Group
Respondent Profile by User Sub-Group
Level Rank Population
(N) Population
% Respondents
(n) Respondents
% N%-n%
Undergraduate First year 85,600 29.47% 2,278 21.57% 7.91% Second year 45,845 15.79% 1,705 16.14% -0.36% Third year 43,550 15.00% 1,854 17.55% -2.56% Fourth year 25,201 8.68% 746 7.06% 1.61% Fifth year and above 2,501 0.86% 193 1.83% -0.97% Non-degree 12,603 4.34% 164 1.55% 2.79% Undergraduate Total 215,300 74.13% 6,940 65.70% 8.43% Graduate Masters 37,792 13.01% 1,968 18.63% -5.62% Doctoral 12,917 4.45% 778 7.37% -2.92% Non-degree or Undecided 3,283 1.13% 156 1.48% -0.35% Graduate Total 53,992 18.59% 2,902 27.47% -8.88% Faculty Adjunct Faculty 2,148 0.74% 12 0.11% 0.63% Lecturer 5,226 1.80% 165 1.56% 0.24% Assistant Professor 3,923 1.35% 139 1.32% 0.03%
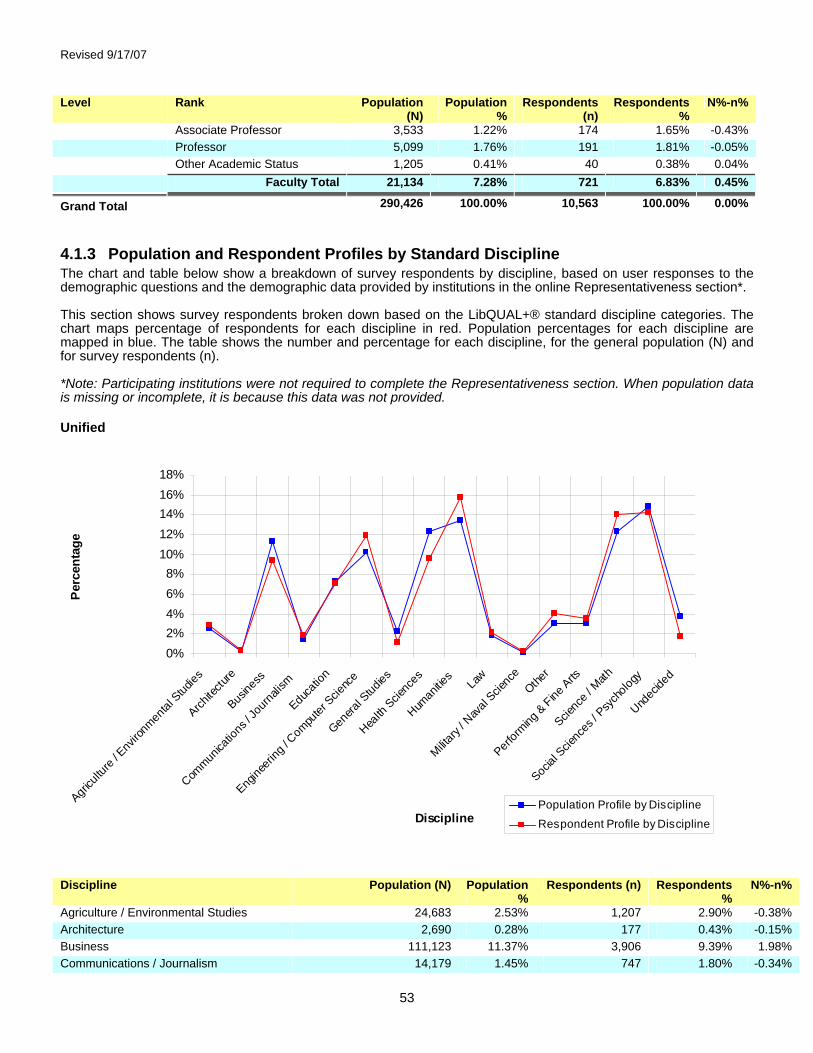
Revised 9/17/07
53
Level Rank Population (N)
Population %
Respondents (n)
Respondents %
N%-n%
Associate Professor 3,533 1.22% 174 1.65% -0.43% Professor 5,099 1.76% 191 1.81% -0.05% Other Academic Status 1,205 0.41% 40 0.38% 0.04% Faculty Total 21,134 7.28% 721 6.83% 0.45%
Grand Total 290,426 100.00% 10,563 100.00% 0.00%
4.1.3 Population and Respondent Profiles by Standard Discipline The chart and table below show a breakdown of survey respondents by discipline, based on user responses to the demographic questions and the demographic data provided by institutions in the online Representativeness section*. This section shows survey respondents broken down based on the LibQUAL+® standard discipline categories. The chart maps percentage of respondents for each discipline in red. Population percentages for each discipline are mapped in blue. The table shows the number and percentage for each discipline, for the general population (N) and for survey respondents (n). *Note: Participating institutions were not required to complete the Representativeness section. When population data is missing or incomplete, it is because this data was not provided. Unified
0%2%4%6%8%
10%12%14%16%18%
Agricu
lture
/ Env
ironm
ental
Stud
ies
Archite
cture
Busine
ss
Commun
icatio
ns / J
ourna
lism
Educa
tion
Engine
ering
/ Com
puter
Scienc
e
Genera
l Stud
ies
Health
Scienc
es
Human
ities
Law
Military
/ Nav
al Scie
nce
Other
Perform
ing & Fine
Arts
Scienc
e / M
ath
Social
Scienc
es / P
sych
ology
Undec
ided
Discipline
Per
cent
age
Population Profile by Discipline
Respondent Profile by Discipline
Discipline Population (N) Population
% Respondents (n) Respondents
% N%-n%
Agriculture / Environmental Studies 24,683 2.53% 1,207 2.90% -0.38% Architecture 2,690 0.28% 177 0.43% -0.15% Business 111,123 11.37% 3,906 9.39% 1.98% Communications / Journalism 14,179 1.45% 747 1.80% -0.34%
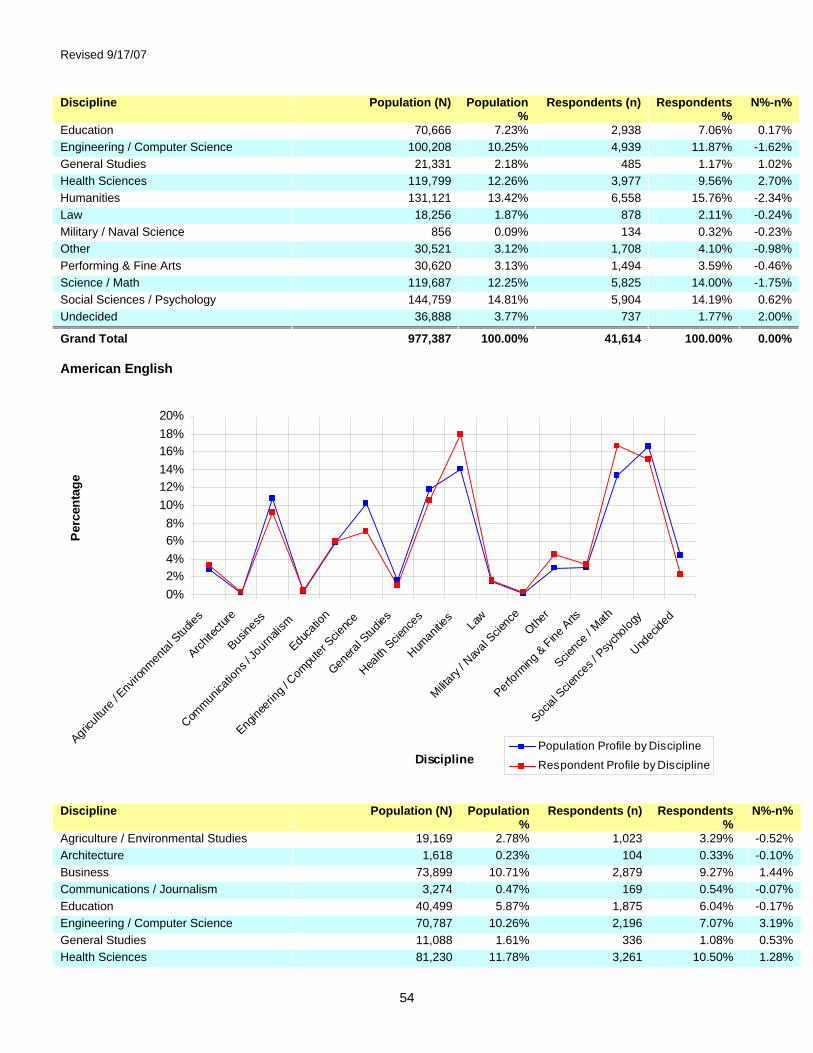
Revised 9/17/07
54
Discipline Population (N) Population %
Respondents (n) Respondents %
N%-n%
Education 70,666 7.23% 2,938 7.06% 0.17% Engineering / Computer Science 100,208 10.25% 4,939 11.87% -1.62% General Studies 21,331 2.18% 485 1.17% 1.02% Health Sciences 119,799 12.26% 3,977 9.56% 2.70% Humanities 131,121 13.42% 6,558 15.76% -2.34% Law 18,256 1.87% 878 2.11% -0.24% Military / Naval Science 856 0.09% 134 0.32% -0.23% Other 30,521 3.12% 1,708 4.10% -0.98% Performing & Fine Arts 30,620 3.13% 1,494 3.59% -0.46% Science / Math 119,687 12.25% 5,825 14.00% -1.75% Social Sciences / Psychology 144,759 14.81% 5,904 14.19% 0.62% Undecided 36,888 3.77% 737 1.77% 2.00%
Grand Total 977,387 100.00% 41,614 100.00% 0.00% American English
0%2%4%6%8%
10%12%14%16%18%20%
Agricu
lture
/ Env
ironm
ental
Stud
ies
Archite
cture
Busine
ss
Commun
icatio
ns / J
ourna
lism
Educa
tion
Engine
ering
/ Com
puter
Scienc
e
Genera
l Stud
ies
Health
Scienc
es
Human
ities
Law
Military
/ Nav
al Scie
nce
Other
Perform
ing & Fine
Arts
Scienc
e / M
ath
Social
Scienc
es / P
sych
ology
Undec
ided
Discipline
Per
cent
age
Population Profile by Discipline
Respondent Profile by Discipline
Discipline Population (N) Population
% Respondents (n) Respondents
% N%-n%
Agriculture / Environmental Studies 19,169 2.78% 1,023 3.29% -0.52% Architecture 1,618 0.23% 104 0.33% -0.10% Business 73,899 10.71% 2,879 9.27% 1.44% Communications / Journalism 3,274 0.47% 169 0.54% -0.07% Education 40,499 5.87% 1,875 6.04% -0.17% Engineering / Computer Science 70,787 10.26% 2,196 7.07% 3.19% General Studies 11,088 1.61% 336 1.08% 0.53% Health Sciences 81,230 11.78% 3,261 10.50% 1.28%

Revised 9/17/07
55
Discipline Population (N) Population %
Respondents (n) Respondents %
N%-n%
Humanities 97,384 14.12% 5,578 17.96% -3.84% Law 10,248 1.49% 494 1.59% -0.11% Military / Naval Science 856 0.12% 95 0.31% -0.18% Other 21,013 3.05% 1,415 4.56% -1.51% Performing & Fine Arts 21,759 3.15% 1,066 3.43% -0.28% Science / Math 92,286 13.38% 5,176 16.67% -3.29% Social Sciences / Psychology 113,943 16.52% 4,699 15.13% 1.39% Undecided 30,754 4.46% 690 2.22% 2.24%
Grand Total 689,807 100.00% 31,056 100.00% 0.00% Canadian French
0%
5%
10%
15%
20%
25%
30%
Agricu
lture
/ Env
ironm
ental
Stud
ies
Archite
cture
Busine
ss
Commun
icatio
ns / J
ourna
lism
Educa
tion
Engine
ering
/ Com
puter
Scienc
e
Genera
l Stud
ies
Health
Scienc
es
Human
ities
Law
Military
/ Nav
al Scie
nce
Other
Perform
ing & Fine
Arts
Scienc
e / M
ath
Social
Scienc
es / P
sych
ology
Undec
ided
Discipline
Per
cent
age
Population Profile by Discipline
Respondent Profile by Discipline
Discipline Population (N) Population
% Respondents (n) Respondents
% N%-n%
Agriculture / Environmental Studies 5,514 1.92% 184 1.74% 0.17% Architecture 1,072 0.37% 73 0.69% -0.32% Business 37,224 12.94% 1,027 9.73% 3.22% Communications / Journalism 10,905 3.79% 578 5.47% -1.68% Education 30,167 10.49% 1,063 10.07% 0.42% Engineering / Computer Science 29,421 10.23% 2,743 25.98% -
15.75% General Studies 10,243 3.56% 149 1.41% 2.15% Health Sciences 38,569 13.41% 716 6.78% 6.63% Humanities 33,737 11.73% 980 9.28% 2.45% Law 8,008 2.78% 384 3.64% -0.85% Military / Naval Science - 0.00% 39 0.37% -0.37%

Revised 9/17/07
56
Discipline Population (N) Population %
Respondents (n) Respondents %
N%-n%
Other 9,508 3.31% 293 2.78% 0.53% Performing & Fine Arts 8,861 3.08% 428 4.05% -0.97% Science / Math 27,401 9.53% 649 6.15% 3.38% Social Sciences / Psychology 30,816 10.72% 1,205 11.41% -0.70% Undecided 6,134 2.13% 47 0.45% 1.69%
Grand Total 287,580 100.00% 10,558 100.00% 0.00%
4.1.4 Respondent Profile by Age This table shows a breakdown of survey respondents by age; both the number of respondents (n) and the percentage of the total number of respondents represented by each group are displayed. Unified Age Group Respondents (n) Respondents % Under 18 119 0.28% 18 - 22 18,273 42.81% 23 - 30 13,092 30.67% 31 - 45 6,677 15.64% 46 - 65 4,270 10.00% Over 65 250 0.59%
Grand Total 42,681 100.00% By Language Response Response Language Age Group Respondents (n) Respondents % American English Under 18 100 0.23% 18 - 22 14,365 33.66% 23 - 30 8,616 20.19% 31 - 45 5,024 11.77% 46 - 65 3,557 8.33% Over 65 233 0.55% American English Total 31,895 74.73% Canadian French Under 18 19 0.04% 18 - 22 3,908 9.16% 23 - 30 4,476 10.49% 31 - 45 1,653 3.87% 46 - 65 713 1.67% Over 65 17 0.04% Canadian French Total 10,786 25.27%
Grand Total 42,681 100.00%
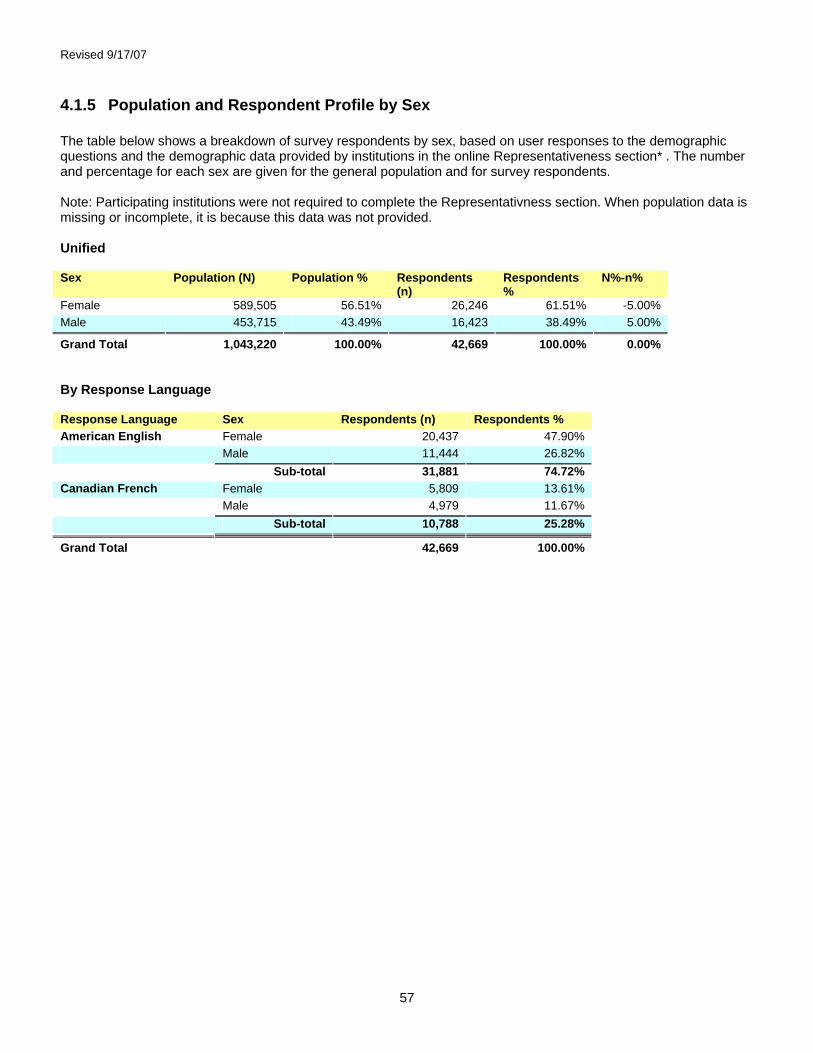
Revised 9/17/07
57
4.1.5 Population and Respondent Profile by Sex The table below shows a breakdown of survey respondents by sex, based on user responses to the demographic questions and the demographic data provided by institutions in the online Representativeness section* . The number and percentage for each sex are given for the general population and for survey respondents. Note: Participating institutions were not required to complete the Representativness section. When population data is missing or incomplete, it is because this data was not provided. Unified Sex Population (N) Population % Respondents
(n) Respondents %
N%-n%
Female 589,505 56.51% 26,246 61.51% -5.00% Male 453,715 43.49% 16,423 38.49% 5.00%
Grand Total 1,043,220 100.00% 42,669 100.00% 0.00% By Response Language Response Language Sex Respondents (n) Respondents % American English Female 20,437 47.90% Male 11,444 26.82% Sub-total 31,881 74.72% Canadian French Female 5,809 13.61% Male 4,979 11.67% Sub-total 10,788 25.28%
Grand Total 42,669 100.00%
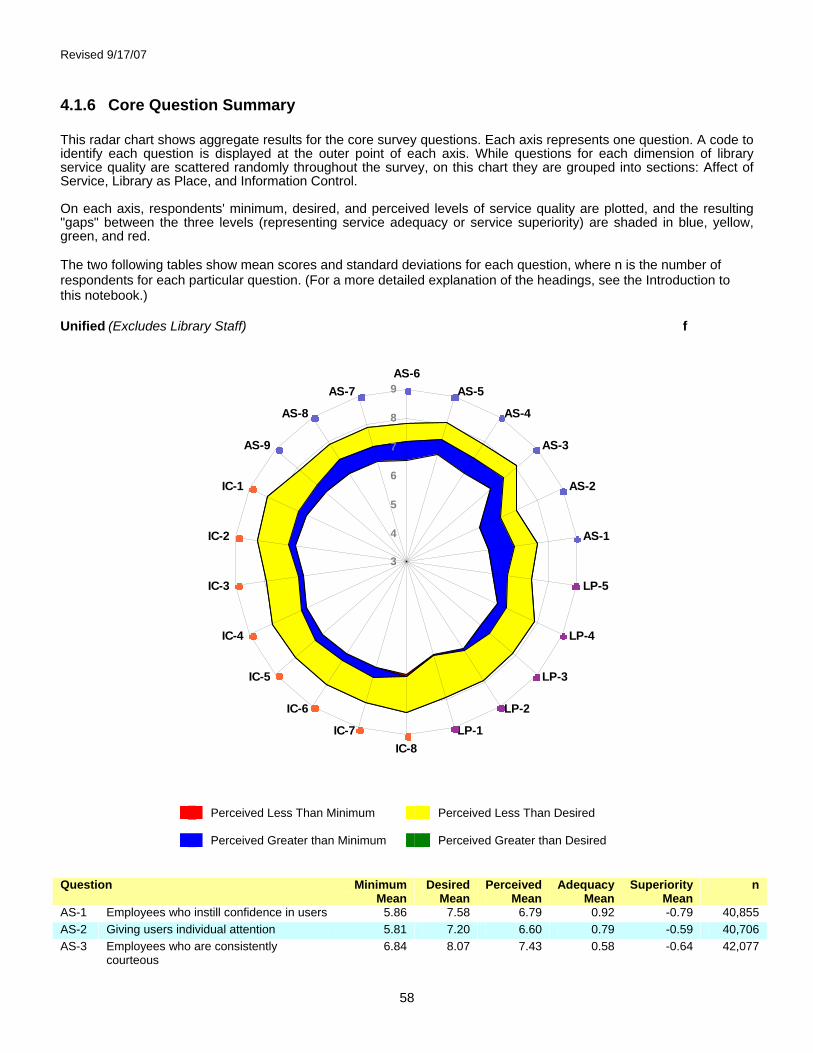
Revised 9/17/07
58
4.1.6 Core Question Summary This radar chart shows aggregate results for the core survey questions. Each axis represents one question. A code to identify each question is displayed at the outer point of each axis. While questions for each dimension of library service quality are scattered randomly throughout the survey, on this chart they are grouped into sections: Affect of Service, Library as Place, and Information Control. On each axis, respondents' minimum, desired, and perceived levels of service quality are plotted, and the resulting "gaps" between the three levels (representing service adequacy or service superiority) are shaded in blue, yellow, green, and red. The two following tables show mean scores and standard deviations for each question, where n is the number of respondents for each particular question. (For a more detailed explanation of the headings, see the Introduction to this notebook.) Unified (Excludes Library Staff) f
Perceived Less Than Minimum Perceived Less Than Desired Perceived Greater than Minimum Perceived Greater than Desired
Question Minimum
Mean Desired
Mean Perceived
Mean Adequacy
Mean Superiority
Mean n
AS-1 Employees who instill confidence in users 5.86 7.58 6.79 0.92 -0.79 40,855 AS-2 Giving users individual attention 5.81 7.20 6.60 0.79 -0.59 40,706 AS-3 Employees who are consistently
courteous 6.84 8.07 7.43 0.58 -0.64 42,077
3
4
5
6
7
8
9AS-6
AS-5
AS-4
AS-3
AS-2
AS-1
LP-5
LP-4
LP-3
LP-2
LP-1IC-8
IC-7
IC-6
IC-5
IC-4
IC-3
IC-2
IC-1
AS-9
AS-8
AS-7
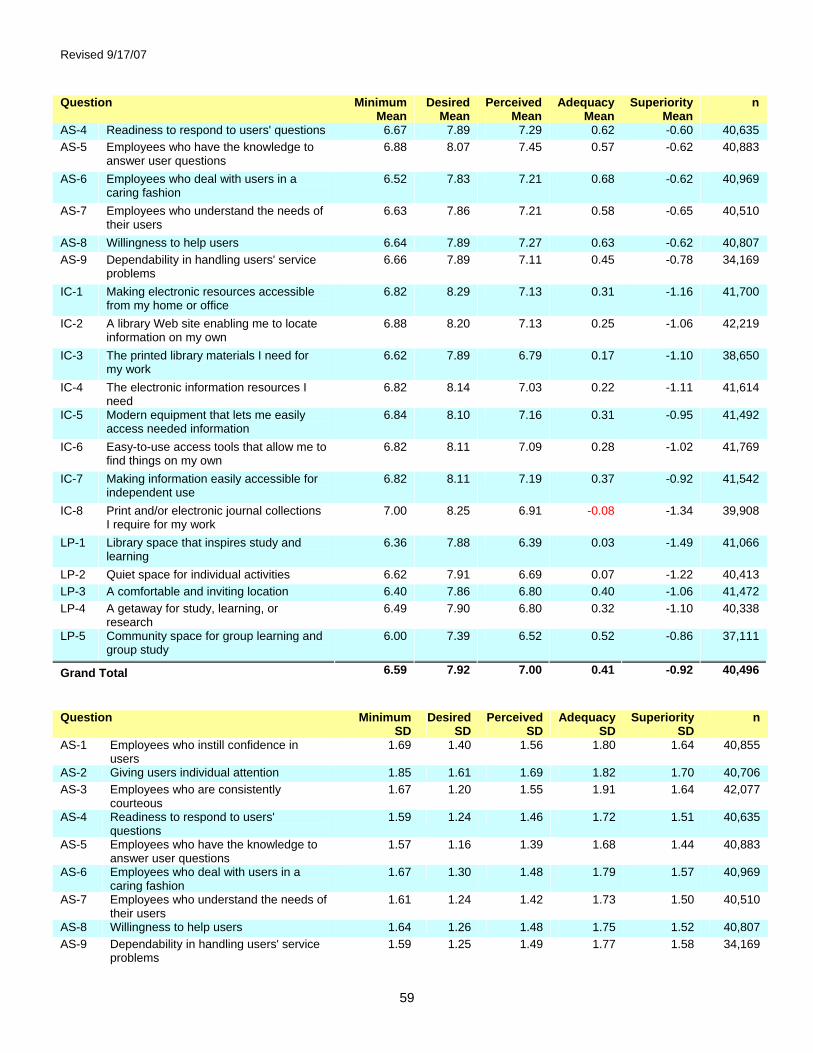
Revised 9/17/07
59
Question Minimum Mean
Desired Mean
Perceived Mean
Adequacy Mean
Superiority Mean
n
AS-4 Readiness to respond to users' questions 6.67 7.89 7.29 0.62 -0.60 40,635 AS-5 Employees who have the knowledge to
answer user questions 6.88 8.07 7.45 0.57 -0.62 40,883
AS-6 Employees who deal with users in a caring fashion
6.52 7.83 7.21 0.68 -0.62 40,969
AS-7 Employees who understand the needs of their users
6.63 7.86 7.21 0.58 -0.65 40,510
AS-8 Willingness to help users 6.64 7.89 7.27 0.63 -0.62 40,807 AS-9 Dependability in handling users' service
problems 6.66 7.89 7.11 0.45 -0.78 34,169
IC-1 Making electronic resources accessible from my home or office
6.82 8.29 7.13 0.31 -1.16 41,700
IC-2 A library Web site enabling me to locate information on my own
6.88 8.20 7.13 0.25 -1.06 42,219
IC-3 The printed library materials I need for my work
6.62 7.89 6.79 0.17 -1.10 38,650
IC-4 The electronic information resources I need
6.82 8.14 7.03 0.22 -1.11 41,614
IC-5 Modern equipment that lets me easily access needed information
6.84 8.10 7.16 0.31 -0.95 41,492
IC-6 Easy-to-use access tools that allow me to find things on my own
6.82 8.11 7.09 0.28 -1.02 41,769
IC-7 Making information easily accessible for independent use
6.82 8.11 7.19 0.37 -0.92 41,542
IC-8 Print and/or electronic journal collections I require for my work
7.00 8.25 6.91 -0.08 -1.34 39,908
LP-1 Library space that inspires study and learning
6.36 7.88 6.39 0.03 -1.49 41,066
LP-2 Quiet space for individual activities 6.62 7.91 6.69 0.07 -1.22 40,413 LP-3 A comfortable and inviting location 6.40 7.86 6.80 0.40 -1.06 41,472 LP-4 A getaway for study, learning, or
research 6.49 7.90 6.80 0.32 -1.10 40,338
LP-5 Community space for group learning and group study
6.00 7.39 6.52 0.52 -0.86 37,111
Grand Total 6.59 7.92 7.00 0.41 -0.92 40,496 Question Minimum
SD Desired
SD Perceived
SD Adequacy
SD Superiority
SD n
AS-1 Employees who instill confidence in users
1.69 1.40 1.56 1.80 1.64 40,855
AS-2 Giving users individual attention 1.85 1.61 1.69 1.82 1.70 40,706 AS-3 Employees who are consistently
courteous 1.67 1.20 1.55 1.91 1.64 42,077
AS-4 Readiness to respond to users' questions
1.59 1.24 1.46 1.72 1.51 40,635
AS-5 Employees who have the knowledge to answer user questions
1.57 1.16 1.39 1.68 1.44 40,883
AS-6 Employees who deal with users in a caring fashion
1.67 1.30 1.48 1.79 1.57 40,969
AS-7 Employees who understand the needs of their users
1.61 1.24 1.42 1.73 1.50 40,510
AS-8 Willingness to help users 1.64 1.26 1.48 1.75 1.52 40,807 AS-9 Dependability in handling users' service
problems 1.59 1.25 1.49 1.77 1.58 34,169
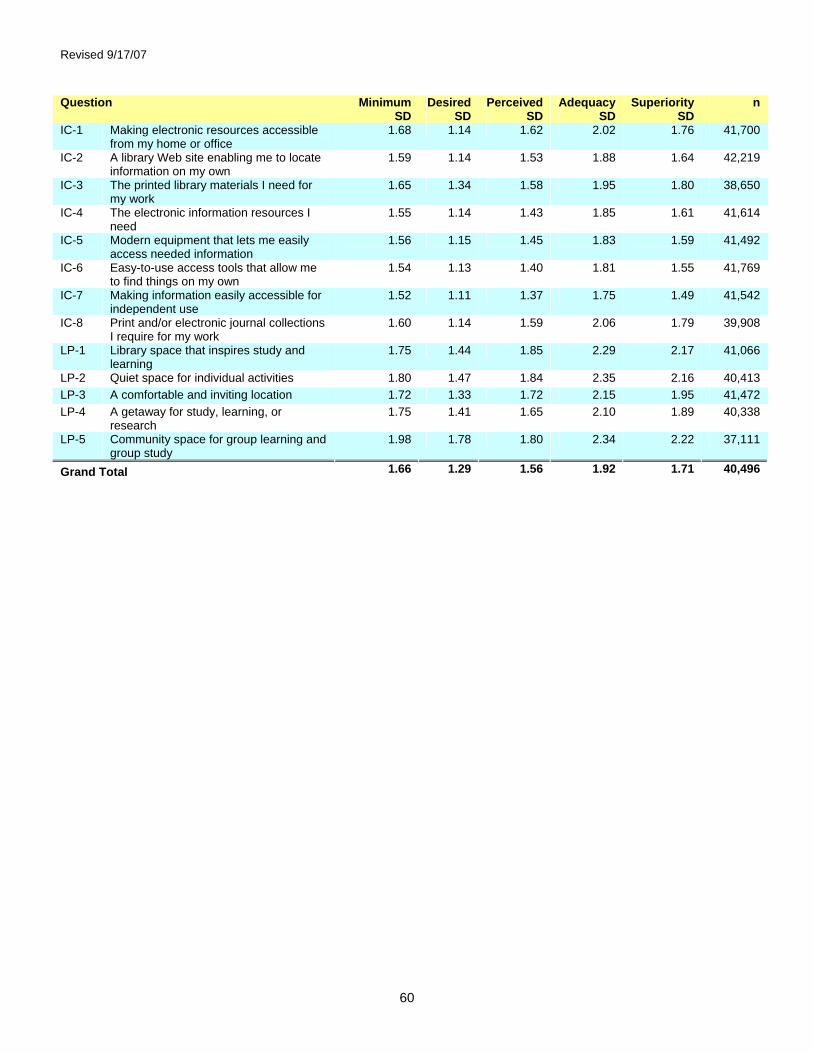
Revised 9/17/07
60
Question Minimum SD
Desired SD
Perceived SD
Adequacy SD
Superiority SD
n
IC-1 Making electronic resources accessible from my home or office
1.68 1.14 1.62 2.02 1.76 41,700
IC-2 A library Web site enabling me to locate information on my own
1.59 1.14 1.53 1.88 1.64 42,219
IC-3 The printed library materials I need for my work
1.65 1.34 1.58 1.95 1.80 38,650
IC-4 The electronic information resources I need
1.55 1.14 1.43 1.85 1.61 41,614
IC-5 Modern equipment that lets me easily access needed information
1.56 1.15 1.45 1.83 1.59 41,492
IC-6 Easy-to-use access tools that allow me to find things on my own
1.54 1.13 1.40 1.81 1.55 41,769
IC-7 Making information easily accessible for independent use
1.52 1.11 1.37 1.75 1.49 41,542
IC-8 Print and/or electronic journal collections I require for my work
1.60 1.14 1.59 2.06 1.79 39,908
LP-1 Library space that inspires study and learning
1.75 1.44 1.85 2.29 2.17 41,066
LP-2 Quiet space for individual activities 1.80 1.47 1.84 2.35 2.16 40,413 LP-3 A comfortable and inviting location 1.72 1.33 1.72 2.15 1.95 41,472 LP-4 A getaway for study, learning, or
research 1.75 1.41 1.65 2.10 1.89 40,338
LP-5 Community space for group learning and group study
1.98 1.78 1.80 2.34 2.22 37,111
Grand Total 1.66 1.29 1.56 1.92 1.71 40,496
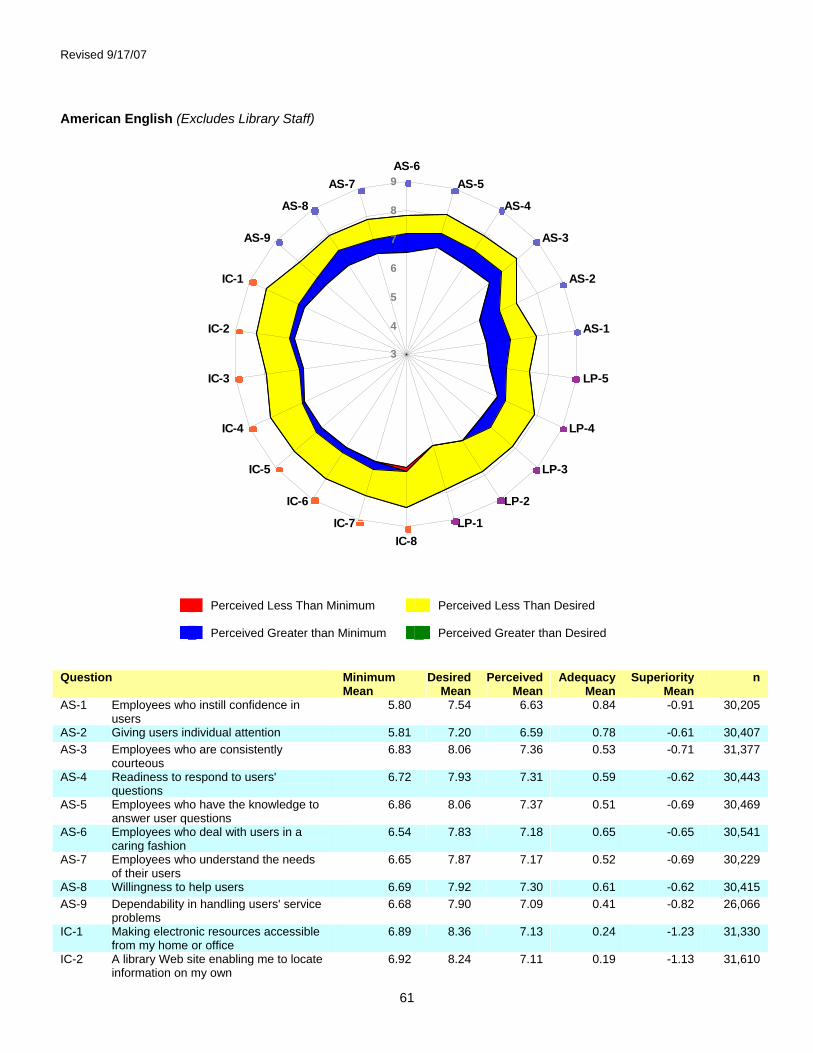
Revised 9/17/07
61
American English (Excludes Library Staff)
Perceived Less Than Minimum Perceived Less Than Desired Perceived Greater than Minimum Perceived Greater than Desired
Question Minimum
Mean Desired
Mean Perceived
Mean Adequacy
Mean Superiority
Mean n
AS-1 Employees who instill confidence in users
5.80 7.54 6.63 0.84 -0.91 30,205
AS-2 Giving users individual attention 5.81 7.20 6.59 0.78 -0.61 30,407 AS-3 Employees who are consistently
courteous 6.83 8.06 7.36 0.53 -0.71 31,377
AS-4 Readiness to respond to users' questions
6.72 7.93 7.31 0.59 -0.62 30,443
AS-5 Employees who have the knowledge to answer user questions
6.86 8.06 7.37 0.51 -0.69 30,469
AS-6 Employees who deal with users in a caring fashion
6.54 7.83 7.18 0.65 -0.65 30,541
AS-7 Employees who understand the needs of their users
6.65 7.87 7.17 0.52 -0.69 30,229
AS-8 Willingness to help users 6.69 7.92 7.30 0.61 -0.62 30,415 AS-9 Dependability in handling users' service
problems 6.68 7.90 7.09 0.41 -0.82 26,066
IC-1 Making electronic resources accessible from my home or office
6.89 8.36 7.13 0.24 -1.23 31,330
IC-2 A library Web site enabling me to locate information on my own
6.92 8.24 7.11 0.19 -1.13 31,610
3
4
5
6
7
8
9AS-6
AS-5
AS-4
AS-3
AS-2
AS-1
LP-5
LP-4
LP-3
LP-2
LP-1IC-8
IC-7
IC-6
IC-5
IC-4
IC-3
IC-2
IC-1
AS-9
AS-8
AS-7

Revised 9/17/07
62
Question Minimum Mean
Desired Mean
Perceived Mean
Adequacy Mean
Superiority Mean
n
IC-3 The printed library materials I need for my work
6.61 7.90 6.74 0.13 -1.15 29,387
IC-4 The electronic information resources I need
6.87 8.20 7.00 0.13 -1.20 31,236
IC-5 Modern equipment that lets me easily access needed information
6.89 8.13 7.14 0.25 -0.99 30,874
IC-6 Easy-to-use access tools that allow me to find things on my own
6.85 8.14 7.07 0.22 -1.07 31,185
IC-7 Making information easily accessible for independent use
6.86 8.13 7.17 0.31 -0.96 30,935
IC-8 Print and/or electronic journal collections I require for my work
7.06 8.30 6.91 -0.15 -1.39 30,175
LP-1 Library space that inspires study and learning
6.30 7.86 6.29 -0.01 -1.57 30,654
LP-2 Quiet space for individual activities 6.54 7.85 6.55 0.01 -1.30 30,046 LP-3 A comfortable and inviting location 6.41 7.87 6.86 0.45 -1.01 30,926 LP-4 A getaway for study, learning, or
research 6.47 7.88 6.77 0.30 -1.11 30,025
LP-5 Community space for group learning and group study
5.92 7.29 6.51 0.60 -0.78 27,458
Grand Total 6.60 7.93 6.97 0.37 -0.96 30,272 Question Minimum
SD Desired
SD Perceived
SD Adequacy
SD Superiority
SD n
AS-1 Employees who instill confidence in users
1.74 1.47 1.60 1.82 1.69 30,205
AS-2 Giving users individual attention 1.89 1.66 1.72 1.85 1.73 30,407 AS-3 Employees who are consistently
courteous 1.72 1.24 1.59 1.96 1.68 31,377
AS-4 Readiness to respond to users' questions 1.62 1.27 1.47 1.74 1.52 30,443 AS-5 Employees who have the knowledge to
answer user questions 1.63 1.21 1.42 1.72 1.47 30,469
AS-6 Employees who deal with users in a caring fashion
1.75 1.35 1.52 1.85 1.62 30,541
AS-7 Employees who understand the needs of their users
1.66 1.28 1.45 1.76 1.52 30,229
AS-8 Willingness to help users 1.68 1.28 1.46 1.76 1.51 30,415 AS-9 Dependability in handling users' service
problems 1.63 1.28 1.51 1.80 1.61 26,066
IC-1 Making electronic resources accessible from my home or office
1.71 1.14 1.62 2.01 1.74 31,330
IC-2 A library Web site enabling me to locate information on my own
1.63 1.15 1.55 1.90 1.65 31,610
IC-3 The printed library materials I need for my work
1.69 1.38 1.60 1.99 1.84 29,387
IC-4 The electronic information resources I need
1.59 1.16 1.46 1.89 1.63 31,236
IC-5 Modern equipment that lets me easily access needed information
1.61 1.18 1.46 1.85 1.59 30,874
IC-6 Easy-to-use access tools that allow me to find things on my own
1.58 1.16 1.42 1.83 1.56 31,185
IC-7 Making information easily accessible for independent use
1.56 1.14 1.38 1.77 1.50 30,935
IC-8 Print and/or electronic journal collections I require for my work
1.64 1.15 1.60 2.08 1.80 30,175
LP-1 Library space that inspires study and learning
1.82 1.53 1.86 2.34 2.23 30,654
LP-2 Quiet space for individual activities 1.89 1.57 1.88 2.44 2.26 30,046 LP-3 A comfortable and inviting location 1.78 1.39 1.70 2.14 1.93 30,926
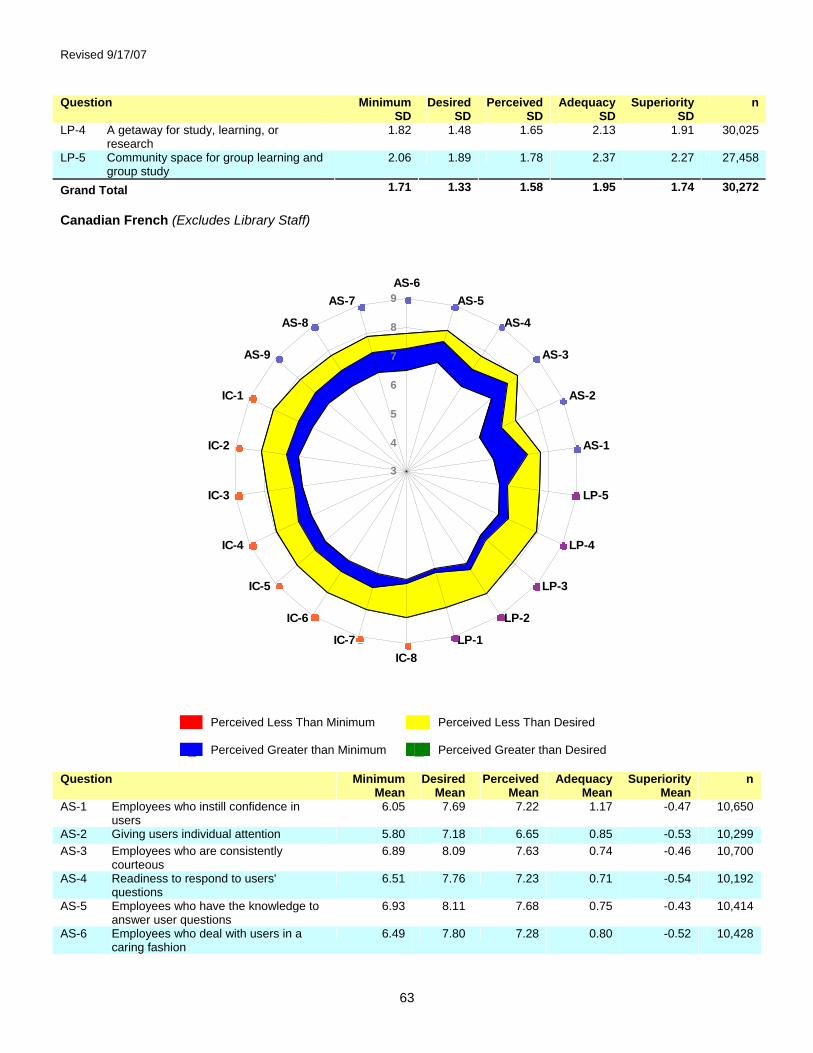
Revised 9/17/07
63
Question Minimum SD
Desired SD
Perceived SD
Adequacy SD
Superiority SD
n
LP-4 A getaway for study, learning, or research
1.82 1.48 1.65 2.13 1.91 30,025
LP-5 Community space for group learning and group study
2.06 1.89 1.78 2.37 2.27 27,458
Grand Total 1.71 1.33 1.58 1.95 1.74 30,272 Canadian French (Excludes Library Staff)
Perceived Less Than Minimum Perceived Less Than Desired Perceived Greater than Minimum Perceived Greater than Desired
Question Minimum
Mean Desired
Mean Perceived
Mean Adequacy
Mean Superiority
Mean n
AS-1 Employees who instill confidence in users
6.05 7.69 7.22 1.17 -0.47 10,650
AS-2 Giving users individual attention 5.80 7.18 6.65 0.85 -0.53 10,299 AS-3 Employees who are consistently
courteous 6.89 8.09 7.63 0.74 -0.46 10,700
AS-4 Readiness to respond to users' questions
6.51 7.76 7.23 0.71 -0.54 10,192
AS-5 Employees who have the knowledge to answer user questions
6.93 8.11 7.68 0.75 -0.43 10,414
AS-6 Employees who deal with users in a caring fashion
6.49 7.80 7.28 0.80 -0.52 10,428
3
4
5
6
7
8
9AS-6
AS-5
AS-4
AS-3
AS-2
AS-1
LP-5
LP-4
LP-3
LP-2
LP-1IC-8
IC-7
IC-6
IC-5
IC-4
IC-3
IC-2
IC-1
AS-9
AS-8
AS-7

Revised 9/17/07
64
Question Minimum Mean
Desired Mean
Perceived Mean
Adequacy Mean
Superiority Mean
n
AS-7 Employees who understand the needs of their users
6.57 7.84 7.31 0.74 -0.53 10,281
AS-8 Willingness to help users 6.49 7.80 7.17 0.69 -0.62 10,392 AS-9 Dependability in handling users'
service problems 6.62 7.85 7.18 0.56 -0.67 8,103
IC-1 Making electronic resources accessible from my home or office
6.60 8.09 7.13 0.53 -0.96 10,370
IC-2 A library Web site enabling me to locate information on my own
6.77 8.07 7.21 0.44 -0.87 10,609
IC-3 The printed library materials I need for my work
6.64 7.87 6.92 0.28 -0.95 9,263
IC-4 The electronic information resources I need
6.64 7.97 7.14 0.50 -0.83 10,378
IC-5 Modern equipment that lets me easily access needed information
6.70 8.02 7.19 0.49 -0.83 10,618
IC-6 Easy-to-use access tools that allow me to find things on my own
6.72 8.04 7.15 0.43 -0.88 10,584
IC-7 Making information easily accessible for independent use
6.72 8.03 7.25 0.53 -0.79 10,607
IC-8 Print and/or electronic journal collections I require for my work
6.79 8.11 6.91 0.12 -1.20 9,733
LP-1 Library space that inspires study and learning
6.53 7.94 6.68 0.15 -1.26 10,412
LP-2 Quiet space for individual activities 6.85 8.09 7.10 0.25 -0.99 10,367 LP-3 A comfortable and inviting location 6.38 7.85 6.63 0.25 -1.22 10,546 LP-4 A getaway for study, learning, or
research 6.53 7.94 6.89 0.36 -1.05 10,313
LP-5 Community space for group learning and group study
6.25 7.65 6.55 0.30 -1.09 9,653
Grand Total 6.57 7.90 7.10 0.53 -0.80 10,223 Question Minimum
SD Desired
SD Perceived
SD Adequacy
SD Superiority
SD n
AS-1 Employees who instill confidence in users
1.53 1.17 1.36 1.69 1.44 10,650
AS-2 Giving users individual attention 1.71 1.45 1.63 1.72 1.57 10,299 AS-3 Employees who are consistently
courteous 1.48 1.07 1.39 1.73 1.48 10,700
AS-4 Readiness to respond to users' questions 1.46 1.16 1.43 1.67 1.50 10,192 AS-5 Employees who have the knowledge to
answer user questions 1.38 1.00 1.25 1.56 1.32 10,414
AS-6 Employees who deal with users in a caring fashion
1.44 1.12 1.36 1.59 1.40 10,428
AS-7 Employees who understand the needs of their users
1.45 1.13 1.34 1.60 1.41 10,281
AS-8 Willingness to help users 1.53 1.19 1.50 1.71 1.54 10,392 AS-9 Dependability in handling users' service
problems 1.46 1.15 1.45 1.68 1.51 8,103
IC-1 Making electronic resources accessible from my home or office
1.57 1.13 1.63 2.04 1.80 10,370
IC-2 A library Web site enabling me to locate information on my own
1.45 1.09 1.47 1.79 1.60 10,609
IC-3 The printed library materials I need for my work
1.50 1.20 1.52 1.81 1.66 9,263
IC-4 The electronic information resources I need
1.41 1.08 1.33 1.70 1.50 10,378
IC-5 Modern equipment that lets me easily access needed information
1.40 1.05 1.42 1.78 1.58 10,618

Revised 9/17/07
65
Question Minimum SD
Desired SD
Perceived SD
Adequacy SD
Superiority SD
n
IC-6 Easy-to-use access tools that allow me to find things on my own
1.39 1.05 1.35 1.73 1.52 10,584
IC-7 Making information easily accessible for independent use
1.38 1.03 1.33 1.67 1.47 10,607
IC-8 Print and/or electronic journal collections I require for my work
1.47 1.09 1.56 1.99 1.78 9,733
LP-1 Library space that inspires study and learning
1.51 1.16 1.77 2.14 1.99 10,412
LP-2 Quiet space for individual activities 1.50 1.11 1.66 2.06 1.84 10,367 LP-3 A comfortable and inviting location 1.51 1.15 1.77 2.17 2.00 10,546 LP-4 A getaway for study, learning, or
research 1.54 1.19 1.63 2.02 1.82 10,313
LP-5 Community space for group learning and group study
1.68 1.41 1.83 2.24 2.08 9,653
Grand Total 1.49 1.15 1.50 1.82 1.63 10,223
4.1.7 Core Question Dimension Summary On the chart below, scores for each dimension of library service quality have been plotted graphically. The exterior bars represent the range of minimum to desired mean scores for each dimension. The interior bars represent the range of minimum to perceived mean scores (the service adequacy gap) for each dimension of library service quality. Unified (Excludes Library Staff)

Revised 9/17/07
66
The following table displays standard deviation for each dimension of library service quality measured by the LibQUAL+® survey, where n is the number of respondents for each particular dimension. (For a more detailed explanation of the headings, see the Introduction to this notebook.) A complete listing of the survey questions and their dimensions can be found in Appendix A.

Revised 9/17/07
67
American English (Excludes Library Staff)

Revised 9/17/07
68
The following table displays standard deviation for each dimension of library service quality measured by the LibQUAL+® survey, where n is the number of respondents for each particular dimension. (For a more detailed explanation of the headings, see the Introduction to this notebook.) A complete listing of the survey questions and their dimensions can be found in Appendix A.
Canadian French (Excludes Library Staff)

Revised 9/17/07
69
The following table displays standard deviation for each dimension of library service quality measured by the LibQUAL+® survey, where n is the number of respondents for each particular dimension. (For a more detailed explanation of the headings, see the Introduction to this notebook.) A complete listing of the survey questions and their dimensions can be found in Appendix A.
4.1.8 Local Questions Summary This table shows mean scores and standard deviations for each of the local questions added by the individual library or consortium, where n is the number of respondents for each particular question. (For a more detailed explanation of the headings, see the Introduction to this notebook.) Unified (Excludes Library Staff) Question Minimum
Mean Desired
Mean Perceived
Mean Adequacy
Mean Superiority
Mean n
A library environment that is hospitable and conducive to finding and using information
6.87 8.09 7.14 0.27 -0.94 1,250
A secure and safe place 7.09 8.12 7.62 0.53 -0.50 1,899 Ability to navigate library Web pages easily 6.81 8.14 6.97 0.16 -1.17 25,360 Access to equipment that is not readily available in my department, e.g., scanners, Cd burners, PDAs, syncing stations
5.95 7.29 6.31 0.36 -0.98 4,955
Access to photocopying and printing facilities 6.56 7.82 6.95 0.39 -0.87 1,640 Access to rare and historical materials 5.68 7.06 6.48 0.80 -0.58 545 Adequate hours of service 6.86 8.10 7.32 0.46 -0.78 22,967 Assuring users of the accuracy and confidentiality of their transactions
7.30 8.28 7.98 0.68 -0.30 401
Availability of subject specialist assistance 5.65 7.30 6.27 0.62 -1.03 1,312 Comprehensive collections of fulltext articles online
6.69 8.22 6.62 -0.07 -1.60 777
Convenient business hours 6.72 7.99 7.36 0.64 -0.63 4,385 Convenient service hours 6.95 8.17 7.84 0.89 -0.33 861

Revised 9/17/07
70
Question Minimum Mean
Desired Mean
Perceived Mean
Adequacy Mean
Superiority Mean
n
Ease and timeliness in getting materials from other libraries
6.50 7.89 6.91 0.41 -0.98 17,484
Ease of use of electronic resources 6.64 7.99 7.31 0.67 -0.68 2,153 Efficient interlibrary loan / document delivery 6.71 7.79 7.11 0.40 -0.68 874 Electronic resources matching my information needs
6.85 8.17 6.89 0.04 -1.28 2,448
Enabling me to find information myself 24 hours a day
6.82 7.97 7.03 0.20 -0.94 1,334
Improving library-use skills as a by-product of seeking assistance from library staff
5.82 7.39 6.91 1.09 -0.48 1,139
Librarians providing help that assists in finding information needed now while improving my research skills
6.55 7.91 7.57 1.02 -0.34 3,281
Librarians providing help that both assists in finding the information needed now, and improves skills useful in future information searches
6.62 7.96 7.47 0.85 -0.49 521
Librarians teaching me how to effectively use the electronically available databases, journals, and books
6.45 7.69 6.97 0.52 -0.73 2,734
Library keeping me informed about all of its services
6.20 7.42 6.46 0.26 -0.96 968
Library orientations / instruction sessions 5.70 6.98 6.71 1.01 -0.27 2,952 Making me aware of library resources and services
6.03 7.40 6.56 0.54 -0.84 26,768
Making me aware of library services 5.73 7.10 6.43 0.70 -0.66 1,020 Online course support (readings, links, references)
6.30 7.85 6.77 0.47 -1.08 1,599
Providing search tools that permit me to work autonomously
6.68 8.05 7.17 0.49 -0.88 1,841
Ready access to computers / Internet / software
6.80 8.13 7.62 0.82 -0.51 2,150
Resources added to library collections on request
6.45 7.57 6.43 -0.02 -1.14 782
Space for group / individual study and research needs
6.32 7.52 6.12 -0.20 -1.41 576
Space for students to study and work in groups
5.86 7.20 6.00 0.14 -1.20 788
Space that facilitates quiet study 6.48 7.65 6.16 -0.32 -1.49 609 Teaching me how to access, evaluate, and use information
6.00 7.41 6.68 0.68 -0.74 26,192
Teaching me how to locate, evaluate, and use information
6.48 7.76 7.22 0.74 -0.54 1,580
The library collection provides information resources reflecting diverse points of view
6.93 7.95 7.21 0.28 -0.74 1,267
The library program teaches me how to access, evaluate, and use information
6.15 7.43 6.63 0.48 -0.80 676
Timely document delivery / interlibrary loan 6.75 7.99 7.13 0.38 -0.86 2,753 Timely document delivery/interlibrary loan 6.49 7.92 7.49 1.00 -0.43 1,418 Question Minimum
SD Desired
SD Perceived
SD Adequacy
SD Superiority
SD n
A library environment that is hospitable and conducive to finding and using information
1.46 1.03 1.50 1.86 1.62 1,250
A secure and safe place 1.90 1.48 1.42 1.92 1.63 1,899
Ability to navigate library Web pages easily 1.59 1.15 1.55 1.95 1.70 25,360 Access to equipment that is not readily available in my department, e.g., scanners, Cd burners, PDAs, syncing stations
1.89 1.68 1.82 2.17 2.08 4,955

Revised 9/17/07
71
Question Minimum SD
Desired SD
Perceived SD
Adequacy SD
Superiority SD
n
Access to photocopying and printing facilities 1.71 1.36 1.73 2.09 1.92 1,640
Access to rare and historical materials 2.07 2.01 1.73 2.07 2.10 545
Adequate hours of service 1.67 1.23 1.68 2.17 1.91 22,967 Assuring users of the accuracy and confidentiality of their transactions
1.54 0.99 1.14 1.38 1.10 401
Availability of subject specialist assistance 1.80 1.57 1.72 1.93 1.89 1,312 Comprehensive collections of fulltext articles online
1.61 1.20 1.50 2.03 1.76 777
Convenient business hours 1.50 1.15 1.58 2.00 1.73 4,385
Convenient service hours 1.72 1.24 1.34 1.92 1.52 861 Ease and timeliness in getting materials from other libraries
1.71 1.34 1.64 2.03 1.81 17,484
Ease of use of electronic resources 1.41 1.06 1.35 1.77 1.55 2,153
Efficient interlibrary loan / document delivery 1.78 1.48 1.65 1.99 1.86 874 Electronic resources matching my information needs
1.41 1.04 1.44 1.85 1.66 2,448
Enabling me to find information myself 24 hours a day
1.79 1.39 1.69 2.01 1.81 1,334
Improving library-use skills as a by-product of seeking assistance from library staff
1.79 1.44 1.37 1.77 1.56 1,139
Librarians providing help that assists in finding information needed now while improving my research skills
1.59 1.23 1.41 1.76 1.53 3,281
Librarians providing help that both assists in finding the information needed now, and improves skills useful in future information searches
1.61 1.25 1.22 1.57 1.34 521
Librarians teaching me how to effectively use the electronically available databases, journals, and books
1.83 1.47 1.73 2.03 1.86 2,734
Library keeping me informed about all of its services
1.65 1.39 1.68 1.85 1.75 968
Library orientations / instruction sessions 2.05 1.86 1.80 2.07 1.92 2,952 Making me aware of library resources and services
1.79 1.51 1.65 1.98 1.85 26,768
Making me aware of library services 1.90 1.67 1.72 2.05 1.95 1,020 Online course support (readings, links, references)
1.69 1.34 1.46 1.82 1.65 1,599
Providing search tools that permit me to work autonomously
1.38 1.02 1.32 1.64 1.46 1,841
Ready access to computers / Internet / software
1.44 1.02 1.34 1.75 1.46 2,150
Resources added to library collections on request
1.72 1.50 1.72 1.99 1.99 782
Space for group / individual study and research needs
2.08 1.89 1.82 2.61 2.49 576
Space for students to study and work in groups
2.01 1.93 1.89 2.39 2.41 788
Space that facilitates quiet study 2.02 1.82 1.94 2.75 2.57 609 Teaching me how to access, evaluate, and use information
1.80 1.58 1.67 1.95 1.85 26,192
Teaching me how to locate, evaluate, and use information
1.85 1.45 1.56 1.84 1.61 1,580
The library collection provides information resources reflecting diverse points of view
1.70 1.36 1.53 1.82 1.60 1,267
The library program teaches me how to access, evaluate, and use information
1.91 1.72 1.69 1.92 1.88 676
Timely document delivery / interlibrary loan 1.69 1.29 1.58 1.87 1.68 2,753 Timely document delivery/interlibrary loan 1.48 1.12 1.36 1.82 1.56 1,418

Revised 9/17/07
72
American English (Excludes Library Staff) Question Minimum
Mean Desired
Mean Perceived
Mean Adequacy
Mean Superiority
Mean n
A library environment that is hospitable and conducive to finding and using information
6.87 8.18 7.17 0.30 -1.02 382
A secure and safe place 7.09 8.12 7.62 0.53 -0.50 1,899 Ability to navigate library Web pages easily 6.89 8.20 6.99 0.09 -1.21 21,029 Access to equipment that is not readily available in my department, e.g., scanners, CD burners, PDAs, syncing stations
6.00 7.30 6.22 0.22 -1.08 3,490
Access to photocopying and printing facilities 6.25 7.63 7.05 0.80 -0.59 824 Access to rare and historical materials 5.68 7.06 6.48 0.80 -0.58 545 Adequate hours of service 6.86 8.11 7.31 0.44 -0.80 20,768 Availability of subject specialist assistance 5.65 7.30 6.27 0.62 -1.03 1,312 Comprehensive collections of fulltext articles online
6.69 8.22 6.62 -0.07 -1.60 777
Convenient business hours 7.07 8.24 7.41 0.34 -0.83 784 Convenient service hours 6.95 8.17 7.84 0.89 -0.33 861 Ease and timeliness in getting materials from other libraries
6.52 7.92 6.93 0.40 -0.99 15,021
Efficient interlibrary loan / document delivery 6.66 7.75 7.10 0.43 -0.65 773 Electronic resources matching my information needs
7.06 8.38 6.79 -0.27 -1.59 657
Enabling me to find information myself 24 hours a day
6.82 7.97 7.03 0.20 -0.94 1,334
Improving library-use skills as a by-product of seeking assistance from library staff
5.82 7.39 6.91 1.09 -0.48 1,139
Librarians providing help that assists in finding information needed now while improving my research skills
6.37 7.79 7.24 0.87 -0.55 1,408
Librarians providing help that both assists in finding the information needed now, and improves skills useful in future information searches
6.62 7.96 7.47 0.85 -0.49 521
Librarians teaching me how to effectively use the electronically available databases, journals, and books
6.33 7.59 6.72 0.39 -0.87 944
Library orientations / instruction sessions 5.50 6.72 6.43 0.93 -0.29 1,489 Making me aware of library resources and services
6.03 7.41 6.54 0.51 -0.87 22,032
Making me aware of library services 5.73 7.10 6.43 0.70 -0.66 1,020 Online course support (readings, links, references)
6.30 7.85 6.77 0.47 -1.08 1,599
Resources added to library collections on request
6.41 7.53 6.39 -0.02 -1.14 701
Space for group / individual study and research needs
6.32 7.52 6.12 -0.20 -1.41 576
Space for students to study and work in groups
5.86 7.20 6.00 0.14 -1.20 785
Space that facilitates quiet study 6.48 7.65 6.16 -0.32 -1.49 609 Teaching me how to access, evaluate, and use information
5.97 7.39 6.70 0.73 -0.69 19,277
Teaching me how to locate, evaluate, and use information
6.48 7.76 7.22 0.74 -0.54 1,580
The library collection provides information resources reflecting diverse points of view
6.93 7.95 7.21 0.28 -0.74 1,267
The library program teaches me how to access, evaluate, and use information
6.15 7.43 6.63 0.48 -0.80 676
Timely document delivery / interlibrary loan 6.79 8.03 7.11 0.31 -0.93 2,197

Revised 9/17/07
73
Question Minimum
SD Desired
SD Perceived
SD Adequacy
SD Superiority
SD n
A library environment that is hospitable and conducive to finding and using information
1.60 1.04 1.49 1.89 1.55 382
A secure and safe place 1.90 1.48 1.42 1.92 1.63 1,899 Ability to navigate library Web pages easily 1.61 1.14 1.56 1.98 1.72 21,029 Access to equipment that is not readily available in my department, e.g., scanners, CD burners, PDAs, syncing stations
1.98 1.80 1.88 2.25 2.20 3,490
Access to photocopying and printing facilities 1.86 1.56 1.63 1.99 1.82 824 Access to rare and historical materials 2.07 2.01 1.73 2.07 2.10 545 Adequate hours of service 1.69 1.25 1.70 2.19 1.94 20,768 Availability of subject specialist assistance 1.80 1.57 1.72 1.93 1.89 1,312 Comprehensive collections of fulltext articles online
1.61 1.20 1.50 2.03 1.76 777
Convenient business hours 1.56 1.12 1.53 1.98 1.69 784 Convenient service hours 1.72 1.24 1.34 1.92 1.52 861 Ease and timeliness in getting materials from other libraries
1.74 1.36 1.64 2.04 1.82 15,021
Efficient interlibrary loan / document delivery 1.79 1.51 1.66 1.99 1.86 773 Electronic resources matching my information needs
1.50 0.98 1.48 1.95 1.60 657
Enabling me to find information myself 24 hours a day
1.79 1.39 1.69 2.01 1.81 1,334
Improving library-use skills as a by-product of seeking assistance from library staff
1.79 1.44 1.37 1.77 1.56 1,139
Librarians providing help that assists in finding information needed now while improving my research skills
1.76 1.42 1.43 1.80 1.59 1,408
Librarians providing help that both assists in finding the information needed now, and improves skills useful in future information searches
1.61 1.25 1.22 1.57 1.34 521
Librarians teaching me how to effectively use the electronically available databases, journals, and books
1.95 1.62 1.90 2.14 2.06 944
Library orientations / instruction sessions 2.16 2.01 1.85 2.16 2.09 1,489 Making me aware of library resources and services
1.81 1.53 1.66 1.99 1.87 22,032
Making me aware of library services 1.90 1.67 1.72 2.05 1.95 1,020 Online course support (readings, links, references)
1.69 1.34 1.46 1.82 1.65 1,599
Resources added to library collections on request
1.71 1.53 1.72 2.02 2.02 701
Space for group / individual study and research needs
2.08 1.89 1.82 2.61 2.49 576
Space for students to study and work in groups
2.01 1.93 1.89 2.40 2.41 785
Space that facilitates quiet study 2.02 1.82 1.94 2.75 2.57 609 Teaching me how to access, evaluate, and use information
1.86 1.65 1.65 1.95 1.86 19,277
Teaching me how to locate, evaluate, and use information
1.85 1.45 1.56 1.84 1.61 1,580
The library collection provides information resources reflecting diverse points of view
1.70 1.36 1.53 1.82 1.60 1,267
The library program teaches me how to access, evaluate, and use information
1.91 1.72 1.69 1.92 1.88 676
Timely document delivery / interlibrary loan 1.72 1.30 1.59 1.89 1.69 2,197

Revised 9/17/07
74
Canadian French (Excludes Library Staff) Question Minimum
Mean Desired
Mean Perceived
Mean Adequacy
Mean Superiority
Mean n
A library environment that is hospitable and conducive to finding and using information
6.88 8.05 7.13 0.26 -0.91 868
Ability to navigate library Web pages easily 6.41 7.84 6.90 0.50 -0.94 4,331 Access to equipment that is not readily available in my department, e.g., scanners, Cd burners, PDAs, syncing stations
5.85 7.29 6.55 0.69 -0.75 1,465
Access to photocopying and printing facilities 6.87 8.01 6.85 -0.02 -1.16 816 Adequate hours of service 6.83 8.05 7.50 0.68 -0.55 2,199 Assuring users of the accuracy and confidentiality of their transactions
7.30 8.28 7.98 0.68 -0.30 401
Convenient business hours 6.64 7.94 7.35 0.71 -0.59 3,601 Ease and timeliness in getting materials from other libraries
6.35 7.73 6.81 0.46 -0.92 2,463
Ease of use of electronic resources 6.64 7.99 7.31 0.67 -0.68 2,153 Efficient interlibrary loan / document delivery 7.09 8.14 7.21 0.12 -0.93 101 Electronic resources matching my information needs
6.77 8.09 6.93 0.16 -1.16 1,791
Librarians providing help that assists in finding information needed now while improving my research skills
6.68 7.99 7.81 1.13 -0.18 1,873
Librarians teaching me how to effectively use the electronically available databases, journals, and books
6.51 7.75 7.09 0.59 -0.66 1,790
Library keeping me informed about all of its services
6.20 7.42 6.46 0.26 -0.96 968
Library orientations / instruction sessions 5.91 7.25 7.00 1.10 -0.25 1,463 Making me aware of library resources and services
6.01 7.38 6.69 0.68 -0.69 4,736
Providing search tools that permit me to work autonomously
6.68 8.05 7.17 0.49 -0.88 1,841
Ready access to computers / Internet / software
6.80 8.13 7.62 0.82 -0.51 2,150
Resources added to library collections on request
6.79 7.88 6.79 0.00 -1.09 81
Space for students to study and work in groups
6.67 7.67 6.33 -0.33 -1.33 3
Teaching me how to access, evaluate, and use information
6.10 7.49 6.62 0.53 -0.86 6,915
Timely document delivery / interlibrary loan 6.55 7.79 7.21 0.66 -0.58 556 Timely document delivery/interlibrary loan 6.49 7.92 7.49 1.00 -0.43 1,418 Question Minimum
SD Desired
SD Perceived
SD Adequacy
SD Superiority
SD n
A library environment that is hospitable and conducive to finding and using information
1.39 1.02 1.51 1.85 1.65 868
Ability to navigate library Web pages easily 1.42 1.16 1.46 1.76 1.61 4,331 Access to equipment that is not readily available in my department, e.g., scanners, CD burners, PDAs, syncing stations
1.62 1.35 1.64 1.91 1.76 1,465
Access to photocopying and printing facilities 1.48 1.09 1.83 2.11 1.98 816 Adequate hours of service 1.41 1.06 1.44 1.86 1.62 2,199 Assuring users of the accuracy and confidentiality of their transactions
1.54 0.99 1.14 1.38 1.10 401
Convenient business hours 1.47 1.14 1.59 2.00 1.74 3,601 Ease and timeliness in getting materials from other libraries
1.53 1.26 1.62 1.98 1.77 2,463

Revised 9/17/07
75
Question Minimum SD
Desired SD
Perceived SD
Adequacy SD
Superiority SD
n
Ease of use of electronic resources 1.41 1.06 1.35 1.77 1.55 2,153 Efficient interlibrary loan / document delivery 1.66 1.21 1.61 1.97 1.83 101 Electronic resources matching my information needs
1.36 1.05 1.42 1.81 1.67 1,791
Librarians providing help that assists in finding information needed now while improving my research skills
1.43 1.06 1.34 1.72 1.46 1,873
Librarians teaching me how to effectively use the electronically available databases, journals, and books
1.76 1.38 1.62 1.96 1.75 1,790
Library keeping me informed about all of its services
1.65 1.39 1.68 1.85 1.75 968
Library orientations / instruction sessions 1.90 1.64 1.69 1.97 1.73 1,463 Making me aware of library resources and services
1.68 1.40 1.64 1.90 1.74 4,736
Providing search tools that permit me to work autonomously
1.38 1.02 1.32 1.64 1.46 1,841
Ready access to computers / Internet / software
1.44 1.02 1.34 1.75 1.46 2,150
Resources added to library collections on request
1.75 1.25 1.68 1.75 1.68 81
Space for students to study and work in groups
0.58 1.53 1.53 1.15 0.58 3
Teaching me how to access, evaluate, and use information
1.64 1.37 1.72 1.94 1.80 6,915
Timely document delivery / interlibrary loan 1.59 1.26 1.54 1.77 1.61 556
Timely document delivery/interlibrary loan 1.48 1.12 1.36 1.82 1.56 1,418
4.1.9 General Satisfaction Questions Summary This table displays mean scores and standard deviations for each of the general satisfaction questions: Satisfaction with Treatment, Satisfaction with Support, and Satisfaction with Overall Quality of Service, where n is the number of respondents for each particular question. These scores are calculated from responses to the general satisfaction questions on the LibQUAL+® survey, in which respondents rated their levels of general satisfaction on a scale from 1-9. Unified (Excludes Library Staff) Question Response
Mean Response SD Respondents
(n) How would you rate the overall quality of the service provided by the library?
7.13 1.31 42,690
In general, I am satisfied with library support for my learning, research, and/or teaching needs.
7.02 1.59 42,690
In general, I am satisfied with the way in which I am treated at the library.
7.41 1.52 42,694
American English (Excludes Library Staff) Question Response
Mean Response SD Respondents
(n) How would you rate the overall quality of the service provided by the library?
7.08 1.36 31,901
In general, I am satisfied with library support for my learning, research, and/or teaching needs.
6.92 1.64 31,900

Revised 9/17/07
76
Question Response Mean
Response SD Respondents (n)
In general, I am satisfied with the way in which I am treated at the library.
7.33 1.58 31,903
Canadian French (Excludes Library Staff) Question Response
Mean Response SD Respondents
(n) How would you rate the overall quality of the service provided by the library?
7.25 1.15 10,789
In general, I am satisfied with library support for my learning, research, and/or teaching needs.
7.33 1.41 10,790
In general, I am satisfied with the way in which I am treated at the library.
7.62 1.33 10,791
4.1.10 Information Literacy Outcomes Questions Summary This table displays the mean score and standard deviation for each of the information literacy outcomes questions, where n is the number of respondents for each particular question. These scores are calculated from responses to the information literacy outcomes questions on the LibQUAL+® survey, in which respondents rated their levels of general satisfaction on a scale from 1-9 with 1 being "strongly disagree" and 9 representing "strongly agree". Unified (Excludes Library Staff) Question Response
Mean Response
SD Respondents
(n) The library aids my advancement in my academic discipline.
6.81 1.64 42,692
The library enables me to be more efficient in my academic pursuits.
6.90 1.65 42,690
The library helps me distinguish between trustworthy and untrustworthy information.
6.10 1.92 42,691
The library helps me stay abreast of developments in my field(s) of interest.
6.17 1.77 42,694
The library provides me with the information skills I need in my work or study.
6.38 1.77 42,690
American English (Excludes Library Staff) Question Response
Mean Response
SD Respondents
(n) The library aids my advancement in my academic discipline.
6.75 1.66 31,903
The library enables me to be more efficient in my academic pursuits.
6.85 1.67 31,901
The library helps me distinguish between trustworthy and untrustworthy information.
6.11 1.93 31,901
The library helps me stay abreast of developments in my field(s) of interest.
6.01 1.81 31,903
The library provides me with the information skills I need in my work or study.
6.33 1.77 31,900

Revised 9/17/07
77
Canadian French (Excludes Library Staff) Question Response
Mean Response
SD Respondents
(n) The library aids my advancement in my academic discipline.
6.98 1.56 10,789
The library enables me to be more efficient in my academic pursuits.
7.03 1.58 10,789
The library helps me distinguish between trustworthy and untrustworthy information.
6.09 1.88 10,790
The library helps me stay abreast of developments in my field(s) of interest.
6.67 1.52 10,791
The library provides me with the information skills I need in my work or study.
6.52 1.74 10,790
4.1.11 Library Use Summary This chart shows a graphic representation of library use (both on the premises and electronically), as well as use of non-library information gateways such as Yahoo™ and Google™. Bars represent the frequency with which respondents report using these resources: Daily, Weekly, Monthly, Quarterly, or Never. The table below the chart displays the number and percentage of respondents who selected each option. Unified (Excludes Library Staff)
0%
10%
20%
30%
40%
50%
60%
70%
80%
90%
100%
Daily Weekly Monthly Quarterly NeverFrequency
Perc
enta
ge
How often do you accesslibrary resources through alibrary Web page?
How often do you useresources on librarypremises?
How often do you useYahoo(TM), Google(TM), ornon-library gatew ays forinformation?

Revised 9/17/07
78
Question Daily Weekly Monthly Quarterly Never Total How often do you access library resources through a library Web page?
9,778 19,278 8,800 3,690 1,146 42,692
How often do you use resources on library premises?
6,822 18,375 11,134 5,450 912 42,693
How often do you use Yahoo(TM), Google(TM), or non-library gateways for information?
29,566 8,913 2,293 1,008 911 42,691
Question Daily Weekly Monthly Quarterly Never Total How often do you access library resources through a library Web page?
22.90% 45.16% 20.61% 8.64% 2.68% 100.00%
How often do you use resources on library premises?
15.98% 43.04% 26.08% 12.77% 2.14% 100.00%
How often do you use Yahoo(TM), Google(TM), or non-library gateways for information? 69.26% 20.88% 5.37% 2.36% 2.13% 100.00% American English (Excludes Library Staff)
0%
10%
20%
30%
40%
50%
60%
70%
80%
90%
100%
Daily Weekly Monthly Quarterly Never
Frequency
Perc
enta
ge
How often do you accesslibrary resources through alibrary Web page?
How often do you useresources on librarypremises?
How often do you useYahoo(TM), Google(TM), ornon-library gatew ays forinformation?
Question Daily Weekly Monthly Quarterly Never Total How often do you access library resources through a library Web page?
7,848
14,892 6,240 2,096 826 31,902
How often do you use resources on library premises?
5,531
13,655 8,181 3,716 820 31,903
How often do you use Yahoo(TM), Google(TM), or non-library gateways for information?
21,543 6,964 1,860 763 771 31,901
Question Daily Weekly Monthly Quarterly Never Total How often do you access library resources through a library Web page?
24.60% 46.68% 19.56% 6.57% 2.59% 100.00%
How often do you use resources on library premises?
17.34% 42.80% 25.64% 11.65% 2.57% 100.00%
How often do you use Yahoo(TM), Google(TM), or non-library gateways for information? 67.53% 21.83% 5.83% 2.39% 2.42% 100.00%

Revised 9/17/07
79
Canadian French (Excludes Library Staff)
0%
10%
20%
30%
40%
50%
60%
70%
80%
90%
100%
Daily Weekly Monthly Quarterly Never
Frequency
Perc
enta
ge
How often do you accesslibrary resources through alibrary Web page?
How often do you useresources on librarypremises?
How often do you useYahoo(TM), Google(TM), ornon-library gatew ays forinformation?
Question Daily Weekly Monthly Quarterly Never Total How often do you access library resources through a library Web page?
1,930
4,386 2,560 1,594 320 10,790
How often do you use resources on library premises?
1,291
4,720 2,953 1,734 92 10,790
How often do you use Yahoo(TM), Google(TM), or non-library gateways for information?
8,023
1,949 433 245 140 10,790
Question Daily Weekly Monthly Quarterly Never Total How often do you access library resources through a library Web page?
17.89% 40.65% 23.73% 14.77% 2.97% 100.00%
How often do you use resources on library premises?
11.96% 43.74% 27.37% 16.07% 0.85% 100.00%
How often do you use Yahoo(TM), Google(TM), or non-library gateways for information?
74.36% 18.06% 4.01% 2.27% 1.30% 100.00%

Revised 9/17/07
80
4.2 College or University Libraries - Undergraduate
4.2.1 Population and Respondent Profiles by Standard Discipline The chart and table below show a breakdown of survey respondents by discipline, based on user responses to the demographic questions and the demographic data provided by institutions in the online Representativeness section*. This section shows survey respondents broken down based on the LibQUAL+® standard discipline categories. The chart maps percentage of respondents for each discipline in red. Population percentages for each discipline are mapped in blue. The table shows the number and percentage for each discipline, for the general population (N) and for survey respondents (n). *Note: Participating institutions were not required to complete the Representativeness section. When population data is missing or incomplete, it is because this data was not provided. Unified
0%2%4%6%8%
10%12%14%16%18%
Agricu
lture
/ Env
ironm
ental
Stud
ies
Archite
cture
Busine
ss
Commun
icatio
ns / J
ourna
lism
Educa
tion
Engine
ering
/ Com
puter
Scienc
e
Genera
l Stud
ies
Health
Scienc
es
Human
ities
Law
Military
/ Nav
al Scie
nce
Other
Perform
ing & Fine
Arts
Scienc
e / M
ath
Social
Scienc
es / P
sych
ology
Undec
ided
Discipline
Per
cent
age
Population Profile by Discipline
Respondent Profile by Discipline
Discipline Population (N) Population
% Respondents (n) Respondents
% N%-n%
Agriculture / Environmental Studies 18,809 2.38% 739 2.61% -0.23% Architecture 1,116 0.14% 71 0.25% -0.11% Business 91,165 11.55% 2,996 10.57% 0.98% Communications / Journalism 11,580 1.47% 607 2.14% -0.68% Education 52,088 6.60% 1,998 7.05% -0.45% Engineering / Computer Science 75,885 9.61% 3,055 10.78% -1.17% General Studies 19,669 2.49% 332 1.17% 1.32% Health Sciences 85,619 10.85% 2,404 8.48% 2.36%

Revised 9/17/07
81
Discipline Population (N) Population %
Respondents (n) Respondents %
N%-n%
Humanities 109,066 13.82% 4,564 16.10% -2.29% Law 14,963 1.90% 672 2.37% -0.48% Military / Naval Science 789 0.10% 97 0.34% -0.24% Other 25,957 3.29% 1,211 4.27% -0.99% Performing & Fine Arts 26,066 3.30% 1,094 3.86% -0.56% Science / Math 98,108 12.43% 4,059 14.32% -1.90% Social Sciences / Psychology 125,093 15.85% 3,901 13.76% 2.08% Undecided 33,479 4.24% 540 1.91% 2.34%
Grand Total 789,452 100.00% 28,340 100.00% 0.00% American English
0%2%4%6%8%
10%12%14%16%18%20%
Agricu
lture
/ Env
ironm
ental
Stud
ies
Archite
cture
Busine
ss
Commun
icatio
ns / J
ourna
lism
Educa
tion
Engine
ering
/ Com
puter
Scienc
e
Genera
l Stud
ies
Health
Scienc
es
Human
ities
Law
Military
/ Nav
al Scie
nce
Other
Perform
ing & Fine
Arts
Scienc
e / M
ath
Social
Scienc
es / P
sych
ology
Undec
ided
Discipline
Per
cent
age
Population Profile by DisciplineRespondent Profile by Discipline
Discipline Population (N) Population
% Respondents
(n) Respondents % N%-n%
Agriculture / Environmental Studies 14,746 2.58% 628 2.93% -0.36% Architecture 534 0.09% 33 0.15% -0.06% Business 63,256 11.06% 2,355 11.00% 0.06% Communications / Journalism 2,773 0.48% 152 0.71% -0.23% Education 29,934 5.24% 1,266 5.92% -0.68% Engineering / Computer Science 54,433 9.52% 1,242 5.80% 3.72% General Studies 10,569 1.85% 247 1.15% 0.69% Health Sciences 60,508 10.58% 1,943 9.08% 1.50% Humanities 83,349 14.58% 3,956 18.49% -3.91% Law 8,906 1.56% 387 1.81% -0.25% Military / Naval Science 789 0.14% 76 0.36% -0.22% Other 17,842 3.12% 1,006 4.70% -1.58% Performing & Fine Arts 18,979 3.32% 774 3.62% -0.30% Science / Math 77,273 13.51% 3,664 17.12% -3.61% Social Sciences / Psychology 100,499 17.58% 3,154 14.74% 2.84% Undecided 27,412 4.79% 518 2.42% 2.37%
Grand Total 571,802 100.00% 21,401 100.00% 0.00%

Revised 9/17/07
82
Canadian French
0%
5%
10%
15%
20%
25%
30%
Agricu
lture
/ Env
ironm
ental
Stud
ies
Archite
cture
Busine
ss
Commun
icatio
ns / J
ourna
lism
Educa
tion
Engine
ering
/ Com
puter
Scienc
e
Genera
l Stud
ies
Health
Scienc
es
Human
ities
Law
Military
/ Nav
al Scie
nce
Other
Perform
ing & Fine
Arts
Scienc
e / M
ath
Social
Scienc
es / P
sych
ology
Undec
ided
Discipline
Perc
enta
ge
Population Profile by DisciplineRespondent Profile by Discipline
Discipline Population (N) Population
% Respondents
(n) Respondents % N%-n%
Agriculture / Environmental Studies 4,063 1.87% 111 1.60% 0.27% Architecture 582 0.27% 38 0.55% -0.28% Business 27,909 12.82% 641 9.24% 3.59% Communications / Journalism 8,807 4.05% 455 6.56% -2.51% Education 22,154 10.18% 732 10.55% -0.37% Engineering / Computer Science 21,452 9.86% 1,813 26.13% -16.27% General Studies 9,100 4.18% 85 1.22% 2.96% Health Sciences 25,111 11.54% 461 6.64% 4.89% Humanities 25,717 11.82% 608 8.76% 3.05% Law 6,057 2.78% 285 4.11% -1.32% Military / Naval Science - 0.00% 21 0.30% -0.30% Other 8,115 3.73% 205 2.95% 0.77% Performing & Fine Arts 7,087 3.26% 320 4.61% -1.36% Science / Math 20,835 9.57% 395 5.69% 3.88% Social Sciences / Psychology 24,594 11.30% 747 10.77% 0.53% Undecided 6,067 2.79% 22 0.32% 2.47%
Grand Total 217,650 100.00% 6,939 100.00% 0.00%

Revised 9/17/07
83
4.2.2 Respondent Profile by Age This table shows a breakdown of survey respondents by age; both the number of respondents (n) and the percentage of the total number of respondents represented by each group are displayed. Unified Age Group Respondents (n) Respondents
% Under 18 114 0.40% 18 - 22 17,946 63.32% 23 - 30 7,624 26.90% 31 - 45 2,055 7.25% 46 - 65 570 2.01% Over 65 31 0.11%
Grand Total 28,340 100.00% American English Age Group Respondents (n) Respondents
% Under 18 96 0.45% 18 - 22 14,200 66.35% 23 - 30 5,190 24.25% 31 - 45 1,449 6.77% 46 - 65 440 2.06% Over 65 28 0.13%
Grand Total 21,403 100.00% Canadian French Age Group Respondents (n) Respondents
% Under 18 18 0.26% 18 - 22 3,746 54.00% 23 - 30 2,434 35.09% 31 - 45 606 8.74% 46 - 65 130 1.87% Over 65 3 0.04%
Grand Total 6,937 100.00%

Revised 9/17/07
84
4.2.3 Population and Respondent Profile by Sex The table below shows a breakdown of survey respondents by sex, based on user responses to the demographic questions and the demographic data provided by institutions in the online Representativeness section* . The number and percentage for each sex are given for the general population and for survey respondents. * Note: Participating institutions were not required to complete the Representativness section. When population data is missing or incomplete, it is because this data was not provided. Unified Sex Population (N) Population % Respondents
(n) Respondents
% Female 589,505 56.51% 26,246 61.51% Male 453,715 43.49% 16,423 38.49%
Grand Total 1,043,220 100.00% 42,669 100.00% By Language Response Language Sex Respondents
(n) Respondents %
American English Female 20,437 47.90% Male 11,444 26.82% Sub-total 31,881 74.72% Canadian French Female 5,809 13.61% Male 4,979 11.67% Sub-total 10,788 25.28%
Grand Total 42,669 100.00%
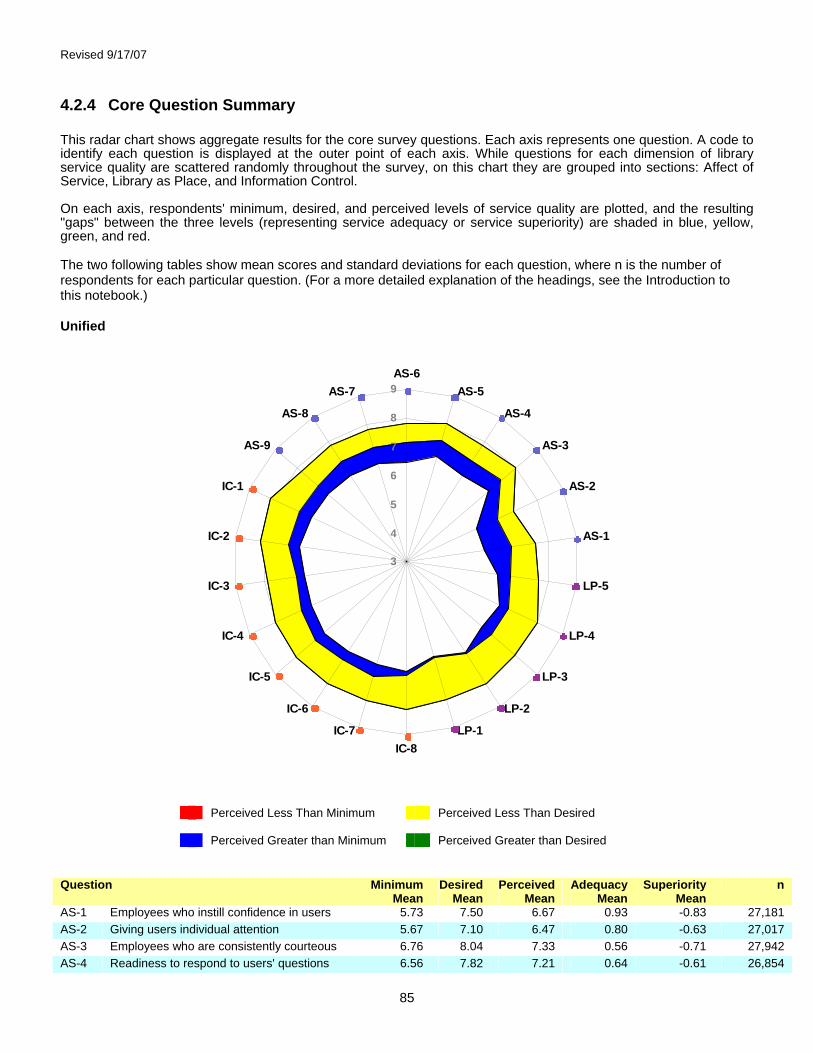
Revised 9/17/07
85
4.2.4 Core Question Summary This radar chart shows aggregate results for the core survey questions. Each axis represents one question. A code to identify each question is displayed at the outer point of each axis. While questions for each dimension of library service quality are scattered randomly throughout the survey, on this chart they are grouped into sections: Affect of Service, Library as Place, and Information Control. On each axis, respondents' minimum, desired, and perceived levels of service quality are plotted, and the resulting "gaps" between the three levels (representing service adequacy or service superiority) are shaded in blue, yellow, green, and red. The two following tables show mean scores and standard deviations for each question, where n is the number of respondents for each particular question. (For a more detailed explanation of the headings, see the Introduction to this notebook.) Unified
Perceived Less Than Minimum Perceived Less Than Desired Perceived Greater than Minimum Perceived Greater than Desired
Question Minimum
Mean Desired
Mean Perceived
Mean Adequacy
Mean Superiority
Mean n
AS-1 Employees who instill confidence in users 5.73 7.50 6.67 0.93 -0.83 27,181 AS-2 Giving users individual attention 5.67 7.10 6.47 0.80 -0.63 27,017 AS-3 Employees who are consistently courteous 6.76 8.04 7.33 0.56 -0.71 27,942 AS-4 Readiness to respond to users' questions 6.56 7.82 7.21 0.64 -0.61 26,854
3
4
5
6
7
8
9AS-6
AS-5
AS-4
AS-3
AS-2
AS-1
LP-5
LP-4
LP-3
LP-2
LP-1IC-8
IC-7
IC-6
IC-5
IC-4
IC-3
IC-2
IC-1
AS-9
AS-8
AS-7
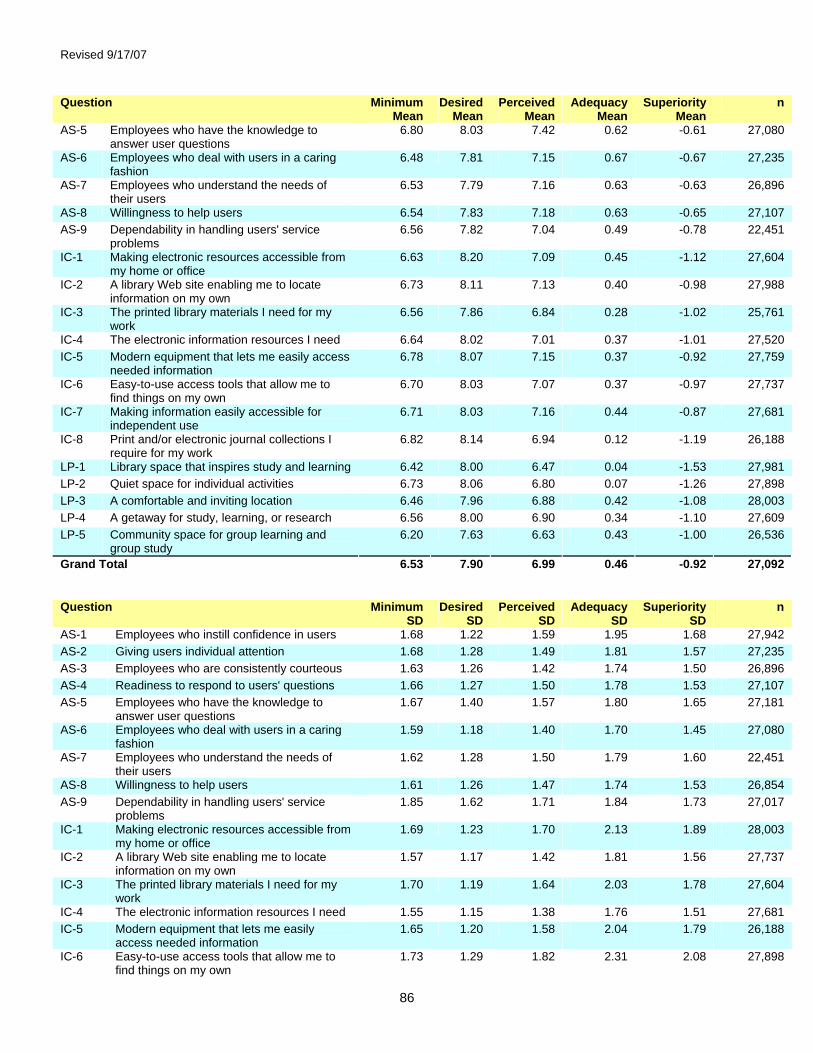
Revised 9/17/07
86
Question Minimum Mean
Desired Mean
Perceived Mean
Adequacy Mean
Superiority Mean
n
AS-5 Employees who have the knowledge to answer user questions
6.80 8.03 7.42 0.62 -0.61 27,080
AS-6 Employees who deal with users in a caring fashion
6.48 7.81 7.15 0.67 -0.67 27,235
AS-7 Employees who understand the needs of their users
6.53 7.79 7.16 0.63 -0.63 26,896
AS-8 Willingness to help users 6.54 7.83 7.18 0.63 -0.65 27,107 AS-9 Dependability in handling users' service
problems 6.56 7.82 7.04 0.49 -0.78 22,451
IC-1 Making electronic resources accessible from my home or office
6.63 8.20 7.09 0.45 -1.12 27,604
IC-2 A library Web site enabling me to locate information on my own
6.73 8.11 7.13 0.40 -0.98 27,988
IC-3 The printed library materials I need for my work
6.56 7.86 6.84 0.28 -1.02 25,761
IC-4 The electronic information resources I need 6.64 8.02 7.01 0.37 -1.01 27,520 IC-5 Modern equipment that lets me easily access
needed information 6.78 8.07 7.15 0.37 -0.92 27,759
IC-6 Easy-to-use access tools that allow me to find things on my own
6.70 8.03 7.07 0.37 -0.97 27,737
IC-7 Making information easily accessible for independent use
6.71 8.03 7.16 0.44 -0.87 27,681
IC-8 Print and/or electronic journal collections I require for my work
6.82 8.14 6.94 0.12 -1.19 26,188
LP-1 Library space that inspires study and learning 6.42 8.00 6.47 0.04 -1.53 27,981 LP-2 Quiet space for individual activities 6.73 8.06 6.80 0.07 -1.26 27,898 LP-3 A comfortable and inviting location 6.46 7.96 6.88 0.42 -1.08 28,003 LP-4 A getaway for study, learning, or research 6.56 8.00 6.90 0.34 -1.10 27,609 LP-5 Community space for group learning and
group study 6.20 7.63 6.63 0.43 -1.00 26,536
Grand Total
6.53 7.90 6.99 0.46 -0.92 27,092
Question Minimum
SD Desired
SD Perceived
SD Adequacy
SD Superiority
SD n
AS-1 Employees who instill confidence in users 1.68 1.22 1.59 1.95 1.68 27,942 AS-2 Giving users individual attention 1.68 1.28 1.49 1.81 1.57 27,235 AS-3 Employees who are consistently courteous 1.63 1.26 1.42 1.74 1.50 26,896 AS-4 Readiness to respond to users' questions 1.66 1.27 1.50 1.78 1.53 27,107 AS-5 Employees who have the knowledge to
answer user questions 1.67 1.40 1.57 1.80 1.65 27,181
AS-6 Employees who deal with users in a caring fashion
1.59 1.18 1.40 1.70 1.45 27,080
AS-7 Employees who understand the needs of their users
1.62 1.28 1.50 1.79 1.60 22,451
AS-8 Willingness to help users 1.61 1.26 1.47 1.74 1.53 26,854 AS-9 Dependability in handling users' service
problems 1.85 1.62 1.71 1.84 1.73 27,017
IC-1 Making electronic resources accessible from my home or office
1.69 1.23 1.70 2.13 1.89 28,003
IC-2 A library Web site enabling me to locate information on my own
1.57 1.17 1.42 1.81 1.56 27,737
IC-3 The printed library materials I need for my work
1.70 1.19 1.64 2.03 1.78 27,604
IC-4 The electronic information resources I need 1.55 1.15 1.38 1.76 1.51 27,681 IC-5 Modern equipment that lets me easily
access needed information 1.65 1.20 1.58 2.04 1.79 26,188
IC-6 Easy-to-use access tools that allow me to find things on my own
1.73 1.29 1.82 2.31 2.08 27,898

Revised 9/17/07
87
Question Minimum SD
Desired SD
Perceived SD
Adequacy SD
Superiority SD
n
IC-7 Making information easily accessible for independent use
1.71 1.30 1.82 2.26 2.09 27,981
IC-8 Print and/or electronic journal collections I require for my work
1.65 1.32 1.54 1.90 1.74 25,761
LP-1 Library space that inspires study and learning
1.57 1.19 1.43 1.83 1.61 27,520
LP-2 Quiet space for individual activities 1.86 1.56 1.78 2.33 2.15 26,536 LP-3 A comfortable and inviting location 1.69 1.26 1.61 2.07 1.81 27,609 LP-4 A getaway for study, learning, or research 1.58 1.16 1.47 1.85 1.60 27,759 LP-5 Community space for group learning and
group study 1.62 1.18 1.54 1.87 1.65 27,988
Grand Total
1.66 1.27 1.56 1.92 1.70 27,092
American English
Perceived Less Than Minimum Perceived Less Than Desired Perceived Greater than Minimum Perceived Greater than Desired
Question Minimum
Mean Desired
Mean Perceived
Mean Adequacy
Mean Superiority
Mean n
AS-1 Employees who instill confidence in users 5.66 7.45 6.50 0.84 -0.95 20,324 AS-2 Giving users individual attention 5.64 7.08 6.43 0.79 -0.65 20,404 AS-3 Employees who are consistently courteous 6.74 8.03 7.25 0.51 -0.78 21,057 AS-4 Readiness to respond to users' questions 6.61 7.86 7.23 0.62 -0.63 20,342
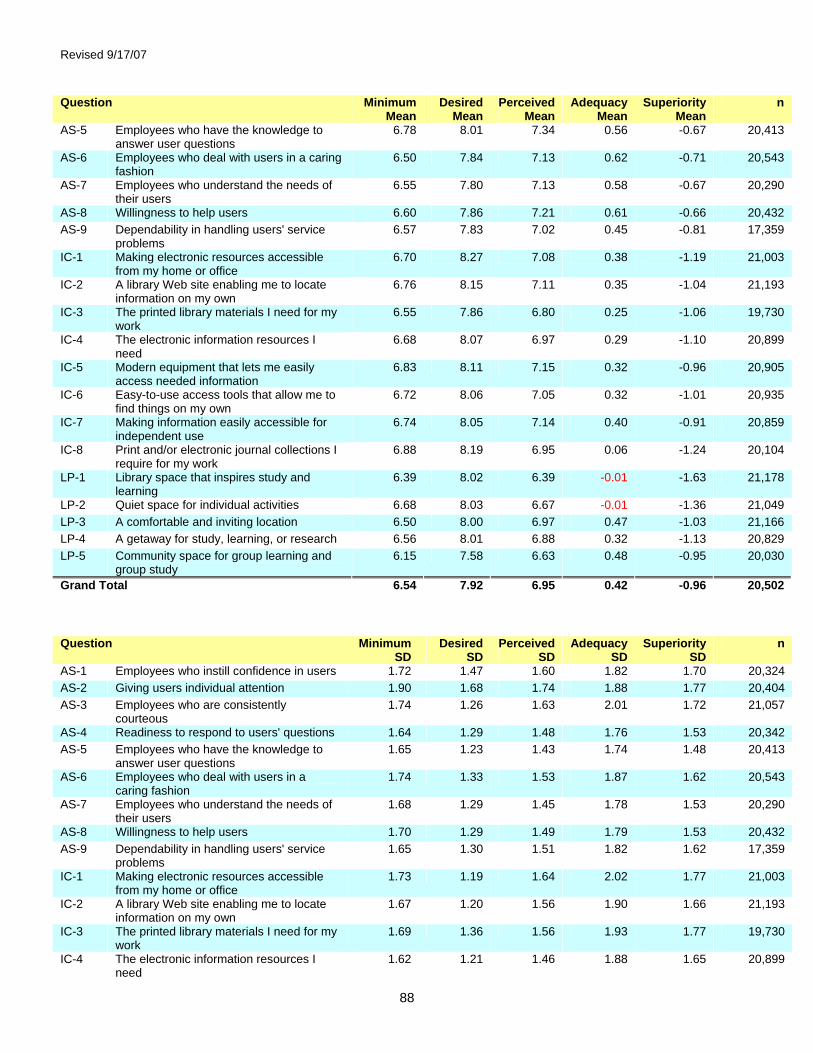
Revised 9/17/07
88
Question Minimum Mean
Desired Mean
Perceived Mean
Adequacy Mean
Superiority Mean
n
AS-5 Employees who have the knowledge to answer user questions
6.78 8.01 7.34 0.56 -0.67 20,413
AS-6 Employees who deal with users in a caring fashion
6.50 7.84 7.13 0.62 -0.71 20,543
AS-7 Employees who understand the needs of their users
6.55 7.80 7.13 0.58 -0.67 20,290
AS-8 Willingness to help users 6.60 7.86 7.21 0.61 -0.66 20,432 AS-9 Dependability in handling users' service
problems 6.57 7.83 7.02 0.45 -0.81 17,359
IC-1 Making electronic resources accessible from my home or office
6.70 8.27 7.08 0.38 -1.19 21,003
IC-2 A library Web site enabling me to locate information on my own
6.76 8.15 7.11 0.35 -1.04 21,193
IC-3 The printed library materials I need for my work
6.55 7.86 6.80 0.25 -1.06 19,730
IC-4 The electronic information resources I need
6.68 8.07 6.97 0.29 -1.10 20,899
IC-5 Modern equipment that lets me easily access needed information
6.83 8.11 7.15 0.32 -0.96 20,905
IC-6 Easy-to-use access tools that allow me to find things on my own
6.72 8.06 7.05 0.32 -1.01 20,935
IC-7 Making information easily accessible for independent use
6.74 8.05 7.14 0.40 -0.91 20,859
IC-8 Print and/or electronic journal collections I require for my work
6.88 8.19 6.95 0.06 -1.24 20,104
LP-1 Library space that inspires study and learning
6.39 8.02 6.39 -0.01 -1.63 21,178
LP-2 Quiet space for individual activities 6.68 8.03 6.67 -0.01 -1.36 21,049 LP-3 A comfortable and inviting location 6.50 8.00 6.97 0.47 -1.03 21,166 LP-4 A getaway for study, learning, or research 6.56 8.01 6.88 0.32 -1.13 20,829 LP-5 Community space for group learning and
group study 6.15 7.58 6.63 0.48 -0.95 20,030
Grand Total
6.54 7.92 6.95 0.42 -0.96 20,502
Question Minimum
SD Desired
SD Perceived
SD Adequacy
SD Superiority
SD n
AS-1 Employees who instill confidence in users 1.72 1.47 1.60 1.82 1.70 20,324 AS-2 Giving users individual attention 1.90 1.68 1.74 1.88 1.77 20,404 AS-3 Employees who are consistently
courteous 1.74 1.26 1.63 2.01 1.72 21,057
AS-4 Readiness to respond to users' questions 1.64 1.29 1.48 1.76 1.53 20,342 AS-5 Employees who have the knowledge to
answer user questions 1.65 1.23 1.43 1.74 1.48 20,413
AS-6 Employees who deal with users in a caring fashion
1.74 1.33 1.53 1.87 1.62 20,543
AS-7 Employees who understand the needs of their users
1.68 1.29 1.45 1.78 1.53 20,290
AS-8 Willingness to help users 1.70 1.29 1.49 1.79 1.53 20,432 AS-9 Dependability in handling users' service
problems 1.65 1.30 1.51 1.82 1.62 17,359
IC-1 Making electronic resources accessible from my home or office
1.73 1.19 1.64 2.02 1.77 21,003
IC-2 A library Web site enabling me to locate information on my own
1.67 1.20 1.56 1.90 1.66 21,193
IC-3 The printed library materials I need for my work
1.69 1.36 1.56 1.93 1.77 19,730
IC-4 The electronic information resources I need
1.62 1.21 1.46 1.88 1.65 20,899

Revised 9/17/07
89
Question Minimum SD
Desired SD
Perceived SD
Adequacy SD
Superiority SD
n
IC-5 Modern equipment that lets me easily access needed information
1.63 1.18 1.47 1.86 1.60 20,905
IC-6 Easy-to-use access tools that allow me to find things on my own
1.62 1.20 1.43 1.83 1.58 20,935
IC-7 Making information easily accessible for independent use
1.60 1.18 1.39 1.79 1.51 20,859
IC-8 Print and/or electronic journal collections I require for my work
1.69 1.21 1.59 2.06 1.80 20,104
LP-1 Library space that inspires study and learning
1.77 1.35 1.83 2.29 2.11 21,178
LP-2 Quiet space for individual activities 1.80 1.36 1.85 2.39 2.15 21,049 LP-3 A comfortable and inviting location 1.75 1.26 1.66 2.11 1.85 21,166 LP-4 A getaway for study, learning, or research 1.74 1.30 1.61 2.09 1.81 20,829 LP-5 Community space for group learning and
group study 1.93 1.63 1.76 2.34 2.17 20,030
Grand Total
1.71 1.31 1.58 1.95 1.72 20,502
Canadian French
Perceived Less Than Minimum Perceived Less Than Desired Perceived Greater than Minimum Perceived Greater than Desired
Question Minimum
Mean Desired
Mean Perceived
Mean Adequacy
Mean Superiority
Mean n
AS-1 Employees who instill confidence in users 5.96 7.64 7.16 1.20 -0.48 6,857 AS-2 Giving users individual attention 5.73 7.14 6.59 0.86 -0.55 6,613

Revised 9/17/07
90
Question Minimum Mean
Desired Mean
Perceived Mean
Adequacy Mean
Superiority Mean
n
AS-3 Employees who are consistently courteous
6.82 8.06 7.56 0.74 -0.50 6,885
AS-4 Readiness to respond to users' questions 6.42 7.69 7.13 0.71 -0.56 6,512 AS-5 Employees who have the knowledge to
answer user questions 6.86 8.07 7.66 0.80 -0.40 6,667
AS-6 Employees who deal with users in a caring fashion
6.40 7.74 7.21 0.82 -0.52 6,692
AS-7 Employees who understand the needs of their users
6.48 7.77 7.26 0.78 -0.51 6,606
AS-8 Willingness to help users 6.39 7.73 7.08 0.69 -0.65 6,675 AS-9 Dependability in handling users' service
problems 6.51 7.77 7.10 0.59 -0.67 5,092
IC-1 Making electronic resources accessible from my home or office
6.43 7.98 7.10 0.67 -0.88 6,601
IC-2 A library Web site enabling me to locate information on my own
6.66 8.00 7.20 0.54 -0.79 6,795
IC-3 The printed library materials I need for my work
6.60 7.84 6.96 0.37 -0.88 6,031
IC-4 The electronic information resources I need
6.50 7.85 7.15 0.65 -0.70 6,621
IC-5 Modern equipment that lets me easily access needed information
6.62 7.97 7.17 0.55 -0.80 6,854
IC-6 Easy-to-use access tools that allow me to find things on my own
6.62 7.97 7.14 0.52 -0.83 6,802
IC-7 Making information easily accessible for independent use
6.62 7.97 7.22 0.60 -0.75 6,822
IC-8 Print and/or electronic journal collections I require for my work
6.61 7.97 6.93 0.32 -1.04 6,084
LP-1 Library space that inspires study and learning
6.52 7.96 6.72 0.20 -1.24 6,803
LP-2 Quiet space for individual activities 6.88 8.13 7.18 0.31 -0.95 6,849 LP-3 A comfortable and inviting location 6.35 7.85 6.61 0.26 -1.24 6,837 LP-4 A getaway for study, learning, or research 6.55 7.98 6.98 0.43 -1.00 6,780 LP-5 Community space for group learning and
group study 6.35 7.77 6.62 0.27 -1.15 6,506
Grand Total
6.49 7.86 7.08 0.58 -0.78 144,984
Question Minimum
SD Desired
SD Perceived
SD Adequacy
SD Superiority
SD n
AS-1 Employees who instill confidence in users 1.52 1.16 1.37 1.69 1.43 6,857 AS-2 Giving users individual attention 1.70 1.44 1.63 1.72 1.58 6,613 AS-3 Employees who are consistently
courteous 1.49 1.08 1.43 1.76 1.52 6,885
AS-4 Readiness to respond to users' questions 1.47 1.18 1.44 1.69 1.51 6,512 AS-5 Employees who have the knowledge to
answer user questions 1.40 1.03 1.27 1.56 1.32 6,667
AS-6 Employees who deal with users in a caring fashion
1.45 1.13 1.37 1.59 1.41 6,692
AS-7 Employees who understand the needs of their users
1.46 1.15 1.33 1.59 1.39 6,606
AS-8 Willingness to help users 1.54 1.21 1.52 1.72 1.55 6,675 AS-9 Dependability in handling users' service
problems 1.48 1.18 1.45 1.69 1.52 5,092
IC-1 Making electronic resources accessible from my home or office
1.58 1.17 1.65 2.03 1.81 6,601
IC-2 A library Web site enabling me to locate information on my own
1.46 1.11 1.47 1.76 1.59 6,795
IC-3 The printed library materials I need for my work
1.49 1.19 1.49 1.78 1.62 6,031

Revised 9/17/07
91
Question Minimum SD
Desired SD
Perceived SD
Adequacy SD
Superiority SD
n
IC-4 The electronic information resources I need
1.41 1.11 1.31 1.66 1.46 6,621
IC-5 Modern equipment that lets me easily access needed information
1.43 1.07 1.44 1.82 1.61 6,854
IC-6 Easy-to-use access tools that allow me to find things on my own
1.40 1.07 1.36 1.72 1.51 6,802
IC-7 Making information easily accessible for independent use
1.39 1.05 1.36 1.67 1.49 6,822
IC-8 Print and/or electronic journal collections I require for my work
1.50 1.13 1.54 1.95 1.74 6,084
LP-1 Library space that inspires study and learning
1.51 1.13 1.77 2.15 1.99 6,803
LP-2 Quiet space for individual activities 1.49 1.07 1.65 2.04 1.81 6,849 LP-3 A comfortable and inviting location 1.50 1.13 1.77 2.18 2.00 6,837 LP-4 A getaway for study, learning, or research 1.52 1.14 1.61 2.02 1.79 6,780 LP-5 Community space for group learning and
group study 1.63 1.29 1.85 2.28 2.10 6,506
Grand Total
1.49 1.15 1.50 1.82 1.62 6,590

Revised 9/17/07
92
4.2.5 Core Question Dimension Summary On the chart below, scores for each dimension of library service quality have been plotted graphically. The exterior bars represent the range of minimum to desired mean scores for each dimension. The interior bars represent the range of minimum to perceived mean scores (the service adequacy gap) for each dimension of library service quality. Unified
This table shows mean standard deviations for each of the local questions added by the individual library or consortium, where n is the number of respondents for each particular question. (For a more detailed explanation of the headings, see the Introduction to this notebook.)
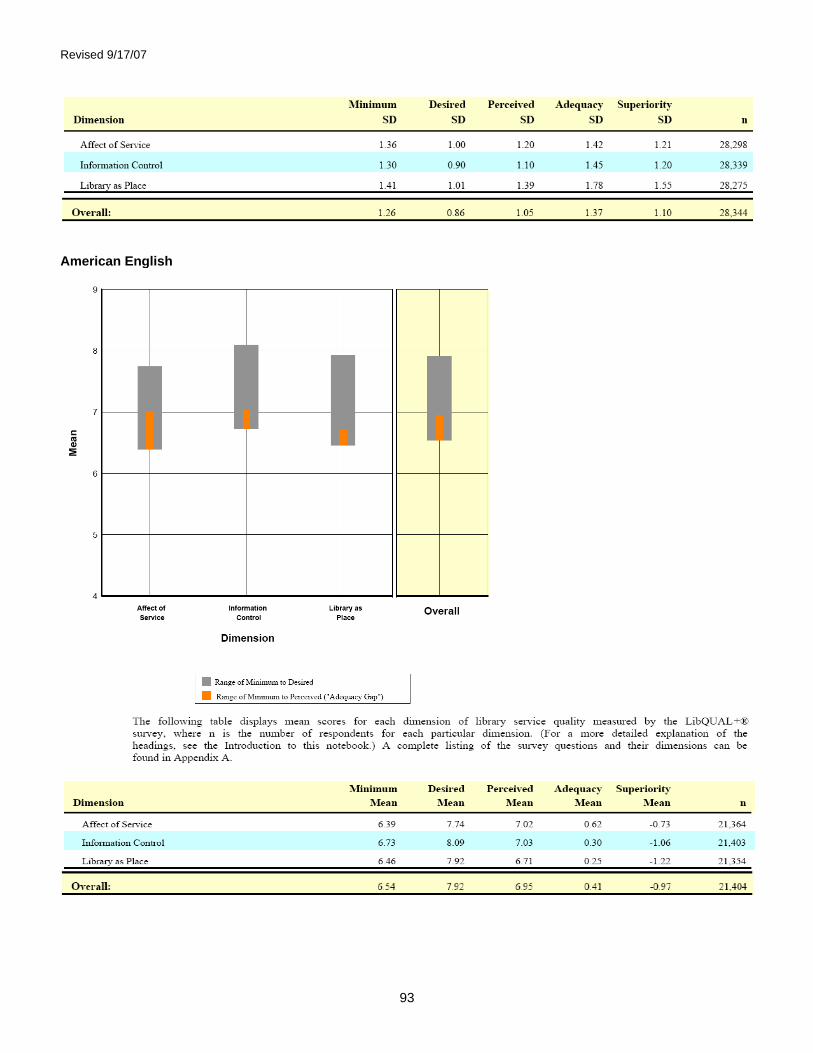
Revised 9/17/07
93
American English

Revised 9/17/07
94
This table shows mean standard deviations for each of the local questions added by the individual library or consortium, where n is the number of respondents for each particular question. (For a more detailed explanation of the headings, see the Introduction to this notebook.)
Canadian French
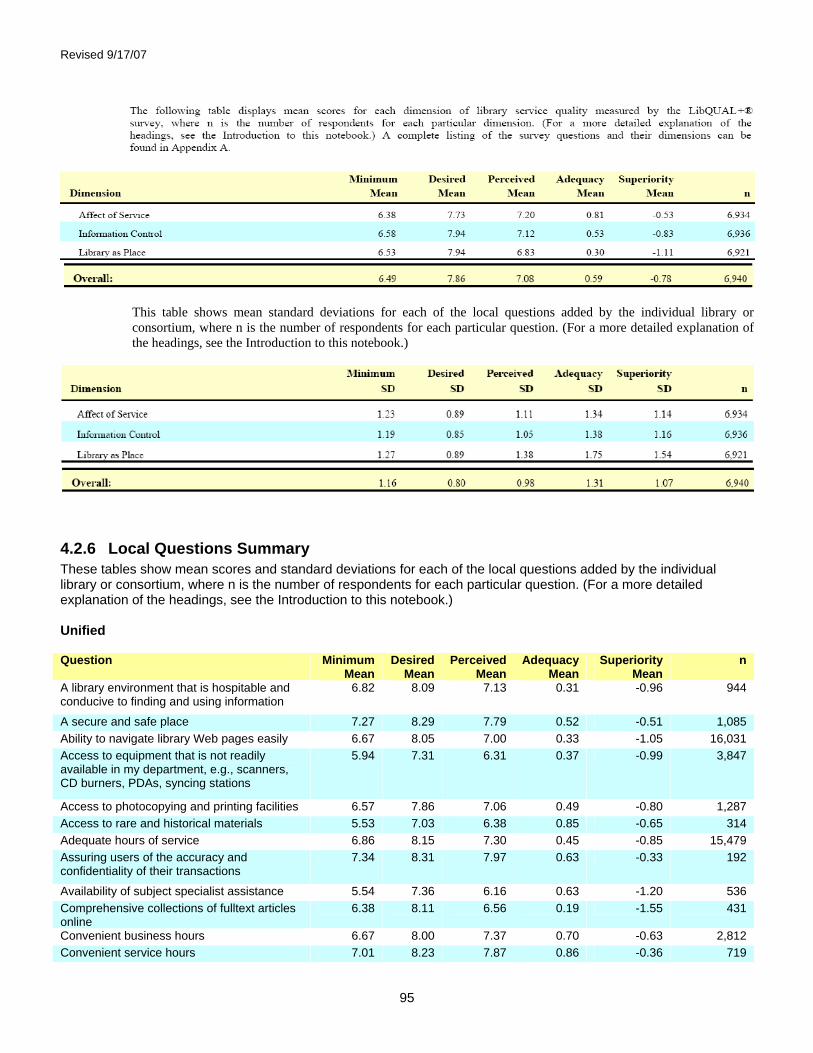
Revised 9/17/07
95
This table shows mean standard deviations for each of the local questions added by the individual library or consortium, where n is the number of respondents for each particular question. (For a more detailed explanation of the headings, see the Introduction to this notebook.)
4.2.6 Local Questions Summary These tables show mean scores and standard deviations for each of the local questions added by the individual library or consortium, where n is the number of respondents for each particular question. (For a more detailed explanation of the headings, see the Introduction to this notebook.) Unified Question Minimum
Mean Desired
Mean Perceived
Mean Adequacy
Mean Superiority
Mean n
A library environment that is hospitable and conducive to finding and using information
6.82 8.09 7.13 0.31 -0.96 944
A secure and safe place 7.27 8.29 7.79 0.52 -0.51 1,085 Ability to navigate library Web pages easily 6.67 8.05 7.00 0.33 -1.05 16,031 Access to equipment that is not readily available in my department, e.g., scanners, CD burners, PDAs, syncing stations
5.94 7.31 6.31 0.37 -0.99 3,847
Access to photocopying and printing facilities 6.57 7.86 7.06 0.49 -0.80 1,287 Access to rare and historical materials 5.53 7.03 6.38 0.85 -0.65 314 Adequate hours of service 6.86 8.15 7.30 0.45 -0.85 15,479 Assuring users of the accuracy and confidentiality of their transactions
7.34 8.31 7.97 0.63 -0.33 192
Availability of subject specialist assistance 5.54 7.36 6.16 0.63 -1.20 536 Comprehensive collections of fulltext articles online
6.38 8.11 6.56 0.19 -1.55 431
Convenient business hours 6.67 8.00 7.37 0.70 -0.63 2,812 Convenient service hours 7.01 8.23 7.87 0.86 -0.36 719

Revised 9/17/07
96
Question Minimum Mean
Desired Mean
Perceived Mean
Adequacy Mean
Superiority Mean
n
Ease and timeliness in getting materials from other libraries
6.34 7.75 6.80 0.46 -0.95 10,891
Ease of use of electronic resources 6.50 7.90 7.34 0.84 -0.56 1,331 Efficient interlibrary loan / document delivery 6.55 7.68 6.96 0.42 -0.72 704 Electronic resources matching my information needs
6.73 8.04 7.03 0.31 -1.00 1,520
Enabling me to find information myself 24 hours a day
6.82 7.98 7.00 0.18 -0.98 1,108
Improving library-use skills as a by-product of seeking assistance from library staff
5.77 7.36 6.89 1.13 -0.47 738
Librarians providing help that assists in finding information needed now while improving my research skills
6.45 7.87 7.52 1.07 -0.35 1,744
Librarians providing help that both assists in finding the information needed now, and improves skills useful in future information searches
6.46 7.88 7.50 1.04 -0.38 274
Librarians teaching me how to effectively use the electronically available databases, journals, and books
6.39 7.65 6.97 0.57 -0.69 2,119
Library keeping me informed about all of its services
6.16 7.40 6.40 0.24 -1.00 694
Library orientations / instruction sessions 5.63 6.91 6.69 1.06 -0.23 2,315 Making me aware of library resources and services
5.93 7.35 6.50 0.57 -0.85 18,026
Making me aware of library services 5.65 7.07 6.36 0.71 -0.71 852 Online course support (readings, links, references)
6.30 7.91 6.76 0.46 -1.14 1,165
Providing search tools that permit me to work autonomously
6.60 7.98 7.23 0.63 -0.75 1,335
Ready access to computers / Internet / software
6.72 8.11 7.57 0.85 -0.54 1,359
Resources added to library collections on request
6.34 7.48 6.42 0.07 -1.07 639
Space for group / individual study and research needs
6.91 8.14 6.14 -0.78 -2.01 228
Space for students to study and work in groups
6.04 7.44 6.23 0.20 -1.21 392
Space that facilitates quiet study 6.98 8.27 6.33 -0.65 -1.94 233 Teaching me how to access, evaluate, and use information
5.94 7.40 6.64 0.69 -0.76 18,508
Teaching me how to locate, evaluate, and use information
6.43 7.77 7.15 0.72 -0.62 1,139
The library collection provides information resources reflecting diverse points of view
6.88 7.93 7.22 0.34 -0.71 1,057
The library program teaches me how to access, evaluate, and use information
6.34 7.63 6.33 -0.01 -1.30 220
Timely document delivery / interlibrary loan 6.49 7.80 7.02 0.53 -0.77 1,386
Timely document delivery/interlibrary loan 6.30 7.78 7.44 1.14 -0.34 760 Question Minimum
SD Desired
SD Perceived
SD Adequacy
SD Superiority
SD n
A library environment that is hospitable and conducive to finding and using information
1.51 1.06 1.56 1.93 1.68 944
A secure and safe place 1.78 1.26 1.38 1.84 1.46 1,085 Ability to navigate library Web pages easily 1.62 1.19 1.54 1.95 1.70 16,031

Revised 9/17/07
97
Question Minimum SD
Desired SD
Perceived SD
Adequacy SD
Superiority SD
n
Access to equipment that is not readily available in my department, e.g., scanners, CD burners, PDAs, syncing stations
1.88 1.66 1.80 2.17 2.09 3,847
Access to photocopying and printing facilities
1.71 1.34 1.72 2.06 1.90 1,287
Access to rare and historical materials 2.10 2.00 1.72 2.00 2.06 314 Adequate hours of service 1.68 1.18 1.74 2.24 1.96 15,479 Assuring users of the accuracy and confidentiality of their transactions
1.66 0.98 1.26 1.46 1.06 192
Availability of subject specialist assistance 1.76 1.45 1.68 1.88 1.81 536 Comprehensive collections of fulltext articles online
1.68 1.31 1.54 2.08 1.83 431
Convenient business hours 1.49 1.12 1.59 2.01 1.73 2,812 Convenient service hours 1.71 1.21 1.34 1.91 1.50 719 Ease and timeliness in getting materials from other libraries
1.74 1.40 1.65 2.06 1.84 10,891
Ease of use of electronic resources 1.45 1.10 1.33 1.73 1.55 1,331 Efficient interlibrary loan / document delivery
1.77 1.51 1.68 2.05 1.93 704
Electronic resources matching my information needs
1.39 1.06 1.37 1.79 1.58 1,520
Enabling me to find information myself 24 hours a day
1.80 1.37 1.74 2.05 1.85 1,108
Improving library-use skills as a by-product of seeking assistance from library staff
1.79 1.40 1.34 1.77 1.50 738
Librarians providing help that assists in finding information needed now while improving my research skills
1.58 1.22 1.47 1.82 1.57 1,744
Librarians providing help that both assists in finding the information needed now, and improves skills useful in future information searches
1.63 1.25 1.23 1.49 1.35 274
Librarians teaching me how to effectively use the electronically available databases, journals, and books
1.81 1.47 1.74 2.02 1.87 2,119
Library keeping me informed about all of its services
1.70 1.43 1.74 1.91 1.82 694
Library orientations / instruction sessions 2.06 1.87 1.83 2.11 1.97 2,315 Making me aware of library resources and services
1.80 1.51 1.67 2.01 1.88 18,026
Making me aware of library services 1.86 1.65 1.72 2.05 1.98 852 Online course support (readings, links, references)
1.67 1.26 1.46 1.82 1.62 1,165
Providing search tools that permit me to work autonomously
1.35 1.03 1.28 1.57 1.42 1,335
Ready access to computers / Internet / software
1.44 1.00 1.39 1.80 1.51 1,359
Resources added to library collections on request
1.71 1.53 1.70 1.95 1.96 639
Space for group / individual study and research needs
1.75 1.37 1.94 2.60 2.48 228
Space for students to study and work in groups
1.89 1.72 1.86 2.34 2.30 392
Space that facilitates quiet study 1.81 1.16 2.01 2.81 2.38 233 Teaching me how to access, evaluate, and use information
1.79 1.55 1.68 1.96 1.84 18,508
Teaching me how to locate, evaluate, and use information
1.83 1.44 1.60 1.87 1.62 1,139

Revised 9/17/07
98
Question Minimum SD
Desired SD
Perceived SD
Adequacy SD
Superiority SD
n
The library collection provides information resources reflecting diverse points of view
1.71 1.35 1.54 1.82 1.58 1,057
The library program teaches me how to access, evaluate, and use information
1.72 1.35 1.83 2.09 1.96 220
Timely document delivery / interlibrary loan 1.74 1.37 1.61 1.89 1.72 1,386
Timely document delivery/ nterlibrary loan 1.55 1.18 1.39 1.86 1.56 760 American English Question Minimum
Mean Desired
Mean Perceived
Mean Adequacy
Mean Superiority
Mean n
A library environment that is hospitable and conducive to finding and using information
6.82 8.16 7.12 0.30 -1.04 325
A secure and safe place 7.27 8.29 7.79 0.52 -0.51 1,085 Ability to navigate library Web pages easily 6.74 8.11 7.02 0.28 -1.09 13,340 Access to equipment that is not readily available in my department, e.g., scanners, CD burners, PDAs, syncing stations
5.99 7.32 6.22 0.23 -1.09 2,881
Access to photocopying and printing facilities
6.33 7.71 7.14 0.81 -0.57 697
Access to rare and historical materials 5.53 7.03 6.38 0.85 -0.65 314 Adequate hours of service 6.86 8.17 7.29 0.43 -0.87 14,159 Availability of subject specialist assistance 5.54 7.36 6.16 0.63 -1.20 536 Comprehensive collections of fulltext articles online
6.38 8.11 6.56 0.19 -1.55 431
Convenient business hours 7.12 8.35 7.42 0.30 -0.92 454 Convenient service hours 7.01 8.23 7.87 0.86 -0.36 719 Ease and timeliness in getting materials from other libraries
6.36 7.79 6.82 0.45 -0.97 9,590
Efficient interlibrary loan / document delivery
6.48 7.64 6.95 0.47 -0.69 627
Electronic resources matching my information needs
6.84 8.30 6.80 -0.04 -1.50 230
Enabling me to find information myself 24 hours a day
6.82 7.98 7.00 0.18 -0.98 1,108
Improving library-use skills as a by-product of seeking assistance from library staff
5.77 7.36 6.89 1.13 -0.47 738
Librarians providing help that assists in finding information needed now while improving my research skills
6.28 7.78 7.10 0.82 -0.68 590
Librarians providing help that both assists in finding the information needed now, and improves skills useful in future information searches
6.46 7.88 7.50 1.04 -0.38 274
Librarians teaching me how to effectively use the electronically available databases, journals, and books
6.27 7.56 6.63 0.37 -0.93 800
Library orientations / instruction sessions 5.48 6.70 6.42 0.94 -0.28 1,242 Making me aware of library resources and services
5.94 7.37 6.49 0.55 -0.88 15,124
Making me aware of library services 5.65 7.07 6.36 0.71 -0.71 852 Online course support (readings, links, references)
6.30 7.91 6.76 0.46 -1.14 1,165
Resources added to library collections on request
6.30 7.46 6.39 0.10 -1.06 578

Revised 9/17/07
99
Question Minimum Mean
Desired Mean
Perceived Mean
Adequacy Mean
Superiority Mean
n
Space for group / individual study and research needs
6.91 8.14 6.14 -0.78 -2.01 228
Space for students to study and work in groups
6.03 7.43 6.23 0.19 -1.21 391
Space that facilitates quiet study 6.98 8.27 6.33 -0.65 -1.94 233 Teaching me how to access, evaluate, and use information
5.93 7.39 6.67 0.74 -0.73 13,938
Teaching me how to locate, evaluate, and use information
6.43 7.77 7.15 0.72 -0.62 1,139
The library collection provides information resources reflecting diverse points of view
6.88 7.93 7.22 0.34 -0.71 1,057
Timely document delivery / interlibrary loan 6.53 7.84 7.00 0.47 -0.84 1,098 Question Minimum
SD Desired
SD Perceived
SD Adequacy
SD Superiority
SD n
A library environment that is hospitable and conducive to finding and using information
1.63 1.07 1.51 1.91 1.57 325
A secure and safe place 1.78 1.26 1.38 1.84 1.46 1,085 Ability to navigate library Web pages easily 1.65 1.18 1.56 1.98 1.71 13,340 Access to equipment that is not readily available in my department, e.g., scanners, CD burners, PDAs, syncing stations
1.95 1.74 1.85 2.24 2.19 2,881
Access to photocopying and printing facilities
1.83 1.49 1.63 1.97 1.80 697
Access to rare and historical materials 2.10 2.00 1.72 2.00 2.06 314 Adequate hours of service 1.70 1.19 1.76 2.26 1.98 14,159 Availability of subject specialist assistance 1.76 1.45 1.68 1.88 1.81 536 Comprehensive collections of fulltext articles online
1.68 1.31 1.54 2.08 1.83 431
Convenient business hours 1.56 1.00 1.61 2.04 1.70 454 Convenient service hours 1.71 1.21 1.34 1.91 1.50 719 Ease and timeliness in getting materials from other libraries
1.77 1.40 1.66 2.07 1.85 9,590
Efficient interlibrary loan / document delivery
1.78 1.52 1.68 2.05 1.93 627
Electronic resources matching my information needs
1.58 1.00 1.56 2.20 1.72 230
Enabling me to find information myself 24 hours a day
1.80 1.37 1.74 2.05 1.85 1,108
Improving library-use skills as a by-product of seeking assistance from library staff
1.79 1.40 1.34 1.77 1.50 738
Librarians providing help that assists in finding information needed now while improving my research skills
1.75 1.41 1.50 1.83 1.63 590
Librarians providing help that both assists in finding the information needed now, and improves skills useful in future information searches
1.63 1.25 1.23 1.49 1.35 274
Librarians teaching me how to effectively use the electronically available databases, journals, and books
1.91 1.57 1.91 2.13 2.07 800
Library orientations / instruction sessions 2.15 1.99 1.85 2.19 2.11 1,242 Making me aware of library resources and services
1.81 1.53 1.67 2.02 1.89 15,124
Making me aware of library services 1.86 1.65 1.72 2.05 1.98 852

Revised 9/17/07
100
Question Minimum SD
Desired SD
Perceived SD
Adequacy SD
Superiority SD
n
Online course support (readings, links, references)
1.67 1.26 1.46 1.82 1.62 1,165
Resources added to library collections on request
1.71 1.55 1.70 1.97 1.99 578
Space for group / individual study and research needs
1.75 1.37 1.94 2.60 2.48 228
Space for students to study and work in groups
1.90 1.72 1.86 2.35 2.30 391
Space that facilitates quiet study 1.81 1.16 2.01 2.81 2.38 233 Teaching me how to access, evaluate, and use information
1.84 1.60 1.65 1.96 1.85 13,938
Teaching me how to locate, evaluate, and use information
1.83 1.44 1.60 1.87 1.62 1,139
The library collection provides information resources reflecting diverse points of view
1.71 1.35 1.54 1.82 1.58 1,057
Timely document delivery / interlibrary loan 1.77 1.40 1.62 1.91 1.73 1,098 Canadian French Question Minimum
Mean Desired
Mean Perceived
Mean Adequacy
Mean Superiority
Mean n
A library environment that is hospitable and conducive to finding and using information
6.82 8.06 7.14 0.31 -0.92 619
Ability to navigate library Web pages easily 6.31 7.75 6.92 0.61 -0.83 2,691 Access to equipment that is not readily available in my department, e.g., scanners, CD burners, PDAs, syncing stations
5.79 7.29 6.58 0.80 -0.71 966
Access to photocopying and printing facilities
6.85 8.04 6.95 0.10 -1.08 590
Adequate hours of service 6.79 8.03 7.44 0.65 -0.59 1,320 Assuring users of the accuracy and confidentiality of their transactions
7.34 8.31 7.97 0.63 -0.33 192
Convenient business hours 6.59 7.93 7.36 0.77 -0.57 2,358 Ease and timeliness in getting materials from other libraries
6.14 7.47 6.66 0.52 -0.81 1,301
Ease of use of electronic resources 6.50 7.90 7.34 0.84 -0.56 1,331 Efficient interlibrary loan / document delivery 7.13 8.05 7.12 -0.01 -0.94 77 Electronic resources matching my information needs
6.70 7.99 7.08 0.37 -0.92 1,290
Librarians providing help that assists in finding information needed now while improving my research skills
6.54 7.91 7.73 1.19 -0.18 1,154
Librarians teaching me how to effectively use the electronically available databases, journals, and books
6.71 7.84 7.00 0.29 -0.84 1,319
Library keeping me informed about all of its services
6.16 7.40 6.40 0.24 -1.00 694
Library orientations / instruction sessions 5.81 7.16 7.00 1.19 -0.16 1,073 Making me aware of library resources and services
5.87 7.27 6.56 0.68 -0.72 2,902
Providing search tools that permit me to work autonomously
6.60 7.98 7.23 0.63 -0.75 1,335
Ready access to computers / Internet / software
6.72 8.11 7.57 0.85 -0.54 1,359
Resources added to library collections on request
6.79 7.74 6.62 -0.16 -1.11 61

Revised 9/17/07
101
Question Minimum Mean
Desired Mean
Perceived Mean
Adequacy Mean
Superiority Mean
n
Space for students to study and work in groups
7.00 9.00 8.00 1.00 -1.00 1
Teaching me how to access, evaluate, and use information
6.00 7.40 6.54 0.54 -0.86 4,570
The library program teaches me how to access, evaluate, and use information
6.34 7.63 6.33 -0.01 -1.30 220
Timely document delivery / interlibrary loan 6.33 7.71 7.27 0.94 -0.44 1,048 Question Minimum
SD Desired
SD Perceived
SD Adequacy
SD Superiority
SD n
A library environment that is hospitable and conducive to finding and using information
1.44 1.05 1.59 1.94 1.73 619
Ability to navigate library Web pages easily 1.44 1.14 1.49 1.78 1.62 2,691 Access to equipment that is not readily available in my department, e.g., scanners, CD burners, PDAs, syncing stations
1.64 1.37 1.61 1.91 1.72 966
Access to photocopying and printing facilities
1.50 1.12 1.82 2.09 1.97 590
Adequate hours of service 1.45 1.06 1.51 1.97 1.70 1,320 Assuring users of the accuracy and confidentiality of their transactions
1.66 0.98 1.26 1.46 1.06 192
Convenient business hours 1.46 1.13 1.59 1.99 1.73 2,358 Ease and timeliness in getting materials from other libraries
1.55 1.32 1.58 1.95 1.77 1,301
Ease of use of electronic resources 1.45 1.10 1.33 1.73 1.55 1,331 Efficient interlibrary loan / document delivery
1.58 1.31 1.68 1.99 1.98 77
Electronic resources matching my information needs
1.35 1.07 1.33 1.70 1.54 1,290
Librarians providing help that assists in finding information needed now while improving my research skills
1.48 1.10 1.40 1.81 1.52 1,154
Librarians teaching me how to effectively use the electronically available databases, journals, and books
1.67 1.32 1.84 2.01 1.93 1,319
Library keeping me informed about all of its services
1.70 1.43 1.74 1.91 1.82 694
Library orientations / instruction sessions 1.93 1.68 1.75 2.02 1.79 1,073 Making me aware of library resources and services
1.71 1.43 1.68 1.91 1.77 2,902
Providing search tools that permit me to work autonomously
1.35 1.03 1.28 1.57 1.42 1,335
Ready access to computers / Internet / software
1.44 1.00 1.39 1.80 1.51 1,359
Resources added to library collections on request
1.69 1.34 1.69 1.73 1.63 61
Space for students to study and work in groups
1
Teaching me how to access, evaluate, and use information
1.65 1.39 1.76 1.95 1.81 4,570
The library program teaches me how to access, evaluate, and use information
1.72 1.35 1.83 2.09 1.96 220
Timely document delivery / interlibrary loan 1.59 1.22 1.47 1.83 1.61 1,048

Revised 9/17/07
102
4.2.7 General Satisfaction Questions Summary This table displays mean score and standard deviation for each of the general satisfaction questions: Satisfaction with Treatment, Satisfaction with Support, and Satisfaction with Overall Quality of Service, where n is the number of respondents for each particular question. These scores are calculated from responses to the general satisfaction questions on the LibQUAL+® survey, in which respondents rated their levels of general satisfaction on a scale from 1-9. Unified Question Response Mean Response
SD Respondents
(n) How would you rate the overall quality of the service provided by the library?
7.08 1.30 28,341
In general, I am satisfied with library support for my learning, research, and/or teaching needs.
6.99 1.57 28,343
In general, I am satisfied with the way in which I am treated at the library.
7.33 1.56 28,343
American English Question Response Mean Response
SD Respondents
(n) How would you rate the overall quality of the service provided by the library?
7.03 1.35 21,403
In general, I am satisfied with library support for my learning, research, and/or teaching needs.
6.89 1.61 21,403
In general, I am satisfied with the way in which I am treated at the library.
7.26 1.61 21,403
Canadian French Question Response Mean Response
SD Respondents
(n) How would you rate the overall quality of the service provided by the library?
7.22 1.14 6,938
In general, I am satisfied with library support for my learning, research, and/or teaching needs.
7.27 1.42 6,940
In general, I am satisfied with the way in which I am treated at the library.
7.56 1.35 6,940
4.2.8 Information Literacy Outcomes Questions Summary This table displays the mean score and standard deviation for each of the information literacy outcomes questions, where n is the number of respondents for each particular question. These scores are calculated from responses to the information literacy outcomes questions on the LibQUAL+® survey, in which respondents rated their levels of general satisfaction on a scale from 1-9 with 1 being "strongly disagree" and 9 representing "strongly agree". Unified Question Response Mean Response
SD Respondents
(n) The library aids my advancement in my academic discipline. 6.74 1.62 28,344 The library enables me to be more efficient in my academic pursuits.
6.85 1.64 28,343
The library helps me distinguish between trustworthy and untrustworthy information.
6.28 1.87 28,342
The library helps me stay abreast of developments in my field(s) of interest.
6.06 1.71 28,344
The library provides me with the information skills I need in my work or study.
6.44 1.73 28,343

Revised 9/17/07
103
American English Question Response Mean Response
SD Respondents
(n) The library aids my advancement in my academic discipline. 6.69 1.63 21,404 The library enables me to be more efficient in my academic pursuits.
6.81 1.65 21,403
The library helps me distinguish between trustworthy and untrustworthy information.
6.31 1.87 21,403
The library helps me stay abreast of developments in my field(s) of interest.
5.89 1.74 21,404
The library provides me with the information skills I need in my work or study.
6.41 1.72 21,403
Canadian French Question Response Mean Response
SD Respondents
(n) The library aids my advancement in my academic discipline. 6.91 1.57 6,940 The library enables me to be more efficient in my academic pursuits.
6.97 1.60 6,940
The library helps me distinguish between trustworthy and untrustworthy information.
6.19 1.86 6,939
The library helps me stay abreast of developments in my field(s) of interest.
6.58 1.49 6,940
The library provides me with the information skills I need in my work or study.
6.52 1.74 6,940

Revised 9/17/07
104
4.2.9 Library Use Summary This chart shows a graphic representation of library use (both on the premises and electronically), as well as use of non-library information gateways such as Yahoo™ and Google™. Bars represent the frequency with which respondents report using these resources: Daily, Weekly, Monthly, Quarterly, or Never. The table below the chart displays the number and percentage of respondents who selected each option. Unified
0.00%
10.00%
20.00%
30.00%
40.00%
50.00%
60.00%
70.00%
80.00%
90.00%
100.00%
Daily Weekly Monthly Quarterly NeverFrequency
Perc
enta
ge How often do you access library resources through alibrary Web page?
How often do you use resources on library premises?
How often do you use Yahoo(TM), Google(TM), ornon-library gatew ays for information?
Question Daily Weekly Monthly Quarterly Never n How often do you access library resources through a library Web page?
4,221 12,987 7,199 3,016 920 28,343
How often do you use resources on library premises? 5,326 12,666 6,979 2,934 437 28,342 How often do you use Yahoo(TM), Google(TM), or non-library gateways for information?
19,288 6,184 1,596 686 587 28,341
Question Daily Weekly Monthly Quarterly Never n How often do you access library resources through a library Web page?
14.89% 45.82% 25.40% 10.64% 3.25% 100.00%
How often do you use resources on library premises? 18.79% 44.69% 24.62% 10.35% 1.54% 100.00% How often do you use Yahoo(TM), Google(TM), or non-library gateways for information?
68.06% 21.82% 5.63% 2.42% 2.07% 100.00%

Revised 9/17/07
105
American English
0.00%
10.00%
20.00%
30.00%
40.00%
50.00%
60.00%
70.00%
80.00%
90.00%
100.00%
Daily Weekly Monthly Quarterly NeverFrequency
Perc
enta
ge How often do you access library resources through alibrary Web page?
How often do you use resources on library premises?
How often do you use Yahoo(TM), Google(TM), ornon-library gatew ays for information?
Question Daily Weekly Monthly Quarterly Never n How often do you access library resources through a library Web page?
3,490 10,367 5,236 1,671 639 21,403
How often do you use resources on library premises? 4,391 9,595 5,158 1,873 385 21,402 How often do you use Yahoo(TM), Google(TM), or non-library gateways for information? 14,159 4,910 1,310 523 499 21,401 Question Daily Weekly Monthly Quarterly Never n How often do you access library resources through a library Web page?
16.31% 48.44% 24.46% 7.81% 2.99% 100.00%
How often do you use resources on library premises?
20.52% 44.83% 24.10% 8.75% 1.80% 100.00%
How often do you use Yahoo(TM), Google(TM), or non-library gateways for information? 66.16% 22.94% 6.12% 2.44% 2.33% 100.00%

Revised 9/17/07
106
Canadian French
0.00%
10.00%
20.00%
30.00%
40.00%
50.00%
60.00%
70.00%
80.00%
90.00%
100.00%
Daily Weekly Monthly Quarterly NeverFrequency
Perc
enta
ge How often do you access library resources through alibrary Web page?
How often do you use resources on library premises?
How often do you use Yahoo(TM), Google(TM), ornon-library gatew ays for information?
Question Daily Weekly Monthly Quarterly Never n How often do you access library resources through a library Web page?
731 2,620 1,963 1,345 281 6,940
How often do you use resources on library premises?
935 3,071 1,821 1,061 52 6,940
How often do you use Yahoo(TM), Google(TM), or non-library gateways for information?
5,129 1,274 286 163 88 6,940
Question Daily Weekly Monthly Quarterly Never n How often do you access library resources through a library Web page?
10.53% 37.75% 28.29% 19.38% 4.05% 100.00%
How often do you use resources on library premises?
13.47% 44.25% 26.24% 15.29% 0.75% 100.00%
How often do you use Yahoo(TM), Google(TM), or non-library gateways for information?
73.90% 18.36% 4.12% 2.35% 1.27% 100.00%

Revised 9/17/07
107
4.3 College or University Libraries - Graduate
4.3.1 Population and Respondent Profiles by Standard Discipline The chart and table below show a breakdown of survey respondents by discipline, based on user responses to the demographic questions and the demographic data provided by institutions in the online Representativeness section*. This section shows survey respondents broken down based on the LibQUAL+® standard discipline categories. The chart maps percentage of respondents for each discipline in red. Population percentages for each discipline are mapped in blue. The table shows the number and percentage for each discipline, for the general population (N) and for survey respondents (n). *Note: Participating institutions were not required to complete the Representativeness section. When population data is missing or incomplete, it is because this data was not provided. Unified
0%2%4%6%8%
10%12%14%16%18%20%
Agricu
lture
/ Env
ironm
ental
Stud
ies
Archite
cture
Busine
ss
Commun
icatio
ns / J
ourna
lism
Educa
tion
Engine
ering
/ Com
puter
Scienc
e
Genera
l Stud
ies
Health
Scienc
es
Human
ities
Law
Military
/ Nav
al Scie
nce
Other
Perform
ing & Fine
Arts
Scienc
e / M
ath
Social
Scienc
es / P
sych
ology
Undec
ided
Discipline
Per
cent
age
Population Profile by DisciplineRespondent Profile by Discipline
Discipline Population (N) Population
% Respondents
(n) Respondents
% N%-n%
Agriculture / Environmental Studies
4,184 3.10% 285 3.45% -0.35%
Architecture 1,389 1.03% 80 0.97% 0.06% Business 16,597 12.28% 610 7.38% 4.90% Communications / Journalism 1,832 1.36% 93 1.12% 0.23% Education 15,786 11.68% 678 8.20% 3.48% Engineering / Computer Science 19,550 14.46% 1,497 18.10% -3.64% General Studies 1,169 0.86% 101 1.22% -0.36% Health Sciences 19,566 14.48% 787 9.52% 4.96% Humanities 15,164 11.22% 1,023 12.37% -1.15% Law 2,260 1.67% 135 1.63% 0.04% Military / Naval Science 48 0.04% 22 0.27% -0.23% Other 3,216 2.38% 335 4.05% -1.67%

Revised 9/17/07
108
Discipline Population (N) Population %
Respondents (n)
Respondents %
N%-n%
Performing & Fine Arts 2,471 1.83% 187 2.26% -0.43% Science / Math 15,414 11.40% 1,057 12.78% -1.38% Social Sciences / Psychology 13,776 10.19% 1,230 14.87% -4.68% Undecided 2,740 2.03% 149 1.80% 0.23%
Grand Total 135,162 100.00% 8,269 100.00% 0.00% American English
0%2%4%6%8%
10%12%14%16%18%
Agricu
lture
/ Env
ironm
ental
Stud
ies
Archite
cture
Busine
ss
Commun
icatio
ns / J
ourna
lism
Educa
tion
Engine
ering
/ Com
puter
Scienc
e
Genera
l Stud
ies
Health
Scienc
es
Human
ities
Law
Military
/ Nav
al Scie
nce
Other
Perform
ing & Fine
Arts
Scienc
e / M
ath
Social
Scienc
es / P
sych
ology
Undec
ided
Discipline
Per
cent
age
Population Profile by DisciplineRespondent Profile by Discipline
Discipline Population
(N) Population
% Respondents
(n) Respondents
% N%-n%
Agriculture / Environmental Studies 3,065 3.65% 227 4.23% -0.58% Architecture 967 1.15% 53 0.99% 0.16% Business 8,521 10.14% 288 5.37% 4.78% Communications / Journalism 364 0.43% 3 0.06% 0.38% Education 8,999 10.71% 424 7.90% 2.81% Engineering / Computer Science 13,142 15.64% 700 13.04% 2.60% General Studies 219 0.26% 44 0.82% -0.56% Health Sciences 12,831 15.27% 618 11.51% 3.76% Humanities 9,304 11.07% 741 13.81% -2.73% Law 785 0.93% 61 1.14% -0.20% Military / Naval Science 48 0.06% 7 0.13% -0.07% Other 2,055 2.45% 257 4.79% -2.34% Performing & Fine Arts 1,323 1.57% 112 2.09% -0.51% Science / Math 10,344 12.31% 857 15.97% -3.66% Social Sciences / Psychology 9,372 11.15% 844 15.73% -4.57% Undecided 2,682 3.19% 131 2.44% 0.75%
Grand Total 84,021 100.00% 5,367 100.00% 0.00%

Revised 9/17/07
109
Canadian French
0%
5%
10%
15%
20%
25%
30%
Agricu
lture
/ Env
ironm
ental
Stud
ies
Archite
cture
Busine
ss
Commun
icatio
ns / J
ourna
lism
Educa
tion
Engine
ering
/ Com
puter
Scienc
e
Genera
l Stud
ies
Health
Scienc
es
Human
ities
Law
Military
/ Nav
al Scie
nce
Other
Perform
ing & Fine
Arts
Scienc
e / M
ath
Social
Scienc
es / P
sych
ology
Undec
ided
Discipline
Perc
enta
ge
Population Profile by DisciplineRespondent Profile by Discipline
Discipline Population
(N) Population
% Respondents
(n) Respondents
% N%-n%
Agriculture / Environmental Studies 1,119 2.19% 58 2.00% 0.19% Architecture 422 0.83% 27 0.93% -0.11% Business 8,076 15.79% 322 11.10% 4.70% Communications / Journalism 1,468 2.87% 90 3.10% -0.23% Education 6,787 13.27% 254 8.75% 4.52% Engineering / Computer Science 6,408 12.53% 797 27.46% -14.93% General Studies 950 1.86% 57 1.96% -0.11% Health Sciences 6,735 13.17% 169 5.82% 7.35% Humanities 5,860 11.46% 282 9.72% 1.74% Law 1,475 2.88% 74 2.55% 0.33% Military / Naval Science - 0.00% 15 0.52% -0.52% Other 1,161 2.27% 78 2.69% -0.42% Performing & Fine Arts 1,148 2.24% 75 2.58% -0.34% Science / Math 5,070 9.91% 200 6.89% 3.02% Social Sciences / Psychology 4,404 8.61% 386 13.30% -4.69% Undecided 58 0.11% 18 0.62% -0.51%
Grand Table 51,141 100.00% 2,902 100.00% 0.00%
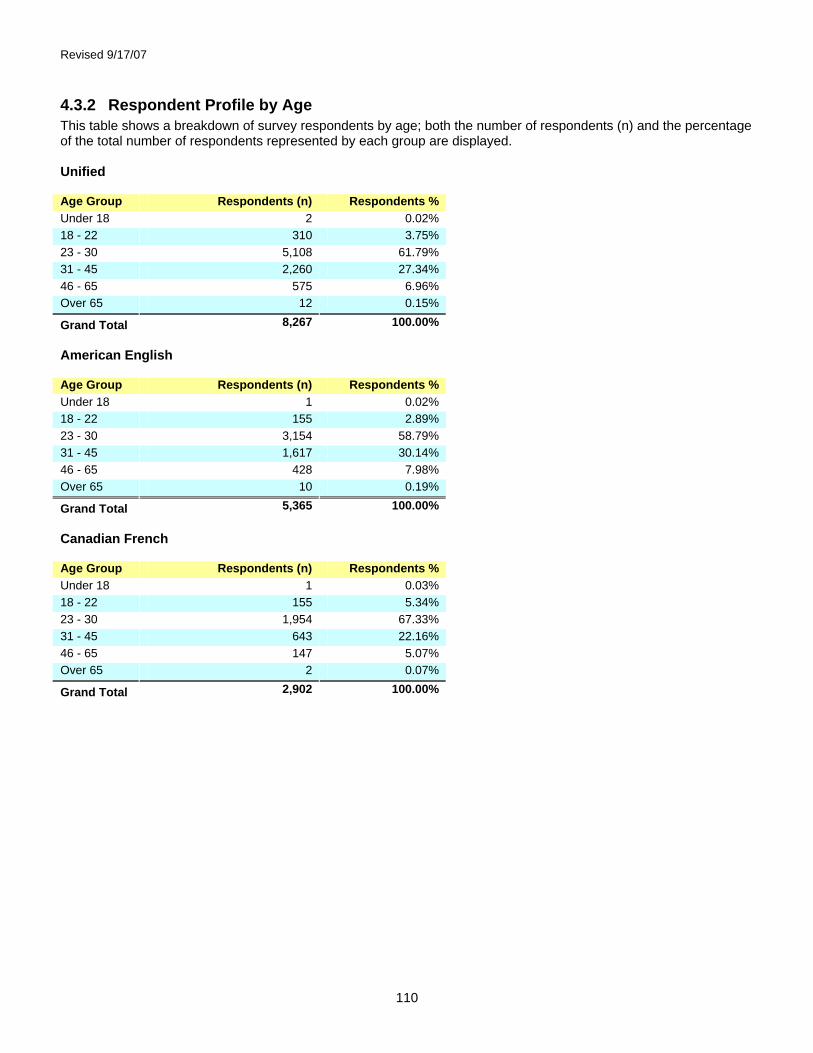
Revised 9/17/07
110
4.3.2 Respondent Profile by Age This table shows a breakdown of survey respondents by age; both the number of respondents (n) and the percentage of the total number of respondents represented by each group are displayed. Unified Age Group Respondents (n) Respondents % Under 18 2 0.02% 18 - 22 310 3.75% 23 - 30 5,108 61.79% 31 - 45 2,260 27.34% 46 - 65 575 6.96% Over 65 12 0.15%
Grand Total 8,267 100.00% American English Age Group Respondents (n) Respondents % Under 18 1 0.02% 18 - 22 155 2.89% 23 - 30 3,154 58.79% 31 - 45 1,617 30.14% 46 - 65 428 7.98% Over 65 10 0.19%
Grand Total 5,365 100.00% Canadian French Age Group Respondents (n) Respondents % Under 18 1 0.03% 18 - 22 155 5.34% 23 - 30 1,954 67.33% 31 - 45 643 22.16% 46 - 65 147 5.07% Over 65 2 0.07%
Grand Total 2,902 100.00%
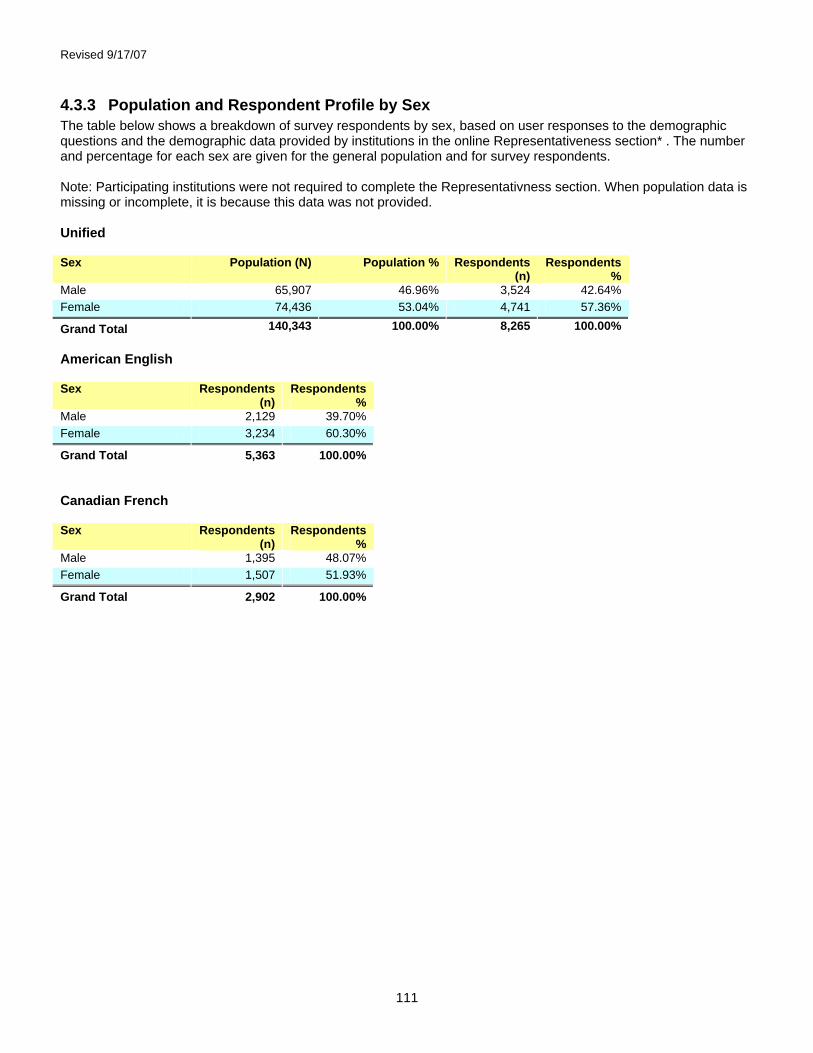
Revised 9/17/07
111
4.3.3 Population and Respondent Profile by Sex The table below shows a breakdown of survey respondents by sex, based on user responses to the demographic questions and the demographic data provided by institutions in the online Representativeness section* . The number and percentage for each sex are given for the general population and for survey respondents. Note: Participating institutions were not required to complete the Representativness section. When population data is missing or incomplete, it is because this data was not provided. Unified Sex Population (N) Population % Respondents
(n) Respondents
% Male 65,907 46.96% 3,524 42.64% Female 74,436 53.04% 4,741 57.36%
Grand Total 140,343 100.00% 8,265 100.00% American English Sex Respondents
(n) Respondents
% Male 2,129 39.70% Female 3,234 60.30%
Grand Total 5,363 100.00% Canadian French Sex Respondents
(n) Respondents
% Male 1,395 48.07% Female 1,507 51.93%
Grand Total 2,902 100.00%
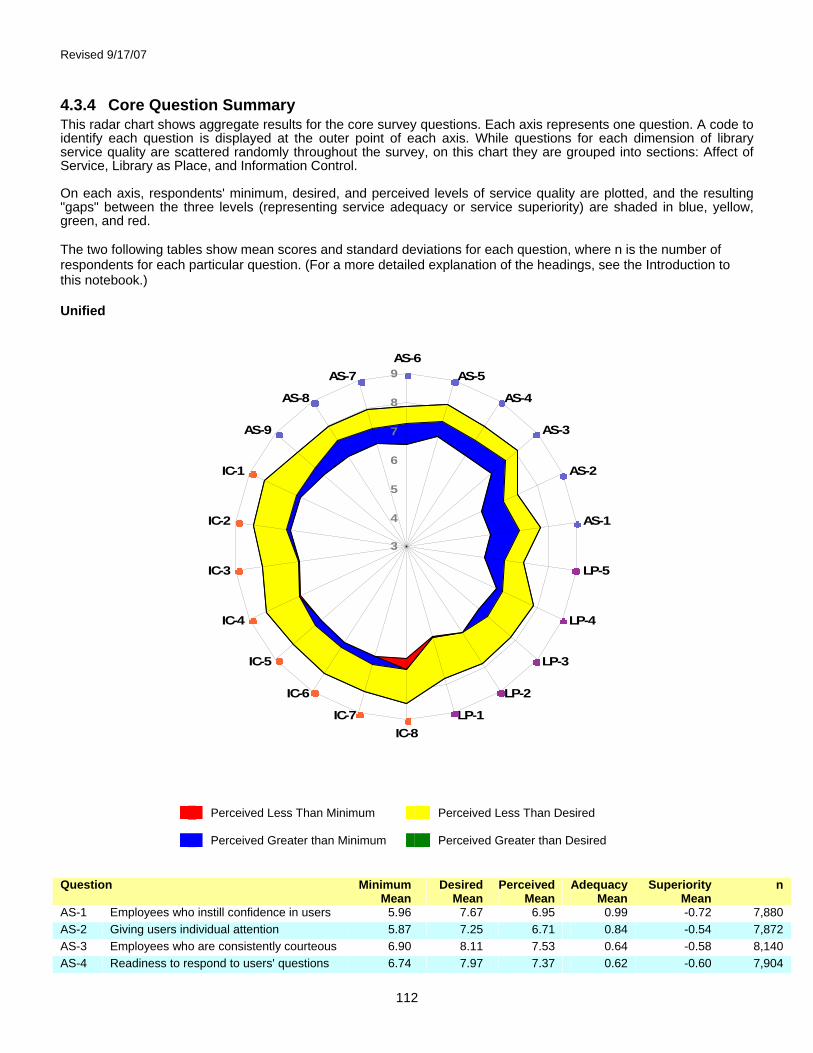
Revised 9/17/07
112
4.3.4 Core Question Summary This radar chart shows aggregate results for the core survey questions. Each axis represents one question. A code to identify each question is displayed at the outer point of each axis. While questions for each dimension of library service quality are scattered randomly throughout the survey, on this chart they are grouped into sections: Affect of Service, Library as Place, and Information Control. On each axis, respondents' minimum, desired, and perceived levels of service quality are plotted, and the resulting "gaps" between the three levels (representing service adequacy or service superiority) are shaded in blue, yellow, green, and red. The two following tables show mean scores and standard deviations for each question, where n is the number of respondents for each particular question. (For a more detailed explanation of the headings, see the Introduction to this notebook.) Unified
Perceived Less Than Minimum Perceived Less Than Desired Perceived Greater than Minimum Perceived Greater than Desired
Question Minimum
Mean Desired
Mean Perceived
Mean Adequacy
Mean Superiority
Mean n
AS-1 Employees who instill confidence in users 5.96 7.67 6.95 0.99 -0.72 7,880 AS-2 Giving users individual attention 5.87 7.25 6.71 0.84 -0.54 7,872 AS-3 Employees who are consistently courteous 6.90 8.11 7.53 0.64 -0.58 8,140 AS-4 Readiness to respond to users' questions 6.74 7.97 7.37 0.62 -0.60 7,904
3
4
5
6
7
8
9AS-6
AS-5
AS-4
AS-3
AS-2
AS-1
LP-5
LP-4
LP-3
LP-2
LP-1IC-8
IC-7
IC-6
IC-5
IC-4
IC-3
IC-2
IC-1
AS-9
AS-8
AS-7

Revised 9/17/07
113
Question Minimum Mean
Desired Mean
Perceived Mean
Adequacy Mean
Superiority Mean
n
AS-5 Employees who have the knowledge to answer user questions
6.95 8.15 7.49 0.54 -0.65 7,931
AS-6 Employees who deal with users in a caring fashion
6.54 7.85 7.27 0.73 -0.59 7,919
AS-7 Employees who understand the needs of their users
6.70 7.94 7.27 0.57 -0.67 7,812
AS-8 Willingness to help users 6.71 7.97 7.37 0.66 -0.60 7,895 AS-9 Dependability in handling users' service
problems 6.77 7.99 7.19 0.42 -0.80 6,625
IC-1 Making electronic resources accessible from my home or office
7.06 8.45 7.21 0.15 -1.24 8,171
IC-2 A library Web site enabling me to locate information on my own
7.07 8.33 7.18 0.11 -1.14 8,219
IC-3 The printed library materials I need for my work
6.73 8.01 6.77 0.03 -1.25 7,469
IC-4 The electronic information resources I need
7.08 8.36 7.06 -0.02 -1.30 8,158
IC-5 Modern equipment that lets me easily access needed information
6.92 8.19 7.20 0.28 -0.99 8,014
IC-6 Easy-to-use access tools that allow me to find things on my own
6.96 8.24 7.17 0.21 -1.07 8,110
IC-7 Making information easily accessible for independent use
6.97 8.25 7.26 0.29 -0.99 8,056
IC-8 Print and/or electronic journal collections I require for my work
7.26 8.46 6.89 -0.37 -1.58 7,991
LP-1 Library space that inspires study and learning
6.28 7.77 6.27 -0.02 -1.50 7,844
LP-2 Quiet space for individual activities 6.55 7.83 6.55 0.00 -1.27 7,712 LP-3 A comfortable and inviting location 6.34 7.80 6.69 0.36 -1.10 7,964 LP-4 A getaway for study, learning, or research 6.45 7.86 6.67 0.23 -1.19 7,715 LP-5 Community space for group learning and
group study 5.73 7.08 6.42 0.69 -0.66 6,714
Grand Total
6.66 7.98 7.02 0.36 -0.96 7,823
Question Minimum
SD Desired
SD Perceived
SD Adequacy
SD Superiority
SD n
AS-1 Employees who instill confidence in users 1.67 1.36 1.53 1.78 1.60 7,880 AS-2 Giving users individual attention 1.83 1.61 1.64 1.76 1.64 7,872 AS-3 Employees who are consistently courteous 1.62 1.17 1.48 1.82 1.56 8,140 AS-4 Readiness to respond to users' questions 1.54 1.20 1.43 1.69 1.49 7,904 AS-5 Employees who have the knowledge to
answer user questions 1.51 1.11 1.36 1.66 1.43 7,931
AS-6 Employees who deal with users in a caring fashion
1.62 1.27 1.44 1.74 1.53 7,919
AS-7 Employees who understand the needs of their users
1.55 1.21 1.40 1.68 1.48 7,812
AS-8 Willingness to help users 1.58 1.22 1.43 1.70 1.48 7,895 AS-9 Dependability in handling users' service
problems 1.54 1.20 1.49 1.74 1.57 6,625
IC-1 Making electronic resources accessible from my home or office
1.58 1.03 1.60 2.00 1.72 8,171
IC-2 A library Web site enabling me to locate information on my own
1.52 1.07 1.51 1.85 1.60 8,219
IC-3 The printed library materials I need for my work
1.62 1.31 1.58 1.96 1.80 7,469
IC-4 The electronic information resources I need
1.46 1.02 1.43 1.85 1.59 8,158

Revised 9/17/07
114
Question Minimum SD
Desired SD
Perceived SD
Adequacy SD
Superiority SD
n
IC-5 Modern equipment that lets me easily access needed information
1.48 1.09 1.41 1.76 1.55 8,014
IC-6 Easy-to-use access tools that allow me to find things on my own
1.46 1.06 1.37 1.75 1.50 8,110
IC-7 Making information easily accessible for independent use
1.43 1.03 1.34 1.69 1.44 8,056
IC-8 Print and/or electronic journal collections I require for my work
1.46 1.01 1.59 2.02 1.75 7,991
LP-1 Library space that inspires study and learning
1.77 1.52 1.87 2.34 2.26 7,844
LP-2 Quiet space for individual activities 1.80 1.53 1.85 2.38 2.23 7,712 LP-3 A comfortable and inviting location 1.70 1.37 1.73 2.16 2.00 7,964 LP-4 A getaway for study, learning, or research 1.74 1.43 1.67 2.10 1.94 7,715 LP-5 Community space for group learning and
group study 2.04 1.92 1.75 2.32 2.25 6,714
Grand Total
1.61 1.26 1.54 1.90 1.70 7,823
American English
Perceived Less Than Minimum Perceived Less Than Desired Perceived Greater than Minimum Perceived Greater than Desired
Question Minimum
Mean Desired
Mean Perceived
Mean Adequacy
Mean Superiority
Mean n
AS-1 Employees who instill confidence in users 5.88 7.63 6.76 0.88 -0.87 5,020 AS-2 Giving users individual attention 5.90 7.26 6.72 0.82 -0.54 5,089 AS-3 Employees who are consistently courteous 6.86 8.10 7.43 0.57 -0.67 5,262

Revised 9/17/07
115
Question Minimum Mean
Desired Mean
Perceived Mean
Adequacy Mean
Superiority Mean
n
AS-4 Readiness to respond to users' questions 6.81 8.03 7.37 0.56 -0.66 5,143 AS-5 Employees who have the knowledge to
answer user questions 6.91 8.12 7.36 0.45 -0.76 5,113
AS-6 Employees who deal with users in a caring fashion
6.52 7.83 7.21 0.69 -0.62 5,108
AS-7 Employees who understand the needs of their users
6.73 7.94 7.22 0.49 -0.73 5,049
AS-8 Willingness to help users 6.78 8.02 7.41 0.63 -0.61 5,095 AS-9 Dependability in handling users' service
problems 6.78 8.00 7.13 0.35 -0.86 4,372
IC-1 Making electronic resources accessible from my home or office
7.19 8.56 7.22 0.03 -1.34 5,320
IC-2 A library Web site enabling me to locate information on my own
7.17 8.40 7.16 -0.01 -1.24 5,335
IC-3 The printed library materials I need for my work
6.74 8.04 6.71 -0.03 -1.33 4,972
IC-4 The electronic information resources I need
7.21 8.47 7.02 -0.19 -1.45 5,327
IC-5 Modern equipment that lets me easily access needed information
6.98 8.23 7.17 0.19 -1.06 5,154
IC-6 Easy-to-use access tools that allow me to find things on my own
7.03 8.29 7.16 0.13 -1.14 5,247
IC-7 Making information easily accessible for independent use
7.04 8.30 7.24 0.20 -1.06 5,196
IC-8 Print and/or electronic journal collections I require for my work
7.38 8.54 6.89 -0.49 -1.65 5,224
LP-1 Library space that inspires study and learning
6.16 7.69 6.08 -0.08 -1.61 5,055
LP-2 Quiet space for individual activities 6.41 7.70 6.31 -0.09 -1.38 4,931 LP-3 A comfortable and inviting location 6.31 7.76 6.72 0.41 -1.04 5,129 LP-4 A getaway for study, learning, or research 6.42 7.83 6.63 0.21 -1.20 4,945 LP-5 Community space for group learning and
group study 5.53 6.84 6.37 0.84 -0.47 4,188
Grand Total
6.67 7.98 6.97 0.30 -1.01 5,058
Question Minimum
SD Desired
SD Perceived
SD Adequacy
SD Superiority
SD n
AS-1 Employees who instill confidence in users 1.74 1.45 1.60 1.82 1.68 5,020 AS-2 Giving users individual attention 1.87 1.66 1.66 1.78 1.68 5,089 AS-3 Employees who are consistently courteous 1.69 1.22 1.54 1.89 1.63 5,262 AS-4 Readiness to respond to users' questions 1.59 1.22 1.45 1.70 1.48 5,143 AS-5 Employees who have the knowledge to
answer user questions 1.59 1.18 1.42 1.71 1.48 5,113
AS-6 Employees who deal with users in a caring fashion
1.73 1.35 1.50 1.82 1.60 5,108
AS-7 Employees who understand the needs of their users
1.61 1.25 1.43 1.70 1.50 5,049
AS-8 Willingness to help users 1.62 1.23 1.40 1.70 1.45 5,095 AS-9 Dependability in handling users' service
problems 1.61 1.25 1.51 1.78 1.60 4,372
IC-1 Making electronic resources accessible from my home or office
1.60 1.00 1.60 1.97 1.68 5,320
IC-2 A library Web site enabling me to locate information on my own
1.56 1.07 1.53 1.86 1.60 5,335
IC-3 The printed library materials I need for my work
1.67 1.36 1.60 2.00 1.84 4,972

Revised 9/17/07
116
Question Minimum SD
Desired SD
Perceived SD
Adequacy SD
Superiority SD
n
IC-4 The electronic information resources I need
1.49 1.01 1.47 1.87 1.59 5,327
IC-5 Modern equipment that lets me easily access needed information
1.54 1.12 1.42 1.78 1.56 5,154
IC-6 Easy-to-use access tools that allow me to find things on my own
1.49 1.08 1.39 1.75 1.50 5,247
IC-7 Making information easily accessible for independent use
1.48 1.04 1.36 1.71 1.45 5,196
IC-8 Print and/or electronic journal collections I require for my work
1.48 1.00 1.60 2.03 1.73 5,224
LP-1 Library space that inspires study and learning
1.88 1.65 1.89 2.44 2.38 5,055
LP-2 Quiet space for individual activities 1.93 1.68 1.90 2.53 2.39 4,931 LP-3 A comfortable and inviting location 1.80 1.46 1.70 2.15 1.99 5,129 LP-4 A getaway for study, learning, or research 1.85 1.53 1.68 2.14 1.98 4,945 LP-5 Community space for group learning and
group study 2.18 2.08 1.74 2.40 2.37 4,188
Grand Total
1.68 1.31 1.56 1.93 1.74 5,058
Canadian French
Perceived Less Than Minimum Perceived Less Than Desired Perceived Greater than Minimum Perceived Greater than Desired
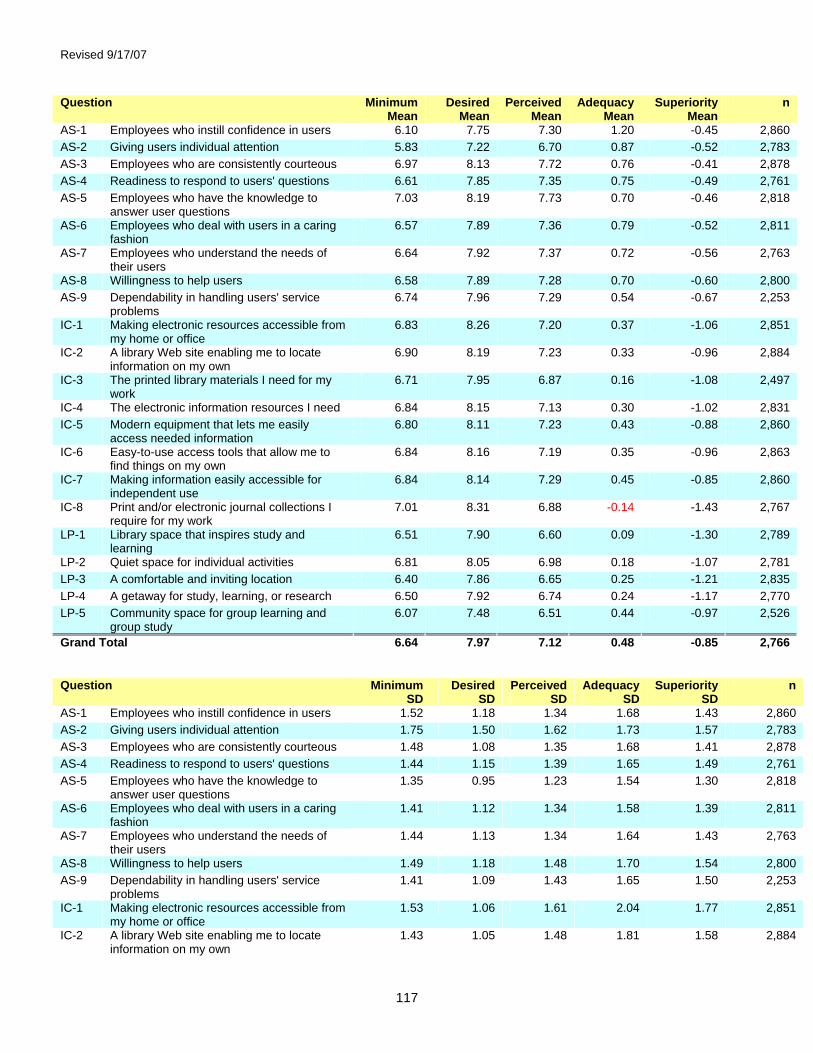
Revised 9/17/07
117
Question Minimum Mean
Desired Mean
Perceived Mean
Adequacy Mean
Superiority Mean
n
AS-1 Employees who instill confidence in users 6.10 7.75 7.30 1.20 -0.45 2,860 AS-2 Giving users individual attention 5.83 7.22 6.70 0.87 -0.52 2,783 AS-3 Employees who are consistently courteous 6.97 8.13 7.72 0.76 -0.41 2,878 AS-4 Readiness to respond to users' questions 6.61 7.85 7.35 0.75 -0.49 2,761 AS-5 Employees who have the knowledge to
answer user questions 7.03 8.19 7.73 0.70 -0.46 2,818
AS-6 Employees who deal with users in a caring fashion
6.57 7.89 7.36 0.79 -0.52 2,811
AS-7 Employees who understand the needs of their users
6.64 7.92 7.37 0.72 -0.56 2,763
AS-8 Willingness to help users 6.58 7.89 7.28 0.70 -0.60 2,800 AS-9 Dependability in handling users' service
problems 6.74 7.96 7.29 0.54 -0.67 2,253
IC-1 Making electronic resources accessible from my home or office
6.83 8.26 7.20 0.37 -1.06 2,851
IC-2 A library Web site enabling me to locate information on my own
6.90 8.19 7.23 0.33 -0.96 2,884
IC-3 The printed library materials I need for my work
6.71 7.95 6.87 0.16 -1.08 2,497
IC-4 The electronic information resources I need 6.84 8.15 7.13 0.30 -1.02 2,831 IC-5 Modern equipment that lets me easily
access needed information 6.80 8.11 7.23 0.43 -0.88 2,860
IC-6 Easy-to-use access tools that allow me to find things on my own
6.84 8.16 7.19 0.35 -0.96 2,863
IC-7 Making information easily accessible for independent use
6.84 8.14 7.29 0.45 -0.85 2,860
IC-8 Print and/or electronic journal collections I require for my work
7.01 8.31 6.88 -0.14 -1.43 2,767
LP-1 Library space that inspires study and learning
6.51 7.90 6.60 0.09 -1.30 2,789
LP-2 Quiet space for individual activities 6.81 8.05 6.98 0.18 -1.07 2,781 LP-3 A comfortable and inviting location 6.40 7.86 6.65 0.25 -1.21 2,835 LP-4 A getaway for study, learning, or research 6.50 7.92 6.74 0.24 -1.17 2,770 LP-5 Community space for group learning and
group study 6.07 7.48 6.51 0.44 -0.97 2,526
Grand Total
6.64 7.97 7.12 0.48 -0.85 2,766
Question Minimum
SD Desired
SD Perceived
SD Adequacy
SD Superiority
SD n
AS-1 Employees who instill confidence in users 1.52 1.18 1.34 1.68 1.43 2,860 AS-2 Giving users individual attention 1.75 1.50 1.62 1.73 1.57 2,783 AS-3 Employees who are consistently courteous 1.48 1.08 1.35 1.68 1.41 2,878 AS-4 Readiness to respond to users' questions 1.44 1.15 1.39 1.65 1.49 2,761 AS-5 Employees who have the knowledge to
answer user questions 1.35 0.95 1.23 1.54 1.30 2,818
AS-6 Employees who deal with users in a caring fashion
1.41 1.12 1.34 1.58 1.39 2,811
AS-7 Employees who understand the needs of their users
1.44 1.13 1.34 1.64 1.43 2,763
AS-8 Willingness to help users 1.49 1.18 1.48 1.70 1.54 2,800 AS-9 Dependability in handling users' service
problems 1.41 1.09 1.43 1.65 1.50 2,253
IC-1 Making electronic resources accessible from my home or office
1.53 1.06 1.61 2.04 1.77 2,851
IC-2 A library Web site enabling me to locate information on my own
1.43 1.05 1.48 1.81 1.58 2,884

Revised 9/17/07
118
Question Minimum SD
Desired SD
Perceived SD
Adequacy SD
Superiority SD
n
IC-3 The printed library materials I need for my work
1.50 1.20 1.53 1.86 1.69 2,497
IC-4 The electronic information resources I need 1.37 1.01 1.36 1.74 1.54 2,831 IC-5 Modern equipment that lets me easily access
needed information 1.35 1.02 1.40 1.71 1.53 2,860
IC-6 Easy-to-use access tools that allow me to find things on my own
1.37 1.02 1.35 1.73 1.51 2,863
IC-7 Making information easily accessible for independent use
1.34 1.00 1.30 1.65 1.43 2,860
IC-8 Print and/or electronic journal collections I require for my work
1.39 1.00 1.57 1.98 1.77 2,767
LP-1 Library space that inspires study and learning 1.52 1.24 1.79 2.13 1.98 2,789 LP-2 Quiet space for individual activities 1.52 1.16 1.67 2.09 1.88 2,781 LP-3 A comfortable and inviting location 1.52 1.18 1.80 2.16 2.00 2,835 LP-4 A getaway for study, learning, or research 1.54 1.24 1.65 2.02 1.88 2,770 LP-5 Community space for group learning and
group study 1.75 1.52 1.75 2.14 2.02 2,526
Grand Total
1.47 1.14 1.49 1.81 1.62 2,766
4.3.5 Core Question Dimension Summary On the chart below, scores for each dimension of library service quality have been plotted graphically. The exterior bars represent the range of minimum to desired mean scores for each dimension. The interior bars represent the range of minimum to perceived mean scores (the service adequacy gap) for each dimension of library service quality. Unified

Revised 9/17/07
119
This table shows mean standard deviations for each of the local questions added by the individual library or consortium, where n is the number of respondents for each particular question. (For a more detailed explanation of the headings, see the Introduction to this notebook.)
American English

Revised 9/17/07
120
This table shows mean standard deviations for each of the local questions added by the individual library or consortium, where n is the number of respondents for each particular question. (For a more detailed explanation of the headings, see the Introduction to this notebook.)
Canadian French

Revised 9/17/07
121
This table shows mean standard deviations for each of the local questions added by the individual library or consortium, where n is the number of respondents for each particular question. (For a more detailed explanation of the headings, see the Introduction to this notebook.)
4.3.6 Local Questions Summary These tables show mean scores and standard deviations for each of the local questions added by the individual library or consortium, where n is the number of respondents for each particular question. (For a more detailed explanation of the headings, see the Introduction to this notebook.) Unified Question Minimum
Mean Desired
Mean Perceived
Mean Adequacy
Mean Superiority
Mean n
A library environment that is hospitable and conducive to finding and using information
6.98 8.02 7.15 0.17 -0.87 167
A secure and safe place 7.04 8.12 7.49 0.45 -0.63 429 Ability to navigate library Web pages easily 6.97 8.28 7.01 0.04 -1.27 5,233 Access to equipment that is not readily available in my department, e.g., scanners, CD burners, PDAs, syncing stations
5.99 7.29 6.34 0.35 -0.95 649
Access to photocopying and printing facilities 6.81 7.92 6.61 -0.21 -1.31 203 Access to rare and historical materials 5.88 7.07 6.64 0.76 -0.42 153 Adequate hours of service 6.92 8.13 7.43 0.51 -0.69 4,096 Assuring users of the accuracy and confidentiality of their transactions
7.29 8.27 8.03 0.74 -0.24 131
Availability of subject specialist assistance 5.71 7.30 6.29 0.58 -1.01 561 Comprehensive collections of fulltext articles online
7.13 8.44 6.67 -0.46 -1.77 236
Convenient business hours 6.80 8.03 7.38 0.59 -0.64 1,152 Convenient service hours 6.81 8.00 7.75 0.95 -0.25 57
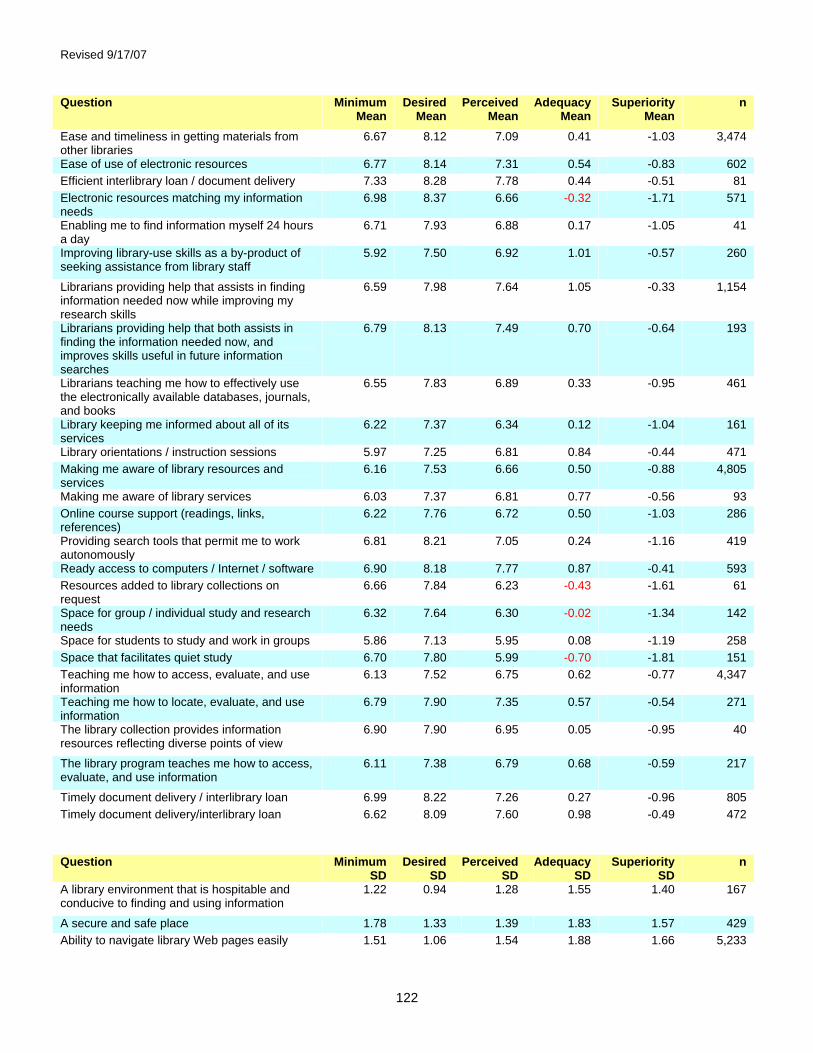
Revised 9/17/07
122
Question Minimum Mean
Desired Mean
Perceived Mean
Adequacy Mean
Superiority Mean
n
Ease and timeliness in getting materials from other libraries
6.67 8.12 7.09 0.41 -1.03 3,474
Ease of use of electronic resources 6.77 8.14 7.31 0.54 -0.83 602 Efficient interlibrary loan / document delivery 7.33 8.28 7.78 0.44 -0.51 81 Electronic resources matching my information needs
6.98 8.37 6.66 -0.32 -1.71 571
Enabling me to find information myself 24 hours a day
6.71 7.93 6.88 0.17 -1.05 41
Improving library-use skills as a by-product of seeking assistance from library staff
5.92 7.50 6.92 1.01 -0.57 260
Librarians providing help that assists in finding information needed now while improving my research skills
6.59 7.98 7.64 1.05 -0.33 1,154
Librarians providing help that both assists in finding the information needed now, and improves skills useful in future information searches
6.79 8.13 7.49 0.70 -0.64 193
Librarians teaching me how to effectively use the electronically available databases, journals, and books
6.55 7.83 6.89 0.33 -0.95 461
Library keeping me informed about all of its services
6.22 7.37 6.34 0.12 -1.04 161
Library orientations / instruction sessions 5.97 7.25 6.81 0.84 -0.44 471 Making me aware of library resources and services
6.16 7.53 6.66 0.50 -0.88 4,805
Making me aware of library services 6.03 7.37 6.81 0.77 -0.56 93 Online course support (readings, links, references)
6.22 7.76 6.72 0.50 -1.03 286
Providing search tools that permit me to work autonomously
6.81 8.21 7.05 0.24 -1.16 419
Ready access to computers / Internet / software 6.90 8.18 7.77 0.87 -0.41 593 Resources added to library collections on request
6.66 7.84 6.23 -0.43 -1.61 61
Space for group / individual study and research needs
6.32 7.64 6.30 -0.02 -1.34 142
Space for students to study and work in groups 5.86 7.13 5.95 0.08 -1.19 258 Space that facilitates quiet study 6.70 7.80 5.99 -0.70 -1.81 151 Teaching me how to access, evaluate, and use information
6.13 7.52 6.75 0.62 -0.77 4,347
Teaching me how to locate, evaluate, and use information
6.79 7.90 7.35 0.57 -0.54 271
The library collection provides information resources reflecting diverse points of view
6.90 7.90 6.95 0.05 -0.95 40
The library program teaches me how to access, evaluate, and use information
6.11 7.38 6.79 0.68 -0.59 217
Timely document delivery / interlibrary loan 6.99 8.22 7.26 0.27 -0.96 805 Timely document delivery/interlibrary loan 6.62 8.09 7.60 0.98 -0.49 472 Question Minimum
SD Desired
SD Perceived
SD Adequacy
SD Superiority
SD n
A library environment that is hospitable and conducive to finding and using information
1.22 0.94 1.28 1.55 1.40 167
A secure and safe place 1.78 1.33 1.39 1.83 1.57 429 Ability to navigate library Web pages easily 1.51 1.06 1.54 1.88 1.66 5,233
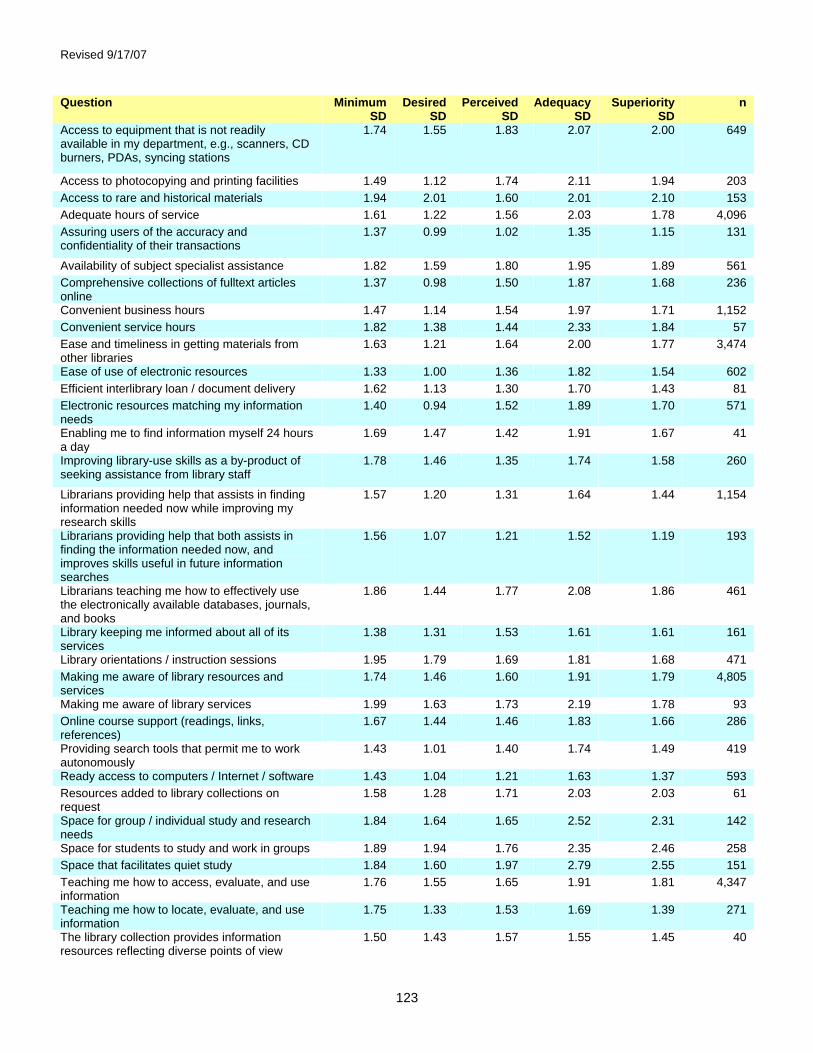
Revised 9/17/07
123
Question Minimum SD
Desired SD
Perceived SD
Adequacy SD
Superiority SD
n
Access to equipment that is not readily available in my department, e.g., scanners, CD burners, PDAs, syncing stations
1.74 1.55 1.83 2.07 2.00 649
Access to photocopying and printing facilities 1.49 1.12 1.74 2.11 1.94 203 Access to rare and historical materials 1.94 2.01 1.60 2.01 2.10 153 Adequate hours of service 1.61 1.22 1.56 2.03 1.78 4,096 Assuring users of the accuracy and confidentiality of their transactions
1.37 0.99 1.02 1.35 1.15 131
Availability of subject specialist assistance 1.82 1.59 1.80 1.95 1.89 561 Comprehensive collections of fulltext articles online
1.37 0.98 1.50 1.87 1.68 236
Convenient business hours 1.47 1.14 1.54 1.97 1.71 1,152 Convenient service hours 1.82 1.38 1.44 2.33 1.84 57 Ease and timeliness in getting materials from other libraries
1.63 1.21 1.64 2.00 1.77 3,474
Ease of use of electronic resources 1.33 1.00 1.36 1.82 1.54 602 Efficient interlibrary loan / document delivery 1.62 1.13 1.30 1.70 1.43 81 Electronic resources matching my information needs
1.40 0.94 1.52 1.89 1.70 571
Enabling me to find information myself 24 hours a day
1.69 1.47 1.42 1.91 1.67 41
Improving library-use skills as a by-product of seeking assistance from library staff
1.78 1.46 1.35 1.74 1.58 260
Librarians providing help that assists in finding information needed now while improving my research skills
1.57 1.20 1.31 1.64 1.44 1,154
Librarians providing help that both assists in finding the information needed now, and improves skills useful in future information searches
1.56 1.07 1.21 1.52 1.19 193
Librarians teaching me how to effectively use the electronically available databases, journals, and books
1.86 1.44 1.77 2.08 1.86 461
Library keeping me informed about all of its services
1.38 1.31 1.53 1.61 1.61 161
Library orientations / instruction sessions 1.95 1.79 1.69 1.81 1.68 471 Making me aware of library resources and services
1.74 1.46 1.60 1.91 1.79 4,805
Making me aware of library services 1.99 1.63 1.73 2.19 1.78 93 Online course support (readings, links, references)
1.67 1.44 1.46 1.83 1.66 286
Providing search tools that permit me to work autonomously
1.43 1.01 1.40 1.74 1.49 419
Ready access to computers / Internet / software 1.43 1.04 1.21 1.63 1.37 593 Resources added to library collections on request
1.58 1.28 1.71 2.03 2.03 61
Space for group / individual study and research needs
1.84 1.64 1.65 2.52 2.31 142
Space for students to study and work in groups 1.89 1.94 1.76 2.35 2.46 258 Space that facilitates quiet study 1.84 1.60 1.97 2.79 2.55 151 Teaching me how to access, evaluate, and use information
1.76 1.55 1.65 1.91 1.81 4,347
Teaching me how to locate, evaluate, and use information
1.75 1.33 1.53 1.69 1.39 271
The library collection provides information resources reflecting diverse points of view
1.50 1.43 1.57 1.55 1.45 40
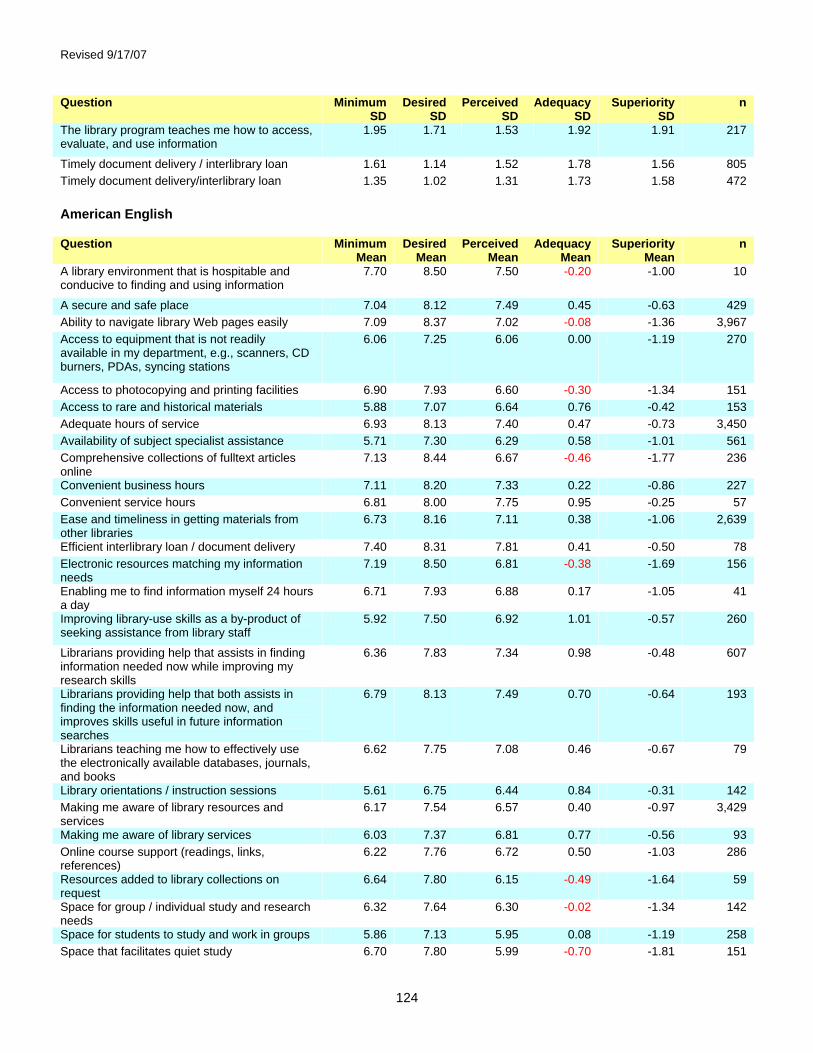
Revised 9/17/07
124
Question Minimum SD
Desired SD
Perceived SD
Adequacy SD
Superiority SD
n
The library program teaches me how to access, evaluate, and use information
1.95 1.71 1.53 1.92 1.91 217
Timely document delivery / interlibrary loan 1.61 1.14 1.52 1.78 1.56 805 Timely document delivery/interlibrary loan 1.35 1.02 1.31 1.73 1.58 472 American English Question Minimum
Mean Desired
Mean Perceived
Mean Adequacy
Mean Superiority
Mean n
A library environment that is hospitable and conducive to finding and using information
7.70 8.50 7.50 -0.20 -1.00 10
A secure and safe place 7.04 8.12 7.49 0.45 -0.63 429 Ability to navigate library Web pages easily 7.09 8.37 7.02 -0.08 -1.36 3,967 Access to equipment that is not readily available in my department, e.g., scanners, CD burners, PDAs, syncing stations
6.06 7.25 6.06 0.00 -1.19 270
Access to photocopying and printing facilities 6.90 7.93 6.60 -0.30 -1.34 151 Access to rare and historical materials 5.88 7.07 6.64 0.76 -0.42 153 Adequate hours of service 6.93 8.13 7.40 0.47 -0.73 3,450 Availability of subject specialist assistance 5.71 7.30 6.29 0.58 -1.01 561 Comprehensive collections of fulltext articles online
7.13 8.44 6.67 -0.46 -1.77 236
Convenient business hours 7.11 8.20 7.33 0.22 -0.86 227 Convenient service hours 6.81 8.00 7.75 0.95 -0.25 57 Ease and timeliness in getting materials from other libraries
6.73 8.16 7.11 0.38 -1.06 2,639
Efficient interlibrary loan / document delivery 7.40 8.31 7.81 0.41 -0.50 78 Electronic resources matching my information needs
7.19 8.50 6.81 -0.38 -1.69 156
Enabling me to find information myself 24 hours a day
6.71 7.93 6.88 0.17 -1.05 41
Improving library-use skills as a by-product of seeking assistance from library staff
5.92 7.50 6.92 1.01 -0.57 260
Librarians providing help that assists in finding information needed now while improving my research skills
6.36 7.83 7.34 0.98 -0.48 607
Librarians providing help that both assists in finding the information needed now, and improves skills useful in future information searches
6.79 8.13 7.49 0.70 -0.64 193
Librarians teaching me how to effectively use the electronically available databases, journals, and books
6.62 7.75 7.08 0.46 -0.67 79
Library orientations / instruction sessions 5.61 6.75 6.44 0.84 -0.31 142 Making me aware of library resources and services
6.17 7.54 6.57 0.40 -0.97 3,429
Making me aware of library services 6.03 7.37 6.81 0.77 -0.56 93 Online course support (readings, links, references)
6.22 7.76 6.72 0.50 -1.03 286
Resources added to library collections on request
6.64 7.80 6.15 -0.49 -1.64 59
Space for group / individual study and research needs
6.32 7.64 6.30 -0.02 -1.34 142
Space for students to study and work in groups 5.86 7.13 5.95 0.08 -1.19 258 Space that facilitates quiet study 6.70 7.80 5.99 -0.70 -1.81 151

Revised 9/17/07
125
Question Minimum Mean
Desired Mean
Perceived Mean
Adequacy Mean
Superiority Mean
n
Teaching me how to access, evaluate, and use information
6.08 7.44 6.72 0.64 -0.72 2,542
Teaching me how to locate, evaluate, and use information
6.79 7.90 7.35 0.57 -0.54 271
The library collection provides information resources reflecting diverse points of view
6.90 7.90 6.95 0.05 -0.95 40
Timely document delivery / interlibrary loan 7.10 8.31 7.25 0.15 -1.06 604 Question Minimum
SD Desired
SD Perceived
SD Adequacy
SD Superiority
SD n
A library environment that is hospitable and conducive to finding and using information
1.34 0.71 1.27 1.40 1.33 10
A secure and safe place 1.78 1.33 1.39 1.83 1.57 429 Ability to navigate library Web pages easily 1.52 1.02 1.56 1.91 1.67 3,967 Access to equipment that is not readily available in my department, e.g., scanners, CD burners, PDAs, syncing stations
1.94 1.87 1.99 2.23 2.21 270
Access to photocopying and printing facilities 1.45 1.07 1.82 2.14 1.97 151 Access to rare and historical materials 1.94 2.01 1.60 2.01 2.10 153 Adequate hours of service 1.66 1.24 1.59 2.07 1.82 3,450 Availability of subject specialist assistance 1.82 1.59 1.80 1.95 1.89 561 Comprehensive collections of fulltext articles online
1.37 0.98 1.50 1.87 1.68 236
Convenient business hours 1.53 1.18 1.44 1.91 1.65 227 Convenient service hours 1.82 1.38 1.44 2.33 1.84 57 Ease and timeliness in getting materials from other libraries
1.66 1.23 1.64 2.00 1.77 2,639
Efficient interlibrary loan / document delivery 1.61 1.12 1.28 1.71 1.42 78 Electronic resources matching my information needs
1.39 0.85 1.43 1.84 1.61 156
Enabling me to find information myself 24 hours a day
1.69 1.47 1.42 1.91 1.67 41
Improving library-use skills as a by-product of seeking assistance from library staff
1.78 1.46 1.35 1.74 1.58 260
Librarians providing help that assists in finding information needed now while improving my research skills
1.73 1.37 1.36 1.73 1.52 607
Librarians providing help that both assists in finding the information needed now, and improves skills useful in future information searches
1.56 1.07 1.21 1.52 1.19 193
Librarians teaching me how to effectively use the electronically available databases, journals, and books
2.18 1.85 1.97 2.26 1.95 79
Library orientations / instruction sessions 2.22 2.23 1.90 1.89 1.98 142 Making me aware of library resources and services
1.79 1.50 1.60 1.92 1.83 3,429
Making me aware of library services 1.99 1.63 1.73 2.19 1.78 93 Online course support (readings, links, references)
1.67 1.44 1.46 1.83 1.66 286
Resources added to library collections on request
1.59 1.28 1.68 2.03 2.05 59
Space for group / individual study and research needs
1.84 1.64 1.65 2.52 2.31 142
Space for students to study and work in groups 1.89 1.94 1.76 2.35 2.46 258 Space that facilitates quiet study 1.84 1.60 1.97 2.79 2.55 151
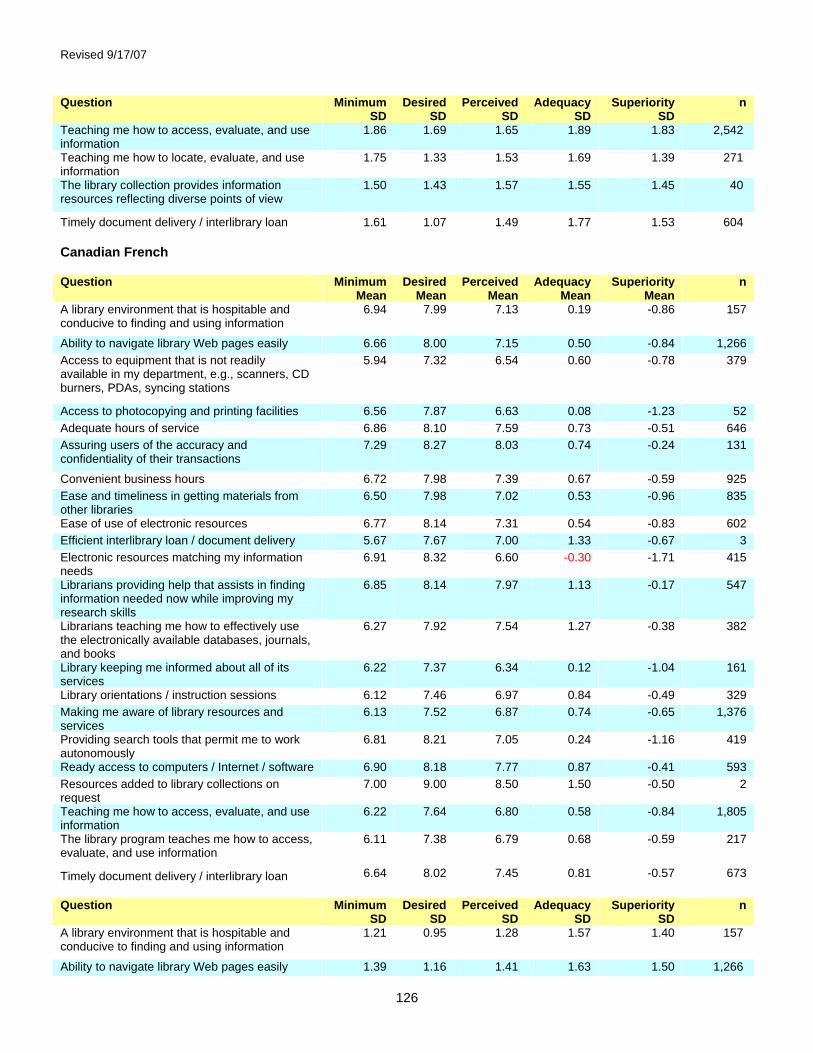
Revised 9/17/07
126
Question Minimum SD
Desired SD
Perceived SD
Adequacy SD
Superiority SD
n
Teaching me how to access, evaluate, and use information
1.86 1.69 1.65 1.89 1.83 2,542
Teaching me how to locate, evaluate, and use information
1.75 1.33 1.53 1.69 1.39 271
The library collection provides information resources reflecting diverse points of view
1.50 1.43 1.57 1.55 1.45 40
Timely document delivery / interlibrary loan 1.61 1.07 1.49 1.77 1.53 604 Canadian French Question Minimum
Mean Desired
Mean Perceived
Mean Adequacy
Mean Superiority
Mean n
A library environment that is hospitable and conducive to finding and using information
6.94 7.99 7.13 0.19 -0.86 157
Ability to navigate library Web pages easily 6.66 8.00 7.15 0.50 -0.84 1,266 Access to equipment that is not readily available in my department, e.g., scanners, CD burners, PDAs, syncing stations
5.94 7.32 6.54 0.60 -0.78 379
Access to photocopying and printing facilities 6.56 7.87 6.63 0.08 -1.23 52 Adequate hours of service 6.86 8.10 7.59 0.73 -0.51 646 Assuring users of the accuracy and confidentiality of their transactions
7.29 8.27 8.03 0.74 -0.24 131
Convenient business hours 6.72 7.98 7.39 0.67 -0.59 925 Ease and timeliness in getting materials from other libraries
6.50 7.98 7.02 0.53 -0.96 835
Ease of use of electronic resources 6.77 8.14 7.31 0.54 -0.83 602 Efficient interlibrary loan / document delivery 5.67 7.67 7.00 1.33 -0.67 3 Electronic resources matching my information needs
6.91 8.32 6.60 -0.30 -1.71 415
Librarians providing help that assists in finding information needed now while improving my research skills
6.85 8.14 7.97 1.13 -0.17 547
Librarians teaching me how to effectively use the electronically available databases, journals, and books
6.27 7.92 7.54 1.27 -0.38 382
Library keeping me informed about all of its services
6.22 7.37 6.34 0.12 -1.04 161
Library orientations / instruction sessions 6.12 7.46 6.97 0.84 -0.49 329 Making me aware of library resources and services
6.13 7.52 6.87 0.74 -0.65 1,376
Providing search tools that permit me to work autonomously
6.81 8.21 7.05 0.24 -1.16 419
Ready access to computers / Internet / software 6.90 8.18 7.77 0.87 -0.41 593 Resources added to library collections on request
7.00 9.00 8.50 1.50 -0.50 2
Teaching me how to access, evaluate, and use information
6.22 7.64 6.80 0.58 -0.84 1,805
The library program teaches me how to access, evaluate, and use information
6.11 7.38 6.79 0.68 -0.59 217
Timely document delivery / interlibrary loan 6.64 8.02 7.45 0.81 -0.57 673 Question Minimum
SD Desired
SD Perceived
SD Adequacy
SD Superiority
SD n
A library environment that is hospitable and conducive to finding and using information
1.21 0.95 1.28 1.57 1.40 157
Ability to navigate library Web pages easily 1.39 1.16 1.41 1.63 1.50 1,266

Revised 9/17/07
127
Question Minimum SD
Desired SD
Perceived SD
Adequacy SD
Superiority SD
n
Access to equipment that is not readily available in my department, e.g., scanners, CD burners, PDAs, syncing stations
1.59 1.28 1.68 1.90 1.82 379
Access to photocopying and printing facilities 1.58 1.25 1.50 2.02 1.87 52 Adequate hours of service 1.32 1.08 1.37 1.76 1.52 646 Assuring users of the accuracy and confidentiality of their transactions
1.37 0.99 1.02 1.35 1.15 131
Convenient business hours 1.45 1.12 1.56 1.97 1.72 925 Ease and timeliness in getting materials from other libraries
1.50 1.15 1.66 2.01 1.76 835
Ease of use of electronic resources 1.33 1.00 1.36 1.82 1.54 602 Efficient interlibrary loan / document delivery 1.15 1.53 2.00 1.15 2.08 3 Electronic resources matching my information needs
1.41 0.97 1.55 1.91 1.73 415
Librarians providing help that assists in finding information needed now while improving my research skills
1.32 0.95 1.18 1.54 1.32 547
Librarians teaching me how to effectively use the electronically available databases, journals, and books
1.61 1.38 1.34 1.96 2.03 382
Library keeping me informed about all of its services
1.38 1.31 1.53 1.61 1.61 161
Library orientations / instruction sessions 1.80 1.52 1.56 1.78 1.54 329 Making me aware of library resources and services
1.63 1.35 1.56 1.85 1.67 1,376
Providing search tools that permit me to work autonomously
1.43 1.01 1.40 1.74 1.49 419
Ready access to computers / Internet / software 1.43 1.04 1.21 1.63 1.37 593 Resources added to library collections on request
1.41 0.00 0.71 0.71 0.71 2
Teaching me how to access, evaluate, and use information
1.61 1.32 1.64 1.93 1.77 1,805
The library program teaches me how to access, evaluate, and use information
1.95 1.71 1.53 1.92 1.91 217
Timely document delivery / interlibrary loan 1.46 1.16 1.45 1.75 1.59 673
4.3.7 General Satisfaction Questions Summary This table displays mean score and standard deviation for each of the general satisfaction questions: Satisfaction with Treatment, Satisfaction with Support, and Satisfaction with Overall Quality of Service, where n is the number of respondents for each particular question. These scores are calculated from responses to the general satisfaction questions on the LibQUAL+® survey, in which respondents rated their levels of general satisfaction on a scale from 1-9. Unified Question Response Mean Response SD Respondents
(n) How would you rate the overall quality of the service provided by the library?
7.17 1.31 8,269
In general, I am satisfied with library support for my learning, research, and/or teaching needs.
7.12 1.58 8,268
In general, I am satisfied with the way in which I am treated at the library.
7.51 1.45 8,269

Revised 9/17/07
128
American English Question Response Mean Response SD Respondents
(n) How would you rate the overall quality of the service provided by the library?
7.11 1.37 5,367
In general, I am satisfied with library support for my learning, research, and/or teaching needs.
6.96 1.66 5,366
In general, I am satisfied with the way in which I am treated at the library.
7.39 1.52 5,367
Canadian French Question Response Mean Response SD Respondents
(n) How would you rate the overall quality of the service provided by the library?
7.29 1.16 2,902
In general, I am satisfied with library support for my learning, research, and/or teaching needs.
7.42 1.37 2,902
In general, I am satisfied with the way in which I am treated at the library.
7.72 1.28 2,902
4.3.8 Information Literacy Outcomes Questions Summary This table displays the mean score and standard deviation for each of the information literacy outcomes questions, where n is the number of respondents for each particular question. These scores are calculated from responses to the information literacy outcomes questions on the LibQUAL+® survey, in which respondents rated their levels of general satisfaction on a scale from 1-9 with 1 being "strongly disagree" and 9 representing "strongly agree". Unified Question Response Mean Response
SD Respondents
(n) The library aids my advancement in my academic discipline. 7.02 1.60 8,269 The library enables me to be more efficient in my academic pursuits. 7.03 1.62 8,268 The library helps me distinguish between trustworthy and untrustworthy information.
5.82 1.94 8,269
The library helps me stay abreast of developments in my field(s) of interest.
6.35 1.83 8,269
The library provides me with the information skills I need in my work or study.
6.37 1.78 8,269
American English Question Response Mean Response
SD Respondents
(n) The library aids my advancement in my academic discipline. 6.96 1.65 5,367 The library enables me to be more efficient in my academic pursuits. 6.98 1.67 5,366 The library helps me distinguish between trustworthy and untrustworthy information.
5.77 1.96 5,367
The library helps me stay abreast of developments in my field(s) of interest.
6.11 1.93 5,367
The library provides me with the information skills I need in my work or study.
6.27 1.80 5,367
Canadian French Question Response Mean Response
SD Respondents
(n) The library aids my advancement in my academic discipline. 7.12 1.50 2,902

Revised 9/17/07
129
Question Response Mean Response SD
Respondents (n)
The library enables me to be more efficient in my academic pursuits. 7.12 1.52 2,902 The library helps me distinguish between trustworthy and untrustworthy information.
5.93 1.89 2,902
The library helps me stay abreast of developments in my field(s) of interest.
6.80 1.53 2,902
The library provides me with the information skills I need in my work or study.
6.56 1.72 2,902
4.3.9 Library Use Summary This chart shows a graphic representation of library use (both on the premises and electronically), as well as use of non-library information gateways such as Yahoo™ and Google™. Bars represent the frequency with which respondents report using these resources: Daily, Weekly, Monthly, Quarterly, or Never. The table below the chart displays the number and percentage of respondents who selected each option. Unified
0.00%
10.00%
20.00%
30.00%
40.00%
50.00%
60.00%
70.00%
80.00%
90.00%
100.00%
Daily Weekly Monthly Quarterly NeverFrequency
Perc
enta
ge How often do you access library resources through alibrary Web page?
How often do you use resources on library premises?
How often do you use Yahoo(TM), Google(TM), ornon-library gatew ays for information?
Question Daily Weekly Monthly Quarterly Never Total How often do you access library resources through a library Web page?
3,218 3,847 886 259 59 8,269
How often do you use resources on library premises? 1,133 3,657 2,233 1,068 178 8,269 How often do you use Yahoo(TM), Google(TM), or non-library gateways for information?
5,978 1,561 390 168 172 8,269
Question Daily Weekly Monthly Quarterly Never Total How often do you access library resources through a library Web page?
38.92% 46.52% 10.71% 3.13% 0.71% 100.00%
How often do you use resources on library premises? 13.70% 44.23% 27.00% 12.92% 2.15% 100.00% How often do you use Yahoo(TM), Google(TM), or non-library gateways for information?
72.29% 18.88% 4.72% 2.03% 2.08% 100.00%
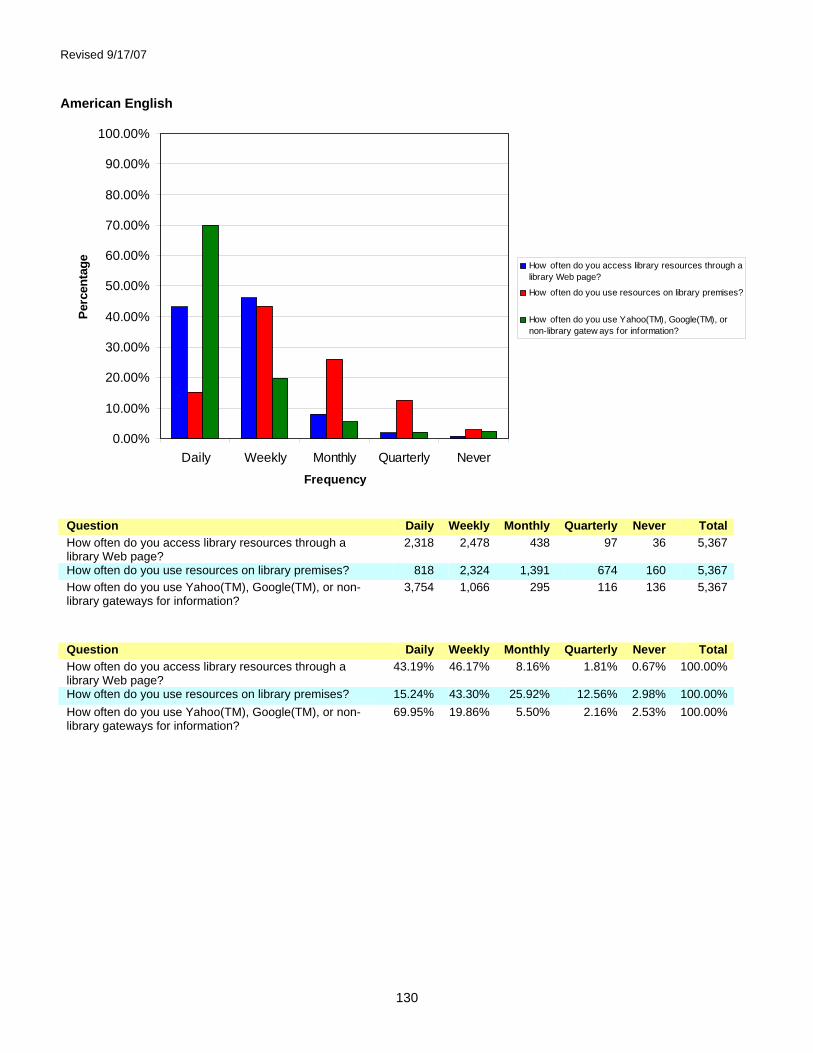
Revised 9/17/07
130
American English
0.00%
10.00%
20.00%
30.00%
40.00%
50.00%
60.00%
70.00%
80.00%
90.00%
100.00%
Daily Weekly Monthly Quarterly NeverFrequency
Perc
enta
ge How often do you access library resources through alibrary Web page?
How often do you use resources on library premises?
How often do you use Yahoo(TM), Google(TM), ornon-library gatew ays for information?
Question Daily Weekly Monthly Quarterly Never Total How often do you access library resources through a library Web page?
2,318 2,478 438 97 36 5,367
How often do you use resources on library premises? 818 2,324 1,391 674 160 5,367 How often do you use Yahoo(TM), Google(TM), or non-library gateways for information?
3,754 1,066 295 116 136 5,367
Question Daily Weekly Monthly Quarterly Never Total How often do you access library resources through a library Web page?
43.19% 46.17% 8.16% 1.81% 0.67% 100.00%
How often do you use resources on library premises? 15.24% 43.30% 25.92% 12.56% 2.98% 100.00% How often do you use Yahoo(TM), Google(TM), or non-library gateways for information?
69.95% 19.86% 5.50% 2.16% 2.53% 100.00%

Revised 9/17/07
131
Canadian French
0.00%
10.00%
20.00%
30.00%
40.00%
50.00%
60.00%
70.00%
80.00%
90.00%
100.00%
Daily Weekly Monthly Quarterly NeverFrequency
Perc
enta
ge How often do you access library resources through alibrary Web page?
How often do you use resources on library premises?
How often do you use Yahoo(TM), Google(TM), ornon-library gatew ays for information?
Question Daily Weekly Monthly Quarterly Never Total How often do you access library resources through a library Web page?
900 1,369 448 162 23 2,902
How often do you use resources on library premises? 315 1,333 842 394 18 2,902 How often do you use Yahoo(TM), Google(TM), or non-library gateways for information?
2,224 495 95 52 36 2,902
Question Daily Weekly Monthly Quarterly Never Total How often do you access library resources through a library Web page?
31.01% 47.17% 15.44% 5.58% 0.79% 100.00%
How often do you use resources on library premises? 10.85% 45.93% 29.01% 13.58% 0.62% 100.00% How often do you use Yahoo(TM), Google(TM), or non-library gateways for information?
76.64% 17.06% 3.27% 1.79% 1.24% 100.00%

Revised 9/17/07
132
4.4 College or University Libraries - Faculty
4.4.1 Population and Respondent Profiles by Standard Discipline The chart and table below show a breakdown of survey respondents by discipline, based on user responses to the demographic questions and the demographic data provided by institutions in the online Representativeness section*. This section shows survey respondents broken down based on the LibQUAL+® standard discipline categories. The chart maps percentage of respondents for each discipline in red. Population percentages for each discipline are mapped in blue. The table shows the number and percentage for each discipline, for the general population (N) and for survey respondents (n). *Note: Participating institutions were not required to complete the Representativeness section. When population data is missing or incomplete, it is because this data was not provided. Unified
0%
5%
10%
15%
20%
25%
30%
Agricu
lture
/ Env
ironm
ental
Stud
ies
Archite
cture
Busine
ss
Commun
icatio
ns / J
ourna
lism
Educa
tion
Engine
ering
/ Com
puter
Scienc
e
Genera
l Stud
ies
Health
Scienc
es
Human
ities
Law
Military
/ Nav
al Scie
nce
Other
Perform
ing & Fine
Arts
Scienc
e / M
ath
Social
Scienc
es / P
sych
ology
Undec
ided
Discipline
Per
cent
age
Population Profile by DisciplineRespondent Profile by Discipline
Discipline Population
(N) Population
% Respondents
(n) Respondents
% N%-n%
Agriculture / Environmental Studies
1,690 3.20% 183 3.66% -0.45%
Architecture 185 0.35% 26 0.52% -0.17% Business 3,361 6.37% 300 5.99% 0.37% Communications / Journalism 767 1.45% 47 0.94% 0.51% Education 2,792 5.29% 262 5.23% 0.06% Engineering / Computer Science 4,773 9.04% 387 7.73% 1.31% General Studies 493 0.93% 52 1.04% -0.10% Health Sciences 14,614 27.69% 786 15.70% 11.99% Humanities 6,891 13.06% 971 19.40% -6.34% Law 1,033 1.96% 71 1.42% 0.54% Military / Naval Science 19 0.04% 15 0.30% -0.26% Other 1,348 2.55% 162 3.24% -0.68% Performing & Fine Arts 2,083 3.95% 213 4.26% -0.31% Science / Math 6,165 11.68% 709 14.17% -2.48%

Revised 9/17/07
133
Discipline Population (N)
Population %
Respondents (n)
Respondents %
N%-n%
Social Sciences / Psychology 5,890 11.16% 773 15.44% -4.28% Undecided 669 1.27% 48 0.96% 0.31%
Grand Total 52,773 100.00% 5,005 100.00% 0.00% American English
0%
5%
10%
15%
20%
25%
Agricu
lture
/ Env
ironm
ental
Stud
ies
Archite
cture
Busine
ss
Commun
icatio
ns / J
ourna
lism
Educa
tion
Engine
ering
/ Com
puter
Scienc
e
Genera
l Stud
ies
Health
Scienc
es
Human
ities
Law
Military
/ Nav
al Scie
nce
Other
Perform
ing & Fine
Arts
Scienc
e / M
ath
Social
Scienc
es / P
sych
ology
Undec
ided
Discipline
Per
cent
age
Population Profile by DisciplineRespondent Profile by Discipline
Discipline Population
(N) Population
% Respondents
(n) Respondents
% N%-n%
Agriculture / Environmental Studies
1,358 4.00% 168 3.92% 0.08%
Architecture 117 0.34% 18 0.42% -0.08% Business 2,122 6.24% 236 5.50% 0.74% Communications / Journalism 137 0.40% 14 0.33% 0.08% Education 1,566 4.61% 185 4.31% 0.29% Engineering / Computer Science 3,212 9.45% 254 5.92% 3.53% General Studies 300 0.88% 45 1.05% -0.17% Health Sciences 7,891 23.22% 700 16.32% 6.90% Humanities 4,731 13.92% 881 20.55% -6.62% Law 557 1.64% 46 1.07% 0.57% Military / Naval Science 19 0.06% 12 0.28% -0.22% Other 1,116 3.28% 152 3.54% -0.26% Performing & Fine Arts 1,457 4.29% 180 4.20% 0.09% Science / Math 4,669 13.74% 655 15.28% -1.54% Social Sciences / Psychology 4,072 11.98% 701 16.35% -4.37% Undecided 660 1.94% 41 0.96% 0.99%
Grand Total 33,984 100.00% 4,288 100.00% 0.00%

Revised 9/17/07
134
Canadian French
0%
5%
10%
15%
20%
25%
30%
35%
40%
Agricu
lture
/ Env
ironm
ental
Stud
ies
Archite
cture
Busine
ss
Commun
icatio
ns / J
ourna
lism
Educa
tion
Engine
ering
/ Com
puter
Scienc
e
Genera
l Stud
ies
Health
Scienc
es
Human
ities
Law
Military
/ Nav
al Scie
nce
Other
Perform
ing & Fine
Arts
Scienc
e / M
ath
Social
Scienc
es / P
sych
ology
Undec
ided
Discipline
Perc
enta
ge
Population Profile by DisciplineRespondent Profile by Discipline
Discipline Population (N) Population
% Respondents
(n) Respondents
% N%-n%
Agriculture / Environmental Studies
332 1.77% 15 2.09% -0.33%
Architecture 68 0.36% 8 1.12% -0.75% Business 1,239 6.59% 64 8.93% -2.33% Communications / Journalism 630 3.35% 33 4.60% -1.25% Education 1,226 6.53% 77 10.74% -4.21% Engineering / Computer Science
1,561 8.31% 133 18.55% -10.24%
General Studies 193 1.03% 7 0.98% 0.05% Health Sciences 6,723 35.78% 86 11.99% 23.79% Humanities 2,160 11.50% 90 12.55% -1.06% Law 476 2.53% 25 3.49% -0.95% Military / Naval Science
- 0.00% 3 0.42% -0.42%
Other 232 1.23% 10 1.39% -0.16% Performing & Fine Arts 626 3.33% 33 4.60% -1.27% Science / Math 1,496 7.96% 54 7.53% 0.43% Social Sciences / Psychology 1,818 9.68% 72 10.04% -0.37% Undecided 9 0.05% 7 0.98% -0.93%
Grand Total 18,789 100.00% 717 100.00% 0.00%

Revised 9/17/07
135
4.4.2 Respondent Profile by Age This table shows a breakdown of survey respondents by age; both the number of respondents (n) and the percentage of the total number of respondents represented by each group are displayed. Unified Age Group Respondents (n) Respondents % Under 18 3 0.06% 18 - 22 5 0.10% 23 - 30 153 3.05% 31 - 45 1,918 38.26% 46 - 65 2,736 54.58% Over 65 198 3.95%
Grand Total 5,013 100.00% American English Age Group Respondents (n) Respondents % Under 18 3 0.07% 18 - 22 5 0.12% 23 - 30 119 2.77% 31 - 45 1,615 37.61% 46 - 65 2,364 55.05% Over 65 188 4.38%
Grand Total 4,294 100.00% Canadian French Age Group Respondents (n) Respondents % Under 18 - 0.00% 18 - 22 - 0.00% 23 - 30 34 4.73% 31 - 45 303 42.14% 46 - 65 372 51.74% Over 65 10 1.39%
Grand Total 719 100.00%

Revised 9/17/07
136
4.4.3 Population and Respondent Profile by Sex The table below shows a breakdown of survey respondents by sex, based on user responses to the demographic questions and the demographic data provided by institutions in the online Representativeness section* . The number and percentage for each sex are given for the general population and for survey respondents. * Note: Participating institutions were not required to complete the Representativness section. When population data is missing or incomplete, it is because this data was not provided. Unified Sex Population (N) Population % Respondents
(n) Respondents
% Male 35,146 64.84% 2,817 56.32% Female 19,062 35.16% 2,185 43.68%
Grand Total 54,208 100.00% 5,002 100.00% American English Sex Respondents
(n) Respondents
% Male 2,352 54.90% Female 1,932 45.10%
Grand Total 4,284 100.00% Canadian French Sex Respondents
(n) Respondents
% Male 465 64.76% Female 253 35.24%
Grand Total 718 100.00%

Revised 9/17/07
137
4.4.4 Core Question Summary This radar chart shows aggregate results for the core survey questions. Each axis represents one question. A code to identify each question is displayed at the outer point of each axis. While questions for each dimension of library service quality are scattered randomly throughout the survey, on this chart they are grouped into sections: Affect of Service, Library as Place, and Information Control. On each axis, respondents' minimum, desired, and perceived levels of service quality are plotted, and the resulting "gaps" between the three levels (representing service adequacy or service superiority) are shaded in blue, yellow, green, and red. The two following tables show mean scores and standard deviations for each question, where n is the number of respondents for each particular question. (For a more detailed explanation of the headings, see the Introduction to this notebook.)
Unified
Perceived Less Than Minimum Perceived Less Than Desired Perceived Greater than Minimum Perceived Greater than Desired
Question Minimum
Mean Desired
Mean Perceived
Mean Adequacy
Mean Superiority
Mean n
AS-1 Employees who instill confidence in users 6.34 7.88 7.15 0.80 -0.73 4,772 AS-2 Giving users individual attention 6.41 7.60 7.09 0.68 -0.51 4,793 AS-3 Employees who are consistently courteous 7.13 8.15 7.76 0.63 -0.39 4,940 AS-4 Readiness to respond to users' questions 7.06 8.12 7.58 0.52 -0.54 4,847 AS-5 Employees who have the knowledge to
answer user questions 7.13 8.21 7.51 0.39 -0.69 4,842
3
4
5
6
7
8
9AS-6
AS-5
AS-4
AS-3
AS-2
AS-1
LP-5
LP-4
LP-3
LP-2
LP-1IC-8
IC-7
IC-6
IC-5
IC-4
IC-3
IC-2
IC-1
AS-9
AS-8
AS-7

Revised 9/17/07
138
Question Minimum Mean
Desired Mean
Perceived Mean
Adequacy Mean
Superiority Mean
n
AS-6 Employees who deal with users in a caring fashion
6.69 7.82 7.41 0.72 -0.41 4,773
AS-7 Employees who understand the needs of their users
6.99 8.08 7.34 0.36 -0.74 4,777
AS-8 Willingness to help users 6.99 8.08 7.58 0.59 -0.49 4,775 AS-9 Dependability in handling users' service
problems 6.99 8.10 7.30 0.31 -0.80 4,217
IC-1 Making electronic resources accessible from my home or office
7.40 8.55 7.25 -0.15 -1.30 4,924
IC-2 A library Web site enabling me to locate information on my own
7.37 8.45 7.08 -0.28 -1.37 4,965
IC-3 The printed library materials I need for my work
6.75 7.90 6.48 -0.27 -1.43 4,570
IC-4 The electronic information resources I need 7.32 8.45 7.10 -0.23 -1.35 4,942 IC-5 Modern equipment that lets me easily
access needed information 7.04 8.16 7.08 0.04 -1.08 4,718
IC-6 Easy-to-use access tools that allow me to find things on my own
7.18 8.33 7.09 -0.09 -1.23 4,890
IC-7 Making information easily accessible for independent use
7.18 8.32 7.24 0.07 -1.07 4,795
IC-8 Print and/or electronic journal collections I require for my work
7.48 8.56 6.79 -0.70 -1.77 4,854
LP-1 Library space that inspires study and learning
6.07 7.36 6.04 -0.03 -1.32 4,308
LP-2 Quiet space for individual activities 5.96 7.09 6.17 0.21 -0.92 3,924 LP-3 A comfortable and inviting location 6.13 7.42 6.47 0.35 -0.95 4,514 LP-4 A getaway for study, learning, or research 6.08 7.35 6.39 0.30 -0.97 4,117 LP-5 Community space for group learning and
group study 5.00 6.14 5.88 0.87 -0.26 3,167
Grand Total 6.76 7.91 6.99 0.23 -0.92 4,610 Question Minimum
SD Desired
SD Perceived
SD Adequacy
SD Superiority
SD n
AS-1 Employees who instill confidence in users 1.70 1.38 1.51 1.80 1.62 4,772 AS-2 Giving users individual attention 1.72 1.50 1.56 1.76 1.63 4,793 AS-3 Employees who are consistently courteous 1.62 1.19 1.41 1.79 1.51 4,940 AS-4 Readiness to respond to users' questions 1.50 1.16 1.41 1.68 1.49 4,847 AS-5 Employees who have the knowledge to
answer user questions 1.51 1.12 1.38 1.63 1.41 4,842
AS-6 Employees who deal with users in a caring fashion
1.73 1.44 1.45 1.75 1.57 4,773
AS-7 Employees who understand the needs of their users
1.55 1.21 1.45 1.72 1.54 4,777
AS-8 Willingness to help users 1.59 1.25 1.39 1.69 1.48 4,775 AS-9 Dependability in handling users' service
problems 1.51 1.19 1.47 1.73 1.56 4,217
IC-1 Making electronic resources accessible from my home or office
1.51 0.93 1.56 1.91 1.66 4,924
IC-2 A library Web site enabling me to locate information on my own
1.44 0.96 1.50 1.86 1.62 4,965
IC-3 The printed library materials I need for my work
1.71 1.51 1.74 2.16 2.07 4,570
IC-4 The electronic information resources I need 1.41 0.97 1.42 1.85 1.59 4,942 IC-5 Modern equipment that lets me easily
access needed information 1.55 1.19 1.44 1.82 1.59 4,718
IC-6 Easy-to-use access tools that allow me to find things on my own
1.44 1.01 1.39 1.83 1.56 4,890
IC-7 Making information easily accessible for independent use
1.41 1.01 1.35 1.73 1.47 4,795

Revised 9/17/07
139
Question Minimum SD
Desired SD
Perceived SD
Adequacy SD
Superiority SD
n
IC-8 Print and/or electronic journal collections I require for my work
1.42 0.94 1.67 2.08 1.82 4,854
LP-1 Library space that inspires study and learning
1.95 1.92 1.91 2.46 2.50 4,308
LP-2 Quiet space for individual activities 2.13 2.09 1.90 2.55 2.55 3,924 LP-3 A comfortable and inviting location 1.85 1.71 1.81 2.28 2.22 4,514 LP-4 A getaway for study, learning, or research 2.10 1.98 1.79 2.32 2.30 4,117 LP-5 Community space for group learning and
group study 2.34 2.44 1.88 2.46 2.57 3,167
Grand Total 1.67 1.37 1.56 1.95 1.79 4,610 American English
Perceived Less Than Minimum Perceived Less Than Desired Perceived Greater than Minimum Perceived Greater than Desired
Question Minimum
Mean Desired
Mean Perceived
Mean Adequacy
Mean Superiority
Mean n
AS-1 Employees who instill confidence in users 6.3 7.86 7.1 0.79 -0.77 4,064 AS-2 Giving users individual attention 6.43 7.64 7.12 0.69 -0.52 4,104 AS-3 Employees who are consistently courteous 7.12 8.14 7.74 0.61 -0.41 4,227 AS-4 Readiness to respond to users' questions 7.07 8.14 7.58 0.50 -0.56 4,148 AS-5 Employees who have the knowledge to
answer user questions 7.12 8.2 7.48 0.36 -0.72 4,133
AS-6 Employees who deal with users in a caring fashion
6.65 7.78 7.38 0.73 -0.40 4,072
AS-7 Employees who understand the needs of their users
6.98 8.07 7.32 0.34 -0.75 4,086
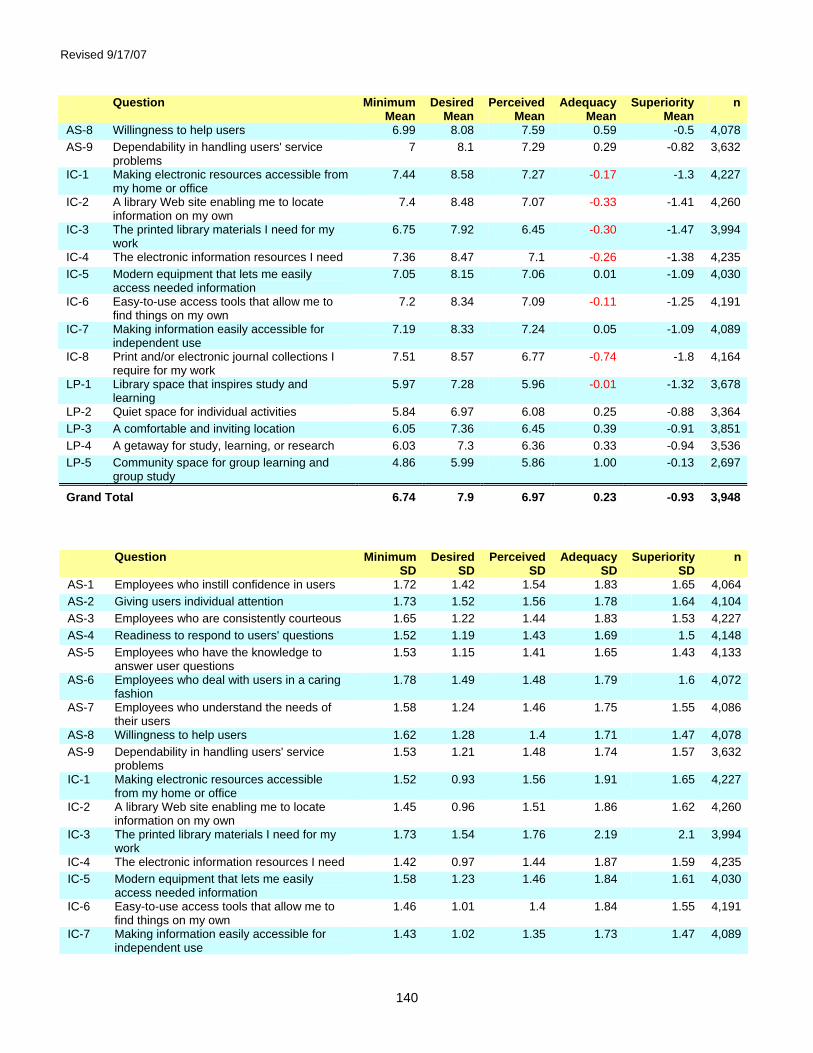
Revised 9/17/07
140
Question Minimum Mean
Desired Mean
Perceived Mean
Adequacy Mean
Superiority Mean
n
AS-8 Willingness to help users 6.99 8.08 7.59 0.59 -0.5 4,078 AS-9 Dependability in handling users' service
problems 7 8.1 7.29 0.29 -0.82 3,632
IC-1 Making electronic resources accessible from my home or office
7.44 8.58 7.27 -0.17 -1.3 4,227
IC-2 A library Web site enabling me to locate information on my own
7.4 8.48 7.07 -0.33 -1.41 4,260
IC-3 The printed library materials I need for my work
6.75 7.92 6.45 -0.30 -1.47 3,994
IC-4 The electronic information resources I need 7.36 8.47 7.1 -0.26 -1.38 4,235 IC-5 Modern equipment that lets me easily
access needed information 7.05 8.15 7.06 0.01 -1.09 4,030
IC-6 Easy-to-use access tools that allow me to find things on my own
7.2 8.34 7.09 -0.11 -1.25 4,191
IC-7 Making information easily accessible for independent use
7.19 8.33 7.24 0.05 -1.09 4,089
IC-8 Print and/or electronic journal collections I require for my work
7.51 8.57 6.77 -0.74 -1.8 4,164
LP-1 Library space that inspires study and learning
5.97 7.28 5.96 -0.01 -1.32 3,678
LP-2 Quiet space for individual activities 5.84 6.97 6.08 0.25 -0.88 3,364 LP-3 A comfortable and inviting location 6.05 7.36 6.45 0.39 -0.91 3,851 LP-4 A getaway for study, learning, or research 6.03 7.3 6.36 0.33 -0.94 3,536 LP-5 Community space for group learning and
group study 4.86 5.99 5.86 1.00 -0.13 2,697
Grand Total 6.74 7.9 6.97 0.23 -0.93 3,948
Question Minimum SD
Desired SD
Perceived SD
Adequacy SD
Superiority SD
n
AS-1 Employees who instill confidence in users 1.72 1.42 1.54 1.83 1.65 4,064 AS-2 Giving users individual attention 1.73 1.52 1.56 1.78 1.64 4,104 AS-3 Employees who are consistently courteous 1.65 1.22 1.44 1.83 1.53 4,227 AS-4 Readiness to respond to users' questions 1.52 1.19 1.43 1.69 1.5 4,148 AS-5 Employees who have the knowledge to
answer user questions 1.53 1.15 1.41 1.65 1.43 4,133
AS-6 Employees who deal with users in a caring fashion
1.78 1.49 1.48 1.79 1.6 4,072
AS-7 Employees who understand the needs of their users
1.58 1.24 1.46 1.75 1.55 4,086
AS-8 Willingness to help users 1.62 1.28 1.4 1.71 1.47 4,078 AS-9 Dependability in handling users' service
problems 1.53 1.21 1.48 1.74 1.57 3,632
IC-1 Making electronic resources accessible from my home or office
1.52 0.93 1.56 1.91 1.65 4,227
IC-2 A library Web site enabling me to locate information on my own
1.45 0.96 1.51 1.86 1.62 4,260
IC-3 The printed library materials I need for my work
1.73 1.54 1.76 2.19 2.1 3,994
IC-4 The electronic information resources I need 1.42 0.97 1.44 1.87 1.59 4,235 IC-5 Modern equipment that lets me easily
access needed information 1.58 1.23 1.46 1.84 1.61 4,030
IC-6 Easy-to-use access tools that allow me to find things on my own
1.46 1.01 1.4 1.84 1.55 4,191
IC-7 Making information easily accessible for independent use
1.43 1.02 1.35 1.73 1.47 4,089
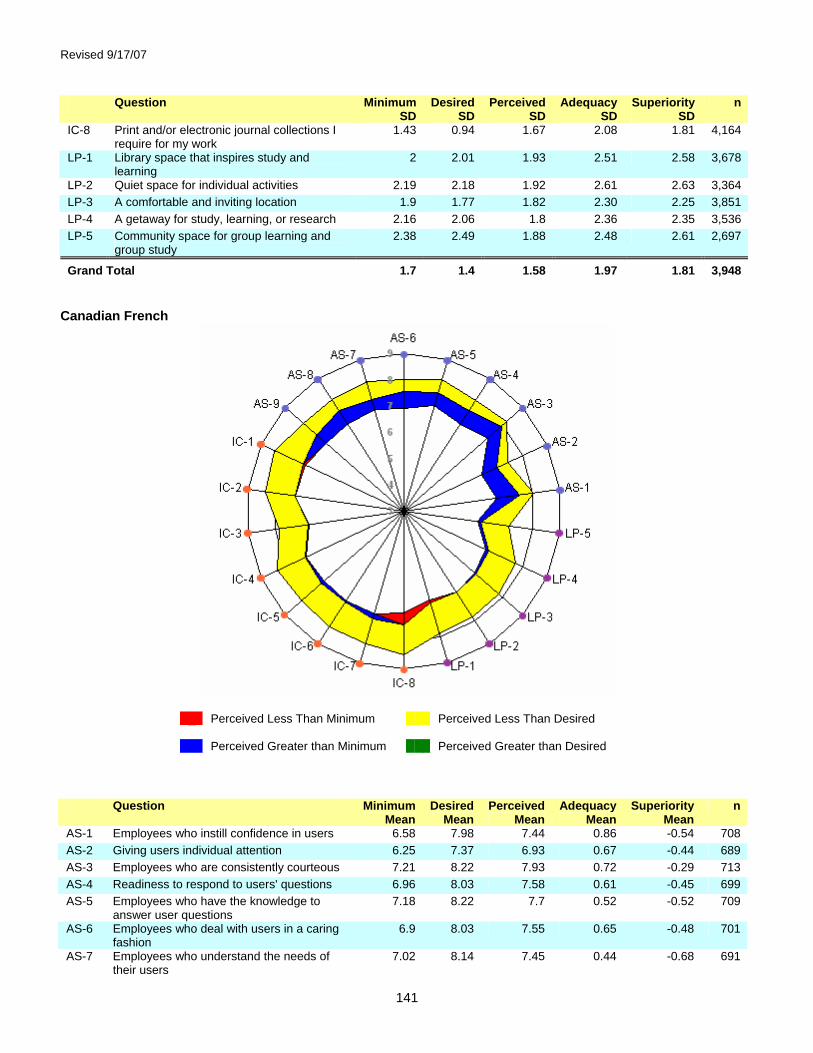
Revised 9/17/07
141
Question Minimum SD
Desired SD
Perceived SD
Adequacy SD
Superiority SD
n
IC-8 Print and/or electronic journal collections I require for my work
1.43 0.94 1.67 2.08 1.81 4,164
LP-1 Library space that inspires study and learning
2 2.01 1.93 2.51 2.58 3,678
LP-2 Quiet space for individual activities 2.19 2.18 1.92 2.61 2.63 3,364 LP-3 A comfortable and inviting location 1.9 1.77 1.82 2.30 2.25 3,851 LP-4 A getaway for study, learning, or research 2.16 2.06 1.8 2.36 2.35 3,536 LP-5 Community space for group learning and
group study 2.38 2.49 1.88 2.48 2.61 2,697
Grand Total 1.7 1.4 1.58 1.97 1.81 3,948 Canadian French
Perceived Less Than Minimum Perceived Less Than Desired Perceived Greater than Minimum Perceived Greater than Desired
Question Minimum
Mean Desired
Mean Perceived
Mean Adequacy
Mean Superiority
Mean n
AS-1 Employees who instill confidence in users 6.58 7.98 7.44 0.86 -0.54 708 AS-2 Giving users individual attention 6.25 7.37 6.93 0.67 -0.44 689 AS-3 Employees who are consistently courteous 7.21 8.22 7.93 0.72 -0.29 713 AS-4 Readiness to respond to users' questions 6.96 8.03 7.58 0.61 -0.45 699 AS-5 Employees who have the knowledge to
answer user questions 7.18 8.22 7.7 0.52 -0.52 709
AS-6 Employees who deal with users in a caring fashion
6.9 8.03 7.55 0.65 -0.48 701
AS-7 Employees who understand the needs of their users
7.02 8.14 7.45 0.44 -0.68 691
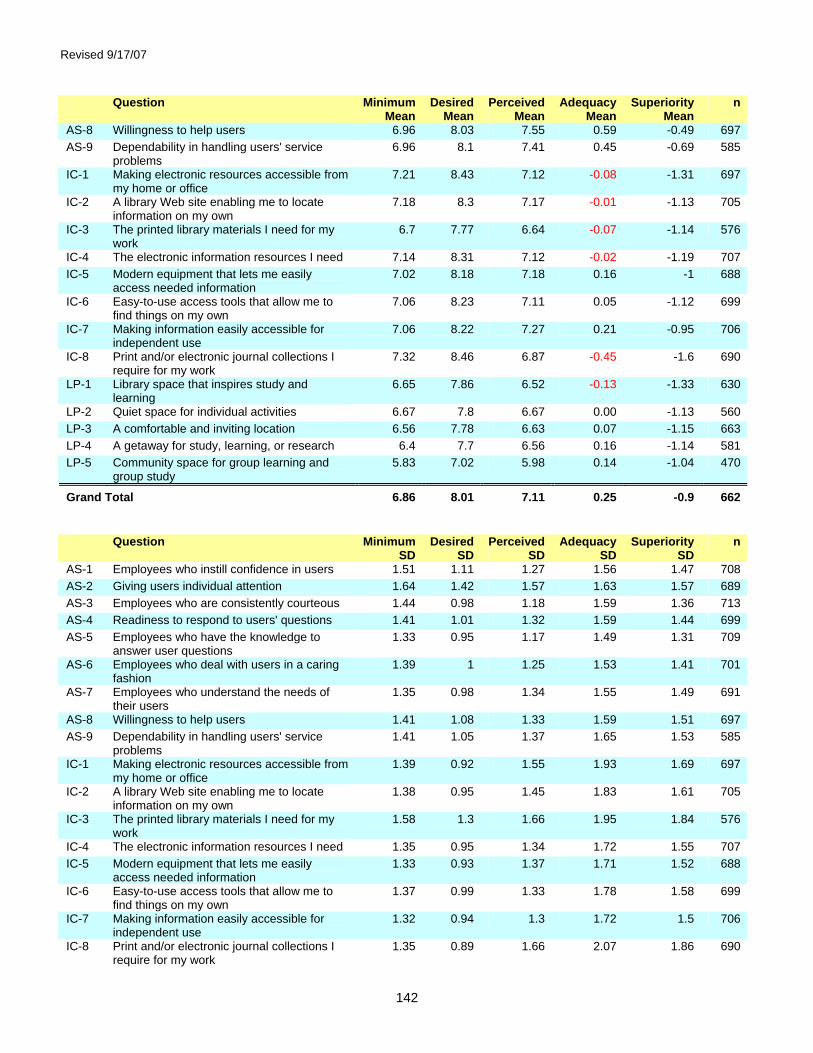
Revised 9/17/07
142
Question Minimum Mean
Desired Mean
Perceived Mean
Adequacy Mean
Superiority Mean
n
AS-8 Willingness to help users 6.96 8.03 7.55 0.59 -0.49 697 AS-9 Dependability in handling users' service
problems 6.96 8.1 7.41 0.45 -0.69 585
IC-1 Making electronic resources accessible from my home or office
7.21 8.43 7.12 -0.08 -1.31 697
IC-2 A library Web site enabling me to locate information on my own
7.18 8.3 7.17 -0.01 -1.13 705
IC-3 The printed library materials I need for my work
6.7 7.77 6.64 -0.07 -1.14 576
IC-4 The electronic information resources I need 7.14 8.31 7.12 -0.02 -1.19 707 IC-5 Modern equipment that lets me easily
access needed information 7.02 8.18 7.18 0.16 -1 688
IC-6 Easy-to-use access tools that allow me to find things on my own
7.06 8.23 7.11 0.05 -1.12 699
IC-7 Making information easily accessible for independent use
7.06 8.22 7.27 0.21 -0.95 706
IC-8 Print and/or electronic journal collections I require for my work
7.32 8.46 6.87 -0.45 -1.6 690
LP-1 Library space that inspires study and learning
6.65 7.86 6.52 -0.13 -1.33 630
LP-2 Quiet space for individual activities 6.67 7.8 6.67 0.00 -1.13 560 LP-3 A comfortable and inviting location 6.56 7.78 6.63 0.07 -1.15 663 LP-4 A getaway for study, learning, or research 6.4 7.7 6.56 0.16 -1.14 581 LP-5 Community space for group learning and
group study 5.83 7.02 5.98 0.14 -1.04 470
Grand Total 6.86 8.01 7.11 0.25 -0.9 662 Question Minimum
SD Desired
SD Perceived
SD Adequacy
SD Superiority
SD n
AS-1 Employees who instill confidence in users 1.51 1.11 1.27 1.56 1.47 708 AS-2 Giving users individual attention 1.64 1.42 1.57 1.63 1.57 689 AS-3 Employees who are consistently courteous 1.44 0.98 1.18 1.59 1.36 713 AS-4 Readiness to respond to users' questions 1.41 1.01 1.32 1.59 1.44 699 AS-5 Employees who have the knowledge to
answer user questions 1.33 0.95 1.17 1.49 1.31 709
AS-6 Employees who deal with users in a caring fashion
1.39 1 1.25 1.53 1.41 701
AS-7 Employees who understand the needs of their users
1.35 0.98 1.34 1.55 1.49 691
AS-8 Willingness to help users 1.41 1.08 1.33 1.59 1.51 697 AS-9 Dependability in handling users' service
problems 1.41 1.05 1.37 1.65 1.53 585
IC-1 Making electronic resources accessible from my home or office
1.39 0.92 1.55 1.93 1.69 697
IC-2 A library Web site enabling me to locate information on my own
1.38 0.95 1.45 1.83 1.61 705
IC-3 The printed library materials I need for my work
1.58 1.3 1.66 1.95 1.84 576
IC-4 The electronic information resources I need 1.35 0.95 1.34 1.72 1.55 707 IC-5 Modern equipment that lets me easily
access needed information 1.33 0.93 1.37 1.71 1.52 688
IC-6 Easy-to-use access tools that allow me to find things on my own
1.37 0.99 1.33 1.78 1.58 699
IC-7 Making information easily accessible for independent use
1.32 0.94 1.3 1.72 1.5 706
IC-8 Print and/or electronic journal collections I require for my work
1.35 0.89 1.66 2.07 1.86 690
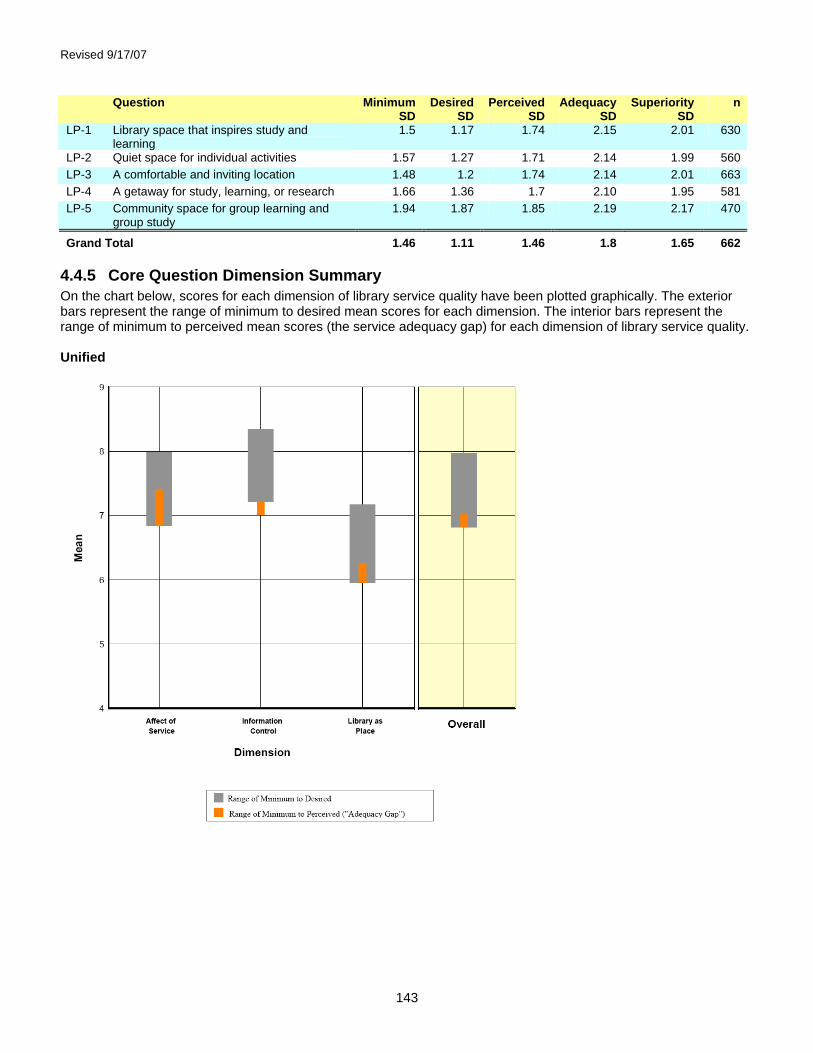
Revised 9/17/07
143
Question Minimum SD
Desired SD
Perceived SD
Adequacy SD
Superiority SD
n
LP-1 Library space that inspires study and learning
1.5 1.17 1.74 2.15 2.01 630
LP-2 Quiet space for individual activities 1.57 1.27 1.71 2.14 1.99 560 LP-3 A comfortable and inviting location 1.48 1.2 1.74 2.14 2.01 663 LP-4 A getaway for study, learning, or research 1.66 1.36 1.7 2.10 1.95 581 LP-5 Community space for group learning and
group study 1.94 1.87 1.85 2.19 2.17 470
Grand Total 1.46 1.11 1.46 1.8 1.65 662
4.4.5 Core Question Dimension Summary On the chart below, scores for each dimension of library service quality have been plotted graphically. The exterior bars represent the range of minimum to desired mean scores for each dimension. The interior bars represent the range of minimum to perceived mean scores (the service adequacy gap) for each dimension of library service quality. Unified

Revised 9/17/07
144
This table shows mean standard deviations for each of the local questions added by the individual library or consortium, where n is the number of respondents for each particular question. (For a more detailed explanation of the headings, see the Introduction to this notebook.)

Revised 9/17/07
145
American English
This table shows mean standard deviations for each of the local questions added by the individual library or consortium, where n is the number of respondents for each particular question. (For a more detailed explanation of the headings, see the Introduction to this notebook.)

Revised 9/17/07
146
Canadian French
This table shows mean standard deviations for each of the local questions added by the individual library or consortium, where n is the number of respondents for each particular question. (For a more detailed explanation of the headings, see the Introduction to this notebook.)

Revised 9/17/07
147
4.4.6 Local Questions Summary These tables show mean scores and standard deviations for each of the local questions added by the individual library or consortium, where n is the number of respondents for each particular question. (For a more detailed explanation of the headings, see the Introduction to this notebook.) Unified Question Minimum
Mean Desired
Mean Perceived
Mean Adequacy
Mean Superiority
Mean n
A library environment that is hospitable and conducive to finding and using information
7.13 8.18 7.33 0.19 -0.86 119
A secure and safe place 6.50 7.53 7.20 0.70 -0.33 262 Ability to navigate library Web pages easily 7.20 8.35 6.82 -0.38 -1.53 3,385 Access to equipment that is not readily available in my department, e.g., scanners, CD burners, PDAs, syncing stations
5.94 7.04 6.10 0.16 -0.94 324
Access to photocopying and printing facilities 6.09 7.35 6.50 0.40 -0.86 141 Access to rare and historical materials 5.89 7.11 6.48 0.60 -0.63 62 Adequate hours of service 6.78 7.84 7.24 0.46 -0.60 2,904 Assuring users of the accuracy and confidentiality of their transactions
7.19 8.21 7.90 0.70 -0.31 77
Availability of subject specialist assistance 5.60 7.12 6.46 0.86 -0.66 145 Comprehensive collections of fulltext articles online
7.08 8.22 6.76 -0.33 -1.46 83
Convenient business hours 6.78 7.86 7.10 0.32 -0.76 318 Convenient service hours 6.46 7.76 7.59 1.12 -0.17 82 Ease and timeliness in getting materials from other libraries
6.92 8.16 7.09 0.17 -1.07 2,628
Ease of use of electronic resources 7.18 8.14 7.04 -0.13 -1.09 137 Efficient interlibrary loan / document delivery 7.56 8.29 7.73 0.18 -0.56 79 Electronic resources matching my information needs
7.24 8.49 6.62 -0.62 -1.87 233
Enabling me to find information myself 24 hours a day
7.04 8.13 7.28 0.24 -0.86 138
Improving library-use skills as a by-product of seeking assistance from library staff
5.89 7.31 6.91 1.03 -0.40 116
Librarians providing help that assists in finding information needed now while improving my research skills
6.73 7.82 7.53 0.80 -0.29 249
Librarians providing help that both assists in finding the information needed now, and improves skills useful in future information searches
6.77 7.81 7.26 0.49 -0.55 53
Librarians teaching me how to effectively use the electronically available databases, journals, and books
6.92 7.94 7.21 0.29 -0.73 124
Library keeping me informed about all of its services
6.46 7.63 7.08 0.62 -0.56 104
Library orientations / instruction sessions 5.94 7.20 6.94 1.00 -0.25 127 Making me aware of library resources and services
6.29 7.47 6.75 0.45 -0.73 3,346
Making me aware of library services 6.44 7.13 6.94 0.50 -0.19 62 Online course support (readings, links, references)
6.39 7.60 6.91 0.53 -0.69 129
Providing search tools that permit me to work autonomously
7.29 8.41 6.76 -0.52 -1.65 63
Ready access to computers / Internet / software 6.97 8.01 7.42 0.45 -0.59 122

Revised 9/17/07
148
Question Minimum Mean
Desired Mean
Perceived Mean
Adequacy Mean
Superiority Mean
n
Resources added to library collections on request
7.23 8.14 6.73 -0.50 -1.41 74
Space for group / individual study and research needs
5.42 6.66 5.68 0.27 -0.98 130
Space for students to study and work in groups 5.41 6.65 5.19 -0.22 -1.46 104 Space that facilitates quiet study 5.59 6.82 5.88 0.29 -0.94 138 Teaching me how to access, evaluate, and use information
6.10 7.34 6.80 0.70 -0.54 2,764
Teaching me how to locate, evaluate, and use information
6.22 7.43 7.43 1.21 0.00 142
The library collection provides information resources reflecting diverse points of view
7.23 8.10 7.20 -0.03 -0.89 132
The library program teaches me how to access, evaluate, and use information
6.00 7.30 6.76 0.76 -0.54 239
Timely document delivery / interlibrary loan 7.02 8.15 7.19 0.17 -0.96 516
Timely document delivery/interlibrary loan 6.98 8.02 7.31 0.34 -0.71 122 Question Minimum
SD Desired
SD Perceived
SD Adequacy
SD Superiority
SD n
A library environment that is hospitable and conducive to finding and using information
1.36 0.89 1.28 1.67 1.42 119
A secure and safe place 2.28 2.04 1.56 2.18 2.08 262 Ability to navigate library Web pages easily 1.50 1.07 1.57 1.98 1.74 3,385 Access to equipment that is not readily available in my department, e.g., scanners, CD burners, PDAs, syncing stations
2.23 2.13 2.00 2.41 2.39 324
Access to photocopying and printing facilities 1.95 1.76 1.66 2.22 1.99 141 Access to rare and historical materials 2.32 2.22 2.08 2.51 2.34 62 Adequate hours of service 1.66 1.41 1.54 1.99 1.81 2,904 Assuring users of the accuracy and confidentiality of their transactions
1.53 1.00 1.06 1.25 1.12 77
Availability of subject specialist assistance 1.90 1.88 1.63 2.24 2.22 145 Comprehensive collections of fulltext articles online
1.56 1.17 1.40 1.99 1.74 83
Convenient business hours 1.59 1.39 1.65 1.98 1.88 318 Convenient service hours 1.69 1.38 1.26 1.67 1.48 82 Ease and timeliness in getting materials from other libraries
1.59 1.21 1.57 1.97 1.75 2,628
Ease of use of electronic resources 1.26 0.92 1.55 1.80 1.60 137 Efficient interlibrary loan / document delivery 1.70 1.43 1.41 1.85 1.65 79 Electronic resources matching my information needs
1.44 0.97 1.56 1.95 1.77 233
Enabling me to find information myself 24 hours a day
1.58 1.16 1.43 1.72 1.44 138
Improving library-use skills as a by-product of seeking assistance from library staff
1.78 1.62 1.64 1.93 1.96 116
Librarians providing help that assists in finding information needed now while improving my research skills
1.80 1.51 1.51 1.93 1.72 249
Librarians providing help that both assists in finding the information needed now, and improves skills useful in future information searches
1.68 1.71 1.16 1.99 1.73 53
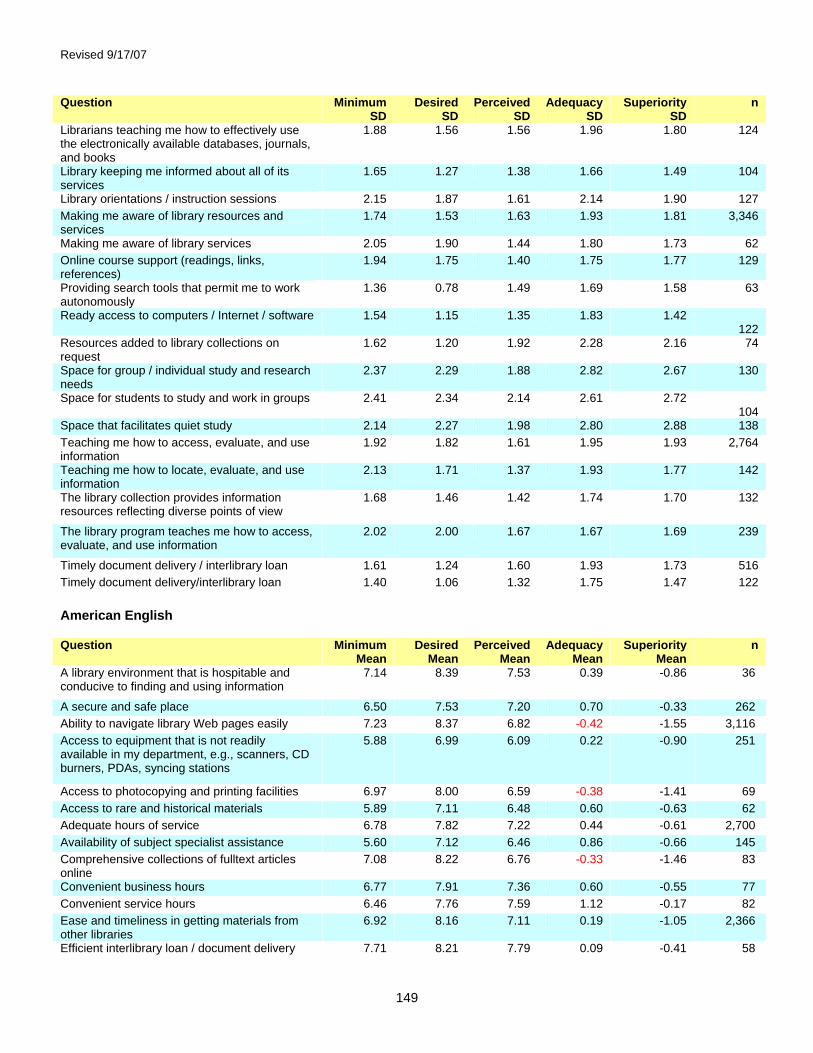
Revised 9/17/07
149
Question Minimum SD
Desired SD
Perceived SD
Adequacy SD
Superiority SD
n
Librarians teaching me how to effectively use the electronically available databases, journals, and books
1.88 1.56 1.56 1.96 1.80 124
Library keeping me informed about all of its services
1.65 1.27 1.38 1.66 1.49 104
Library orientations / instruction sessions 2.15 1.87 1.61 2.14 1.90 127 Making me aware of library resources and services
1.74 1.53 1.63 1.93 1.81 3,346
Making me aware of library services 2.05 1.90 1.44 1.80 1.73 62 Online course support (readings, links, references)
1.94 1.75 1.40 1.75 1.77 129
Providing search tools that permit me to work autonomously
1.36 0.78 1.49 1.69 1.58 63
Ready access to computers / Internet / software 1.54 1.15 1.35 1.83 1.42 122
Resources added to library collections on request
1.62 1.20 1.92 2.28 2.16 74
Space for group / individual study and research needs
2.37 2.29 1.88 2.82 2.67 130
Space for students to study and work in groups 2.41 2.34 2.14 2.61 2.72 104
Space that facilitates quiet study 2.14 2.27 1.98 2.80 2.88 138 Teaching me how to access, evaluate, and use information
1.92 1.82 1.61 1.95 1.93 2,764
Teaching me how to locate, evaluate, and use information
2.13 1.71 1.37 1.93 1.77 142
The library collection provides information resources reflecting diverse points of view
1.68 1.46 1.42 1.74 1.70 132
The library program teaches me how to access, evaluate, and use information
2.02 2.00 1.67 1.67 1.69 239
Timely document delivery / interlibrary loan 1.61 1.24 1.60 1.93 1.73 516 Timely document delivery/interlibrary loan 1.40 1.06 1.32 1.75 1.47 122 American English Question Minimum
Mean Desired
Mean Perceived
Mean Adequacy
Mean Superiority
Mean n
A library environment that is hospitable and conducive to finding and using information
7.14 8.39 7.53 0.39 -0.86 36
A secure and safe place 6.50 7.53 7.20 0.70 -0.33 262 Ability to navigate library Web pages easily 7.23 8.37 6.82 -0.42 -1.55 3,116 Access to equipment that is not readily available in my department, e.g., scanners, CD burners, PDAs, syncing stations
5.88 6.99 6.09 0.22 -0.90 251
Access to photocopying and printing facilities 6.97 8.00 6.59 -0.38 -1.41 69 Access to rare and historical materials 5.89 7.11 6.48 0.60 -0.63 62 Adequate hours of service 6.78 7.82 7.22 0.44 -0.61 2,700 Availability of subject specialist assistance 5.60 7.12 6.46 0.86 -0.66 145 Comprehensive collections of fulltext articles online
7.08 8.22 6.76 -0.33 -1.46 83
Convenient business hours 6.77 7.91 7.36 0.60 -0.55 77 Convenient service hours 6.46 7.76 7.59 1.12 -0.17 82 Ease and timeliness in getting materials from other libraries
6.92 8.16 7.11 0.19 -1.05 2,366
Efficient interlibrary loan / document delivery 7.71 8.21 7.79 0.09 -0.41 58
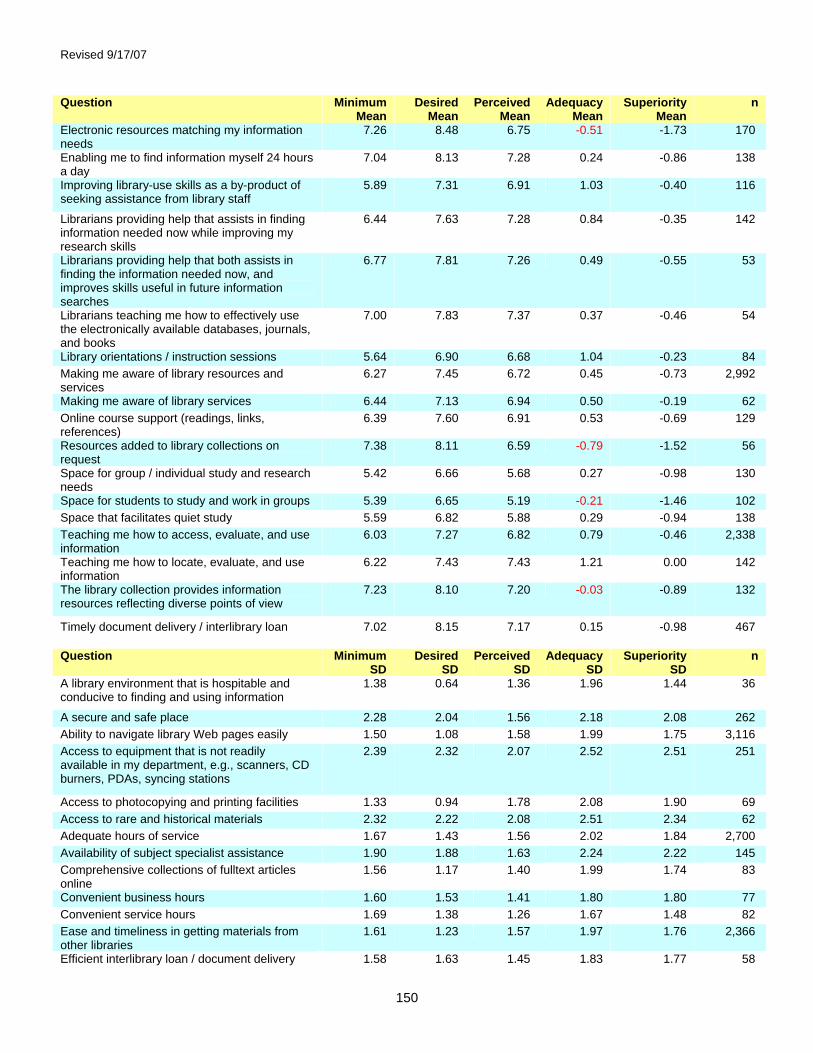
Revised 9/17/07
150
Question Minimum Mean
Desired Mean
Perceived Mean
Adequacy Mean
Superiority Mean
n
Electronic resources matching my information needs
7.26 8.48 6.75 -0.51 -1.73 170
Enabling me to find information myself 24 hours a day
7.04 8.13 7.28 0.24 -0.86 138
Improving library-use skills as a by-product of seeking assistance from library staff
5.89 7.31 6.91 1.03 -0.40 116
Librarians providing help that assists in finding information needed now while improving my research skills
6.44 7.63 7.28 0.84 -0.35 142
Librarians providing help that both assists in finding the information needed now, and improves skills useful in future information searches
6.77 7.81 7.26 0.49 -0.55 53
Librarians teaching me how to effectively use the electronically available databases, journals, and books
7.00 7.83 7.37 0.37 -0.46 54
Library orientations / instruction sessions 5.64 6.90 6.68 1.04 -0.23 84 Making me aware of library resources and services
6.27 7.45 6.72 0.45 -0.73 2,992
Making me aware of library services 6.44 7.13 6.94 0.50 -0.19 62 Online course support (readings, links, references)
6.39 7.60 6.91 0.53 -0.69 129
Resources added to library collections on request
7.38 8.11 6.59 -0.79 -1.52 56
Space for group / individual study and research needs
5.42 6.66 5.68 0.27 -0.98 130
Space for students to study and work in groups 5.39 6.65 5.19 -0.21 -1.46 102 Space that facilitates quiet study 5.59 6.82 5.88 0.29 -0.94 138 Teaching me how to access, evaluate, and use information
6.03 7.27 6.82 0.79 -0.46 2,338
Teaching me how to locate, evaluate, and use information
6.22 7.43 7.43 1.21 0.00 142
The library collection provides information resources reflecting diverse points of view
7.23 8.10 7.20 -0.03 -0.89 132
Timely document delivery / interlibrary loan 7.02 8.15 7.17 0.15 -0.98 467 Question Minimum
SD Desired
SD Perceived
SD Adequacy
SD Superiority
SD n
A library environment that is hospitable and conducive to finding and using information
1.38 0.64 1.36 1.96 1.44 36
A secure and safe place 2.28 2.04 1.56 2.18 2.08 262 Ability to navigate library Web pages easily 1.50 1.08 1.58 1.99 1.75 3,116 Access to equipment that is not readily available in my department, e.g., scanners, CD burners, PDAs, syncing stations
2.39 2.32 2.07 2.52 2.51 251
Access to photocopying and printing facilities 1.33 0.94 1.78 2.08 1.90 69 Access to rare and historical materials 2.32 2.22 2.08 2.51 2.34 62 Adequate hours of service 1.67 1.43 1.56 2.02 1.84 2,700 Availability of subject specialist assistance 1.90 1.88 1.63 2.24 2.22 145 Comprehensive collections of fulltext articles online
1.56 1.17 1.40 1.99 1.74 83
Convenient business hours 1.60 1.53 1.41 1.80 1.80 77 Convenient service hours 1.69 1.38 1.26 1.67 1.48 82 Ease and timeliness in getting materials from other libraries
1.61 1.23 1.57 1.97 1.76 2,366
Efficient interlibrary loan / document delivery 1.58 1.63 1.45 1.83 1.77 58

Revised 9/17/07
151
Question Minimum SD
Desired SD
Perceived SD
Adequacy SD
Superiority SD
n
Electronic resources matching my information needs
1.52 0.99 1.47 1.87 1.58 170
Enabling me to find information myself 24 hours a day
1.58 1.16 1.43 1.72 1.44 138
Improving library-use skills as a by-product of seeking assistance from library staff
1.78 1.62 1.64 1.93 1.96 116
Librarians providing help that assists in finding information needed now while improving my research skills
2.02 1.75 1.53 2.11 1.88 142
Librarians providing help that both assists in finding the information needed now, and improves skills useful in future information searches
1.68 1.71 1.16 1.99 1.73 53
Librarians teaching me how to effectively use the electronically available databases, journals, and books
2.01 1.95 1.58 1.99 1.97 54
Library orientations / instruction sessions 2.28 2.01 1.65 2.28 2.08 84 Making me aware of library resources and services
1.76 1.56 1.63 1.92 1.81 2,992
Making me aware of library services 2.05 1.90 1.44 1.80 1.73 62 Online course support (readings, links, references)
1.94 1.75 1.40 1.75 1.77 129
Resources added to library collections on request
1.45 1.30 2.01 2.35 2.22 56
Space for group / individual study and research needs
2.37 2.29 1.88 2.82 2.67 130
Space for students to study and work in groups 2.43 2.36 2.16 2.63 2.75 102 Space that facilitates quiet study 2.14 2.27 1.98 2.80 2.88 138 Teaching me how to access, evaluate, and use information
1.97 1.89 1.60 1.96 1.94 2,338
Teaching me how to locate, evaluate, and use information
2.13 1.71 1.37 1.93 1.77 142
The library collection provides information resources reflecting diverse points of view
1.68 1.46 1.42 1.74 1.70 132
Timely document delivery / interlibrary loan 1.63 1.26 1.62 1.95 1.76 467 Canadian French Question Minimum
Mean Desired
Mean Perceived
Mean Adequacy
Mean Superiority
Mean n
A library environment that is hospitable and conducive to finding and using information
7.13 8.10 7.24 0.11 -0.86 83
Ability to navigate library Web pages easily 6.95 8.19 7.02 0.07 -1.17 269 Access to equipment that is not readily available in my department, e.g., scanners, CD burners, PDAs, syncing stations
6.16 7.21 6.12 -0.04 -1.08 73
Access to photocopying and printing facilities 5.25 6.74 6.40 1.15 -0.33 72 Adequate hours of service 6.85 8.00 7.50 0.64 -0.51 204 Assuring users of the accuracy and confidentiality of their transactions
7.19 8.21 7.90 0.70 -0.31 77
Convenient business hours 6.78 7.85 7.02 0.24 -0.83 241 Ease and timeliness in getting materials from other libraries
6.86 8.18 6.89 0.02 -1.29 262
Ease of use of electronic resources 7.18 8.14 7.04 -0.13 -1.09 137 Efficient interlibrary loan / document delivery 7.14 8.52 7.57 0.43 -0.95 21

Revised 9/17/07
152
Question Minimum Mean
Desired Mean
Perceived Mean
Adequacy Mean
Superiority Mean
n
Electronic resources matching my information needs
7.19 8.51 6.25 -0.94 -2.25 63
Librarians providing help that assists in finding information needed now while improving my research skills
7.11 8.07 7.85 0.74 -0.21 107
Librarians teaching me how to effectively use the electronically available databases, journals, and books
6.89 8.10 7.15 0.27 -0.95 70
Library keeping me informed about all of its services
6.46 7.63 7.08 0.62 -0.56 104
Library orientations / instruction sessions 6.53 7.77 7.47 0.93 -0.30 43 Making me aware of library resources and services
6.49 7.66 6.95 0.46 -0.71 354
Providing search tools that permit me to work autonomously
7.29 8.41 6.76 -0.52 -1.65 63
Ready access to computers / Internet / software 6.97 8.01 7.42 0.45 -0.59 122 Resources added to library collections on request
6.78 8.22 7.17 0.39 -1.06 18
Space for students to study and work in groups 6.50 7.00 5.50 -1.00 -1.50 2 Teaching me how to access, evaluate, and use information
6.50 7.72 6.74 0.25 -0.98 426
The library program teaches me how to access, evaluate, and use information
6.00 7.30 6.76 0.76 -0.54 239
Timely document delivery / interlibrary loan 7.02 8.07 7.33 0.31 -0.74 171 Question Minimum
SD Desired
SD Perceived
SD Adequacy
SD Superiority
SD n
A library environment that is hospitable and conducive to finding and using information
1.36 0.97 1.24 1.53 1.42 83
Ability to navigate library Web pages easily 1.41 1.00 1.49 1.90 1.68 269 Access to equipment that is not readily available in my department, e.g., scanners, CD burners, PDAs, syncing stations
1.56 1.29 1.76 2.01 1.93 73
Access to photocopying and printing facilities 2.08 2.12 1.54 2.09 1.94 72 Adequate hours of service 1.41 1.00 1.23 1.53 1.38 204 Assuring users of the accuracy and confidentiality of their transactions
1.53 1.00 1.06 1.25 1.12 77
Convenient business hours 1.59 1.34 1.72 2.03 1.91 241 Ease and timeliness in getting materials from other libraries
1.37 1.03 1.55 1.93 1.71 262
Ease of use of electronic resources 1.26 0.92 1.55 1.80 1.60 137 Efficient interlibrary loan / document delivery 1.98 0.60 1.33 1.94 1.20 21 Electronic resources matching my information needs
1.23 0.93 1.72 2.15 2.16 63
Librarians providing help that assists in finding information needed now while improving my research skills
1.38 1.08 1.43 1.68 1.48 107
Librarians teaching me how to effectively use the electronically available databases, journals, and books
1.81 0.99 1.39 1.77 1.58 70
Library keeping me informed about all of its services
1.65 1.27 1.38 1.66 1.49 104
Library orientations / instruction sessions 1.72 1.43 1.42 1.86 1.49 43 Making me aware of library resources and services
1.54 1.23 1.58 2.04 1.82 354

Revised 9/17/07
153
Question Minimum SD
Desired SD
Perceived SD
Adequacy SD
Superiority SD
n
Providing search tools that permit me to work autonomously
1.36 0.78 1.49 1.69 1.58 63
Ready access to computers / Internet / software 1.54 1.15 1.35 1.83 1.42 122 Resources added to library collections on request
2.05 0.81 1.58 1.82 1.95 18
Space for students to study and work in groups 0.71 1.41 0.71 0.00 0.71 2 Teaching me how to access, evaluate, and use information
1.58 1.32 1.65 1.83 1.80 426
The library program teaches me how to access, evaluate, and use information
2.02 2.00 1.67 1.67 1.69 239
Timely document delivery / interlibrary loan 1.36 1.05 1.34 1.77 1.49 171
4.4.7 General Satisfaction Questions Summary This table displays mean score and standard deviation for each of the general satisfaction questions: Satisfaction with Treatment, Satisfaction with Support, and Satisfaction with Overall Quality of Service, where n is the number of respondents for each particular question. These scores are calculated from responses to the general satisfaction questions on the LibQUAL+® survey, in which respondents rated their levels of general satisfaction on a scale from 1-9. Unified Question Response
Mean Response
SD Respondents
(n) How would you rate the overall quality of the service provided by the library?
7.26 1.36 5,015
In general, I am satisfied with library support for my learning, research, and/or teaching needs.
7.03 1.72 5,016
In general, I am satisfied with the way in which I am treated at the library. 7.63 1.44 5,017 American English Question Response
Mean Response
SD Respondents
(n) How would you rate the overall quality of the service provided by the library?
7.25 1.38 4,294
In general, I am satisfied with library support for my learning, research, and/or teaching needs.
6.96 1.75 4,295
In general, I am satisfied with the way in which I am treated at the library. 7.61 1.47 4,296 Canadian French Question Response
Mean Response
SD Respondents
(n) How would you rate the overall quality of the service provided by the library?
7.34 1.25 721
In general, I am satisfied with library support for my learning, research, and/or teaching needs.
7.48 1.42 721
In general, I am satisfied with the way in which I am treated at the library. 7.79 1.29 721

Revised 9/17/07
154
4.4.8 Information Literacy Outcomes Questions Summary This table displays the mean score and standard deviation for each of the information literacy outcomes questions, where n is the number of respondents for each particular question. These scores are calculated from responses to the information literacy outcomes questions on the LibQUAL+® survey, in which respondents rated their levels of general satisfaction on a scale from 1-9 with 1 being "strongly disagree" and 9 representing "strongly agree". Unified Question Response
Mean Response
SD Respondents
(n) The library aids my advancement in my academic discipline.
6.83 1.79 5,017
The library enables me to be more efficient in my academic pursuits.
6.98 1.75 5,017
The library helps me distinguish between trustworthy and untrustworthy information.
5.60 2.06 5,016
The library helps me stay abreast of developments in my field(s) of interest.
6.48 1.93 5,017
The library provides me with the information skills I need in my work or study.
6.09 1.93 5,015
American English Question Response
Mean Response
SD Respondents
(n) The library aids my advancement in my academic discipline.
6.80 1.81 4,296
The library enables me to be more efficient in my academic pursuits.
6.95 1.77 4,296
The library helps me distinguish between trustworthy and untrustworthy information.
5.56 2.06 4,295
The library helps me stay abreast of developments in my field(s) of interest.
6.40 1.96 4,296
The library provides me with the information skills I need in my work or study.
6.05 1.94 4,294
Canadian French Question Response
Mean Response
SD Respondents
(n) The library aids my advancement in my academic discipline.
7.03 1.7 721
The library enables me to be more efficient in my academic pursuits.
7.14 1.61 721
The library helps me distinguish between trustworthy and untrustworthy information.
5.86 2.02 721
The library helps me stay abreast of developments in my field(s) of interest.
6.96 1.71 721
The library provides me with the information skills I need in my work or study.
6.37 1.86 721

Revised 9/17/07
155
4.4.9 Library Use Summary This chart shows a graphic representation of library use (both on the premises and electronically), as well as use of non-library information gateways such as Yahoo™ and Google™. Bars represent the frequency with which respondents report using these resources: Daily, Weekly, Monthly, Quarterly, or Never. The table below the chart displays the number and percentage of respondents who selected each option. Unified
0.00%
10.00%
20.00%
30.00%
40.00%
50.00%
60.00%
70.00%
80.00%
90.00%
100.00%
Daily Weekly Monthly Quarterly NeverFrequency
Perc
enta
ge How often do you access library resources through alibrary Web page?
How often do you use resources on library premises?
How often do you use Yahoo(TM), Google(TM), ornon-library gatew ays for information?
Question Daily Weekly Monthly Quarterly Never Total How often do you access library resources through a library Web page?
2,146 2,087 481 216 85 5,015
How often do you use resources on library premises? 310 1,831 1,588 1,073 215 5,017 How often do you use Yahoo(TM), Google(TM), or non-library gateways for information?
3,538 978 250 128 122 5,016
Question Daily Weekly Monthly Quarterly Never Total How often do you access library resources through a library Web page?
42.79% 41.62% 9.59% 4.31% 1.69% 100.00%
How often do you use resources on library premises? 6.18% 36.50% 31.65% 21.39% 4.29% 100.00% How often do you use Yahoo(TM), Google(TM), or non-library gateways for information? 70.53% 19.50% 4.98% 2.55% 2.43% 100.00%

Revised 9/17/07
156
American English
0.00%
10.00%
20.00%
30.00%
40.00%
50.00%
60.00%
70.00%
80.00%
90.00%
100.00%
Daily Weekly Monthly Quarterly NeverFrequency
Perc
enta
ge How often do you access library resources through alibrary Web page?
How often do you use resources on library premises?
How often do you use Yahoo(TM), Google(TM), ornon-library gatew ays for information?
Question Daily Weekly Monthly Quarterly Never Total
How often do you access library resources through a library Web page?
1,905 1,769 377 169 75 4,295
How often do you use resources on library premises? 278 1,576 1,362 882 199 4,297 How often do you use Yahoo(TM), Google(TM), or non-library gateways for information?
3,031 842 209 101 113 4,296
Question Daily Weekly Monthly Quarterly Never Total How often do you access library resources through a library Web page?
44.35% 41.19% 8.78% 3.93% 1.75% 100.00%
How often do you use resources on library premises? 6.47% 36.68% 31.70% 20.53% 4.63% 100.00% How often do you use Yahoo(TM), Google(TM), or non-library gateways for information?
70.55% 19.60% 4.86% 2.35% 2.63% 100.00%
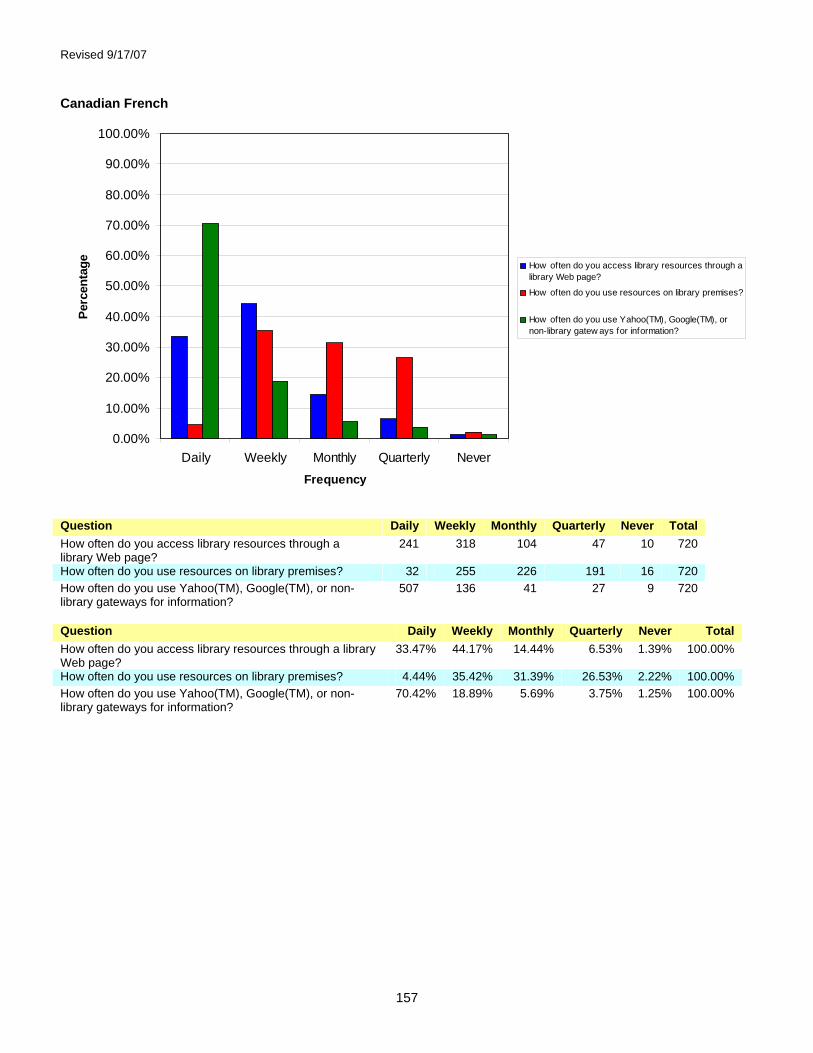
Revised 9/17/07
157
Canadian French
0.00%
10.00%
20.00%
30.00%
40.00%
50.00%
60.00%
70.00%
80.00%
90.00%
100.00%
Daily Weekly Monthly Quarterly NeverFrequency
Perc
enta
ge How often do you access library resources through alibrary Web page?
How often do you use resources on library premises?
How often do you use Yahoo(TM), Google(TM), ornon-library gatew ays for information?
Question Daily Weekly Monthly Quarterly Never Total How often do you access library resources through a library Web page?
241 318 104 47 10 720
How often do you use resources on library premises? 32 255 226 191 16 720 How often do you use Yahoo(TM), Google(TM), or non-library gateways for information?
507 136 41 27 9 720
Question Daily Weekly Monthly Quarterly Never Total How often do you access library resources through a library Web page?
33.47% 44.17% 14.44% 6.53% 1.39% 100.00%
How often do you use resources on library premises? 4.44% 35.42% 31.39% 26.53% 2.22% 100.00% How often do you use Yahoo(TM), Google(TM), or non-library gateways for information?
70.42% 18.89% 5.69% 3.75% 1.25% 100.00%

Revised 9/17/07
158
4.5 College or University Libraries - Library Staff
4.5.1 Respondent Profile by Age This table shows a breakdown of survey respondents by age; both the number of respondents (n) and the percentage of the total number of respondents represented by each group are displayed. Unified Age Group Respondents (n) Respondents % Under 18 - 0.00% 18 - 22 5 1.45% 23 - 30 44 12.79% 31 - 45 112 32.56% 46 - 65 181 52.62% Over 65 2 0.58%
Grand Total 344 100.00% American English Age Group Respondents (n) Respondents % Under 18 - 0.00% 18 - 22 5 1.88% 23 - 30 29 10.90% 31 - 45 82 30.83% 46 - 65 148 55.64% Over 65 2 0.75%
Grand Total 266 100.00% Canadian French Age Group Respondents (n) Respondents % Under 18 - 0.00% 18 - 22 - 0.00% 23 - 30 15 19.23% 31 - 45 30 38.46% 46 - 65 33 42.31% Over 65 - 0.00%
Grand Total 78 100.00%

Revised 9/17/07
159
4.5.2 Population and Respondent Profile by Sex The table below shows a breakdown of survey respondents by sex, based on user responses to the demographic questions and the demographic data provided by institutions in the online Representativeness section* . The number and percentage for each sex are given for the general population and for survey respondents. * Note: Participating institutions were not required to complete the Representativness section. When population data is missing or incomplete, it is because this data was not provided. Unified Sex Respondents (n) Respondents % Male 81 23.55% Female 263 76.45%
Total 344 100.00% American English Sex Respondents (n) Respondents % Male 61 22.93% Female 205 77.07%
Total 266 100.00% Canadian French Sex Respondents (n) Respondents % Male 20 25.64% Female 58 74.36%
Total 78 100.00%

Revised 9/17/07
160
4.5.3 Core Question Summary This radar chart shows aggregate results for the core survey questions. Each axis represents one question. A code to identify each question is displayed at the outer point of each axis. While questions for each dimension of library service quality are scattered randomly throughout the survey, on this chart they are grouped into sections: Affect of Service, Library as Place, and Information Control. On each axis, respondents' minimum, desired, and perceived levels of service quality are plotted, and the resulting "gaps" between the three levels (representing service adequacy or service superiority) are shaded in blue, yellow, green, and red. The two following tables show mean scores and standard deviations for each question, where n is the number of respondents for each particular question. (For a more detailed explanation of the headings, see the Introduction to this notebook.) Unified
Perceived Less Than Minimum Perceived Less Than Desired Perceived Greater than Minimum Perceived Greater than Desired
Question Minimum
Mean Desired
Mean Perceived
Mean Adequacy
Mean Superiority
Mean n
AS-1 Employees who instill confidence in users 6.58 8.10 7.06 0.48 -1.04 335 AS-2 Giving users individual attention 6.68 7.82 7.13 0.46 -0.68 336 AS-3 Employees who are consistently courteous 7.47 8.37 7.48 0.02 -0.89 341
3
4
5
6
7
8
9AS-6
AS-5
AS-4
AS-3
AS-2
AS-1
LP-5
LP-4
LP-3
LP-2
LP-1IC-8
IC-7
IC-6
IC-5
IC-4
IC-3
IC-2
IC-1
AS-9
AS-8
AS-7

Revised 9/17/07
161
Question Minimum Mean
Desired Mean
Perceived Mean
Adequacy Mean
Superiority Mean
n
AS-4 Readiness to respond to users' questions 7.23 8.29 7.55 0.32 -0.74 336 AS-5 Employees who have the knowledge to
answer user questions 7.23 8.33 7.52 0.29 -0.82 336
AS-6 Employees who deal with users in a caring fashion
7.04 8.20 7.38 0.34 -0.82 335
AS-7 Employees who understand the needs of their users
7.17 8.31 7.41 0.24 -0.90 335
AS-8 Willingness to help users 7.30 8.40 7.65 0.34 -0.75 338 AS-9 Dependability in handling users' service
problems 7.07 8.19 7.30 0.23 -0.89 330
IC-1 Making electronic resources accessible from my home or office
7.05 8.26 7.53 0.48 -0.73 330
IC-2 A library Web site enabling me to locate information on my own
7.06 8.23 6.89 -0.18 -1.35 342
IC-3 The printed library materials I need for my work
6.85 8.00 6.90 0.05 -1.10 320
IC-4 The electronic information resources I need 6.98 8.11 7.26 0.29 -0.85 331 IC-5 Modern equipment that lets me easily
access needed information 7.15 8.25 7.10 -0.05 -1.15 343
IC-6 Easy-to-use access tools that allow me to find things on my own
7.07 8.23 7.04 -0.03 -1.19 341
IC-7 Making information easily accessible for independent use
7.04 8.23 7.20 0.16 -1.03 342
IC-8 Print and/or electronic journal collections I require for my work
7.07 8.23 7.25 0.18 -0.99 314
LP-1 Library space that inspires study and learning
6.67 8.03 6.17 -0.50 -1.86 331
LP-2 Quiet space for individual activities 6.82 7.89 6.28 -0.54 -1.60 323 LP-3 A comfortable and inviting location 6.76 8.09 6.56 -0.20 -1.53 334 LP-4 A getaway for study, learning, or research 6.72 7.93 6.83 0.11 -1.11 323 LP-5 Community space for group learning and
group study 6.25 7.45 6.25 0.00 -1.20 313
Grand Total 6.97 8.13 7.08 0.11 -1.06 332 Question Minimum
SD Desired
SD Perceived
SD Adequacy
SD Superiority
SD n
AS-1 Employees who instill confidence in users 1.46 1.14 1.25 1.59 1.38 335 AS-2 Giving users individual attention 1.41 1.20 1.32 1.58 1.47 336 AS-3 Employees who are consistently courteous 1.38 0.95 1.23 1.58 1.39 341 AS-4 Readiness to respond to users' questions 1.29 0.91 1.06 1.40 1.18 336 AS-5 Employees who have the knowledge to answer
user questions 1.25 0.90 1.08 1.46 1.28 336
AS-6 Employees who deal with users in a caring fashion
1.38 1.02 1.23 1.58 1.33 335
AS-7 Employees who understand the needs of their users
1.30 0.87 1.14 1.45 1.30 335
AS-8 Willingness to help users 1.32 0.88 1.18 1.47 1.29 338 AS-9 Dependability in handling users' service
problems 1.32 0.96 1.23 1.50 1.32 330
IC-1 Making electronic resources accessible from my home or office
1.50 1.10 1.17 1.43 1.30 330
IC-2 A library Web site enabling me to locate information on my own
1.39 1.10 1.46 1.71 1.59 342
IC-3 The printed library materials I need for my work
1.30 1.14 1.39 1.63 1.50 320
IC-4 The electronic information resources I need 1.35 1.17 1.23 1.36 1.24 331

Revised 9/17/07
162
Question Minimum SD
Desired SD
Perceived SD
Adequacy SD
Superiority SD
n
IC-5 Modern equipment that lets me easily access needed information
1.30 1.08 1.42 1.72 1.53 343
IC-6 Easy-to-use access tools that allow me to find things on my own
1.24 1.01 1.22 1.51 1.38 341
IC-7 Making information easily accessible for independent use
1.30 0.99 1.12 1.37 1.25 342
IC-8 Print and/or electronic journal collections I require for my work
1.31 1.00 1.18 1.49 1.28 314
LP-1 Library space that inspires study and learning 1.46 1.21 1.66 2.11 2.02 331 LP-2 Quiet space for individual activities 1.49 1.34 1.82 2.06 2.09 323 LP-3 A comfortable and inviting location 1.38 1.11 1.58 1.90 1.81 334 LP-4 A getaway for study, learning, or research 1.50 1.28 1.42 1.72 1.67 323 LP-5 Community space for group learning and
group study 1.74 1.67 1.77 2.11 2.03 313
Grand Total 1.38 1.09 1.33 1.62 1.48 332 American English
Perceived Less Than Minimum Perceived Less Than Desired Perceived Greater than Minimum Perceived Greater than Desired
Question Minimum
Mean Desired
Mean Perceived
Mean Adequacy
Mean Superiority
Mean n
AS-1 Employees who instill confidence in users 6.55 8.07 6.86 0.32 -1.2 259 AS-2 Giving users individual attention 6.73 7.89 7.07 0.34 -0.82 259 AS-3 Employees who are consistently courteous 7.53 8.39 7.42 -0.11 -0.96 264 AS-4 Readiness to respond to users' questions 7.31 8.37 7.54 0.23 -0.83 259
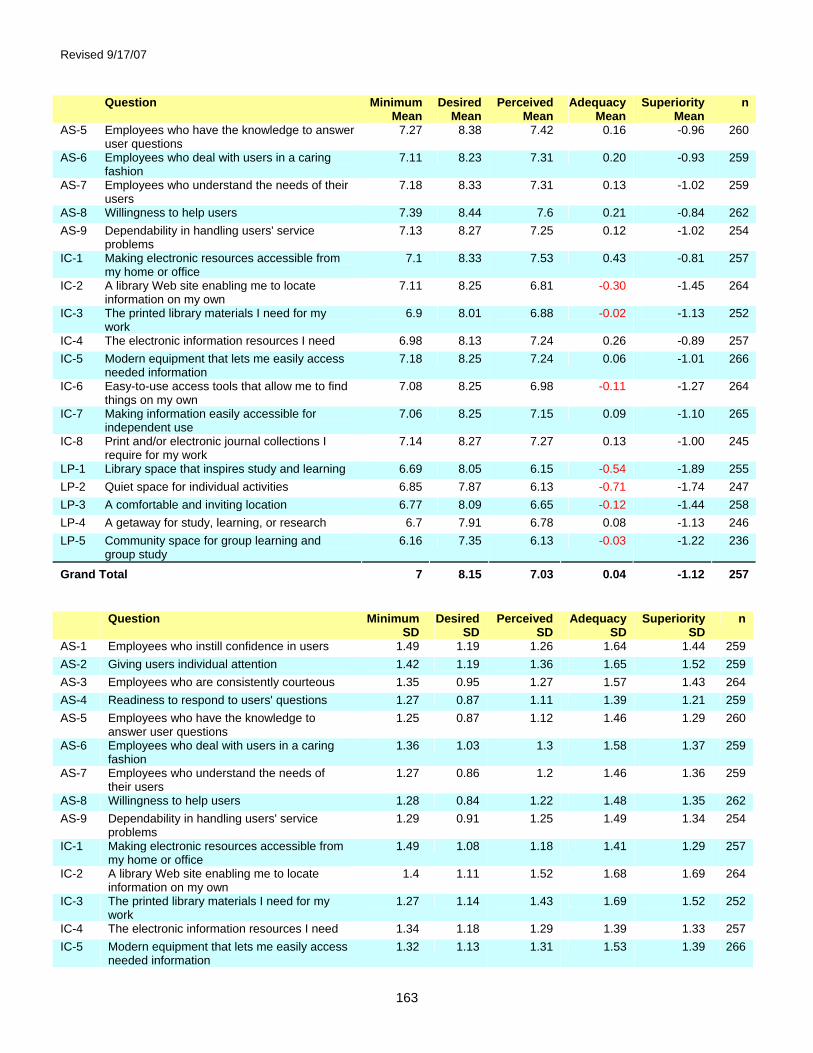
Revised 9/17/07
163
Question Minimum Mean
Desired Mean
Perceived Mean
Adequacy Mean
Superiority Mean
n
AS-5 Employees who have the knowledge to answer user questions
7.27 8.38 7.42 0.16 -0.96 260
AS-6 Employees who deal with users in a caring fashion
7.11 8.23 7.31 0.20 -0.93 259
AS-7 Employees who understand the needs of their users
7.18 8.33 7.31 0.13 -1.02 259
AS-8 Willingness to help users 7.39 8.44 7.6 0.21 -0.84 262 AS-9 Dependability in handling users' service
problems 7.13 8.27 7.25 0.12 -1.02 254
IC-1 Making electronic resources accessible from my home or office
7.1 8.33 7.53 0.43 -0.81 257
IC-2 A library Web site enabling me to locate information on my own
7.11 8.25 6.81 -0.30 -1.45 264
IC-3 The printed library materials I need for my work
6.9 8.01 6.88 -0.02 -1.13 252
IC-4 The electronic information resources I need 6.98 8.13 7.24 0.26 -0.89 257 IC-5 Modern equipment that lets me easily access
needed information 7.18 8.25 7.24 0.06 -1.01 266
IC-6 Easy-to-use access tools that allow me to find things on my own
7.08 8.25 6.98 -0.11 -1.27 264
IC-7 Making information easily accessible for independent use
7.06 8.25 7.15 0.09 -1.10 265
IC-8 Print and/or electronic journal collections I require for my work
7.14 8.27 7.27 0.13 -1.00 245
LP-1 Library space that inspires study and learning 6.69 8.05 6.15 -0.54 -1.89 255 LP-2 Quiet space for individual activities 6.85 7.87 6.13 -0.71 -1.74 247 LP-3 A comfortable and inviting location 6.77 8.09 6.65 -0.12 -1.44 258 LP-4 A getaway for study, learning, or research 6.7 7.91 6.78 0.08 -1.13 246 LP-5 Community space for group learning and
group study 6.16 7.35 6.13 -0.03 -1.22 236
Grand Total 7 8.15 7.03 0.04 -1.12 257 Question Minimum
SD Desired
SD Perceived
SD Adequacy
SD Superiority
SD n
AS-1 Employees who instill confidence in users 1.49 1.19 1.26 1.64 1.44 259 AS-2 Giving users individual attention 1.42 1.19 1.36 1.65 1.52 259 AS-3 Employees who are consistently courteous 1.35 0.95 1.27 1.57 1.43 264 AS-4 Readiness to respond to users' questions 1.27 0.87 1.11 1.39 1.21 259 AS-5 Employees who have the knowledge to
answer user questions 1.25 0.87 1.12 1.46 1.29 260
AS-6 Employees who deal with users in a caring fashion
1.36 1.03 1.3 1.58 1.37 259
AS-7 Employees who understand the needs of their users
1.27 0.86 1.2 1.46 1.36 259
AS-8 Willingness to help users 1.28 0.84 1.22 1.48 1.35 262 AS-9 Dependability in handling users' service
problems 1.29 0.91 1.25 1.49 1.34 254
IC-1 Making electronic resources accessible from my home or office
1.49 1.08 1.18 1.41 1.29 257
IC-2 A library Web site enabling me to locate information on my own
1.4 1.11 1.52 1.68 1.69 264
IC-3 The printed library materials I need for my work
1.27 1.14 1.43 1.69 1.52 252
IC-4 The electronic information resources I need 1.34 1.18 1.29 1.39 1.33 257 IC-5 Modern equipment that lets me easily access
needed information 1.32 1.13 1.31 1.53 1.39 266

Revised 9/17/07
164
Question Minimum SD
Desired SD
Perceived SD
Adequacy SD
Superiority SD
n
IC-6 Easy-to-use access tools that allow me to find things on my own
1.22 1.02 1.26 1.52 1.44 264
IC-7 Making information easily accessible for independent use
1.31 1.02 1.19 1.33 1.28 265
IC-8 Print and/or electronic journal collections I require for my work
1.26 0.99 1.17 1.48 1.32 245
LP-1 Library space that inspires study and learning 1.44 1.24 1.65 2.07 2.04 255 LP-2 Quiet space for individual activities 1.48 1.4 1.85 2.08 2.2 247 LP-3 A comfortable and inviting location 1.37 1.15 1.59 1.86 1.82 258 LP-4 A getaway for study, learning, or research 1.51 1.34 1.46 1.77 1.78 246 LP-5 Community space for group learning and
group study 1.81 1.82 1.78 2.09 2.12 236
Grand Total 1.37 1.11 1.35 1.62 1.52 257 Canadian French
Perceived Less Than Minimum Perceived Less Than Desired Perceived Greater than Minimum Perceived Greater than Desired
Question Minimum
Mean Desired
Mean Perceived
Mean Adequacy
Mean Superiority
Mean n
AS-1 Employees who instill confidence in users 6.67 8.2 7.72 1.05 -0.47 76 AS-2 Giving users individual attention 6.51 7.56 7.34 0.83 -0.22 77 AS-3 Employees who are consistently courteous 7.25 8.31 7.69 0.44 -0.62 77 AS-4 Readiness to respond to users' questions 6.95 8.01 7.58 0.64 -0.43 77 AS-5 Employees who have the knowledge to
answer user questions 7.09 8.16 7.84 0.75 -0.32 76
AS-6 Employees who deal with users in a caring fashion
6.79 8.11 7.63 0.84 -0.47 76
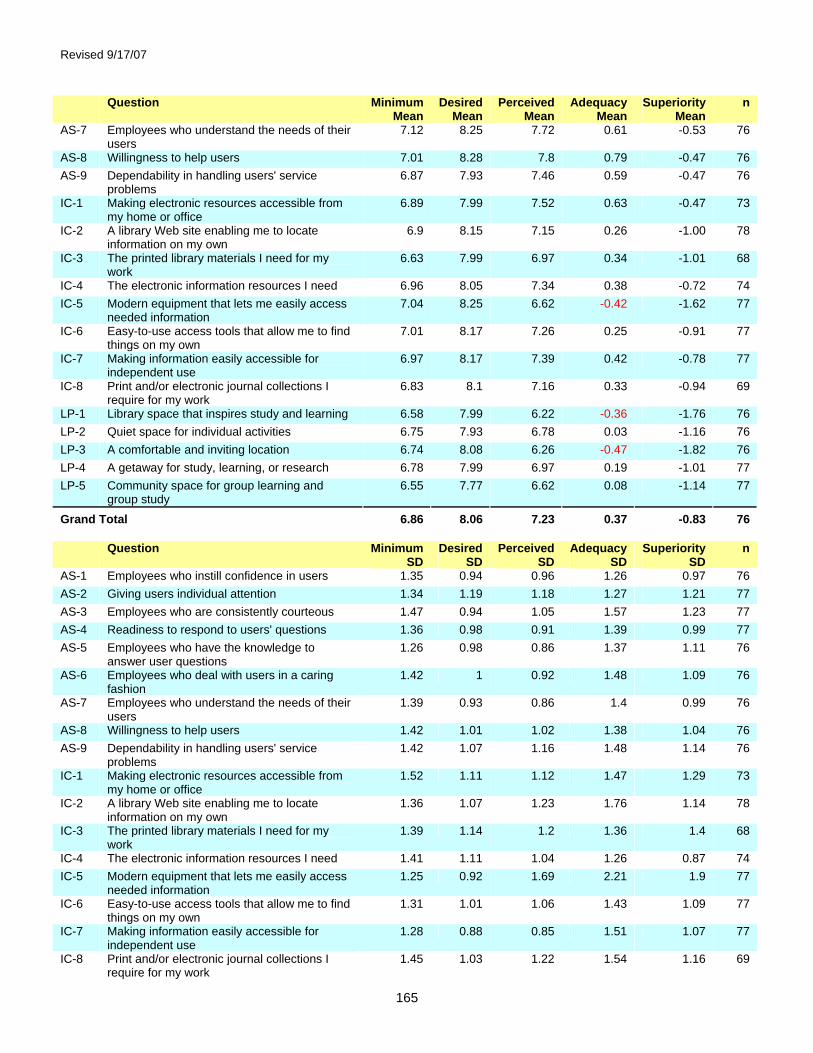
Revised 9/17/07
165
Question Minimum Mean
Desired Mean
Perceived Mean
Adequacy Mean
Superiority Mean
n
AS-7 Employees who understand the needs of their users
7.12 8.25 7.72 0.61 -0.53 76
AS-8 Willingness to help users 7.01 8.28 7.8 0.79 -0.47 76 AS-9 Dependability in handling users' service
problems 6.87 7.93 7.46 0.59 -0.47 76
IC-1 Making electronic resources accessible from my home or office
6.89 7.99 7.52 0.63 -0.47 73
IC-2 A library Web site enabling me to locate information on my own
6.9 8.15 7.15 0.26 -1.00 78
IC-3 The printed library materials I need for my work
6.63 7.99 6.97 0.34 -1.01 68
IC-4 The electronic information resources I need 6.96 8.05 7.34 0.38 -0.72 74 IC-5 Modern equipment that lets me easily access
needed information 7.04 8.25 6.62 -0.42 -1.62 77
IC-6 Easy-to-use access tools that allow me to find things on my own
7.01 8.17 7.26 0.25 -0.91 77
IC-7 Making information easily accessible for independent use
6.97 8.17 7.39 0.42 -0.78 77
IC-8 Print and/or electronic journal collections I require for my work
6.83 8.1 7.16 0.33 -0.94 69
LP-1 Library space that inspires study and learning 6.58 7.99 6.22 -0.36 -1.76 76 LP-2 Quiet space for individual activities 6.75 7.93 6.78 0.03 -1.16 76 LP-3 A comfortable and inviting location 6.74 8.08 6.26 -0.47 -1.82 76 LP-4 A getaway for study, learning, or research 6.78 7.99 6.97 0.19 -1.01 77 LP-5 Community space for group learning and
group study 6.55 7.77 6.62 0.08 -1.14 77
Grand Total 6.86 8.06 7.23 0.37 -0.83 76 Question Minimum
SD Desired
SD Perceived
SD Adequacy
SD Superiority
SD n
AS-1 Employees who instill confidence in users 1.35 0.94 0.96 1.26 0.97 76 AS-2 Giving users individual attention 1.34 1.19 1.18 1.27 1.21 77 AS-3 Employees who are consistently courteous 1.47 0.94 1.05 1.57 1.23 77 AS-4 Readiness to respond to users' questions 1.36 0.98 0.91 1.39 0.99 77 AS-5 Employees who have the knowledge to
answer user questions 1.26 0.98 0.86 1.37 1.11 76
AS-6 Employees who deal with users in a caring fashion
1.42 1 0.92 1.48 1.09 76
AS-7 Employees who understand the needs of their users
1.39 0.93 0.86 1.4 0.99 76
AS-8 Willingness to help users 1.42 1.01 1.02 1.38 1.04 76 AS-9 Dependability in handling users' service
problems 1.42 1.07 1.16 1.48 1.14 76
IC-1 Making electronic resources accessible from my home or office
1.52 1.11 1.12 1.47 1.29 73
IC-2 A library Web site enabling me to locate information on my own
1.36 1.07 1.23 1.76 1.14 78
IC-3 The printed library materials I need for my work
1.39 1.14 1.2 1.36 1.4 68
IC-4 The electronic information resources I need 1.41 1.11 1.04 1.26 0.87 74 IC-5 Modern equipment that lets me easily access
needed information 1.25 0.92 1.69 2.21 1.9 77
IC-6 Easy-to-use access tools that allow me to find things on my own
1.31 1.01 1.06 1.43 1.09 77
IC-7 Making information easily accessible for independent use
1.28 0.88 0.85 1.51 1.07 77
IC-8 Print and/or electronic journal collections I require for my work
1.45 1.03 1.22 1.54 1.16 69
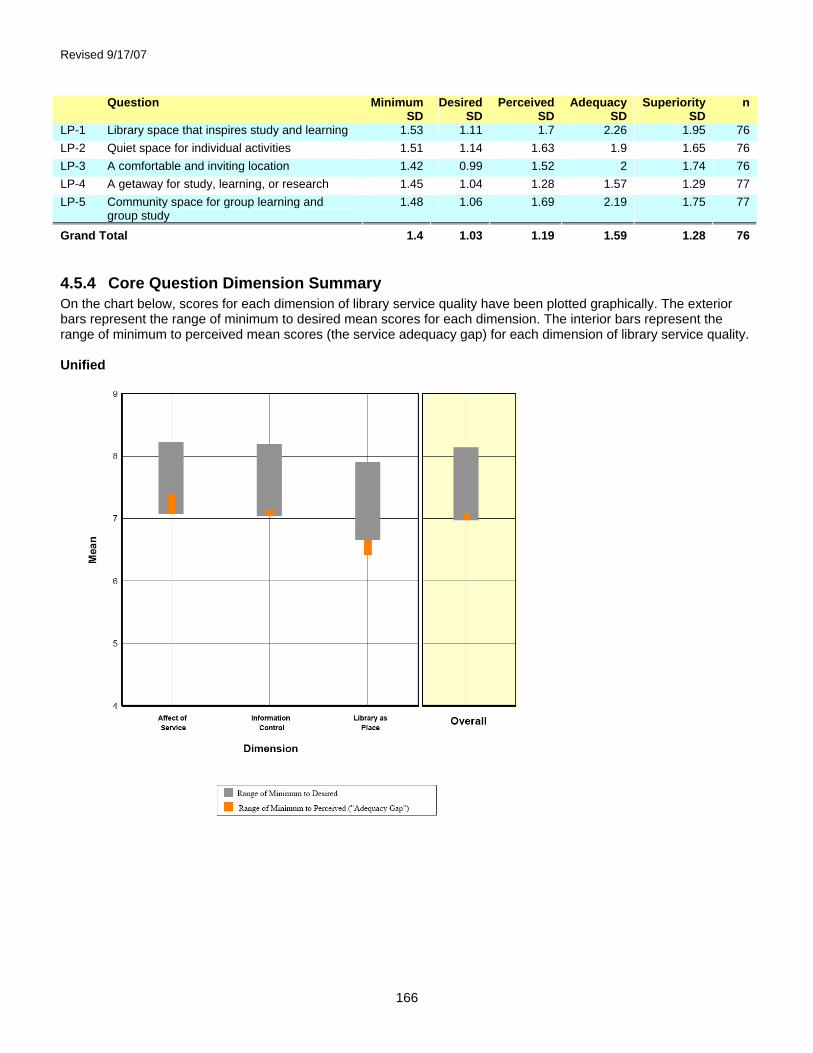
Revised 9/17/07
166
Question Minimum SD
Desired SD
Perceived SD
Adequacy SD
Superiority SD
n
LP-1 Library space that inspires study and learning 1.53 1.11 1.7 2.26 1.95 76 LP-2 Quiet space for individual activities 1.51 1.14 1.63 1.9 1.65 76 LP-3 A comfortable and inviting location 1.42 0.99 1.52 2 1.74 76 LP-4 A getaway for study, learning, or research 1.45 1.04 1.28 1.57 1.29 77 LP-5 Community space for group learning and
group study 1.48 1.06 1.69 2.19 1.75 77
Grand Total 1.4 1.03 1.19 1.59 1.28 76
4.5.4 Core Question Dimension Summary On the chart below, scores for each dimension of library service quality have been plotted graphically. The exterior bars represent the range of minimum to desired mean scores for each dimension. The interior bars represent the range of minimum to perceived mean scores (the service adequacy gap) for each dimension of library service quality. Unified

Revised 9/17/07
167
This table shows mean standard deviations for each of the local questions added by the individual library or consortium, where n is the number of respondents for each particular question. (For a more detailed explanation of the headings, see the Introduction to this notebook.)
American English

Revised 9/17/07
168
This table shows mean standard deviations for each of the local questions added by the individual library or consortium, where n is the number of respondents for each particular question. (For a more detailed explanation of the headings, see the Introduction to this notebook.)
Canadian French

Revised 9/17/07
169
This table shows mean standard deviations for each of the local questions added by the individual library or consortium, where n is the number of respondents for each particular question. (For a more detailed explanation of the headings, see the Introduction to this notebook.)
4.5.5 Local Questions Summary This table shows mean scores for each of the local questions added by the individual library or consortium, where n is the number of respondents for each particular question. (For a more detailed explanation of the headings, see the Introduction to this notebook.) Unified Question Minimum
Mean Desired
Mean Perceived
Mean Adequacy
Mean Superiority
Mean n
A library environment that is hospitable and conducive to finding and using information
6.33 8.67 5.00 -1.33 -3.67 3
A secure and safe place 7.58 8.06 7.08 -0.50 -0.98 48 Ability to navigate library Web pages easily 6.99 8.15 6.55 -0.44 -1.59 212 Access to equipment that is not readily available in my department, e.g., scanners, CD burners, PDAs, syncing stations
6.37 7.46 6.67 0.30 -0.78 46
Access to photocopying and printing facilities 7.00 8.33 6.00 -1.00 -2.33 3 Access to rare and historical materials 6.13 7.50 6.50 0.38 -1.00 8 Adequate hours of service 7.02 8.04 7.64 0.62 -0.40 144 Assuring users of the accuracy and confidentiality of their transactions
4.00 9.00 9.00 5.00 0.00 1
Availability of subject specialist assistance 6.92 7.83 7.67 0.75 -0.17 12 Comprehensive collections of fulltext articles online
7.38 8.88 7.38 0.00 -1.50 8
Convenient business hours 7.11 8.05 7.26 0.16 -0.79 19 Convenient service hours 6.00 7.00 9.00 3.00 2.00 1 Ease and timeliness in getting materials from other libraries
6.81 8.14 7.38 0.57 -0.76 146
Ease of use of electronic resources 6.85 7.85 7.00 0.15 -0.85 27

Revised 9/17/07
170
Question Minimum Mean
Desired Mean
Perceived Mean
Adequacy Mean
Superiority Mean
n
Efficient interlibrary loan / document delivery 8.00 8.50 7.50 -0.50 -1.00 2 Electronic resources matching my information needs
6.34 7.76 6.66 0.31 -1.10 67
Enabling me to find information myself 24 hours a day
7.19 8.13 8.00 0.81 -0.13 16
Improving library-use skills as a by-product of seeking assistance from library staff
6.00 7.00 6.50 0.50 -0.50 2
Librarians providing help that assists in finding information needed now while improving my research skills
7.21 8.15 8.21 1.00 0.05 39
Librarians providing help that both assists in finding the information needed now, and improves skills useful in future information searches
9.00 9.00 6.00 -3.00 -3.00 1
Librarians teaching me how to effectively use the electronically available databases, journals, and books
6.82 8.55 7.77 0.95 -0.77 22
Library keeping me informed about all of its services
5.00 7.50 5.50 0.50 -2.00 2
Library orientations / instruction sessions 6.65 7.82 7.47 0.82 -0.35 34 Making me aware of library resources and services
6.70 7.88 6.72 0.02 -1.16 165
Making me aware of library services 6.00 7.00 6.50 0.50 -0.50 2 Online course support (readings, links, references)
5.00 8.00 6.00 1.00 -2.00 2
Providing search tools that permit me to work autonomously
6.30 7.83 7.13 0.83 -0.70 23
Ready access to computers / Internet / software 7.03 8.07 7.72 0.69 -0.34 29 Resources added to library collections on request
6.50 7.00 7.00 0.50 0.00 2
Space for group / individual study and research needs
6.74 7.64 5.55 -1.19 -2.10 42
Space for students to study and work in groups 6.68 7.89 6.11 -0.58 -1.79 19 Space that facilitates quiet study 6.59 7.61 5.30 -1.30 -2.32 44 Teaching me how to access, evaluate, and use information
6.54 7.88 6.98 0.44 -0.90 192
Teaching me how to locate, evaluate, and use information
6.89 8.11 7.00 0.11 -1.11 9
The library collection provides information resources reflecting diverse points of view
7.33 7.93 7.53 0.20 -0.40 15
Timely document delivery / interlibrary loan 6.94 8.25 7.81 0.88 -0.44 16
Timely document delivery/interlibrary loan 7.08 8.00 7.77 0.69 -0.23 26 Question Minimum
SD Desired
SD Perceived
SD Adequacy
SD Superiority
SD n
A library environment that is hospitable and conducive to finding and using information
1.15 0.58 0.00 1.15 0.58 3
A secure and safe place 1.56 1.37 1.58 1.79 1.38 48 Ability to navigate library Web pages easily 1.35 1.25 1.57 1.74 1.70 212 Access to equipment that is not readily available in my department, e.g., scanners, CD burners, PDAs, syncing stations
1.50 1.63 1.79 1.43 1.36 46
Access to photocopying and printing facilities 0.00 0.58 2.00 2.00 2.08 3 Access to rare and historical materials 2.03 0.93 0.53 1.77 0.93 8 Adequate hours of service 1.29 1.04 1.25 1.54 1.44 144
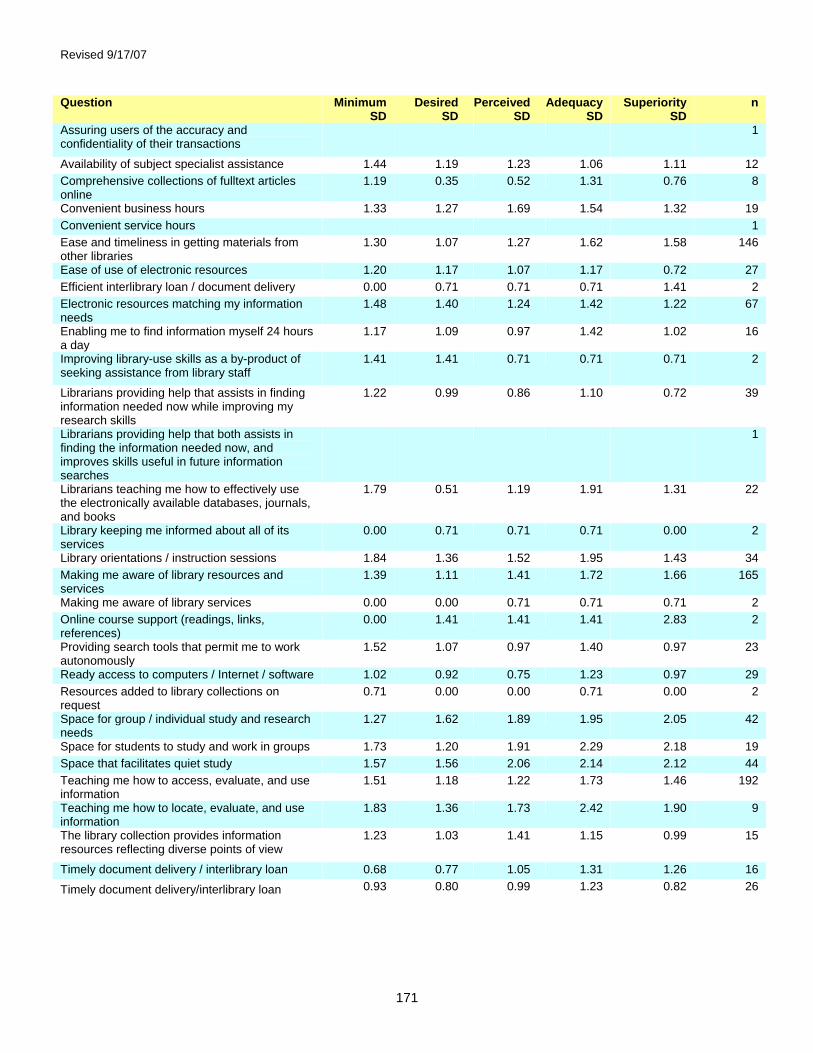
Revised 9/17/07
171
Question Minimum SD
Desired SD
Perceived SD
Adequacy SD
Superiority SD
n
Assuring users of the accuracy and confidentiality of their transactions
1
Availability of subject specialist assistance 1.44 1.19 1.23 1.06 1.11 12 Comprehensive collections of fulltext articles online
1.19 0.35 0.52 1.31 0.76 8
Convenient business hours 1.33 1.27 1.69 1.54 1.32 19 Convenient service hours 1 Ease and timeliness in getting materials from other libraries
1.30 1.07 1.27 1.62 1.58 146
Ease of use of electronic resources 1.20 1.17 1.07 1.17 0.72 27 Efficient interlibrary loan / document delivery 0.00 0.71 0.71 0.71 1.41 2 Electronic resources matching my information needs
1.48 1.40 1.24 1.42 1.22 67
Enabling me to find information myself 24 hours a day
1.17 1.09 0.97 1.42 1.02 16
Improving library-use skills as a by-product of seeking assistance from library staff
1.41 1.41 0.71 0.71 0.71 2
Librarians providing help that assists in finding information needed now while improving my research skills
1.22 0.99 0.86 1.10 0.72 39
Librarians providing help that both assists in finding the information needed now, and improves skills useful in future information searches
1
Librarians teaching me how to effectively use the electronically available databases, journals, and books
1.79 0.51 1.19 1.91 1.31 22
Library keeping me informed about all of its services
0.00 0.71 0.71 0.71 0.00 2
Library orientations / instruction sessions 1.84 1.36 1.52 1.95 1.43 34 Making me aware of library resources and services
1.39 1.11 1.41 1.72 1.66 165
Making me aware of library services 0.00 0.00 0.71 0.71 0.71 2 Online course support (readings, links, references)
0.00 1.41 1.41 1.41 2.83 2
Providing search tools that permit me to work autonomously
1.52 1.07 0.97 1.40 0.97 23
Ready access to computers / Internet / software 1.02 0.92 0.75 1.23 0.97 29 Resources added to library collections on request
0.71 0.00 0.00 0.71 0.00 2
Space for group / individual study and research needs
1.27 1.62 1.89 1.95 2.05 42
Space for students to study and work in groups 1.73 1.20 1.91 2.29 2.18 19 Space that facilitates quiet study 1.57 1.56 2.06 2.14 2.12 44 Teaching me how to access, evaluate, and use information
1.51 1.18 1.22 1.73 1.46 192
Teaching me how to locate, evaluate, and use information
1.83 1.36 1.73 2.42 1.90 9
The library collection provides information resources reflecting diverse points of view
1.23 1.03 1.41 1.15 0.99 15
Timely document delivery / interlibrary loan 0.68 0.77 1.05 1.31 1.26 16
Timely document delivery/interlibrary loan 0.93 0.80 0.99 1.23 0.82 26
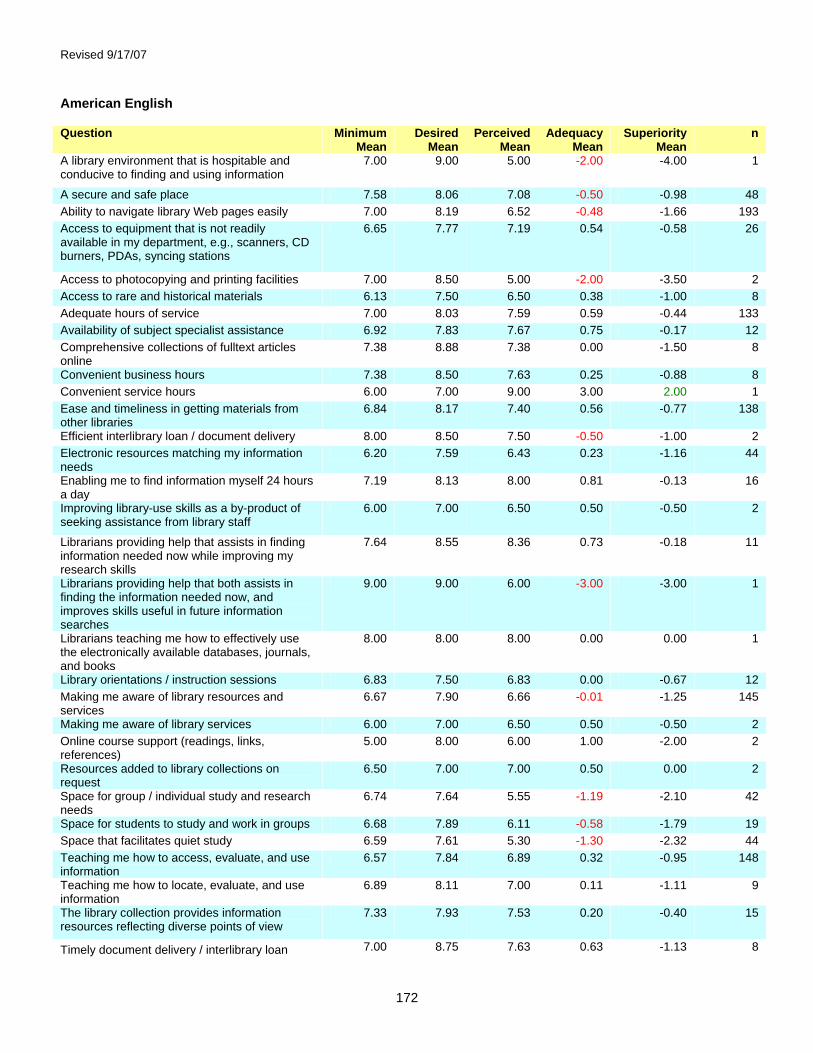
Revised 9/17/07
172
American English Question Minimum
Mean Desired
Mean Perceived
Mean Adequacy
Mean Superiority
Mean n
A library environment that is hospitable and conducive to finding and using information
7.00 9.00 5.00 -2.00 -4.00 1
A secure and safe place 7.58 8.06 7.08 -0.50 -0.98 48 Ability to navigate library Web pages easily 7.00 8.19 6.52 -0.48 -1.66 193 Access to equipment that is not readily available in my department, e.g., scanners, CD burners, PDAs, syncing stations
6.65 7.77 7.19 0.54 -0.58 26
Access to photocopying and printing facilities 7.00 8.50 5.00 -2.00 -3.50 2 Access to rare and historical materials 6.13 7.50 6.50 0.38 -1.00 8 Adequate hours of service 7.00 8.03 7.59 0.59 -0.44 133 Availability of subject specialist assistance 6.92 7.83 7.67 0.75 -0.17 12 Comprehensive collections of fulltext articles online
7.38 8.88 7.38 0.00 -1.50 8
Convenient business hours 7.38 8.50 7.63 0.25 -0.88 8 Convenient service hours 6.00 7.00 9.00 3.00 2.00 1 Ease and timeliness in getting materials from other libraries
6.84 8.17 7.40 0.56 -0.77 138
Efficient interlibrary loan / document delivery 8.00 8.50 7.50 -0.50 -1.00 2 Electronic resources matching my information needs
6.20 7.59 6.43 0.23 -1.16 44
Enabling me to find information myself 24 hours a day
7.19 8.13 8.00 0.81 -0.13 16
Improving library-use skills as a by-product of seeking assistance from library staff
6.00 7.00 6.50 0.50 -0.50 2
Librarians providing help that assists in finding information needed now while improving my research skills
7.64 8.55 8.36 0.73 -0.18 11
Librarians providing help that both assists in finding the information needed now, and improves skills useful in future information searches
9.00 9.00 6.00 -3.00 -3.00 1
Librarians teaching me how to effectively use the electronically available databases, journals, and books
8.00 8.00 8.00 0.00 0.00 1
Library orientations / instruction sessions 6.83 7.50 6.83 0.00 -0.67 12 Making me aware of library resources and services
6.67 7.90 6.66 -0.01 -1.25 145
Making me aware of library services 6.00 7.00 6.50 0.50 -0.50 2 Online course support (readings, links, references)
5.00 8.00 6.00 1.00 -2.00 2
Resources added to library collections on request
6.50 7.00 7.00 0.50 0.00 2
Space for group / individual study and research needs
6.74 7.64 5.55 -1.19 -2.10 42
Space for students to study and work in groups 6.68 7.89 6.11 -0.58 -1.79 19 Space that facilitates quiet study 6.59 7.61 5.30 -1.30 -2.32 44 Teaching me how to access, evaluate, and use information
6.57 7.84 6.89 0.32 -0.95 148
Teaching me how to locate, evaluate, and use information
6.89 8.11 7.00 0.11 -1.11 9
The library collection provides information resources reflecting diverse points of view
7.33 7.93 7.53 0.20 -0.40 15
Timely document delivery / interlibrary loan 7.00 8.75 7.63 0.63 -1.13 8

Revised 9/17/07
173
Question Minimum SD
Desired SD
Perceived SD
Adequacy SD
Superiority SD
n
A library environment that is hospitable and conducive to finding and using information
1
A secure and safe place 1.56 1.37 1.58 1.79 1.38 48 Ability to navigate library Web pages easily 1.36 1.25 1.60 1.79 1.73 193 Access to equipment that is not readily available in my department, e.g., scanners, CD burners, PDAs, syncing stations
1.50 1.50 1.83 1.42 1.53 26
Access to photocopying and printing facilities 0.00 0.71 1.41 1.41 0.71 2 Access to rare and historical materials 2.03 0.93 0.53 1.77 0.93 8 Adequate hours of service 1.30 1.07 1.28 1.54 1.47 133 Availability of subject specialist assistance 1.44 1.19 1.23 1.06 1.11 12 Comprehensive collections of fulltext articles online
1.19 0.35 0.52 1.31 0.76 8
Convenient business hours 1.19 0.53 0.92 1.67 0.99 8 Convenient service hours 1 Ease and timeliness in getting materials from other libraries
1.29 1.01 1.26 1.58 1.54 138
Efficient interlibrary loan / document delivery 0.00 0.71 0.71 0.71 1.41 2 Electronic resources matching my information needs
1.39 1.54 1.25 1.38 1.36 44
Enabling me to find information myself 24 hours a day
1.17 1.09 0.97 1.42 1.02 16
Improving library-use skills as a by-product of seeking assistance from library staff
1.41 1.41 0.71 0.71 0.71 2
Librarians providing help that assists in finding information needed now while improving my research skills
1.36 0.69 0.67 1.19 0.60 11
Librarians providing help that both assists in finding the information needed now, and improves skills useful in future information searches
1
Librarians teaching me how to effectively use the electronically available databases, journals, and books
1
Library orientations / instruction sessions 1.80 1.68 1.85 2.30 2.15 12 Making me aware of library resources and services
1.40 1.10 1.42 1.72 1.65 145
Making me aware of library services 0.00 0.00 0.71 0.71 0.71 2 Online course support (readings, links, references)
0.00 1.41 1.41 1.41 2.83 2
Resources added to library collections on request
0.71 0.00 0.00 0.71 0.00 2
Space for group / individual study and research needs
1.27 1.62 1.89 1.95 2.05 42
Space for students to study and work in groups 1.73 1.20 1.91 2.29 2.18 19 Space that facilitates quiet study 1.57 1.56 2.06 2.14 2.12 44 Teaching me how to access, evaluate, and use information
1.48 1.20 1.24 1.70 1.56 148
Teaching me how to locate, evaluate, and use information
1.83 1.36 1.73 2.42 1.90 9
The library collection provides information resources reflecting diverse points of view
1.23 1.03 1.41 1.15 0.99 15
Timely document delivery / interlibrary loan 0.93 0.46 1.30 1.69 1.13 8

Revised 9/17/07
174
Canadian French Question Minimum
Mean Desired
Mean Perceived
Mean Adequacy
Mean Superiority
Mean n
A library environment that is hospitable and conducive to finding and using information
6.00 8.50 5.00 -1.00 -3.50 2
Ability to navigate library Web pages easily 6.87 7.72 6.82 -0.05 -0.89 19 Access to equipment that is not readily available in my department, e.g., scanners, CD burners, PDAs, syncing stations
6.00 7.05 6.00 0.00 -1.05 20
Access to photocopying and printing facilities 7.00 8.00 8.00 1.00 0.00 1 Adequate hours of service 7.27 8.18 8.18 0.91 0.00 11 Assuring users of the accuracy and confidentiality of their transactions
4.00 9.00 9.00 5.00 0.00 1
Convenient business hours 6.91 7.73 7.00 0.09 -0.73 11 Ease and timeliness in getting materials from other libraries
6.25 7.63 7.00 0.75 -0.63 8
Ease of use of electronic resources 6.85 7.85 7.00 0.15 -0.85 27 Electronic resources matching my information needs
6.61 8.09 7.09 0.48 -1.00 23
Librarians providing help that assists in finding information needed now while improving my research skills
7.04 8.00 8.14 1.11 0.14 28
Librarians teaching me how to effectively use the electronically available databases, journals, and books
6.76 8.57 7.76 1.00 -0.81 21
Library keeping me informed about all of its services
5.00 7.50 5.50 0.50 -2.00 2
Library orientations / instruction sessions 6.55 8.00 7.82 1.27 -0.18 22 Making me aware of library resources and services
6.90 7.75 7.20 0.30 -0.55 20
Providing search tools that permit me to work autonomously
6.30 7.83 7.13 0.83 -0.70 23
Ready access to computers / Internet / software 7.03 8.07 7.72 0.69 -0.34 29 Teaching me how to access, evaluate, and use information
6.43 8.02 7.27 0.84 -0.75 44
Timely document delivery / interlibrary loan 6.98 7.88 7.88 0.91 0.01 34 Question Minimum
SD Desired
SD Perceived
SD Adequacy
SD Superiority
SD n
A library environment that is hospitable and conducive to finding and using information
1.41 0.71 0.00 1.41 0.71 2
Ability to navigate library Web pages easily 1.21 1.16 1.13 1.10 1.12 19 Access to equipment that is not readily available in my department, e.g., scanners, CD burners, PDAs, syncing stations
1.45 1.73 1.52 1.41 1.10 20
Access to photocopying and printing facilities 1 Adequate hours of service 1.27 0.60 0.75 1.58 0.89 11 Assuring users of the accuracy and confidentiality of their transactions
1
Convenient business hours 1.45 1.56 2.10 1.51 1.56 11 Ease and timeliness in getting materials from other libraries
1.58 1.92 1.31 2.38 2.33 8
Ease of use of electronic resources 1.20 1.17 1.07 1.17 0.72 27 Electronic resources matching my information needs
1.64 1.04 1.12 1.50 0.90 23

Revised 9/17/07
175
Question Minimum SD
Desired SD
Perceived SD
Adequacy SD
Superiority SD
n
Librarians providing help that assists in finding information needed now while improving my research skills
1.14 1.05 0.93 1.07 0.76 28
Librarians teaching me how to effectively use the electronically available databases, journals, and books
1.81 0.51 1.22 1.95 1.33 21
Library keeping me informed about all of its services
0.00 0.71 0.71 0.71 0.00 2
Library orientations / instruction sessions 1.90 1.15 1.22 1.61 0.85 22 Making me aware of library resources and services
1.25 1.21 1.24 1.72 1.70 20
Providing search tools that permit me to work autonomously
1.52 1.07 0.97 1.40 0.97 23
Ready access to computers / Internet / software 1.02 0.92 0.75 1.23 0.97 29 Teaching me how to access, evaluate, and use information
1.62 1.13 1.15 1.76 1.06 44
Timely document delivery / interlibrary loan 0.64 0.75 0.87 1.03 0.93 34
4.5.6 General Satisfaction Questions Summary This table displays mean score and standard deviation for each of the general satisfaction questions: Satisfaction with Treatment, Satisfaction with Support, and Satisfaction with Overall Quality of Service, where n is the number of respondents for each particular question. These scores are calculated from responses to the general satisfaction questions on the LibQUAL+® survey, in which respondents rated their levels of general satisfaction on a scale from 1-9. Unified Question Response
Mean Response
SD Respondents
(n) How would you rate the overall quality of the service provided by the library?
7.43 1.09 344
In general, I am satisfied with library support for my learning, research, and/or teaching needs.
7.24 1.39 344
In general, I am satisfied with the way in which I am treated at the library. 7.50 1.36 343 American English Question Response
Mean Response
SD Respondents
(n) How would you rate the overall quality of the service provided by the library?
7.39 1.17 266
In general, I am satisfied with library support for my learning, research, and/or teaching needs.
7.08 1.48 266
In general, I am satisfied with the way in which I am treated at the library. 7.39 1.45 266 Canadian French Question Response
Mean Response
SD Respondents
(n) How would you rate the overall quality of the service provided by the library?
7.58 0.76 78
In general, I am satisfied with library support for my learning, research, and/or teaching needs.
7.76 0.87 78
In general, I am satisfied with the way in which I am treated at the library. 7.87 0.89 77
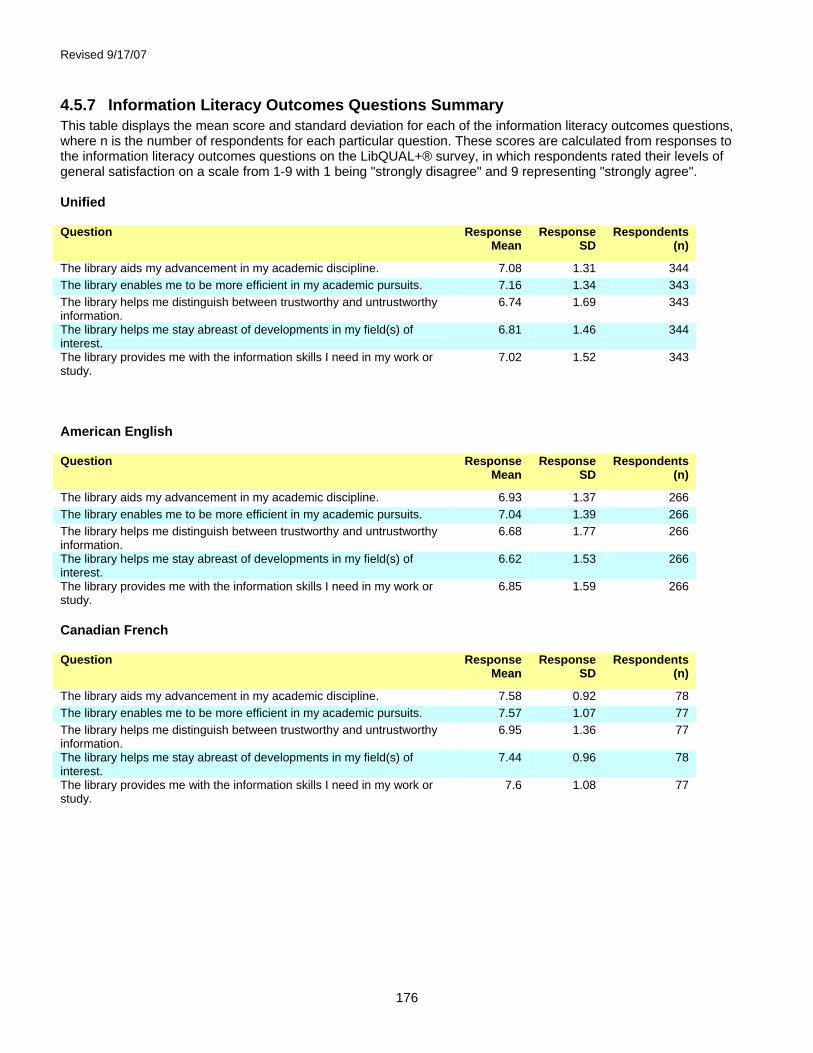
Revised 9/17/07
176
4.5.7 Information Literacy Outcomes Questions Summary This table displays the mean score and standard deviation for each of the information literacy outcomes questions, where n is the number of respondents for each particular question. These scores are calculated from responses to the information literacy outcomes questions on the LibQUAL+® survey, in which respondents rated their levels of general satisfaction on a scale from 1-9 with 1 being "strongly disagree" and 9 representing "strongly agree". Unified Question Response
Mean Response
SD Respondents
(n)
The library aids my advancement in my academic discipline. 7.08 1.31 344 The library enables me to be more efficient in my academic pursuits. 7.16 1.34 343 The library helps me distinguish between trustworthy and untrustworthy information.
6.74 1.69 343
The library helps me stay abreast of developments in my field(s) of interest.
6.81 1.46 344
The library provides me with the information skills I need in my work or study.
7.02 1.52 343
American English Question Response
Mean Response
SD Respondents
(n)
The library aids my advancement in my academic discipline. 6.93 1.37 266 The library enables me to be more efficient in my academic pursuits. 7.04 1.39 266 The library helps me distinguish between trustworthy and untrustworthy information.
6.68 1.77 266
The library helps me stay abreast of developments in my field(s) of interest.
6.62 1.53 266
The library provides me with the information skills I need in my work or study.
6.85 1.59 266
Canadian French Question Response
Mean Response
SD Respondents
(n)
The library aids my advancement in my academic discipline. 7.58 0.92 78 The library enables me to be more efficient in my academic pursuits. 7.57 1.07 77 The library helps me distinguish between trustworthy and untrustworthy information.
6.95 1.36 77
The library helps me stay abreast of developments in my field(s) of interest.
7.44 0.96 78
The library provides me with the information skills I need in my work or study.
7.6 1.08 77
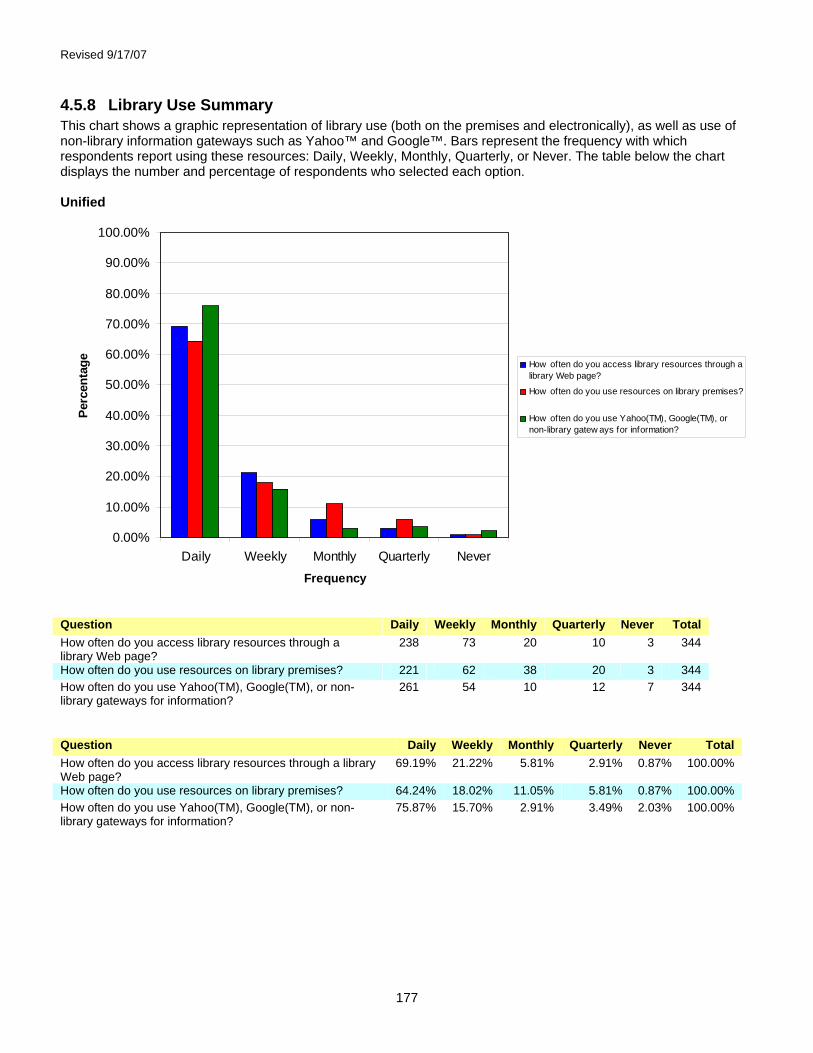
Revised 9/17/07
177
4.5.8 Library Use Summary This chart shows a graphic representation of library use (both on the premises and electronically), as well as use of non-library information gateways such as Yahoo™ and Google™. Bars represent the frequency with which respondents report using these resources: Daily, Weekly, Monthly, Quarterly, or Never. The table below the chart displays the number and percentage of respondents who selected each option. Unified
0.00%
10.00%
20.00%
30.00%
40.00%
50.00%
60.00%
70.00%
80.00%
90.00%
100.00%
Daily Weekly Monthly Quarterly NeverFrequency
Perc
enta
ge How often do you access library resources through alibrary Web page?
How often do you use resources on library premises?
How often do you use Yahoo(TM), Google(TM), ornon-library gatew ays for information?
Question Daily Weekly Monthly Quarterly Never Total How often do you access library resources through a library Web page?
238 73 20 10 3 344
How often do you use resources on library premises? 221 62 38 20 3 344 How often do you use Yahoo(TM), Google(TM), or non-library gateways for information?
261 54 10 12 7 344
Question Daily Weekly Monthly Quarterly Never Total How often do you access library resources through a library Web page?
69.19% 21.22% 5.81% 2.91% 0.87% 100.00%
How often do you use resources on library premises? 64.24% 18.02% 11.05% 5.81% 0.87% 100.00% How often do you use Yahoo(TM), Google(TM), or non-library gateways for information?
75.87% 15.70% 2.91% 3.49% 2.03% 100.00%

Revised 9/17/07
178
American English
0.00%
10.00%
20.00%
30.00%
40.00%
50.00%
60.00%
70.00%
80.00%
90.00%
100.00%
Daily Weekly Monthly Quarterly NeverFrequency
Perc
enta
ge How often do you access library resources through alibrary Web page?
How often do you use resources on library premises?
How often do you use Yahoo(TM), Google(TM), ornon-library gatew ays for information?
Question Daily Weekly Monthly Quarterly Never Total How often do you access library resources through a library Web page?
188 57 14 5 2 266
How often do you use resources on library premises? 174 48 26 15 3 266 How often do you use Yahoo(TM), Google(TM), or non-library gateways for information?
213 38 7 4 4 266
Question Daily Weekly Monthly Quarterly Never Total How often do you access library resources through a library Web page?
70.68% 21.43% 5.26% 1.88% 0.75% 100.00%
How often do you use resources on library premises? 65.41% 18.05% 9.77% 5.64% 1.13% 100.00% How often do you use Yahoo(TM), Google(TM), or non-library gateways for information?
80.08% 14.29% 2.63% 1.50% 1.50% 100.00%
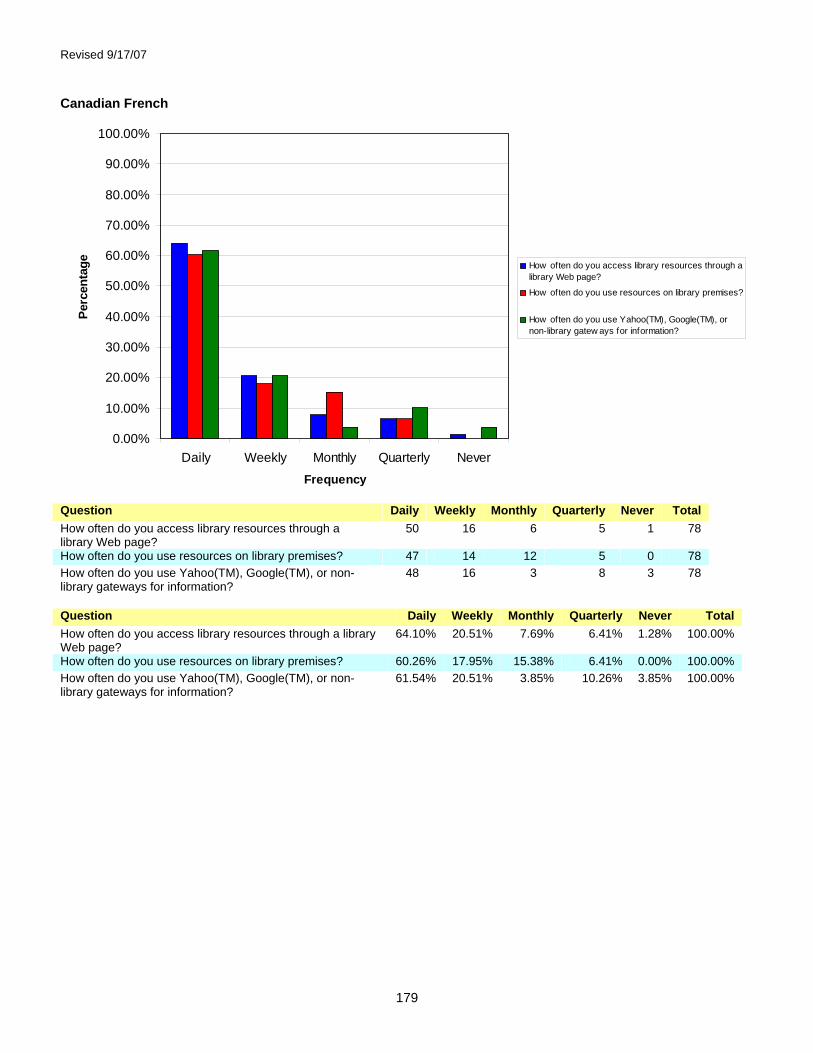
Revised 9/17/07
179
Canadian French
0.00%
10.00%
20.00%
30.00%
40.00%
50.00%
60.00%
70.00%
80.00%
90.00%
100.00%
Daily Weekly Monthly Quarterly NeverFrequency
Perc
enta
ge How often do you access library resources through alibrary Web page?
How often do you use resources on library premises?
How often do you use Yahoo(TM), Google(TM), ornon-library gatew ays for information?
Question Daily Weekly Monthly Quarterly Never Total How often do you access library resources through a library Web page?
50 16 6 5 1 78
How often do you use resources on library premises? 47 14 12 5 0 78 How often do you use Yahoo(TM), Google(TM), or non-library gateways for information?
48 16 3 8 3 78
Question Daily Weekly Monthly Quarterly Never Total How often do you access library resources through a library Web page?
64.10% 20.51% 7.69% 6.41% 1.28% 100.00%
How often do you use resources on library premises? 60.26% 17.95% 15.38% 6.41% 0.00% 100.00% How often do you use Yahoo(TM), Google(TM), or non-library gateways for information?
61.54% 20.51% 3.85% 10.26% 3.85% 100.00%

Revised 9/17/07
180
4.6 College or University Libraries - Staff
4.6.1 Respondent Profile by Age This table shows a breakdown of survey respondents by age; both the number of respondents (n) and the percentage of the total number of respondents represented by each group are displayed. Unified Age Group Respondents (n) Respondents % Under 18 - 0.00% 18 - 22 12 1.13% 23 - 30 207 19.51% 31 - 45 444 41.85% 46 - 65 389 36.66% Over 65 9 0.85%
Total 1,061 100.00% American English Age Group Respondents (n) Respondents % Under 18 - 0.00% 18 - 22 5 0.60% 23 - 30 153 18.37% 31 - 45 343 41.18% 46 - 65 325 39.02% Over 65 7 0.84%
Total 833 100.00% Canadian French Age Group Respondents (n) Respondents % Under 18 - 0.00% 18 - 22 7 3.07% 23 - 30 54 23.68% 31 - 45 101 44.30% 46 - 65 64 28.07% Over 65 2 0.88%
Total 228 100.00%

Revised 9/17/07
181
4.6.2 Population and Respondent Profile by Sex The table below shows a breakdown of survey respondents by sex, based on user responses to the demographic questions and the demographic data provided by institutions in the online Representativeness section* . The number and percentage for each sex are given for the general population and for survey respondents. * Note: Participating institutions were not required to complete the Representativness section. When population data is missing or incomplete, it is because this data was not provided. Unified Sex Respondents (n) Respondents % Male 368 34.68% Female 693 65.32%
Total 1,061 100.00% American English Sex Respondents (n) Respondents % Male 263 31.57% Female 570 68.43%
Total 833 100.00% Canadian French Sex Respondents (n) Respondents % Male 105 46.05% Female 123 53.95%
Total 228 100.00%

Revised 9/17/07
182
4.6.3 Core Question Summary This radar chart shows aggregate results for the core survey questions. Each axis represents one question. A code to identify each question is displayed at the outer point of each axis. While questions for each dimension of library service quality are scattered randomly throughout the survey, on this chart they are grouped into sections: Affect of Service, Library as Place, and Information Control. On each axis, respondents' minimum, desired, and perceived levels of service quality are plotted, and the resulting "gaps" between the three levels (representing service adequacy or service superiority) are shaded in blue, yellow, green, and red. The two following tables show mean scores and standard deviations for each question, where n is the number of respondents for each particular question. (For a more detailed explanation of the headings, see the Introduction to this notebook.) Unified
Perceived Less Than Minimum Perceived Less Than Desired Perceived Greater than Minimum Perceived Greater than Desired
Question Minimum
Mean Desired
Mean Perceived
Mean Adequacy
Mean Superiority
Mean n
AS-1 Employees who instill confidence in users 6.31 7.70 7.03 0.72 -0.67 1,022 AS-2 Giving users individual attention 6.32 7.49 7.02 0.70 -0.47 1,024 AS-3 Employees who are consistently courteous 7.23 8.19 7.65 0.42 -0.54 1,055 AS-4 Readiness to respond to users' questions 6.99 8.00 7.46 0.46 -0.55 1,030
3
4
5
6
7
8
9AS-6
AS-5
AS-4
AS-3
AS-2
AS-1
LP-5
LP-4
LP-3
LP-2
LP-1IC-8
IC-7
IC-6
IC-5
IC-4
IC-3
IC-2
IC-1
AS-9
AS-8
AS-7
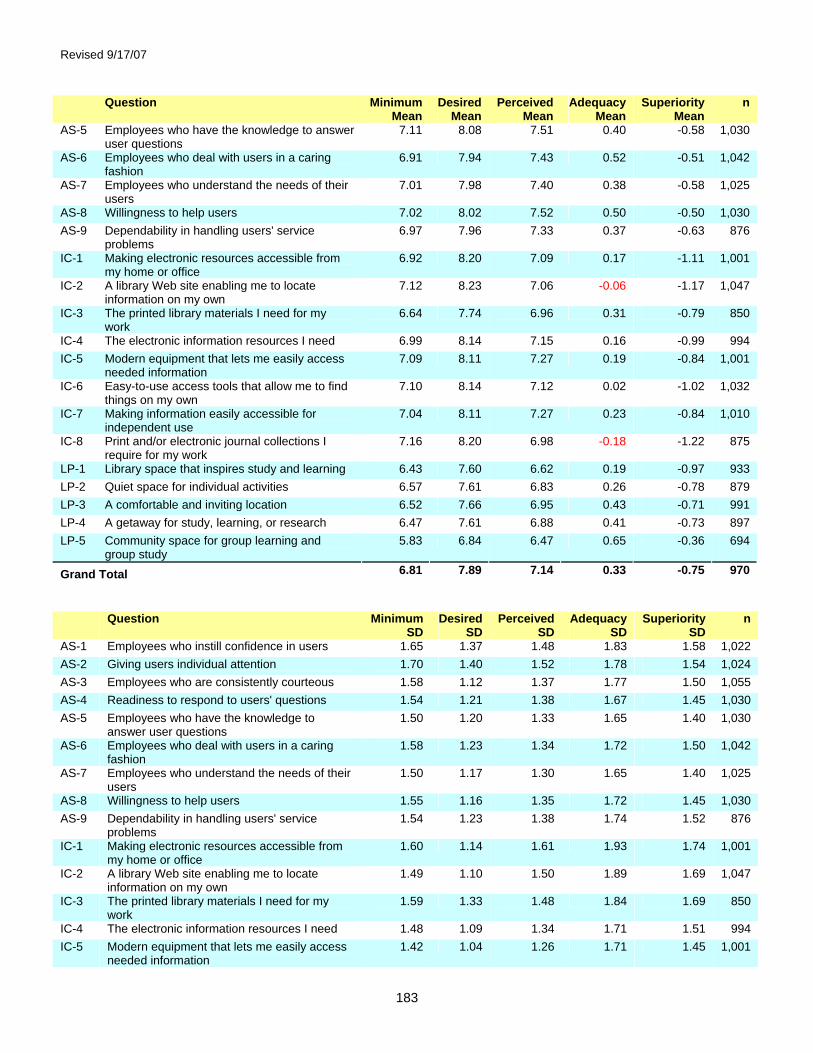
Revised 9/17/07
183
Question Minimum Mean
Desired Mean
Perceived Mean
Adequacy Mean
Superiority Mean
n
AS-5 Employees who have the knowledge to answer user questions
7.11 8.08 7.51 0.40 -0.58 1,030
AS-6 Employees who deal with users in a caring fashion
6.91 7.94 7.43 0.52 -0.51 1,042
AS-7 Employees who understand the needs of their users
7.01 7.98 7.40 0.38 -0.58 1,025
AS-8 Willingness to help users 7.02 8.02 7.52 0.50 -0.50 1,030 AS-9 Dependability in handling users' service
problems 6.97 7.96 7.33 0.37 -0.63 876
IC-1 Making electronic resources accessible from my home or office
6.92 8.20 7.09 0.17 -1.11 1,001
IC-2 A library Web site enabling me to locate information on my own
7.12 8.23 7.06 -0.06 -1.17 1,047
IC-3 The printed library materials I need for my work
6.64 7.74 6.96 0.31 -0.79 850
IC-4 The electronic information resources I need 6.99 8.14 7.15 0.16 -0.99 994 IC-5 Modern equipment that lets me easily access
needed information 7.09 8.11 7.27 0.19 -0.84 1,001
IC-6 Easy-to-use access tools that allow me to find things on my own
7.10 8.14 7.12 0.02 -1.02 1,032
IC-7 Making information easily accessible for independent use
7.04 8.11 7.27 0.23 -0.84 1,010
IC-8 Print and/or electronic journal collections I require for my work
7.16 8.20 6.98 -0.18 -1.22 875
LP-1 Library space that inspires study and learning 6.43 7.60 6.62 0.19 -0.97 933 LP-2 Quiet space for individual activities 6.57 7.61 6.83 0.26 -0.78 879 LP-3 A comfortable and inviting location 6.52 7.66 6.95 0.43 -0.71 991 LP-4 A getaway for study, learning, or research 6.47 7.61 6.88 0.41 -0.73 897 LP-5 Community space for group learning and
group study 5.83 6.84 6.47 0.65 -0.36 694
Grand Total 6.81 7.89 7.14 0.33 -0.75 970 Question Minimum
SD Desired
SD Perceived
SD Adequacy
SD Superiority
SD n
AS-1 Employees who instill confidence in users 1.65 1.37 1.48 1.83 1.58 1,022 AS-2 Giving users individual attention 1.70 1.40 1.52 1.78 1.54 1,024 AS-3 Employees who are consistently courteous 1.58 1.12 1.37 1.77 1.50 1,055 AS-4 Readiness to respond to users' questions 1.54 1.21 1.38 1.67 1.45 1,030 AS-5 Employees who have the knowledge to
answer user questions 1.50 1.20 1.33 1.65 1.40 1,030
AS-6 Employees who deal with users in a caring fashion
1.58 1.23 1.34 1.72 1.50 1,042
AS-7 Employees who understand the needs of their users
1.50 1.17 1.30 1.65 1.40 1,025
AS-8 Willingness to help users 1.55 1.16 1.35 1.72 1.45 1,030 AS-9 Dependability in handling users' service
problems 1.54 1.23 1.38 1.74 1.52 876
IC-1 Making electronic resources accessible from my home or office
1.60 1.14 1.61 1.93 1.74 1,001
IC-2 A library Web site enabling me to locate information on my own
1.49 1.10 1.50 1.89 1.69 1,047
IC-3 The printed library materials I need for my work
1.59 1.33 1.48 1.84 1.69 850
IC-4 The electronic information resources I need 1.48 1.09 1.34 1.71 1.51 994 IC-5 Modern equipment that lets me easily access
needed information 1.42 1.04 1.26 1.71 1.45 1,001

Revised 9/17/07
184
Question Minimum SD
Desired SD
Perceived SD
Adequacy SD
Superiority SD
n
IC-6 Easy-to-use access tools that allow me to find things on my own
1.42 1.10 1.34 1.79 1.58 1,032
IC-7 Making information easily accessible for independent use
1.44 1.05 1.26 1.68 1.42 1,010
IC-8 Print and/or electronic journal collections I require for my work
1.45 1.11 1.53 1.94 1.70 875
LP-1 Library space that inspires study and learning 1.75 1.60 1.76 2.27 2.20 933 LP-2 Quiet space for individual activities 1.85 1.62 1.71 2.20 2.10 879 LP-3 A comfortable and inviting location 1.74 1.44 1.68 2.13 1.96 991 LP-4 A getaway for study, learning, or research 1.84 1.63 1.56 1.96 1.80 897 LP-5 Community space for group learning and
group study 2.12 2.06 1.74 2.26 2.22 694
Grand Total 1.61 1.29 1.47 1.86 1.65 970 American English
Perceived Less Than Minimum Perceived Less Than Desired Perceived Greater than Minimum Perceived Greater than Desired
Question Minimum
Mean Desired
Mean Perceived
Mean Adequacy
Mean Superiority
Mean n
AS-1 Employees who instill confidence in users 6.30 7.71 6.97 0.66 -0.74 797 AS-2 Giving users individual attention 6.37 7.55 7.05 0.68 -0.50 810 AS-3 Employees who are consistently courteous 7.25 8.19 7.61 0.36 -0.58 831 AS-4 Readiness to respond to users' questions 7.05 8.04 7.48 0.43 -0.56 810 AS-5 Employees who have the knowledge to answer
user questions 7.11 8.07 7.46 0.35 -0.61 810
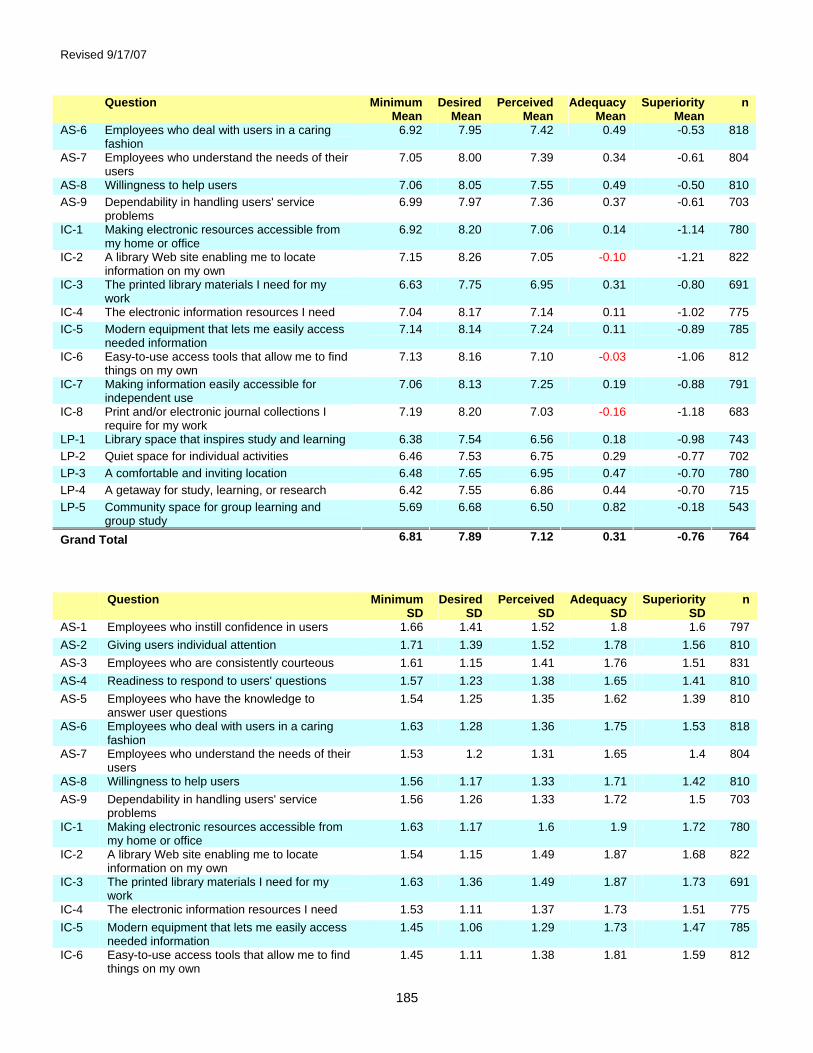
Revised 9/17/07
185
Question Minimum Mean
Desired Mean
Perceived Mean
Adequacy Mean
Superiority Mean
n
AS-6 Employees who deal with users in a caring fashion
6.92 7.95 7.42 0.49 -0.53 818
AS-7 Employees who understand the needs of their users
7.05 8.00 7.39 0.34 -0.61 804
AS-8 Willingness to help users 7.06 8.05 7.55 0.49 -0.50 810 AS-9 Dependability in handling users' service
problems 6.99 7.97 7.36 0.37 -0.61 703
IC-1 Making electronic resources accessible from my home or office
6.92 8.20 7.06 0.14 -1.14 780
IC-2 A library Web site enabling me to locate information on my own
7.15 8.26 7.05 -0.10 -1.21 822
IC-3 The printed library materials I need for my work
6.63 7.75 6.95 0.31 -0.80 691
IC-4 The electronic information resources I need 7.04 8.17 7.14 0.11 -1.02 775 IC-5 Modern equipment that lets me easily access
needed information 7.14 8.14 7.24 0.11 -0.89 785
IC-6 Easy-to-use access tools that allow me to find things on my own
7.13 8.16 7.10 -0.03 -1.06 812
IC-7 Making information easily accessible for independent use
7.06 8.13 7.25 0.19 -0.88 791
IC-8 Print and/or electronic journal collections I require for my work
7.19 8.20 7.03 -0.16 -1.18 683
LP-1 Library space that inspires study and learning 6.38 7.54 6.56 0.18 -0.98 743 LP-2 Quiet space for individual activities 6.46 7.53 6.75 0.29 -0.77 702 LP-3 A comfortable and inviting location 6.48 7.65 6.95 0.47 -0.70 780 LP-4 A getaway for study, learning, or research 6.42 7.55 6.86 0.44 -0.70 715 LP-5 Community space for group learning and
group study 5.69 6.68 6.50 0.82 -0.18 543
Grand Total 6.81 7.89 7.12 0.31 -0.76 764 Question Minimum
SD Desired
SD Perceived
SD Adequacy
SD Superiority
SD n
AS-1 Employees who instill confidence in users 1.66 1.41 1.52 1.8 1.6 797 AS-2 Giving users individual attention 1.71 1.39 1.52 1.78 1.56 810 AS-3 Employees who are consistently courteous 1.61 1.15 1.41 1.76 1.51 831 AS-4 Readiness to respond to users' questions 1.57 1.23 1.38 1.65 1.41 810 AS-5 Employees who have the knowledge to
answer user questions 1.54 1.25 1.35 1.62 1.39 810
AS-6 Employees who deal with users in a caring fashion
1.63 1.28 1.36 1.75 1.53 818
AS-7 Employees who understand the needs of their users
1.53 1.2 1.31 1.65 1.4 804
AS-8 Willingness to help users 1.56 1.17 1.33 1.71 1.42 810 AS-9 Dependability in handling users' service
problems 1.56 1.26 1.33 1.72 1.5 703
IC-1 Making electronic resources accessible from my home or office
1.63 1.17 1.6 1.9 1.72 780
IC-2 A library Web site enabling me to locate information on my own
1.54 1.15 1.49 1.87 1.68 822
IC-3 The printed library materials I need for my work
1.63 1.36 1.49 1.87 1.73 691
IC-4 The electronic information resources I need 1.53 1.11 1.37 1.73 1.51 775 IC-5 Modern equipment that lets me easily access
needed information 1.45 1.06 1.29 1.73 1.47 785
IC-6 Easy-to-use access tools that allow me to find things on my own
1.45 1.11 1.38 1.81 1.59 812
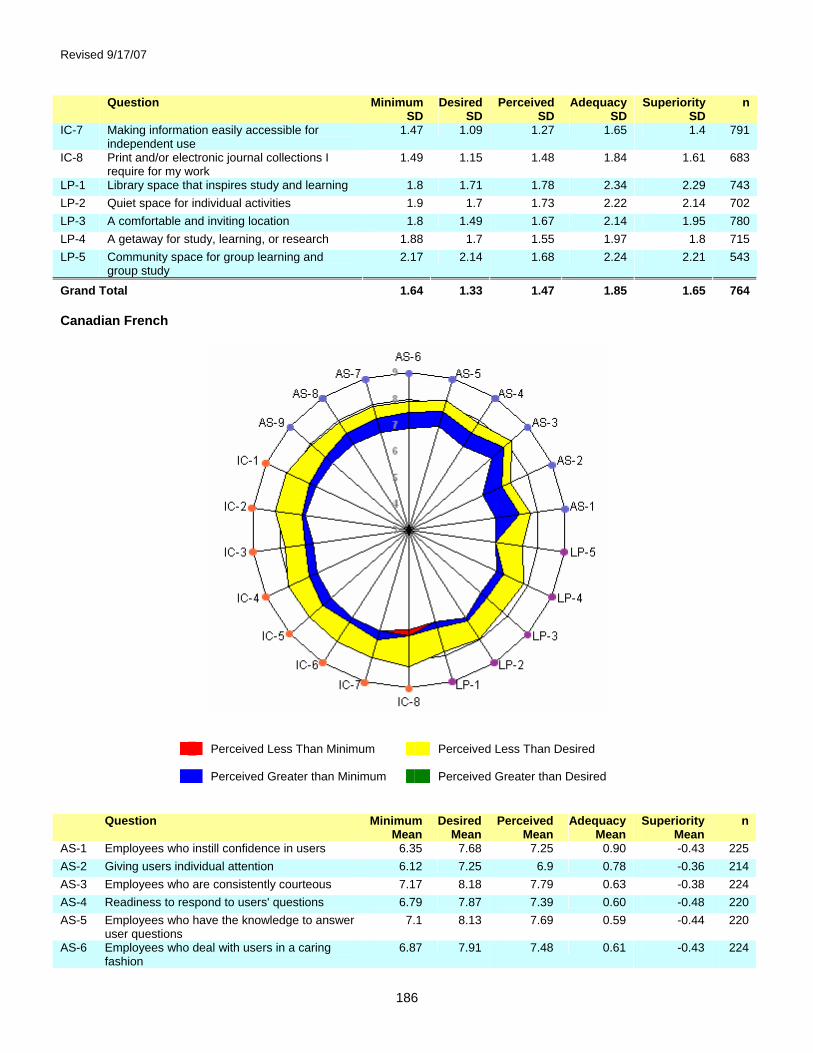
Revised 9/17/07
186
Question Minimum SD
Desired SD
Perceived SD
Adequacy SD
Superiority SD
n
IC-7 Making information easily accessible for independent use
1.47 1.09 1.27 1.65 1.4 791
IC-8 Print and/or electronic journal collections I require for my work
1.49 1.15 1.48 1.84 1.61 683
LP-1 Library space that inspires study and learning 1.8 1.71 1.78 2.34 2.29 743 LP-2 Quiet space for individual activities 1.9 1.7 1.73 2.22 2.14 702 LP-3 A comfortable and inviting location 1.8 1.49 1.67 2.14 1.95 780 LP-4 A getaway for study, learning, or research 1.88 1.7 1.55 1.97 1.8 715 LP-5 Community space for group learning and
group study 2.17 2.14 1.68 2.24 2.21 543
Grand Total 1.64 1.33 1.47 1.85 1.65 764 Canadian French
Perceived Less Than Minimum Perceived Less Than Desired Perceived Greater than Minimum Perceived Greater than Desired
Question Minimum
Mean Desired
Mean Perceived
Mean Adequacy
Mean Superiority
Mean n
AS-1 Employees who instill confidence in users 6.35 7.68 7.25 0.90 -0.43 225 AS-2 Giving users individual attention 6.12 7.25 6.9 0.78 -0.36 214 AS-3 Employees who are consistently courteous 7.17 8.18 7.79 0.63 -0.38 224 AS-4 Readiness to respond to users' questions 6.79 7.87 7.39 0.60 -0.48 220 AS-5 Employees who have the knowledge to answer
user questions 7.1 8.13 7.69 0.59 -0.44 220
AS-6 Employees who deal with users in a caring fashion
6.87 7.91 7.48 0.61 -0.43 224

Revised 9/17/07
187
Question Minimum Mean
Desired Mean
Perceived Mean
Adequacy Mean
Superiority Mean
n
AS-7 Employees who understand the needs of their users
6.89 7.9 7.44 0.56 -0.46 221
AS-8 Willingness to help users 6.88 7.9 7.4 0.51 -0.50 220 AS-9 Dependability in handling users' service
problems 6.86 7.94 7.23 0.37 -0.71 173
IC-1 Making electronic resources accessible from my home or office
6.9 8.18 7.17 0.27 -1.01 221
IC-2 A library Web site enabling me to locate information on my own
7 8.13 7.11 0.11 -1.02 225
IC-3 The printed library materials I need for my work
6.69 7.73 7.01 0.31 -0.72 159
IC-4 The electronic information resources I need 6.82 8.05 7.16 0.34 -0.89 219 IC-5 Modern equipment that lets me easily access
needed information 6.91 8.02 7.38 0.48 -0.64 216
IC-6 Easy-to-use access tools that allow me to find things on my own
7 8.05 7.2 0.20 -0.85 220
IC-7 Making information easily accessible for independent use
6.98 8.04 7.32 0.34 -0.72 219
IC-8 Print and/or electronic journal collections I require for my work
7.04 8.21 6.81 -0.23 -1.40 192
LP-1 Library space that inspires study and learning 6.65 7.83 6.88 0.23 -0.94 190 LP-2 Quiet space for individual activities 6.98 7.94 7.12 0.14 -0.82 177 LP-3 A comfortable and inviting location 6.64 7.71 6.93 0.29 -0.77 211 LP-4 A getaway for study, learning, or research 6.69 7.83 6.98 0.29 -0.85 182 LP-5 Community space for group learning and
group study 6.33 7.38 6.36 0.03 -1.03 151
Grand Total 6.8 7.9 7.18 0.38 -0.72 206 Question Minimum
SD Desired
SD Perceived
SD Adequacy
SD Superiority
SD n
AS-1 Employees who instill confidence in users 1.61 1.22 1.34 1.91 1.52 225 AS-2 Giving users individual attention 1.63 1.41 1.55 1.78 1.46 214 AS-3 Employees who are consistently courteous 1.43 0.97 1.2 1.78 1.46 224 AS-4 Readiness to respond to users' questions 1.38 1.13 1.36 1.72 1.61 220 AS-5 Employees who have the knowledge to
answer user questions 1.33 0.98 1.24 1.72 1.45 220
AS-6 Employees who deal with users in a caring fashion
1.37 1.06 1.26 1.63 1.40 224
AS-7 Employees who understand the needs of their users
1.39 1.02 1.25 1.66 1.40 221
AS-8 Willingness to help users 1.52 1.11 1.43 1.78 1.57 220 AS-9 Dependability in handling users' service
problems 1.45 1.12 1.58 1.83 1.62 173
IC-1 Making electronic resources accessible from my home or office
1.48 1.01 1.65 2.04 1.80 221
IC-2 A library Web site enabling me to locate information on my own
1.3 0.93 1.55 1.96 1.74 225
IC-3 The printed library materials I need for my work
1.43 1.19 1.46 1.71 1.48 159
IC-4 The electronic information resources I need 1.27 0.99 1.23 1.64 1.49 219 IC-5 Modern equipment that lets me easily access
needed information 1.31 0.98 1.16 1.61 1.33 216
IC-6 Easy-to-use access tools that allow me to find things on my own
1.29 1.04 1.22 1.73 1.52 220
IC-7 Making information easily accessible for independent use
1.3 0.91 1.23 1.76 1.47 219

Revised 9/17/07
188
Question Minimum SD
Desired SD
Perceived SD
Adequacy SD
Superiority SD
n
IC-8 Print and/or electronic journal collections I require for my work
1.31 0.94 1.68 2.24 1.98 192
LP-1 Library space that inspires study and learning 1.52 1.07 1.66 1.98 1.83 190 LP-2 Quiet space for individual activities 1.55 1.2 1.61 2.12 1.97 177 LP-3 A comfortable and inviting location 1.52 1.24 1.72 2.1 1.98 211 LP-4 A getaway for study, learning, or research 1.63 1.3 1.61 1.92 1.84 182 LP-5 Community space for group learning and
group study 1.86 1.61 1.96 2.21 2.13 151
Grand Total 1.45 1.11 1.45 1.86 1.64 206
4.6.4 Core Question Dimension Summary On the chart below, scores for each dimension of library service quality have been plotted graphically. The exterior bars represent the range of minimum to desired mean scores for each dimension. The interior bars represent the range of minimum to perceived mean scores (the service adequacy gap) for each dimension of library service quality. Unified

Revised 9/17/07
189
This table shows mean standard deviations for each of the local questions added by the individual library or consortium, where n is the number of respondents for each particular question. (For a more detailed explanation of the headings, see the Introduction to this notebook.)

Revised 9/17/07
190
American English
This table shows mean standard deviations for each of the local questions added by the individual library or consortium, where n is the number of respondents for each particular question. (For a more detailed explanation of the headings, see the Introduction to this notebook.)
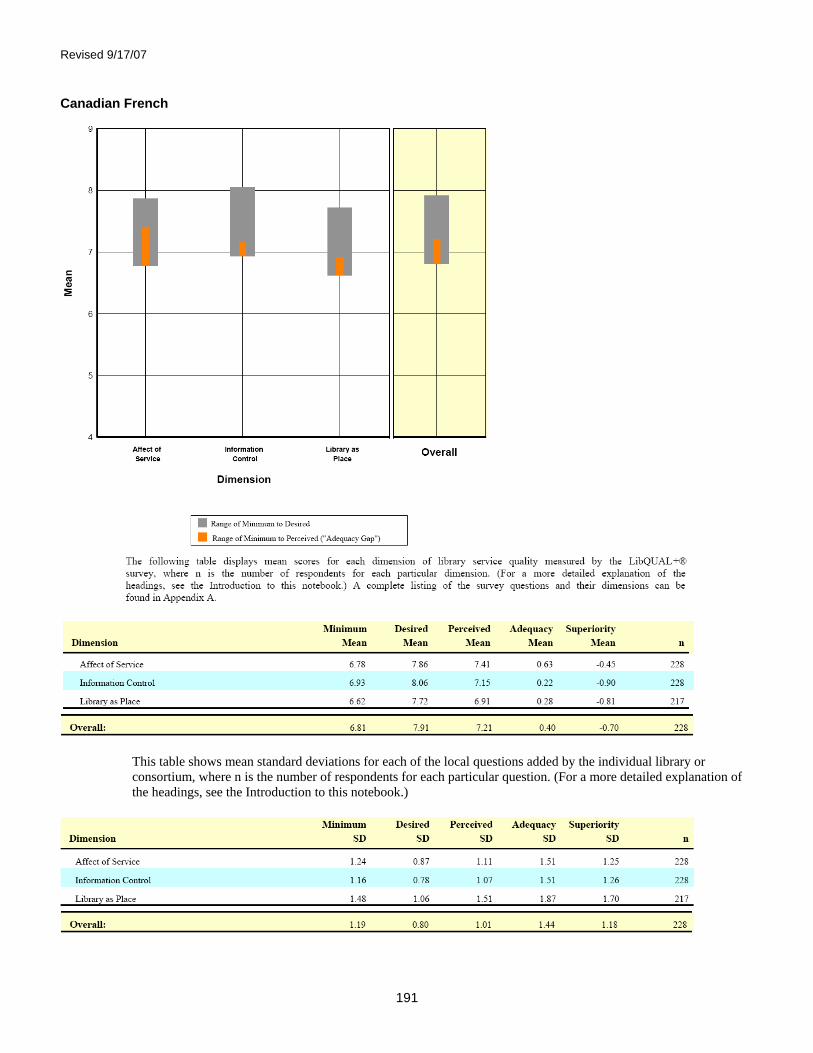
Revised 9/17/07
191
Canadian French
This table shows mean standard deviations for each of the local questions added by the individual library or consortium, where n is the number of respondents for each particular question. (For a more detailed explanation of the headings, see the Introduction to this notebook.)
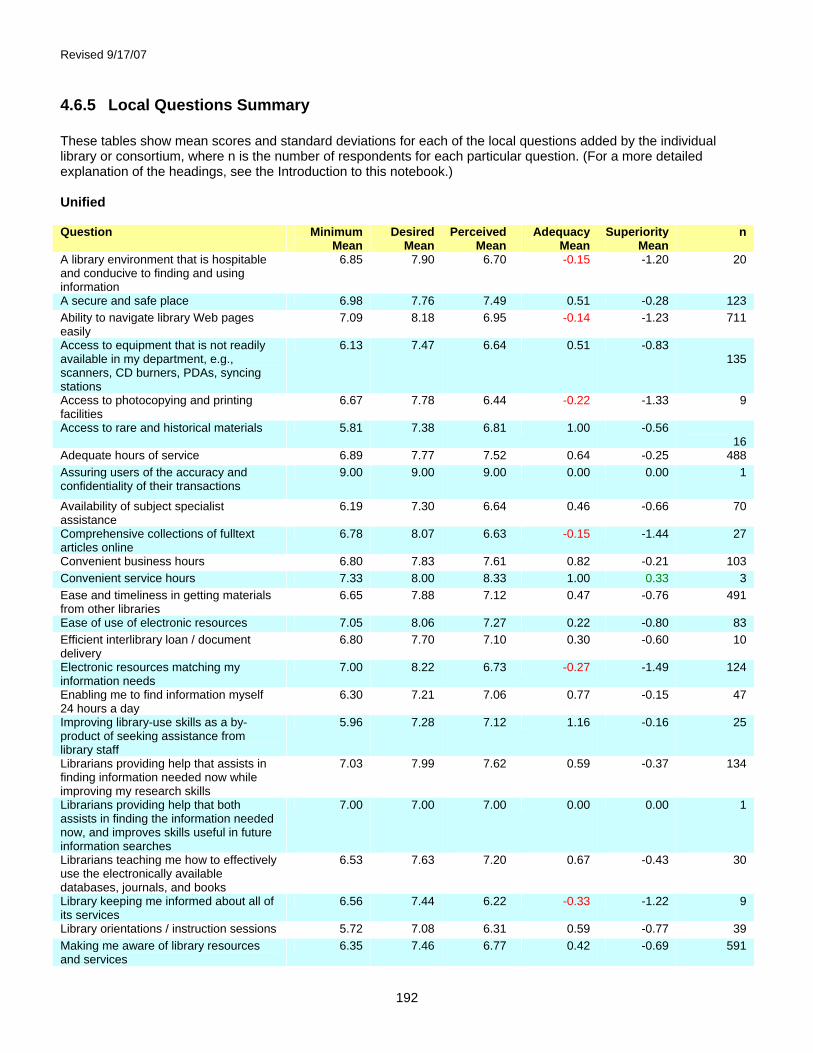
Revised 9/17/07
192
4.6.5 Local Questions Summary These tables show mean scores and standard deviations for each of the local questions added by the individual library or consortium, where n is the number of respondents for each particular question. (For a more detailed explanation of the headings, see the Introduction to this notebook.) Unified Question Minimum
Mean Desired
Mean Perceived
Mean Adequacy
Mean Superiority
Mean n
A library environment that is hospitable and conducive to finding and using information
6.85 7.90 6.70 -0.15 -1.20 20
A secure and safe place 6.98 7.76 7.49 0.51 -0.28 123 Ability to navigate library Web pages easily
7.09 8.18 6.95 -0.14 -1.23 711
Access to equipment that is not readily available in my department, e.g., scanners, CD burners, PDAs, syncing stations
6.13 7.47 6.64 0.51 -0.83 135
Access to photocopying and printing facilities
6.67 7.78 6.44 -0.22 -1.33 9
Access to rare and historical materials 5.81 7.38 6.81 1.00 -0.56 16
Adequate hours of service 6.89 7.77 7.52 0.64 -0.25 488 Assuring users of the accuracy and confidentiality of their transactions
9.00 9.00 9.00 0.00 0.00 1
Availability of subject specialist assistance
6.19 7.30 6.64 0.46 -0.66 70
Comprehensive collections of fulltext articles online
6.78 8.07 6.63 -0.15 -1.44 27
Convenient business hours 6.80 7.83 7.61 0.82 -0.21 103 Convenient service hours 7.33 8.00 8.33 1.00 0.33 3 Ease and timeliness in getting materials from other libraries
6.65 7.88 7.12 0.47 -0.76 491
Ease of use of electronic resources 7.05 8.06 7.27 0.22 -0.80 83 Efficient interlibrary loan / document delivery
6.80 7.70 7.10 0.30 -0.60 10
Electronic resources matching my information needs
7.00 8.22 6.73 -0.27 -1.49 124
Enabling me to find information myself 24 hours a day
6.30 7.21 7.06 0.77 -0.15 47
Improving library-use skills as a by-product of seeking assistance from library staff
5.96 7.28 7.12 1.16 -0.16 25
Librarians providing help that assists in finding information needed now while improving my research skills
7.03 7.99 7.62 0.59 -0.37 134
Librarians providing help that both assists in finding the information needed now, and improves skills useful in future information searches
7.00 7.00 7.00 0.00 0.00 1
Librarians teaching me how to effectively use the electronically available databases, journals, and books
6.53 7.63 7.20 0.67 -0.43 30
Library keeping me informed about all of its services
6.56 7.44 6.22 -0.33 -1.22 9
Library orientations / instruction sessions 5.72 7.08 6.31 0.59 -0.77 39 Making me aware of library resources and services
6.35 7.46 6.77 0.42 -0.69 591

Revised 9/17/07
193
Question Minimum Mean
Desired Mean
Perceived Mean
Adequacy Mean
Superiority Mean
n
Making me aware of library services 5.54 6.62 6.15 0.62 -0.46 13 Online course support (readings, links, references)
6.95 7.79 7.11 0.16 -0.68 19
Providing search tools that permit me to work autonomously
6.96 8.25 6.75 -0.21 -1.50 24
Ready access to computers / Internet / software
7.18 8.21 7.62 0.43 -0.59 76
Resources added to library collections on request
6.00 6.88 6.00 0.00 -0.88 8
Space for group / individual study and research needs
6.05 6.92 6.46 0.41 -0.46 76
Space for students to study and work in groups
5.26 6.62 6.24 0.97 -0.38 34
Space that facilitates quiet study 6.15 7.06 6.44 0.29 -0.62 87 Teaching me how to access, evaluate, and use information
6.30 7.53 6.84 0.53 -0.70 573
Teaching me how to locate, evaluate, and use information
6.93 7.82 8.07 1.14 0.25 28
The library collection provides information resources reflecting diverse points of view
7.39 8.08 7.13 -0.26 -0.95 38
Timely document delivery / interlibrary loan
6.93 7.78 7.37 0.43 -0.41 46
Timely document delivery/interlibrary loan
6.89 8.05 7.66 0.77 -0.39 64
Question Minimum
SD Desired
SD Perceived
SD Adequacy
SD Superiority
SD n
A library environment that is hospitable and conducive to finding and using information
1.31 1.02 1.66 1.81 1.64 20
A secure and safe place 2.17 1.90 1.38 2.19 2.08 123 Ability to navigate library Web pages easily
1.51 1.10 1.50 1.99 1.66 711
Access to equipment that is not readily available in my department, e.g., scanners, CD burners, PDAs, syncing stations
1.75 1.52 1.66 1.92 1.62 135
Access to photocopying and printing facilities
1.22 0.83 2.35 3.23 2.74 9
Access to rare and historical materials 1.72 1.45 1.38 2.13 1.75 16 Adequate hours of service 1.60 1.35 1.44 1.87 1.67 488 Assuring users of the accuracy and confidentiality of their transactions
1
Availability of subject specialist assistance
1.53 1.45 1.49 1.48 1.53 70
Comprehensive collections of fulltext articles online
1.50 1.11 1.33 2.21 1.25 27
Convenient business hours 1.62 1.14 1.31 1.96 1.41 103 Convenient service hours 1.15 0.00 0.58 1.73 0.58 3 Ease and timeliness in getting materials from other libraries
1.69 1.29 1.59 1.99 1.74 491
Ease of use of electronic resources 1.18 0.92 1.16 1.58 1.41 83 Efficient interlibrary loan / document delivery
1.62 1.25 1.73 1.06 1.07 10
Electronic resources matching my information needs
1.39 1.07 1.44 1.69 1.51 124
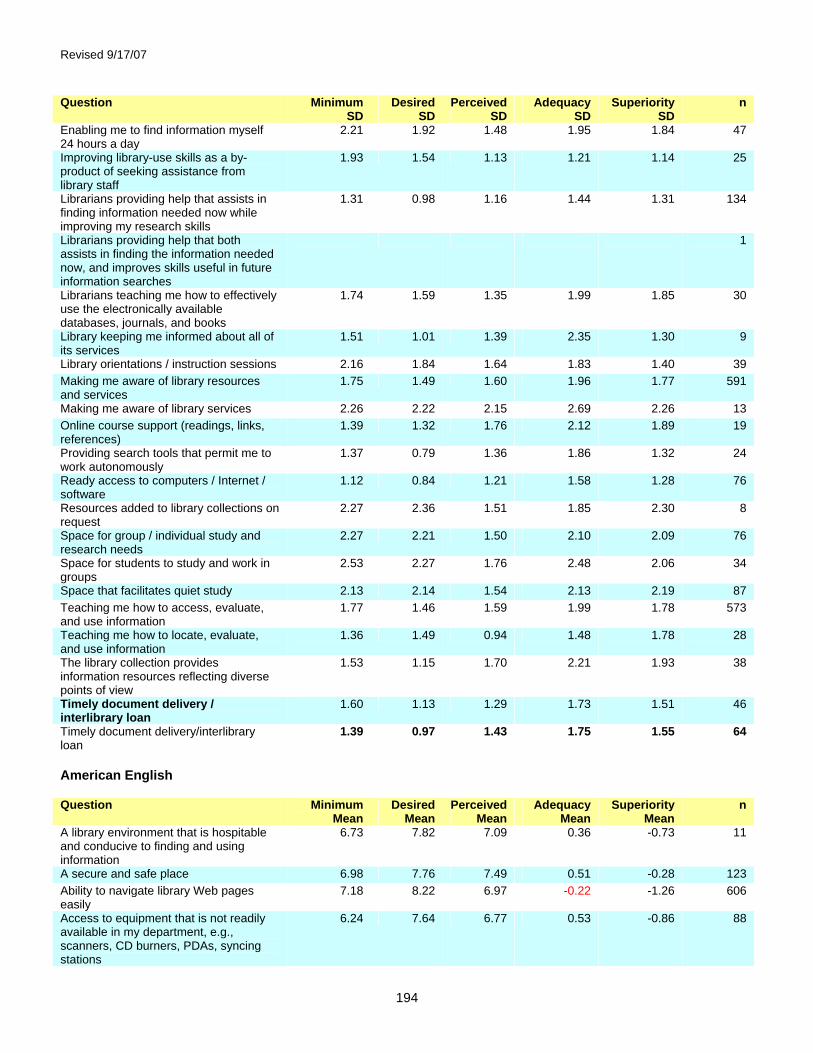
Revised 9/17/07
194
Question Minimum SD
Desired SD
Perceived SD
Adequacy SD
Superiority SD
n
Enabling me to find information myself 24 hours a day
2.21 1.92 1.48 1.95 1.84 47
Improving library-use skills as a by-product of seeking assistance from library staff
1.93 1.54 1.13 1.21 1.14 25
Librarians providing help that assists in finding information needed now while improving my research skills
1.31 0.98 1.16 1.44 1.31 134
Librarians providing help that both assists in finding the information needed now, and improves skills useful in future information searches
1
Librarians teaching me how to effectively use the electronically available databases, journals, and books
1.74 1.59 1.35 1.99 1.85 30
Library keeping me informed about all of its services
1.51 1.01 1.39 2.35 1.30 9
Library orientations / instruction sessions 2.16 1.84 1.64 1.83 1.40 39 Making me aware of library resources and services
1.75 1.49 1.60 1.96 1.77 591
Making me aware of library services 2.26 2.22 2.15 2.69 2.26 13 Online course support (readings, links, references)
1.39 1.32 1.76 2.12 1.89 19
Providing search tools that permit me to work autonomously
1.37 0.79 1.36 1.86 1.32 24
Ready access to computers / Internet / software
1.12 0.84 1.21 1.58 1.28 76
Resources added to library collections on request
2.27 2.36 1.51 1.85 2.30 8
Space for group / individual study and research needs
2.27 2.21 1.50 2.10 2.09 76
Space for students to study and work in groups
2.53 2.27 1.76 2.48 2.06 34
Space that facilitates quiet study 2.13 2.14 1.54 2.13 2.19 87 Teaching me how to access, evaluate, and use information
1.77 1.46 1.59 1.99 1.78 573
Teaching me how to locate, evaluate, and use information
1.36 1.49 0.94 1.48 1.78 28
The library collection provides information resources reflecting diverse points of view
1.53 1.15 1.70 2.21 1.93 38
Timely document delivery / interlibrary loan
1.60 1.13 1.29 1.73 1.51 46
Timely document delivery/interlibrary loan
1.39 0.97 1.43 1.75 1.55 64
American English Question Minimum
Mean Desired
Mean Perceived
Mean Adequacy
Mean Superiority
Mean n
A library environment that is hospitable and conducive to finding and using information
6.73 7.82 7.09 0.36 -0.73 11
A secure and safe place 6.98 7.76 7.49 0.51 -0.28 123 Ability to navigate library Web pages easily
7.18 8.22 6.97 -0.22 -1.26 606
Access to equipment that is not readily available in my department, e.g., scanners, CD burners, PDAs, syncing stations
6.24 7.64 6.77 0.53 -0.86 88
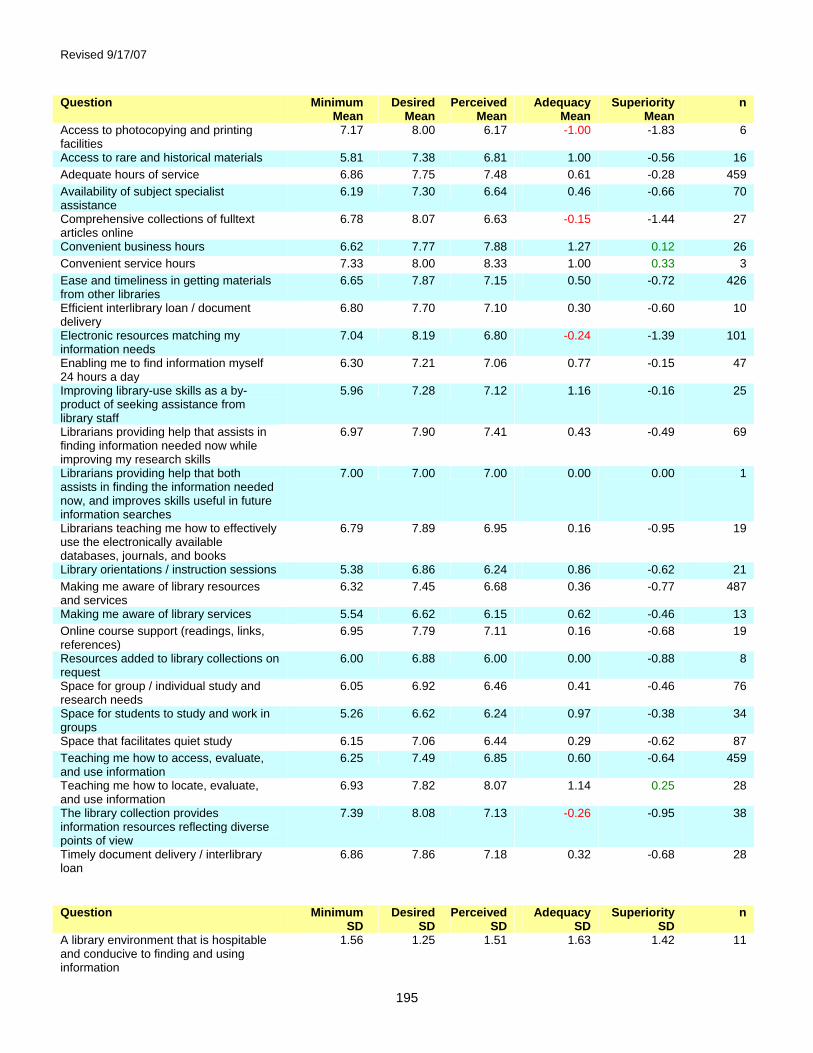
Revised 9/17/07
195
Question Minimum Mean
Desired Mean
Perceived Mean
Adequacy Mean
Superiority Mean
n
Access to photocopying and printing facilities
7.17 8.00 6.17 -1.00 -1.83 6
Access to rare and historical materials 5.81 7.38 6.81 1.00 -0.56 16 Adequate hours of service 6.86 7.75 7.48 0.61 -0.28 459 Availability of subject specialist assistance
6.19 7.30 6.64 0.46 -0.66 70
Comprehensive collections of fulltext articles online
6.78 8.07 6.63 -0.15 -1.44 27
Convenient business hours 6.62 7.77 7.88 1.27 0.12 26 Convenient service hours 7.33 8.00 8.33 1.00 0.33 3 Ease and timeliness in getting materials from other libraries
6.65 7.87 7.15 0.50 -0.72 426
Efficient interlibrary loan / document delivery
6.80 7.70 7.10 0.30 -0.60 10
Electronic resources matching my information needs
7.04 8.19 6.80 -0.24 -1.39 101
Enabling me to find information myself 24 hours a day
6.30 7.21 7.06 0.77 -0.15 47
Improving library-use skills as a by-product of seeking assistance from library staff
5.96 7.28 7.12 1.16 -0.16 25
Librarians providing help that assists in finding information needed now while improving my research skills
6.97 7.90 7.41 0.43 -0.49 69
Librarians providing help that both assists in finding the information needed now, and improves skills useful in future information searches
7.00 7.00 7.00 0.00 0.00 1
Librarians teaching me how to effectively use the electronically available databases, journals, and books
6.79 7.89 6.95 0.16 -0.95 19
Library orientations / instruction sessions 5.38 6.86 6.24 0.86 -0.62 21 Making me aware of library resources and services
6.32 7.45 6.68 0.36 -0.77 487
Making me aware of library services 5.54 6.62 6.15 0.62 -0.46 13 Online course support (readings, links, references)
6.95 7.79 7.11 0.16 -0.68 19
Resources added to library collections on request
6.00 6.88 6.00 0.00 -0.88 8
Space for group / individual study and research needs
6.05 6.92 6.46 0.41 -0.46 76
Space for students to study and work in groups
5.26 6.62 6.24 0.97 -0.38 34
Space that facilitates quiet study 6.15 7.06 6.44 0.29 -0.62 87 Teaching me how to access, evaluate, and use information
6.25 7.49 6.85 0.60 -0.64 459
Teaching me how to locate, evaluate, and use information
6.93 7.82 8.07 1.14 0.25 28
The library collection provides information resources reflecting diverse points of view
7.39 8.08 7.13 -0.26 -0.95 38
Timely document delivery / interlibrary loan
6.86 7.86 7.18 0.32 -0.68 28
Question Minimum
SD Desired
SD Perceived
SD Adequacy
SD Superiority
SD n
A library environment that is hospitable and conducive to finding and using information
1.56 1.25 1.51 1.63 1.42 11
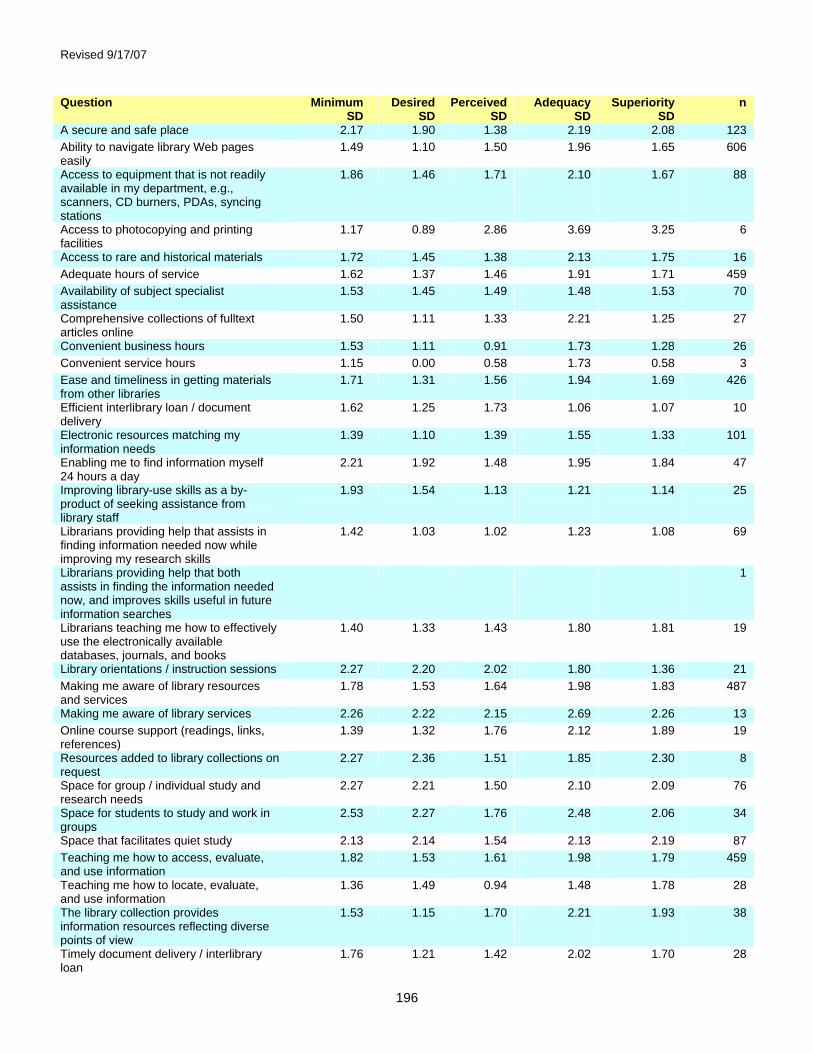
Revised 9/17/07
196
Question Minimum SD
Desired SD
Perceived SD
Adequacy SD
Superiority SD
n
A secure and safe place 2.17 1.90 1.38 2.19 2.08 123 Ability to navigate library Web pages easily
1.49 1.10 1.50 1.96 1.65 606
Access to equipment that is not readily available in my department, e.g., scanners, CD burners, PDAs, syncing stations
1.86 1.46 1.71 2.10 1.67 88
Access to photocopying and printing facilities
1.17 0.89 2.86 3.69 3.25 6
Access to rare and historical materials 1.72 1.45 1.38 2.13 1.75 16 Adequate hours of service 1.62 1.37 1.46 1.91 1.71 459 Availability of subject specialist assistance
1.53 1.45 1.49 1.48 1.53 70
Comprehensive collections of fulltext articles online
1.50 1.11 1.33 2.21 1.25 27
Convenient business hours 1.53 1.11 0.91 1.73 1.28 26 Convenient service hours 1.15 0.00 0.58 1.73 0.58 3 Ease and timeliness in getting materials from other libraries
1.71 1.31 1.56 1.94 1.69 426
Efficient interlibrary loan / document delivery
1.62 1.25 1.73 1.06 1.07 10
Electronic resources matching my information needs
1.39 1.10 1.39 1.55 1.33 101
Enabling me to find information myself 24 hours a day
2.21 1.92 1.48 1.95 1.84 47
Improving library-use skills as a by-product of seeking assistance from library staff
1.93 1.54 1.13 1.21 1.14 25
Librarians providing help that assists in finding information needed now while improving my research skills
1.42 1.03 1.02 1.23 1.08 69
Librarians providing help that both assists in finding the information needed now, and improves skills useful in future information searches
1
Librarians teaching me how to effectively use the electronically available databases, journals, and books
1.40 1.33 1.43 1.80 1.81 19
Library orientations / instruction sessions 2.27 2.20 2.02 1.80 1.36 21 Making me aware of library resources and services
1.78 1.53 1.64 1.98 1.83 487
Making me aware of library services 2.26 2.22 2.15 2.69 2.26 13 Online course support (readings, links, references)
1.39 1.32 1.76 2.12 1.89 19
Resources added to library collections on request
2.27 2.36 1.51 1.85 2.30 8
Space for group / individual study and research needs
2.27 2.21 1.50 2.10 2.09 76
Space for students to study and work in groups
2.53 2.27 1.76 2.48 2.06 34
Space that facilitates quiet study 2.13 2.14 1.54 2.13 2.19 87 Teaching me how to access, evaluate, and use information
1.82 1.53 1.61 1.98 1.79 459
Teaching me how to locate, evaluate, and use information
1.36 1.49 0.94 1.48 1.78 28
The library collection provides information resources reflecting diverse points of view
1.53 1.15 1.70 2.21 1.93 38
Timely document delivery / interlibrary loan
1.76 1.21 1.42 2.02 1.70 28

Revised 9/17/07
197
Canadian French Question Minimum
Mean Desired
Mean Perceived
Mean Adequacy
Mean Superiority
Mean n
A library environment that is hospitable and conducive to finding and using information
7.00 8.00 6.22 -0.78 -1.78 9
Ability to navigate library Web pages easily
6.81 7.92 6.97 0.16 -0.94 105
Access to equipment that is not readily available in my department, e.g., scanners, CD burners, PDAs, syncing stations
5.94 7.17 6.40 0.47 -0.77 47
Access to photocopying and printing facilities
5.67 7.33 7.00 1.33 -0.33 3
Adequate hours of service 7.31 8.03 8.28 0.97 0.24 29 Assuring users of the accuracy and confidentiality of their transactions
9.00 9.00 9.00 0.00 0.00 1
Convenient business hours 6.86 7.84 7.52 0.66 -0.32 77 Ease and timeliness in getting materials from other libraries
6.65 7.94 6.95 0.31 -0.98 65
Ease of use of electronic resources 7.05 8.06 7.27 0.22 -0.80 83 Electronic resources matching my information needs
6.83 8.35 6.39 -0.43 -1.96 23
Librarians providing help that assists in finding information needed now while improving my research skills
7.09 8.09 7.85 0.75 -0.25 65
Librarians teaching me how to effectively use the electronically available databases, journals, and books
6.09 7.18 7.64 1.55 0.45 11
Library keeping me informed about all of its services
6.56 7.44 6.22 -0.33 -1.22 9
Library orientations / instruction sessions 6.11 7.33 6.39 0.28 -0.94 18 Making me aware of library resources and services
6.48 7.50 7.18 0.70 -0.32 104
Providing search tools that permit me to work autonomously
6.96 8.25 6.75 -0.21 -1.50 24
Ready access to computers / Internet / software
7.18 8.21 7.62 0.43 -0.59 76
Teaching me how to access, evaluate, and use information
6.50 7.69 6.77 0.27 -0.92 114
Timely document delivery / interlibrary loan
6.97 7.86 7.66 0.69 -0.20 82
Question Minimum
SD Desired
SD Perceived
SD Adequacy
SD Superiority
SD n
A library environment that is hospitable and conducive to finding and using information
1.00 0.71 1.79 1.92 1.79 9
Ability to navigate library Web pages easily
1.40 1.00 1.52 2.06 1.69 105
Access to equipment that is not readily available in my department, e.g., scanners, CD burners, PDAs, syncing stations
1.52 1.59 1.56 1.57 1.55 47
Access to photocopying and printing facilities
0.58 0.58 1.00 1.53 1.15 3
Adequate hours of service 1.20 0.87 0.75 1.09 0.87 29

Revised 9/17/07
198
Question Minimum SD
Desired SD
Perceived SD
Adequacy SD
Superiority SD
n
Assuring users of the accuracy and confidentiality of their transactions
1
Convenient business hours 1.65 1.16 1.41 2.02 1.45 77 Ease and timeliness in getting materials from other libraries
1.55 1.16 1.78 2.30 2.00 65
Ease of use of electronic resources 1.18 0.92 1.16 1.58 1.41 83 Electronic resources matching my information needs
1.44 0.93 1.67 2.23 2.10 23
Librarians providing help that assists in finding information needed now while improving my research skills
1.20 0.93 1.27 1.63 1.51 65
Librarians teaching me how to effectively use the electronically available databases, journals, and books
2.21 1.94 1.12 2.07 1.63 11
Library keeping me informed about all of its services
1.51 1.01 1.39 2.35 1.30 9
Library orientations / instruction sessions 2.03 1.33 1.09 1.87 1.47 18 Making me aware of library resources and services
1.61 1.29 1.36 1.82 1.46 104
Providing search tools that permit me to work autonomously
1.37 0.79 1.36 1.86 1.32 24
Ready access to computers / Internet / software
1.12 0.84 1.21 1.58 1.28 76
Teaching me how to access, evaluate, and use information
1.51 1.12 1.54 2.00 1.72 114
Timely document delivery / interlibrary loan
1.37 1.00 1.23 1.47 1.32 82
4.6.6 General Satisfaction Questions Summary This table displays mean score and standard deviation for each of the general satisfaction questions: Satisfaction with Treatment, Satisfaction with Support, and Satisfaction with Overall Quality of Service, where n is the number of respondents for each particular question. These scores are calculated from responses to the general satisfaction questions on the LibQUAL+® survey, in which respondents rated their levels of general satisfaction on a scale from 1-9. Unified Question Response
Mean Response
SD Respondents
(n) How would you rate the overall quality of the service provided by the library?
7.36 1.20 1,065
In general, I am satisfied with library support for my learning, research, and/or teaching needs.
7.13 1.55 1,063
In general, I am satisfied with the way in which I am treated at the library. 7.56 1.40 1,065 American English Question Response
Mean Response
SD Respondents
(n) How would you rate the overall quality of the service provided by the library?
7.35 1.22 837
In general, I am satisfied with library support for my learning, research, and/or teaching needs.
7.05 1.58 836
In general, I am satisfied with the way in which I am treated at the library. 7.51 1.44 837

Revised 9/17/07
199
Canadian French Question Response
Mean Response
SD Respondents
(n) How would you rate the overall quality of the service provided by the library?
7.41 1.12 228
In general, I am satisfied with library support for my learning, research, and/or teaching needs.
7.42 1.42 227
In general, I am satisfied with the way in which I am treated at the library. 7.75 1.23 228
4.6.7 Information Literacy Outcomes Questions Summary This table displays the mean score and standard deviation for each of the information literacy outcomes questions, where n is the number of respondents for each particular question. These scores are calculated from responses to the information literacy outcomes questions on the LibQUAL+® survey, in which respondents rated their levels of general satisfaction on a scale from 1-9 with 1 being "strongly disagree" and 9 representing "strongly agree". Unified Question Response
Mean Response
SD Respondents
(n)
The library aids my advancement in my academic discipline. 6.63 1.68 1,062 The library enables me to be more efficient in my academic pursuits. 6.78 1.67 1,062 The library helps me distinguish between trustworthy and untrustworthy information. 5.93 1.84 1,064 The library helps me stay abreast of developments in my field(s) of interest. 6.43 1.72 1,064 The library provides me with the information skills I need in my work or study. 6.40 1.74 1,063 American English Question Response
Mean Response
SD Respondents
(n)
The library aids my advancement in my academic discipline. 6.50 1.70 836 The library enables me to be more efficient in my academic pursuits. 6.68 1.69 836 The library helps me distinguish between trustworthy and untrustworthy information.
5.88 1.84 836
The library helps me stay abreast of developments in my field(s) of interest.
6.24 1.76 836
The library provides me with the information skills I need in my work or study.
6.34 1.75 836
Canadian French Question Response
Mean Response
SD Respondents
(n)
The library aids my advancement in my academic discipline. 7.12 1.48 226 The library enables me to be more efficient in my academic pursuits. 7.19 1.51 226 The library helps me distinguish between trustworthy and untrustworthy information.
6.14 1.84 228
The library helps me stay abreast of developments in my field(s) of interest.
7.12 1.40 228
The library provides me with the information skills I need in my work or study.
6.62 1.69 227
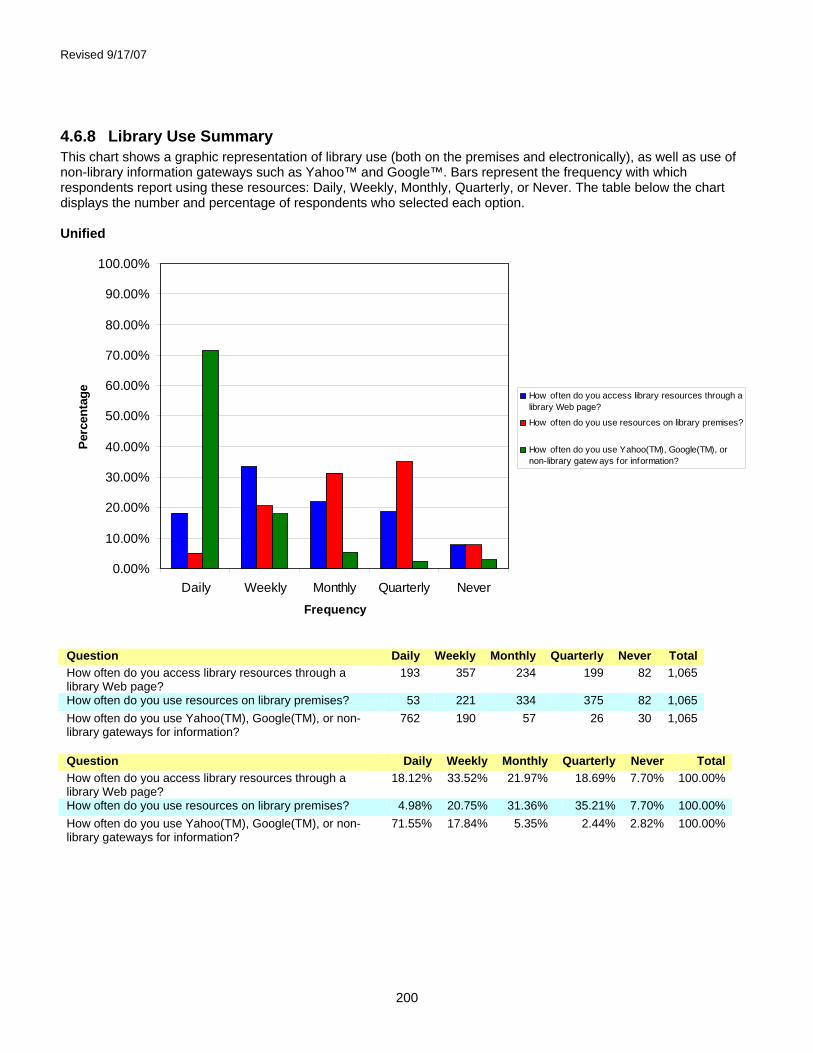
Revised 9/17/07
200
4.6.8 Library Use Summary This chart shows a graphic representation of library use (both on the premises and electronically), as well as use of non-library information gateways such as Yahoo™ and Google™. Bars represent the frequency with which respondents report using these resources: Daily, Weekly, Monthly, Quarterly, or Never. The table below the chart displays the number and percentage of respondents who selected each option. Unified
0.00%
10.00%
20.00%
30.00%
40.00%
50.00%
60.00%
70.00%
80.00%
90.00%
100.00%
Daily Weekly Monthly Quarterly NeverFrequency
Perc
enta
ge How often do you access library resources through alibrary Web page?
How often do you use resources on library premises?
How often do you use Yahoo(TM), Google(TM), ornon-library gatew ays for information?
Question Daily Weekly Monthly Quarterly Never Total How often do you access library resources through a library Web page?
193 357 234 199 82 1,065
How often do you use resources on library premises? 53 221 334 375 82 1,065 How often do you use Yahoo(TM), Google(TM), or non-library gateways for information?
762 190 57 26 30 1,065
Question Daily Weekly Monthly Quarterly Never Total How often do you access library resources through a library Web page?
18.12% 33.52% 21.97% 18.69% 7.70% 100.00%
How often do you use resources on library premises? 4.98% 20.75% 31.36% 35.21% 7.70% 100.00% How often do you use Yahoo(TM), Google(TM), or non-library gateways for information?
71.55% 17.84% 5.35% 2.44% 2.82% 100.00%

Revised 9/17/07
201
American English
0.00%
10.00%
20.00%
30.00%
40.00%
50.00%
60.00%
70.00%
80.00%
90.00%
100.00%
Daily Weekly Monthly Quarterly NeverFrequency
Perc
enta
ge How often do you access library resources through alibrary Web page?
How often do you use resources on library premises?
How often do you use Yahoo(TM), Google(TM), ornon-library gatew ays for information?
Question Daily Weekly Monthly Quarterly Never Total How often do you access library resources through a library Web page?
135 278 189 159 76 837
How often do you use resources on library premises? 44 160 270 287 76 837 How often do you use Yahoo(TM), Google(TM), or non-library gateways for information?
599 146 46 23 23 837
Question Daily Weekly Monthly Quarterly Never Total How often do you access library resources through a library Web page?
16.13% 33.21% 22.58% 19.00% 9.08% 100.00%
How often do you use resources on library premises? 5.26% 19.12% 32.26% 34.29% 9.08% 100.00% How often do you use Yahoo(TM), Google(TM), or non-library gateways for information?
71.57% 17.44% 5.50% 2.75% 2.75% 100.00%

Revised 9/17/07
202
Canadian French
0.00%
10.00%
20.00%
30.00%
40.00%
50.00%
60.00%
70.00%
80.00%
90.00%
100.00%
Daily Weekly Monthly Quarterly NeverFrequency
Perc
enta
ge How often do you access library resources through alibrary Web page?
How often do you use resources on library premises?
How often do you use Yahoo(TM), Google(TM), ornon-library gatew ays for information?
Question Daily Weekly Monthly Quarterly Never Total How often do you access library resources through a library Web page?
58 79 45 40 6 228
How often do you use resources on library premises? 9 61 64 88 6 228 How often do you use Yahoo(TM), Google(TM), or non-library gateways for information?
163 44 11 3 7 228
Question Daily Weekly Monthly Quarterly Never Total How often do you access library resources through a library Web page?
25.44% 34.65% 19.74% 17.54% 2.63% 100.00%
How often do you use resources on library premises? 3.95% 26.75% 28.07% 38.60% 2.63% 100.00% How often do you use Yahoo(TM), Google(TM), or non-library gateways for information?
71.49% 19.30% 4.82% 1.32% 3.07% 100.00%

Revised 9/17/07
203
5 Community College Libraries Results for LibQual Canada
5.1 Community College Libraries - All
5.1.1 Respondents by User Group

Revised 9/17/07
204
5.1.2 Population and Respondent Profiles by User Sub-Group The chart and table below show a breakdown of survey respondents by sub-group (e.g. First year, Masters, Professor), based on user responses to the demographic questions at the end of the survey instrument and the demographic data provided by institutions in the online Representativeness section*. The chart maps percentage of respondents for each user subgroup in red. Population percentages for each user subgroup are mapped in blue. The table shows the number and percentage for each user sub-group for the general population (N) and for survey respondents (n). *Note: Participating institutions were not required to complete the Representativeness section. When population data is missing or incomplete, it is because this data was not provided.

Revised 9/17/07
205

Revised 9/17/07
206
5.1.3 Population and Respondent Profiles by Standard Discipline The chart and table below show a breakdown of survey respondents by discipline, based on user responses to the demographic questions and the demographic data provided by institutions in the online Representativeness section*. This section shows survey respondents broken down based on the LibQUAL+® standard discipline categories. The chart maps percentage of respondents for each discipline in red. Population percentages for each discipline are mapped in blue. The table shows the number and percentage for each discipline, for the general population (N) and for survey respondents (n). *Note: Participating institutions were not required to complete the Representativeness section. When population data is missing or incomplete, it is because this data was not provided.

Revised 9/17/07
207
5.1.4 Respondent Profile by Age This table shows a breakdown of survey respondents by age; both the number of respondents (n) and the percentage of the total number of respondents represented by each group are displayed.

Revised 9/17/07
208
5.1.5 Population and Respondent Profile by Sex The table below shows a breakdown of survey respondents by sex, based on user responses to the demographic questions and the demographic data provided by institutions in the online Representativeness section* . The number and percentage for each sex are given for the general population and for survey respondents. * Note: Participating institutions were not required to complete the Representativness section. When population data is missing or incomplete, it is because this data was not provided.
5.1.6 Core Question Summary This radar chart shows aggregate results for the core survey questions. Each axis represents one question. A code to identify each question is displayed at the outer point of each axis. While questions for each dimension of library service quality are scattered randomly throughout the survey, on this chart they are grouped into sections: Affect of Service, Library as Place, and Information Control. On each axis, respondents' minimum, desired, and perceived levels of service quality are plotted, and the resulting "gaps" between the three levels (representing service adequacy or service superiority) are shaded in blue, yellow, green, and red. The two following tables show mean scores and standard deviations for each question, where n is the number of respondents for each particular question. (For a more detailed explanation of the headings, see the Introduction to this notebook.)

Revised 9/17/07
209

Revised 9/17/07
210
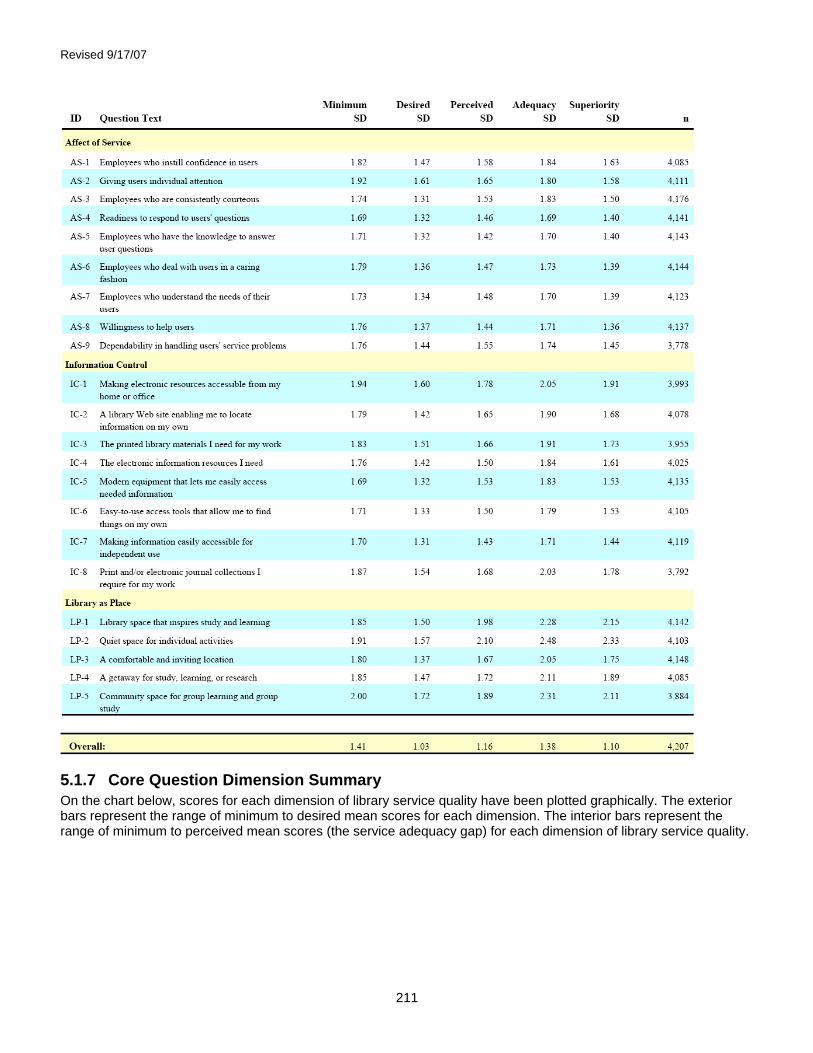
Revised 9/17/07
211
5.1.7 Core Question Dimension Summary On the chart below, scores for each dimension of library service quality have been plotted graphically. The exterior bars represent the range of minimum to desired mean scores for each dimension. The interior bars represent the range of minimum to perceived mean scores (the service adequacy gap) for each dimension of library service quality.

Revised 9/17/07
212

Revised 9/17/07
213
5.1.8 Local Questions Summary This table shows mean scores for each of the local questions added by the individual library or consortium, where n is the number of respondents for each particular question. (For a more detailed explanation of the headings, see the Introduction to this notebook.)
This table displays the standard deviation for each of the local questions added by the individual library or consortium, where n is the number of respondents for each particular question. (For a more detailed explanation of the headings, see the Introduction to this notebook.)

Revised 9/17/07
214
5.1.9 General Satisfaction Questions Summary This table displays mean score and standard deviation for each of the general satisfaction questions: Satisfaction with Treatment, Satisfaction with Support, and Satisfaction with Overall Quality of Service, where n is the number of respondents for each particular question. These scores are calculated from responses to the general satisfaction questions on the LibQUAL+® survey, in which respondents rated their levels of general satisfaction on a scale from 1-9.
5.1.10 Information Literacy Outcomes Questions Summary This table displays the mean score and standard deviation for each of the information literacy outcomes questions, where n is the number of respondents for each particular question. These scores are calculated from responses to the information literacy outcomes questions on the LibQUAL+® survey, in which respondents rated their levels of general satisfaction on a scale from 1-9 with 1 being "strongly disagree" and 9 representing "strongly agree".

Revised 9/17/07
215
5.1.11 Library Use Summary This chart shows a graphic representation of library use (both on the premises and electronically), as well as use of non-library information gateways such as Yahoo™ and Google™. Bars represent the frequency with which respondents report using these resources: Daily, Weekly, Monthly, Quarterly, or Never. The table below the chart displays the number and percentage of respondents who selected each option.

Revised 9/17/07
216
5.2 Community College Libraries – Student
5.2.1 Population and Respondent Profiles by Standard Discipline The chart and table below show a breakdown of survey respondents by discipline, based on user responses to the demographic questions and the demographic data provided by institutions in the online Representativeness section*. This section shows survey respondents broken down based on the LibQUAL+® standard discipline categories. The chart maps percentage of respondents for each discipline in red. Population percentages for each discipline are mapped in blue. The table shows the number and percentage for each discipline, for the general population (N) and for survey respondents (n). *Note: Participating institutions were not required to complete the Representativeness section. When population data is missing or incomplete, it is because this data was not provided.

Revised 9/17/07
217
5.2.2 Respondent Profile by Age This table shows a breakdown of survey respondents by age; both the number of respondents (n) and the percentage of the total number of respondents represented by each group are displayed.
5.2.3 Population and Respondent Profile by Sex The table below shows a breakdown of survey respondents by sex, based on user responses to the demographic questions and the demographic data provided by institutions in the online Representativeness section* . The number and percentage for each sex are given for the general population and for survey respondents. * Note: Participating institutions were not required to complete the Representativness section. When population data is missing or incomplete, it is because this data was not provided.

Revised 9/17/07
218
5.2.4 Core Question Summary This radar chart shows aggregate results for the core survey questions. Each axis represents one question. A code to identify each question is displayed at the outer point of each axis. While questions for each dimension of library service quality are scattered randomly throughout the survey, on this chart they are grouped into sections: Affect of Service, Library as Place, and Information Control. On each axis, respondents' minimum, desired, and perceived levels of service quality are plotted, and the resulting "gaps" between the three levels (representing service adequacy or service superiority) are shaded in blue, yellow, green, and red. The two following tables show mean scores and standard deviations for each question, where n is the number of respondents for each particular question. (For a more detailed explanation of the headings, see the Introduction to this notebook.)

Revised 9/17/07
219

Revised 9/17/07
220
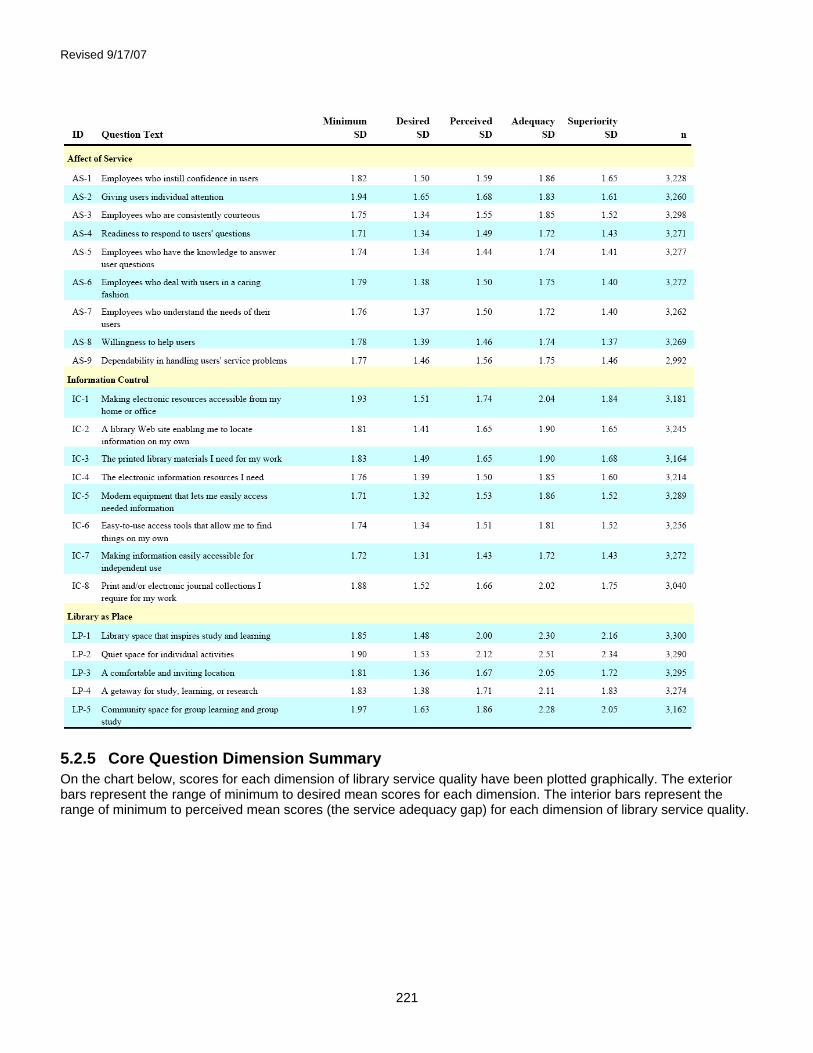
Revised 9/17/07
221
5.2.5 Core Question Dimension Summary On the chart below, scores for each dimension of library service quality have been plotted graphically. The exterior bars represent the range of minimum to desired mean scores for each dimension. The interior bars represent the range of minimum to perceived mean scores (the service adequacy gap) for each dimension of library service quality.

Revised 9/17/07
222
5.2.6 Local Questions Summary This table shows mean scores for each of the local questions added by the individual library or consortium, where n is the number of respondents for each particular question. (For a more detailed explanation of the headings, see the Introduction to this notebook.)

Revised 9/17/07
223
This table displays the standard deviation for each of the local questions added by the individual library or consortium, where n is the number of respondents for each particular question. (For a more detailed explanation of the headings, see the Introduction to this notebook.)
5.2.7 General Satisfaction Questions Summary This table displays mean score and standard deviation for each of the general satisfaction questions: Satisfaction with Treatment, Satisfaction with Support, and Satisfaction with Overall Quality of Service, where n is the number of respondents for each particular question. These scores are calculated from responses to the general satisfaction questions on the LibQUAL+® survey, in which respondents rated their levels of general satisfaction on a scale from 1-9.

Revised 9/17/07
224
5.2.8 Information Literacy Outcomes Questions Summary This table displays the mean score and standard deviation for each of the information literacy outcomes questions, where n is the number of respondents for each particular question. These scores are calculated from responses to the information literacy outcomes questions on the LibQUAL+® survey, in which respondents rated their levels of general satisfaction on a scale from 1-9 with 1 being "strongly disagree" and 9 representing "strongly agree".

Revised 9/17/07
225
5.2.9 Library Use Summary This chart shows a graphic representation of library use (both on the premises and electronically), as well as use of non-library information gateways such as Yahoo™ and Google™. Bars represent the frequency with which respondents report using these resources: Daily, Weekly, Monthly, Quarterly, or Never. The table below the chart displays the number and percentage of respondents who selected each option.

Revised 9/17/07
226
5.3 Community College Libraries – Faculty
5.3.1 Population and Respondent Profiles by Standard Discipline The chart and table below show a breakdown of survey respondents by discipline, based on user responses to the demographic questions and the demographic data provided by institutions in the online Representativeness section*. This section shows survey respondents broken down based on the LibQUAL+® standard discipline categories. The chart maps percentage of respondents for each discipline in red. Population percentages for each discipline are mapped in blue. The table shows the number and percentage for each discipline, for the general population (N) and for survey respondents (n). *Note: Participating institutions were not required to complete the Representativeness section. When population data is missing or incomplete, it is because this data was not provided.
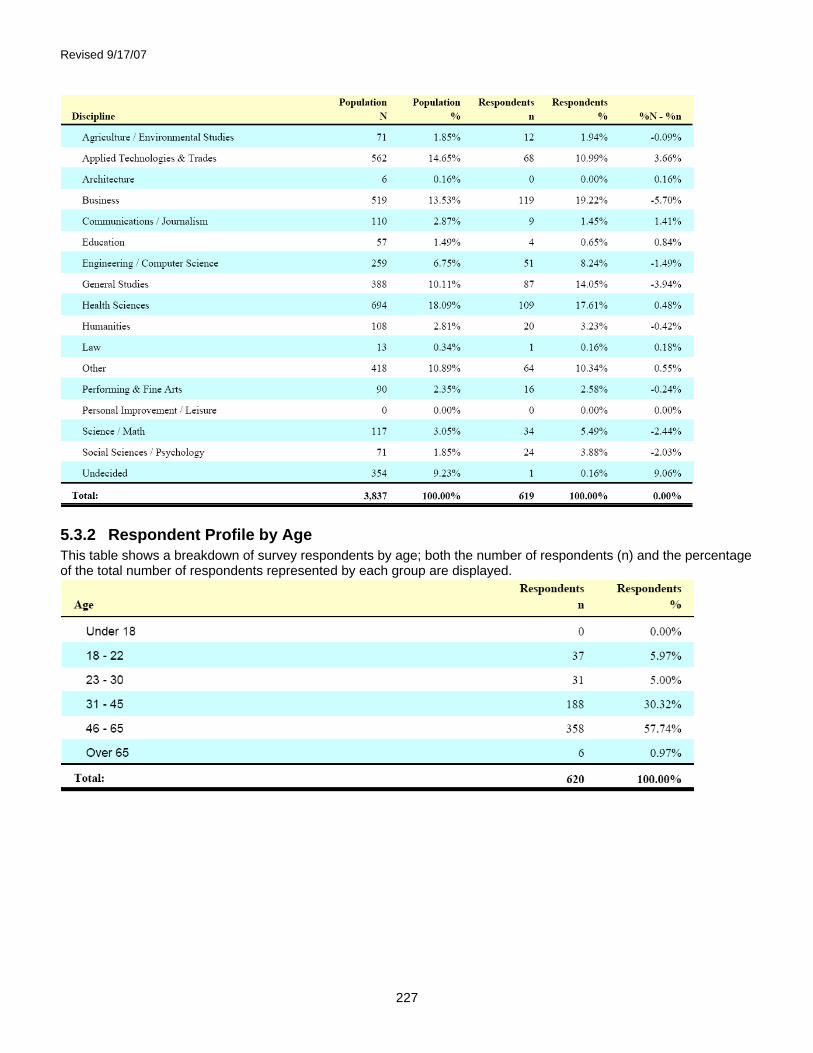
Revised 9/17/07
227
5.3.2 Respondent Profile by Age This table shows a breakdown of survey respondents by age; both the number of respondents (n) and the percentage of the total number of respondents represented by each group are displayed.

Revised 9/17/07
228
5.3.3 Population and Respondent Profile by Sex The table below shows a breakdown of survey respondents by sex, based on user responses to the demographic questions and the demographic data provided by institutions in the online Representativeness section* . The number and percentage for each sex are given for the general population and for survey respondents. * Note: Participating institutions were not required to complete the Representativness section. When population data is missing or incomplete, it is because this data was not provided.
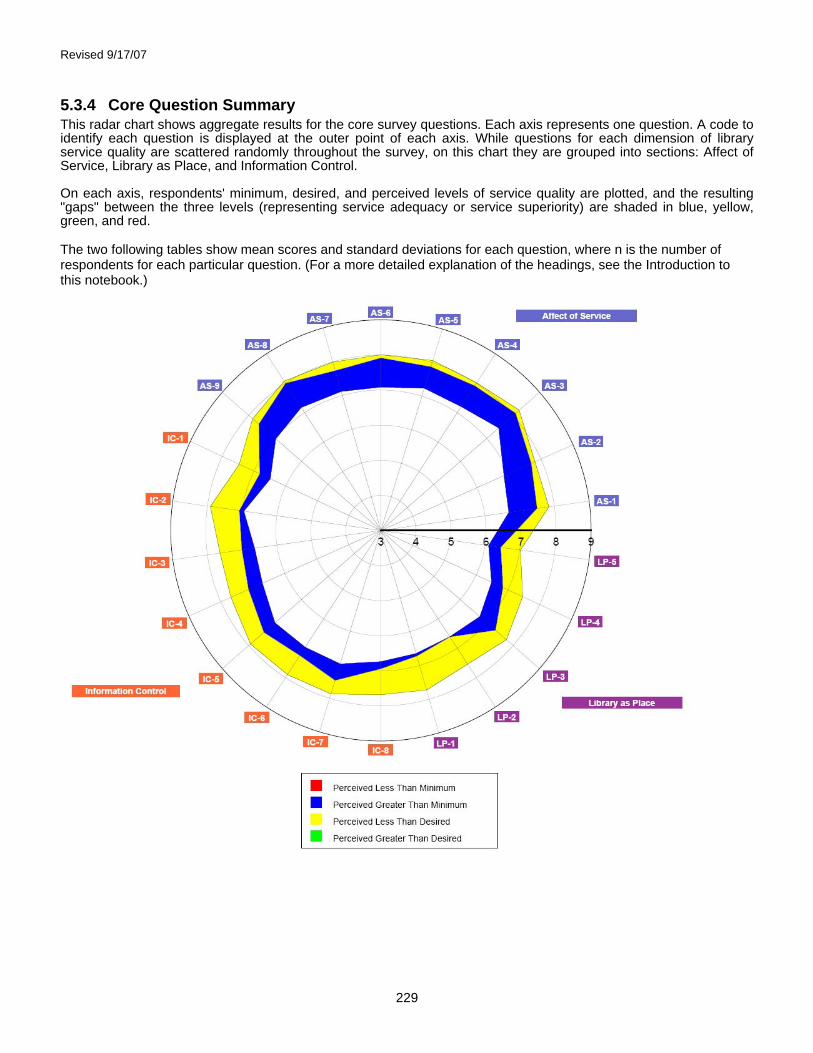
Revised 9/17/07
229
5.3.4 Core Question Summary This radar chart shows aggregate results for the core survey questions. Each axis represents one question. A code to identify each question is displayed at the outer point of each axis. While questions for each dimension of library service quality are scattered randomly throughout the survey, on this chart they are grouped into sections: Affect of Service, Library as Place, and Information Control. On each axis, respondents' minimum, desired, and perceived levels of service quality are plotted, and the resulting "gaps" between the three levels (representing service adequacy or service superiority) are shaded in blue, yellow, green, and red. The two following tables show mean scores and standard deviations for each question, where n is the number of respondents for each particular question. (For a more detailed explanation of the headings, see the Introduction to this notebook.)
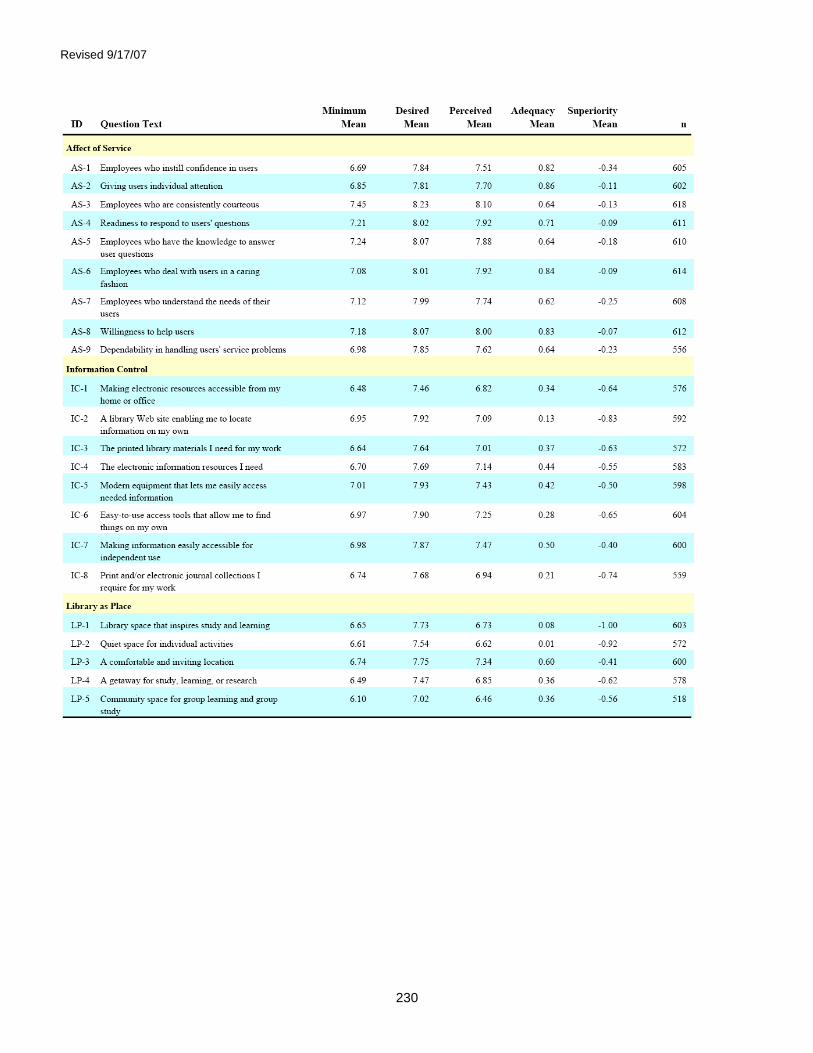
Revised 9/17/07
230

Revised 9/17/07
231
5.3.5 Core Question Dimension Summary On the chart below, scores for each dimension of library service quality have been plotted graphically. The exterior bars represent the range of minimum to desired mean scores for each dimension. The interior bars represent the range of minimum to perceived mean scores (the service adequacy gap) for each dimension of library service quality.

Revised 9/17/07
232
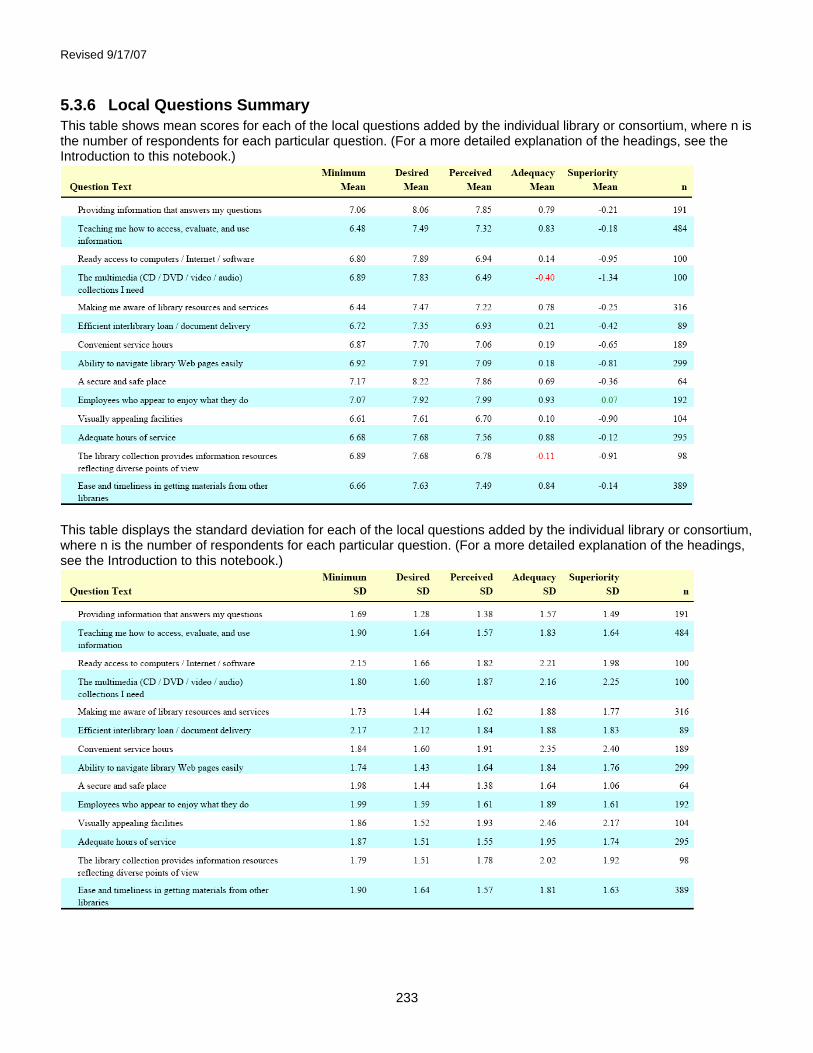
Revised 9/17/07
233
5.3.6 Local Questions Summary This table shows mean scores for each of the local questions added by the individual library or consortium, where n is the number of respondents for each particular question. (For a more detailed explanation of the headings, see the Introduction to this notebook.)
This table displays the standard deviation for each of the local questions added by the individual library or consortium, where n is the number of respondents for each particular question. (For a more detailed explanation of the headings, see the Introduction to this notebook.)

Revised 9/17/07
234
5.3.7 General Satisfaction Questions Summary This table displays mean score and standard deviation for each of the general satisfaction questions: Satisfaction with Treatment, Satisfaction with Support, and Satisfaction with Overall Quality of Service, where n is the number of respondents for each particular question. These scores are calculated from responses to the general satisfaction questions on the LibQUAL+® survey, in which respondents rated their levels of general satisfaction on a scale from 1-9.
5.3.8 Information Literacy Outcomes Questions Summary This table displays the mean score and standard deviation for each of the information literacy outcomes questions, where n is the number of respondents for each particular question. These scores are calculated from responses to the information literacy outcomes questions on the LibQUAL+® survey, in which respondents rated their levels of general satisfaction on a scale from 1-9 with 1 being "strongly disagree" and 9 representing "strongly agree".
5.3.9 Library Use Summary This chart shows a graphic representation of library use (both on the premises and electronically), as well as use of non-library information gateways such as Yahoo™ and Google™. Bars represent the frequency with which respondents report using these resources: Daily, Weekly, Monthly, Quarterly, or Never. The table below the chart displays the number and percentage of respondents who selected each option.

Revised 9/17/07
235

Revised 9/17/07
236
5.4 Community College Libraries – Library Staff
5.4.1 Respondent Profile by Age This table shows a breakdown of survey respondents by age; both the number of respondents (n) and the percentage of the total number of respondents represented by each group are displayed.
5.4.2 Population and Respondent Profile by Sex The table below shows a breakdown of survey respondents by sex, based on user responses to the demographic questions and the demographic data provided by institutions in the online Representativeness section* . The number and percentage for each sex are given for the general population and for survey respondents. * Note: Participating institutions were not required to complete the Representativness section. When population data is missing or incomplete, it is because this data was not provided.
5.4.3 Core Question Summary Core Quest This radar chart shows aggregate results for the core survey questions. Each axis represents one question. A code to identify each question is displayed at the outer point of each axis. While questions for each dimension of library service quality are scattered randomly throughout the survey, on this chart they are grouped into sections: Affect of Service, Library as Place, and Information Control. On each axis, respondents' minimum, desired, and perceived levels of service quality are plotted, and the resulting "gaps" between the three levels (representing service adequacy or service superiority) are shaded in blue, yellow, green, and red. The two following tables show mean scores and standard deviations for each question, where n is the number of respondents for each particular question. (For a more detailed explanation of the headings, see the Introduction to this notebook.)

Revised 9/17/07
237
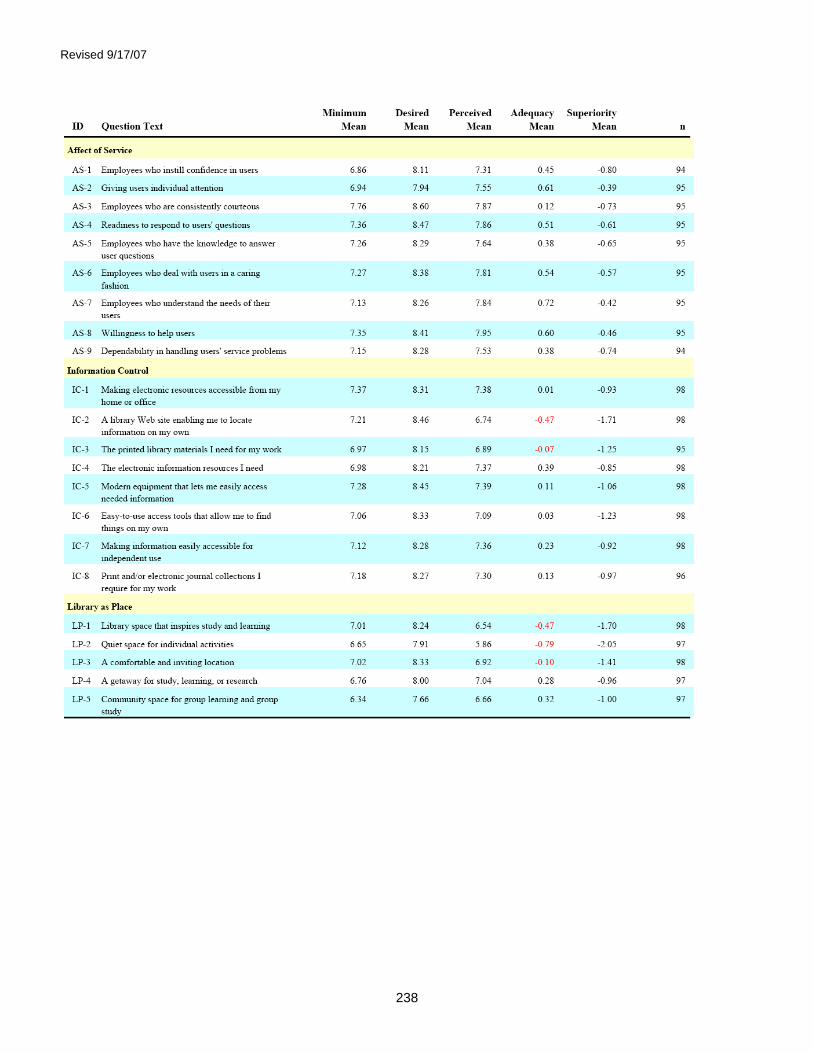
Revised 9/17/07
238

Revised 9/17/07
239
5.4.4 Core Question Dimension Summary On the chart below, scores for each dimension of library service quality have been plotted graphically. The exterior bars represent the range of minimum to desired mean scores for each dimension. The interior bars represent the range of minimum to perceived mean scores (the service adequacy gap) for each dimension of library service quality.
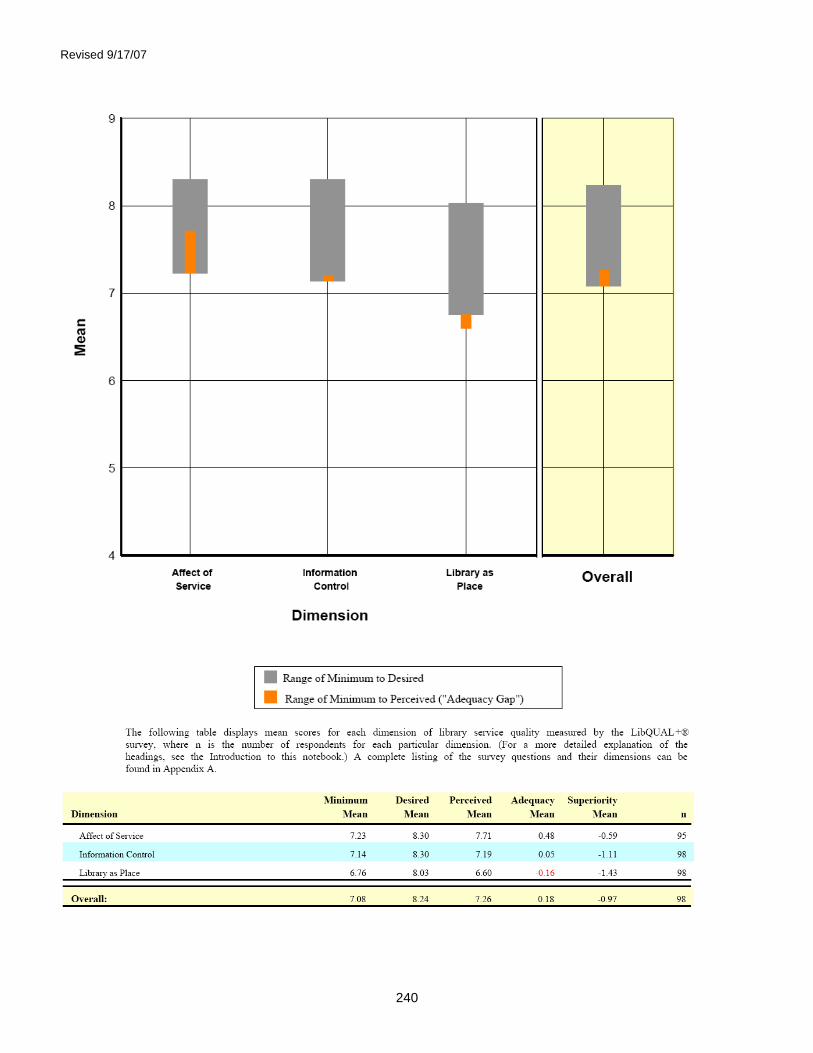
Revised 9/17/07
240
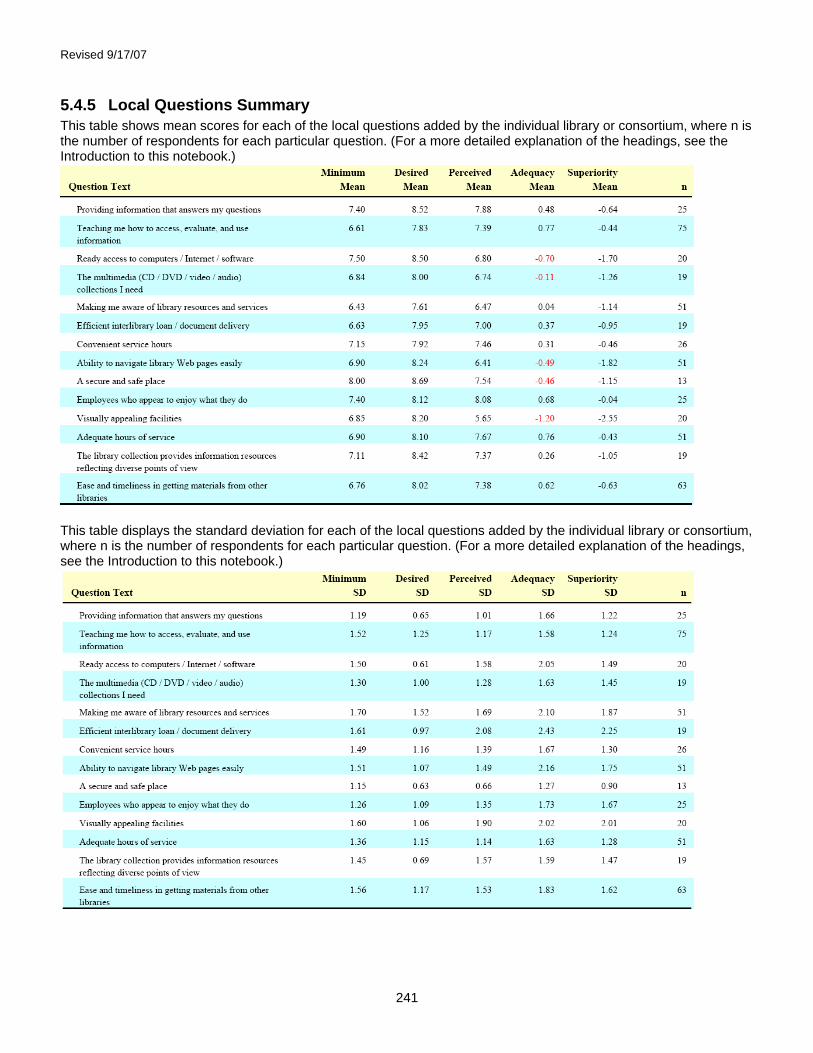
Revised 9/17/07
241
5.4.5 Local Questions Summary This table shows mean scores for each of the local questions added by the individual library or consortium, where n is the number of respondents for each particular question. (For a more detailed explanation of the headings, see the Introduction to this notebook.)
This table displays the standard deviation for each of the local questions added by the individual library or consortium, where n is the number of respondents for each particular question. (For a more detailed explanation of the headings, see the Introduction to this notebook.)
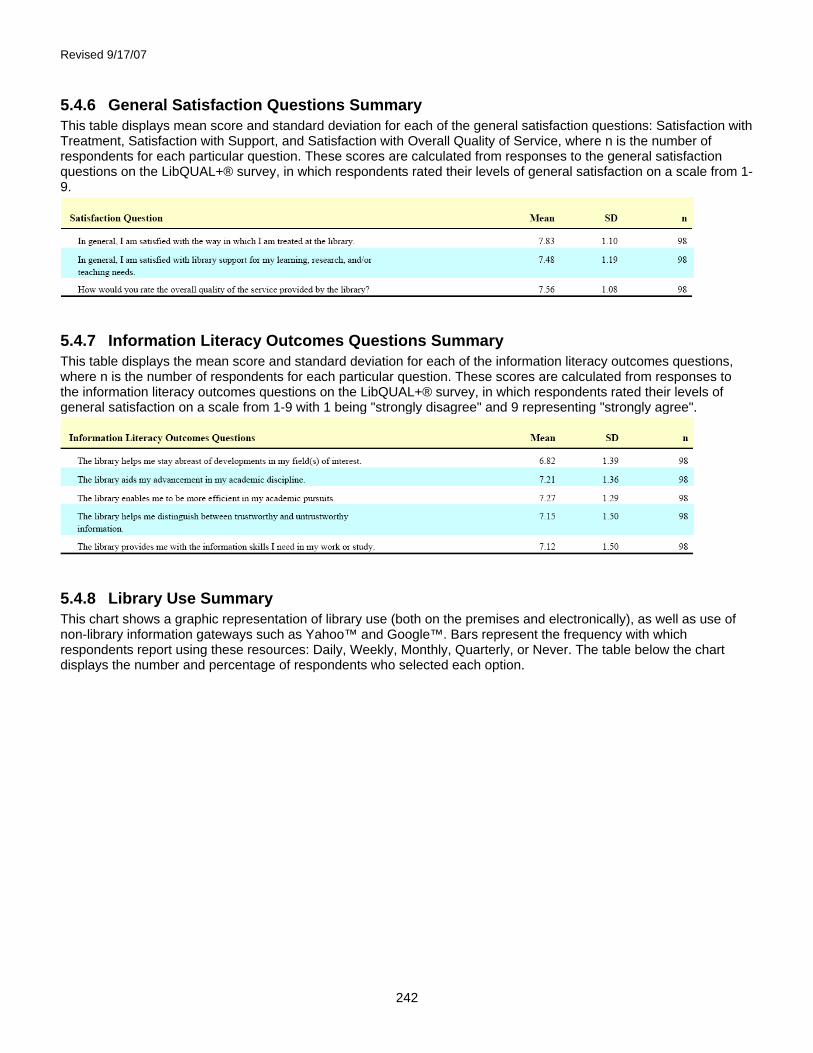
Revised 9/17/07
242
5.4.6 General Satisfaction Questions Summary This table displays mean score and standard deviation for each of the general satisfaction questions: Satisfaction with Treatment, Satisfaction with Support, and Satisfaction with Overall Quality of Service, where n is the number of respondents for each particular question. These scores are calculated from responses to the general satisfaction questions on the LibQUAL+® survey, in which respondents rated their levels of general satisfaction on a scale from 1-9.
5.4.7 Information Literacy Outcomes Questions Summary This table displays the mean score and standard deviation for each of the information literacy outcomes questions, where n is the number of respondents for each particular question. These scores are calculated from responses to the information literacy outcomes questions on the LibQUAL+® survey, in which respondents rated their levels of general satisfaction on a scale from 1-9 with 1 being "strongly disagree" and 9 representing "strongly agree".
5.4.8 Library Use Summary This chart shows a graphic representation of library use (both on the premises and electronically), as well as use of non-library information gateways such as Yahoo™ and Google™. Bars represent the frequency with which respondents report using these resources: Daily, Weekly, Monthly, Quarterly, or Never. The table below the chart displays the number and percentage of respondents who selected each option.
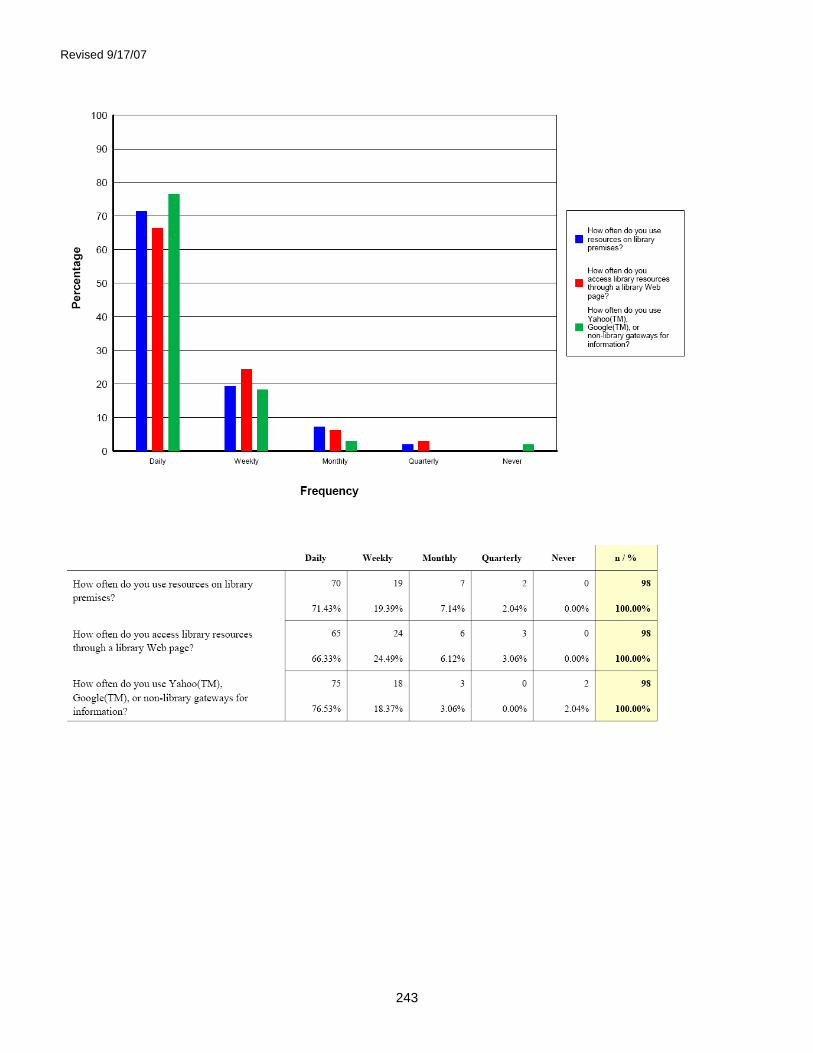
Revised 9/17/07
243

Revised 9/17/07
244
5.5 Community College Libraries – Staff
5.5.1 Respondent Profile by Age This table shows a breakdown of survey respondents by age; both the number of respondents (n) and the percentage of the total number of respondents represented by each group are displayed.
5.5.2 Population and Respondent Profile by Sex The table below shows a breakdown of survey respondents by sex, based on user responses to the demographic questions and the demographic data provided by institutions in the online Representativeness section* . The number and percentage for each sex are given for the general population and for survey respondents. * Note: Participating institutions were not required to complete the Representativness section. When population data is missing or incomplete, it is because this data was not provided.
5.5.3 Core Question Summary This radar chart shows aggregate results for the core survey questions. Each axis represents one question. A code to identify each question is displayed at the outer point of each axis. While questions for each dimension of library service quality are scattered randomly throughout the survey, on this chart they are grouped into sections: Affect of Service, Library as Place, and Information Control. On each axis, respondents' minimum, desired, and perceived levels of service quality are plotted, and the resulting "gaps" between the three levels (representing service adequacy or service superiority) are shaded in blue, yellow, green, and red. The two following tables show mean scores and standard deviations for each question, where n is the number of respondents for each particular question. (For a more detailed explanation of the headings, see the Introduction to this notebook.)

Revised 9/17/07
245

Revised 9/17/07
246
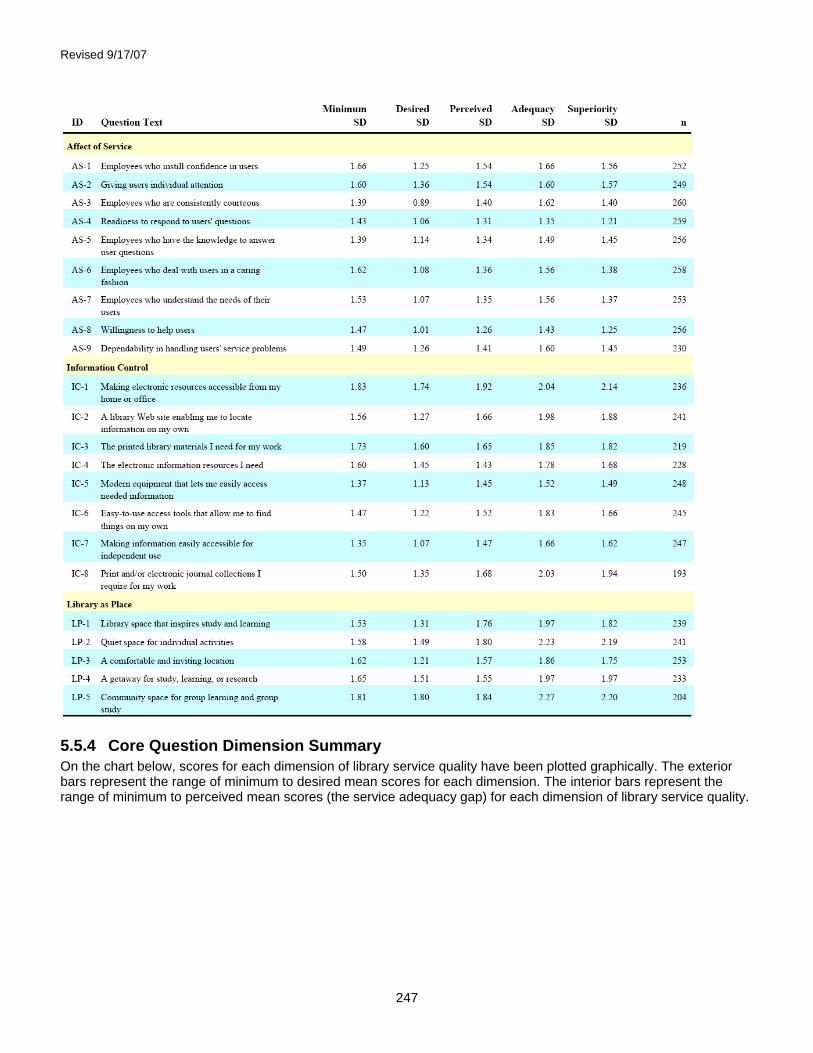
Revised 9/17/07
247
5.5.4 Core Question Dimension Summary On the chart below, scores for each dimension of library service quality have been plotted graphically. The exterior bars represent the range of minimum to desired mean scores for each dimension. The interior bars represent the range of minimum to perceived mean scores (the service adequacy gap) for each dimension of library service quality.
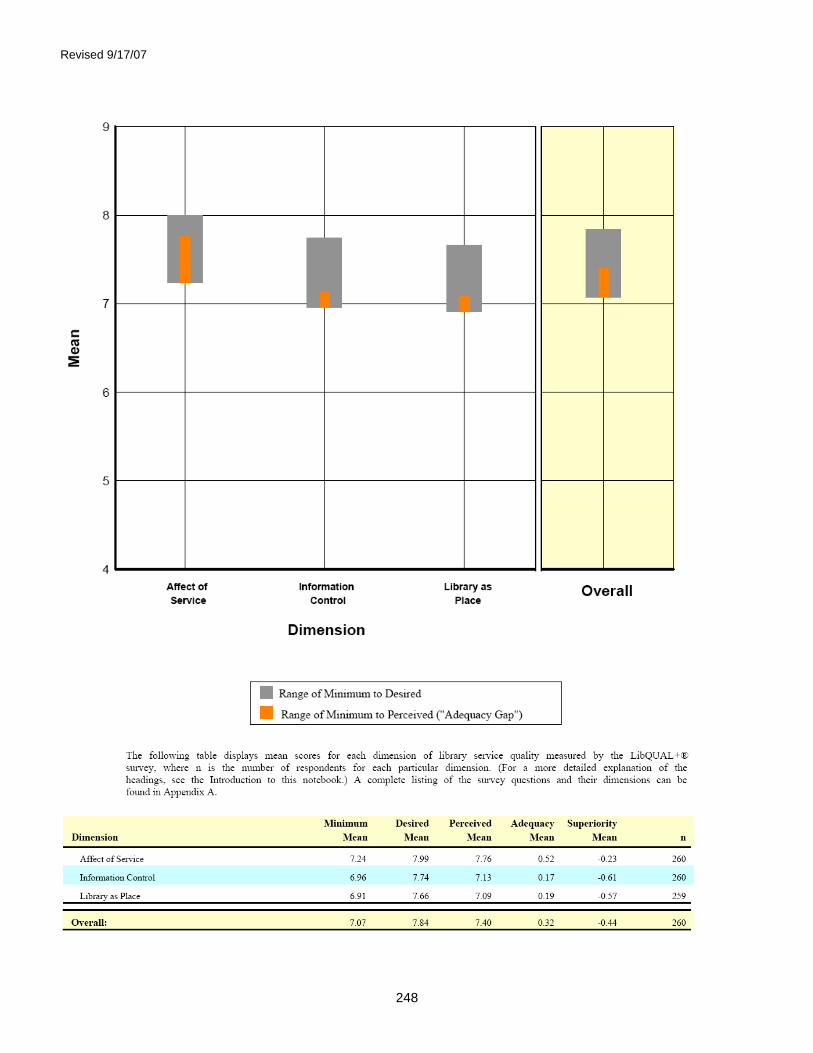
Revised 9/17/07
248

Revised 9/17/07
249
5.5.5 Local Questions Summary This table shows mean scores for each of the local questions added by the individual library or consortium, where n is the number of respondents for each particular question. (For a more detailed explanation of the headings, see the Introduction to this notebook.)
This table displays the standard deviation for each of the local questions added by the individual library or consortium, where n is the number of respondents for each particular question. (For a more detailed explanation of the headings, see the Introduction to this notebook.)

Revised 9/17/07
250
5.5.6 General Satisfaction Questions Summary This table displays mean score and standard deviation for each of the general satisfaction questions: Satisfaction with Treatment, Satisfaction with Support, and Satisfaction with Overall Quality of Service, where n is the number of respondents for each particular question. These scores are calculated from responses to the general satisfaction questions on the LibQUAL+® survey, in which respondents rated their levels of general satisfaction on a scale from 1-9.
5.5.7 Information Literacy Outcomes Questions Summary This table displays the mean score and standard deviation for each of the information literacy outcomes questions, where n is the number of respondents for each particular question. These scores are calculated from responses to the information literacy outcomes questions on the LibQUAL+® survey, in which respondents rated their levels of general satisfaction on a scale from 1-9 with 1 being "strongly disagree" and 9 representing "strongly agree".
5.5.8 Library Use Summary This chart shows a graphic representation of library use (both on the premises and electronically), as well as use of non-library information gateways such as Yahoo™ and Google™. Bars represent the frequency with which respondents report using these resources: Daily, Weekly, Monthly, Quarterly, or Never. The table below the chart displays the number and percentage of respondents who selected each option.
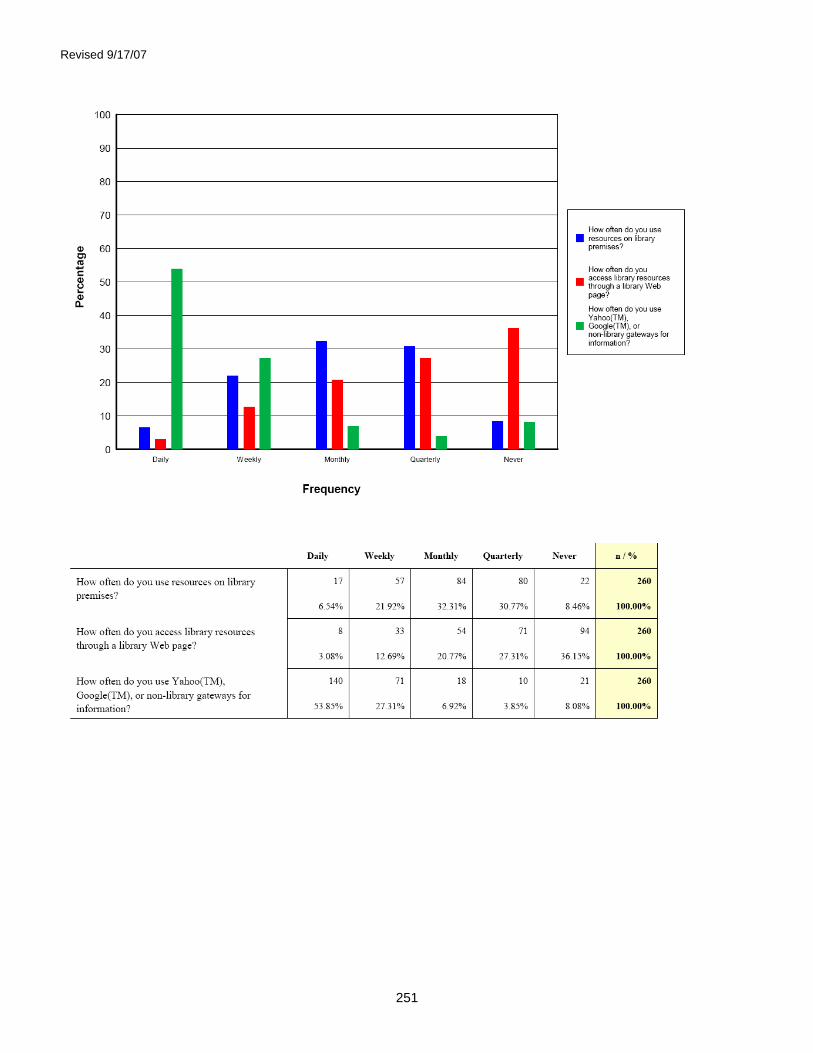
Revised 9/17/07
251

Revised 9/17/07
252
6 Appendix A: LibQUAL+® Dimensions LibQUAL+® measures dimensions of perceived library quality---that is, each survey question is part of a broader category (a dimension), and scores within those categories are analyzed in order to derive more general information about library users' perceptions of service. These dimensions were first based on the original SERVQUAL survey instrument (the framework for the LibQUAL+® survey tool; for more information on the origins of LibQUAL+®, go to <http://www.libqual.org/Publications/>). The LibQUAL+® survey dimensions have evolved with each iteration, becoming more refined and focused for application to the library context. Dimensions for each iteration of the LibQUAL+® survey are outlined below. LibQUAL+® 2000 Dimensions The 2000 iteration of the LibQUAL+® survey, which had 41 questions, measured eight separate dimensions:
� Assurance (the knowledge and courtesy of employees, and their ability to convey trust and confidence) � Empathy (caring, individual attention) � Library as Place (library as a sanctuary/haven or site for learning and contemplation) � Reliability (ability to perform the promised service dependably and accurately) � Responsiveness (willingness to help customers and provide prompt service) � Tangibles (appearance of physical facilities, equipment, personnel and communications materials) � Instructions/Custom Items � Self-Reliance
LibQUAL+® 2001 Dimensions After careful analysis of the results from the 2000 survey, the dimensions were further refined to re-ground the SERVQUAL items in the library context. Four sub-dimensions resulted for the 2001 iteration:
� Service Affect (nine items, such as “willingness to help users”) � Library as Place (five items, such as “a haven for quiet and solitude”) � Personal Control (six items, such as “website enabling me to locate information on my own”), and � Information Access (five items, such as “comprehensive print collections” and “convenient business hours”)
LibQUAL+® 2002 and 2003 Dimensions For the 2002 iteration of the LibQUAL+® survey, the dimensions were once again refined based on analysis of the previous year's results. While the four dimensions were retained, their titles were changed slightly to more clearly represent the questions and data. The same four dimensions were also used on the 2003 survey:
� Access to Information � Affect of Service � Library as Place � Personal Control
LibQUAL+® 2004 - 2007 Dimensions After the 2003 survey was completed, factor and reliability analyses on the resulting data revealed that two of the dimensions measured by the survey-Access to Information and Personal Control-had collapsed into one. The following three dimensions have been measured since then: Affect of Service, Information Control, and Library as

Revised 9/17/07
253
Place. In addition, three core items were eliminated from the 2003 version of the survey, leaving 22 core items on the final survey instrument. The list below displays the dimensions used to present the results in the 2007 notebooks, along with the questions that relate to each dimension. (Note: The questions below are those used in the College and University implementation of the survey, American English version.) Affect of Service [AS-1] Employees who instill confidence in users [AS-2] Giving users individual attention [AS-3] Employees who are consistently courteous [AS-4] Readiness to respond to users’ questions [AS-5] Employees who have the knowledge to answer user questions [AS-6] Employees who deal with users in a caring fashion [AS-7] Employees who understand the needs of their users [AS-8] Willingness to help users [AS-9] Dependability in handling users’ service problems Information Control [IC-1] Making electronic resources accessible from my home or office [IC-2] A library Web site enabling me to locate information on my own [IC-3] The printed library materials I need for my work [IC-4] The electronic information resources I need [IC-5] Modern equipment that lets me easily access needed information [IC-6] Easy-to-use access tools that allow me to find things on my own [IC-7] Making information easily accessible for independent use [IC-8] Print and/or electronic journal collections I require for my work Library as Place [LP-1] Library space that inspires study and learning [LP-2] Quiet space for individual activities [LP-3] A comfortable and inviting location [LP-4] A getaway for study, learning or research [LP-5] Community space for group learning and group study

Revised 9/17/07
254

Revised 9/17/07
255
Association of Research Libraries 21 Dupont Circle NW
Suite 800 Washington, DC 20036
Phone 202-296-2296 Fax 202-872-0884
http://www.libqual.org Copyright © 2007 Association of Research Libraries
59407-772-X (paperback) ISBN 1-59407-773-8 (PDF)