libor - sizing the potential damage - bluematrix
TRANSCRIPT

European Banks 16 July 2012
LIBOR - Sizing the potential damage
The potential financial and reputational damage caused by Barclays' falseLIBOR submissions has rightly raised company and sector concerns.Unequivocally, the LIBOR probes are a negative development and could havewide-ranging consequences. The direct financial penalties (£290m for Barclays)are unhelpful, but likely to be very manageable. The far larger issue is thepotential for (1) substantial civil damages, and/or (2) implications for seniormanagement if found to be complicit. While we claim no legal expertise andacknowledge that estimates are necessarily speculative, we attempt to sizepotential industry damages. We arrive at U$35bn. Most impacted would beBarclays/RBS/Deutsche, where our estimated damages amount to£3.1bn/£3.0bn/€3.4bn, accounting for 46%/18%/34% of 2012-14E Basel 3 capitalbuild, respectively. We take some comfort from (1) prior securities settlements,and (2) a likely elongated legal process, and our base case is that this situationdoes not bring with it external capital risk.
Civil actions could be material... Direct damages (ie, fines) are likely to be verymanageable, and we see greater financial risk from potential civil actions. We size thepotential issue for the industry, but with inherent difficulty in estimation, we caveatthat the list of assumptions in our methodology is long, the numbers large and thesensitivities high.
...we estimate U$35bn of industry settlements. We estimate U$35bn for theindustry, 0.1-1.2% of 2012E B2 RWAs across the European panel banks. We use thenotional size of the (large) interest rate derivatives market as our base, adjusted foraffected currencies and intra-dealer exposures. We then estimate the period affected,level of LIBOR suppression and the size of any settlement as a % of overall possibledamages. We provide a sensitivity.
Burden of proof will be high. We find little correlation between the average CDS ofthe panel banks and LIBOR-OIS, simplistically leaving some element of suppressionfrom the panel banks as possible. However, correlations alone are not incontrovertibleand we believe the burden of proof will be high.
Recommendations intact. Large, class action lawsuits take a lot of time to complete,with 5-8 years between filing and settlement not uncommon, in turn allowing even themost impacted banks to increase capital ratios ahead of any potential settlement. Weremain buyers of Barclays (tgt, 280p), RBS (tgt 330p), Credit Suisse (tgt CHF 27.2),UBS (CHF 16.8) and HSBC (tgt 640p).
Industry Update
Mark Phin, CFAAnalyst+44 20 7663 [email protected]
Andrew StimpsonAnalyst+44 20 7663 [email protected]
Vasco MorenoAnalyst+44 20 7663 [email protected]
Luke BirtwistleAssociate+44 207 663 [email protected]
Please refer to important disclosures and analyst certification information on pages 22 - 25.
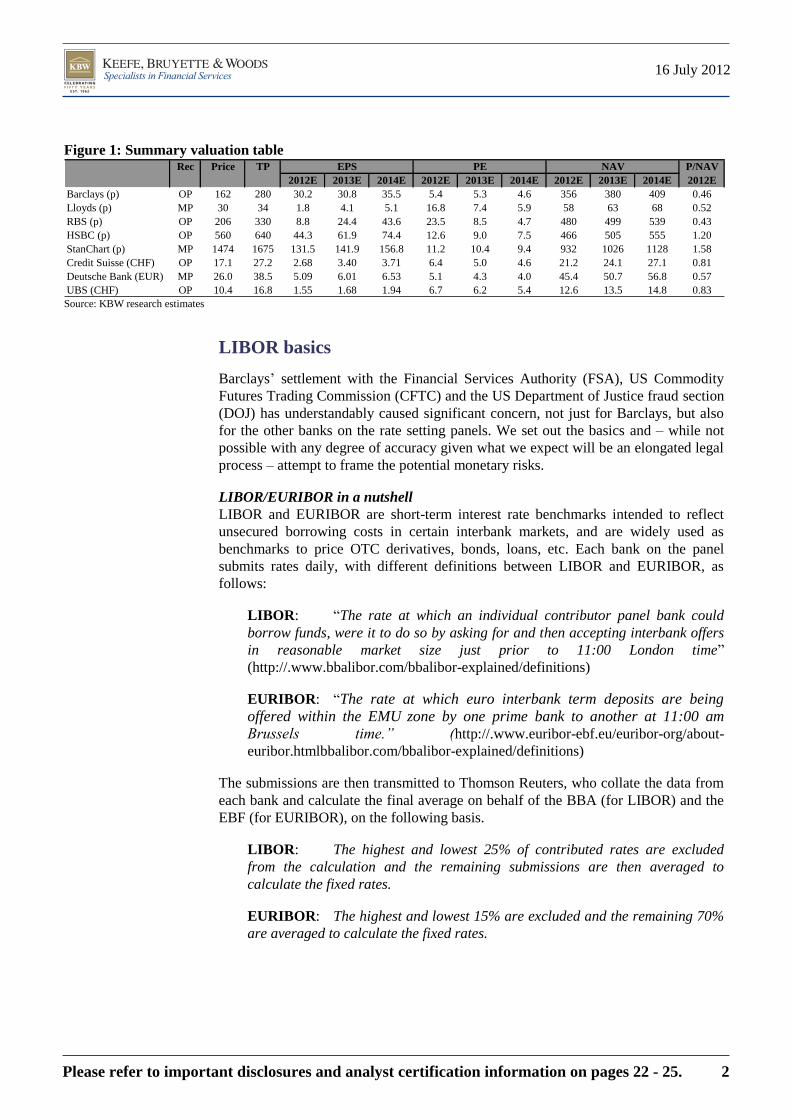
Figure 1: Summary valuation table Rec Price TP P/NAV
2012E 2013E 2014E 2012E 2013E 2014E 2012E 2013E 2014E 2012E
Barclays (p) OP 162 280 30.2 30.8 35.5 5.4 5.3 4.6 356 380 409 0.46
Lloyds (p) MP 30 34 1.8 4.1 5.1 16.8 7.4 5.9 58 63 68 0.52
RBS (p) OP 206 330 8.8 24.4 43.6 23.5 8.5 4.7 480 499 539 0.43
HSBC (p) OP 560 640 44.3 61.9 74.4 12.6 9.0 7.5 466 505 555 1.20
StanChart (p) MP 1474 1675 131.5 141.9 156.8 11.2 10.4 9.4 932 1026 1128 1.58
Credit Suisse (CHF) OP 17.1 27.2 2.68 3.40 3.71 6.4 5.0 4.6 21.2 24.1 27.1 0.81
Deutsche Bank (EUR) MP 26.0 38.5 5.09 6.01 6.53 5.1 4.3 4.0 45.4 50.7 56.8 0.57
UBS (CHF) OP 10.4 16.8 1.55 1.68 1.94 6.7 6.2 5.4 12.6 13.5 14.8 0.83
EPS PE NAV
Source: KBW research estimates
LIBOR basics
Barclays‘ settlement with the Financial Services Authority (FSA), US Commodity
Futures Trading Commission (CFTC) and the US Department of Justice fraud section
(DOJ) has understandably caused significant concern, not just for Barclays, but also
for the other banks on the rate setting panels. We set out the basics and – while not
possible with any degree of accuracy given what we expect will be an elongated legal
process – attempt to frame the potential monetary risks.
LIBOR/EURIBOR in a nutshell
LIBOR and EURIBOR are short-term interest rate benchmarks intended to reflect
unsecured borrowing costs in certain interbank markets, and are widely used as
benchmarks to price OTC derivatives, bonds, loans, etc. Each bank on the panel
submits rates daily, with different definitions between LIBOR and EURIBOR, as
follows:
LIBOR: ―The rate at which an individual contributor panel bank could
borrow funds, were it to do so by asking for and then accepting interbank offers
in reasonable market size just prior to 11:00 London time‖
(http://.www.bbalibor.com/bbalibor-explained/definitions)
EURIBOR: ―The rate at which euro interbank term deposits are being offered within the EMU zone by one prime bank to another at 11:00 am Brussels time.” (http://.www.euribor-ebf.eu/euribor-org/about-
euribor.htmlbbalibor.com/bbalibor-explained/definitions)
The submissions are then transmitted to Thomson Reuters, who collate the data from
each bank and calculate the final average on behalf of the BBA (for LIBOR) and the
EBF (for EURIBOR), on the following basis.
LIBOR: The highest and lowest 25% of contributed rates are excluded
from the calculation and the remaining submissions are then averaged to
calculate the fixed rates.
EURIBOR: The highest and lowest 15% are excluded and the remaining 70%
are averaged to calculate the fixed rates.
Please refer to important disclosures and analyst certification information on pages 22 - 25. 2
16 July 2012

Figure 2: BBA LIBOR panel banks, 2007
USD GBP EUR
Bank of America Abbey National plc Bank of America
Bank of Tokyo – Mitsubishi UFJ Bank of America Barclays Bank plc
Barclays Bank plc Bank of Tokyo – Mitsubishi UFJ Bank of Tokyo – Mitsubishi UFJ
Citibank NA BNP Paribas Citibank NA
Credit Suisse Barclays Bank plc Credit Suisse
Deutsche Bank AG Citibank NA Deutsche Bank AG
HBOS Deutsche Bank AG HBOS
HSBC HBOS HSBC
JP Morgan Chase HSBC JP Morgan Chase
Lloyds TSB Bank plc JP Morgan Chase Lloyds TSB Bank plc
Rabobank Lloyds TSB Bank plc Rabobank
Royal Bank of Canada Rabobank Royal Bank of Canada
The Norinchukin Bank Royal Bank of Canada Société Générale
The Royal Bank of Scotland Group The Royal Bank of Scotland Group The Royal Bank of Scotland Group
UBS AG UBS AG UBS AG
West LB AG West LB AG West LB AG
JPY CHF
Bank of America Barclays Bank plc
Bank of Tokyo – Mitsubishi UFJ Bank of Tokyo – Mitsubishi UFJ
Barclays Bank plc Citibank NA
Citibank NA Credit Suisse
Deutsche Bank AG Deutsche Bank AG
HSBC HSBC
JP Morgan Chase JP Morgan Chase
Lloyds TSB Bank plc Lloyds TSB Bank plc
Mizuho Corporate Bank Société Générale
Rabobank The Royal Bank of Scotland Group
Société Générale UBS AG
Sumitomo Mitsui Banking Corporation Europe Ltd (SMBCE)West LB AG
The Norinchukin Bank
The Royal Bank of Scotland Group
UBS AG
West LB AG Source: BBA, KBW Research. NB. KBW European coverage emboldened by KBW Research
Barclays LIBOR-related settlement
Simply put, at various times, Barclays input false LIBOR/EURIBOR submissions.
There are, however, two very separate reasons leading to separate implications:
1. Trading positions of its derivative traders: Employees responsible for
LIBOR/EURIBOR submissions accommodated trader requests (in at least
London, New York and Tokyo) on the level of those submissions. On
occasion, that affected the overall LIBOR average. There was also co-
ordination with traders at other financial institutions, including other panel
members. There was a clear profit motive. Additionally, the FSA identifies
systems and control failings at Barclays, as well as compliance failings (as
LIBOR-related issues were escalated to the IB compliance function on three
occasions in 2007/8). It is very clear from the documentation that Barclays
was not alone here, and we would fully expect other banks and individuals
to be implicated. At this stage, though, we do not know exactly which ones.
Barclays traders not
alone in
manipulating LIBOR
Please refer to important disclosures and analyst certification information on pages 22 - 25. 3
16 July 2012

2. Concerns about negative media attention: In 2008, Barclays‘ relatively
high USD LIBOR submissions were cited by the press as, perhaps, reflective
of liquidity issues. As a result, Barclays‘ senior management (now known to
be Jerry del Missier, COO) directed that those submissions should be
lowered, resulting in input rates that did not reflect the cost of obtaining
interbank funding. There is no evidence that the intention of Barclays‘
management was to affect official published LIBOR rates. We think this is
potentially a far bigger issue for the industry given the magnitude of the
possible suppression and subsequent damages.
Being outside the banks means that judging this will always be a tricky exercise.
However, we believe it is sensible to assume that there should be a correlation
between the LIBOR-OIS spread and the average CDS spread of the LIBOR panel
banks. While some periods do show an element of correlation (2H11, 2Q10, 1Q09),
the majority does not tally: we note that LIBOR-OIS came down materially in 2H08
even as CDS continued rising until March 2009.
Figure 3: Panel-bank CDS correlates poorly with LIBOR-OIS
0.0
1.0
2.0
3.0
4.0
5.0
6.0
06
/07
08
/07
10
/07
12
/07
02
/08
04
/08
06
/08
08
/08
10
/08
12
/08
02
/09
04
/09
06
/09
08
/09
10
/09
12
/09
02
/10
04
/10
06
/10
08
/10
10
/10
12
/10
02
/11
04
/11
06
/11
08
/11
10
/11
12
/11
02
/12
04
/12
06
/12
%
U$ 3 Mth LIBOR LIBOR/OIS spread Average CDS of U$ LIBOR panel
Source: Bloomberg, BBA, KBW Research
Three potential impacts
Direct financial penalties: The combined financial penalties imposed on
Barclays were £290m, following settlement with the DoJ (U$160m), US
CFTC (U$200m) and FSA £59.5m (after a 30% discount for early
settlement). While unhelpful, with a c£100m provision taken in 1Q12, the
charge represents a modest c5bps of 1Q12 RWAs. In addition, Barclays was
granted conditional leniency from the DoJ in connection with antitrust
violations with respect to financial instruments that reference EURIBOR.
Management implications: The fallout from the LIBOR case has already
resulted in (1) the resignation of Marcus Agius (Chairman) on 2nd
July, (2)
the resignation of Bob Diamond (CEO) on 3rd
July (with Marcus Agius
named as interim full-time Chairman to lead the search for a new CEO), and
(3) Jerry del Missier (COO) on 3rd
July (following disclosure that he passed
direction to the LIBOR submitters to lower inputs). To date, none of the
Bigger issue: were all
banks suppressing the
LIBOR average?
Please refer to important disclosures and analyst certification information on pages 22 - 25. 4
16 July 2012

divisional managers have been affected, nor implicated, but it is impossible to
dismiss further fallout. The position of other banks and respective
management teams will only become clear in time, although we note press
reports of several trader suspensions at multiple banks (e.g. Reuters 9 Feb
2012).
Civil actions: As the results of the investigations are placed into the public
domain, we would expect claims to grow (class action litigation has been
forming for some time, with one US judge having already consolidated
cases). We explore the costs of potential civil action cases in the next section,
which we believe could be meaningful.
Civil damages could reach ~U$35bn
We make an initial industry estimate of potential damages from the LIBOR case of
cU$35bn, with Barclays, RBS and Deutsche most affected in absolute terms within
our European coverage universe. We set out our methodology below, which we apply
equally across all affected banks on the US$ LIBOR panel. We expect the details on
which banks are likely to be more affected by such litigation to become clear over the
next few months and years, rather than weeks. Given the difficulties in calculating
litigation losses, we acknowledge that our estimates are speculative and include a
sensitivity table.
Figure 4: KBWe LIBOR litigation loss estimation U$tr Industry Barclays RBS HSBC Lloyds DBK CS UBS*
Notional rate derivatives (2010), all currencies 465.3 64.9 61.8 18.1 3.5 58.8 41.2 35.2
% U$ and € combined 70% 70% 70% 70% 70% 70% 70% 70%
Notional rate derivatives (2010), U$ and € (estimate) 327.7 45.7 43.5 12.8 2.5 41.4 29.0 24.8
% customer business 71% 71% 71% 71% 71% 71% 71% 71%
Notional customer derivatives (estimate) 232.7 32.5 30.9 9.1 1.8 29.4 20.6 17.6
Number of years 4
% of time LIBOR suppressed 25%
LIBOR supression 0.20%
Settlement % of 'damages' 10%
Potential settlement (U$bn) taxed (@25%) 34.9 4.9 4.6 1.4 0.3 4.4 3.1 2.6
Potential settlement (Local currency) taxed 3.1 3.0 1.4 0.2 3.4 2.9 2.5
% of 2012 B2 RWA (%) 0.8% 0.7% 0.1% 0.1% 1.2% 1.3% 1.3%
% of 2012 B3 RWA (%) 0.7% 0.5% 0.1% 0.0% 0.7% 1.0% 0.8%
Current 2012-14E B3 capital build 1.5% 3.0% 1.8% 3.0% 2.1% 3.9% 4.8%
Settlement estimate % capital build 46% 18% 6% 2% 34% 26% 16% Note: *Damages may be reduced by 2/3 for UBS to allow for DOJ leniency agreement benefit. We use a standard 25% tax rate across all banks. Source: Bank of International Settlements, Company reports, KBW Research estimates
Our estimates by bank are dictated by outstanding notional interest rate derivatives at
end-2010, and we make no attempt to differentiate or apportion ‗blame‘. We see
Barclays (£3.1bn net), RBS (£3.0bn net) and Deutsche (€3.4bn net) as potentially
most impacted in absolute terms, with Lloyds (£0.2bn) and HSBC (U$1.4bn) least.
Damages of this magnitude would clearly be unhelpful as banks look to increase
capital levels in advance of Basel 3 implementation, but crucially, our estimates of
potential damages are equivalent to 2-46% of our 2012-14E Basel 3 capital build
estimates, rather than moving capital ratios down from those at end-2012. As noted
below, we also think that any settlement could well occur beyond our forecast period,
in turn allowing a further period to build capital.
Please refer to important disclosures and analyst certification information on pages 22 - 25. 5
16 July 2012

Figure 5: Sensitivity of industry losses to changes in: Increase of: ∆ losses (U$bn)
Affected assets +/-$100bn 15.0
% time LIBOR suppressed +/-5% 7.0
LIBOR suppression size +/-0.10% 17.5
Settlement % damages +/-1% 3.5 Source: Bloomberg, BBA, KBW Research
Estimating the damages and settlements
Given the difficulties in estimating potential legal costs, we acknowledge that our
estimates are subjective, and almost all our assumptions used here could be open to
debate. However, we explain our thinking and methodology in estimating damages
and likely settlement amounts below:
Size of affected securities
In judging the size of the potential affected securities, we establish our start point as
the notional amount of interest rate derivatives: we believe this forms a reasonable
proxy for the size of the potential Libor-related market. This market has grown from
U$42bn in 1998 to U$504bn at end-2011, according to BIS data, with ~70% in US$
and EUR.
Figure 6: Interest rate derivatives outstanding (notional), 1H98-2H11
0
100
200
300
400
500
600
1H
98
2H
98
1H
99
2H
99
1H
00
2H
00
1H
01
2H
01
1H
02
2H
02
1H
03
2H
03
1H
04
2H
04
1H
05
2H
05
1H
06
2H
06
1H
07
2H
07
1H
08
2H
08
1H
09
2H
09
1H
10
2H
10
1H
11
2H
11
U$
tril
lio
n
Canadian $ Euro Jap yen Sterling Swed krona Swiss franc US $ Other
Source: Bank of International Settlements, KBW Research
BIS data also helps us to eliminate the amount of notional derivatives that exist
between the ―reporting dealers‖, which by BIS definitions is essentially investment
banks and securities houses which we assume will not sue each other (i.e. zero sum
between dealers). On the 2010 BIS data, this is ~29% of the total volume. The
notional value of customer interest rate derivatives at risk of applying for damages is
therefore reduced to $233tr.
Please refer to important disclosures and analyst certification information on pages 22 - 25. 6
16 July 2012

Figure 7: Interest rate derivatives counterparty split U$bn Dec-09 Jun-10 Dec-10 Jun-11 Dec-11
Total contracts 449,875 451,831 465,260 553,240 504,098
o/w Reporting dealers 138,580 132,128 134,483 159,222 157,330
o/w Other financial institutions 275,688 282,031 293,490 354,281 309,362
o/w Non-financial customers 35,607 37,673 37,286 39,737 37,406
"Reporting dealers" 31% 29% 29% 29% 31%
Non "reporting dealers" 69% 71% 71% 71% 69% Source: Bank of International Settlements, KBW Research
Estimating the size of the damages sought
The Schwab case highlights a period of 4 years where LIBOR was potentially
suppressed from 2007-2011. However, we would also assume that LIBOR was not
suppressed at all times through that period. Also, even during the prolonged crisis
there were times when the market was working and things calmed slightly (e.g. in
mid-2009, European banks‘ equity rallied to 1.6x 12m forward NAV). We therefore
assume that LIBOR was suppressed for ~25% of those 4 years.
The size of the suppression itself is difficult to measure. Clearly the plaintiffs in the
Schwab case will argue it is high (they cite various sources showing estimates of 30-
40bp), while, should a case get to this stage, the banks will argue the suppression is
smaller. In our scenario we assume a 20bps average suppression, in turn bringing
potential ‗damages‘ down to U$349bn.
Estimating the size of potential settlements
While it is difficult to predict any settlement amount with any degree of accuracy, we
find a study of securities class action settlements by Cornerstone Research
informative. Based on a research sample of common stock fraud cases (ie, excluding
cases with alleged classes comprising only bondholders, preferred stockholders, etc),
they make a number of interesting observations, but most importantly that settlements
as a % of ‗estimated damages‘ ranges from 10% in small cases to 1% for large cases
and an average of 3%.
Figure 8: Securities settlement (2002-2011) and Median Settlement as % of ‘estimated damages’* by damage range (1996-2011)
0
2
4
6
8
10
12
14
16
18
20
2002 2003 2004 2005 2006 2007 2008 2009 2010 2011
Sett
lem
en
t (U
$b
n)
Settlement (ex large cases) WorldCom Enron Tyco
0%
2%
4%
6%
8%
10%
12%
Med
ian
Sett
lem
nt
% o
f 'e
stim
ate
d
da
ma
ges'
1996-2010 2011
Source: Cornerstone Research 2011 Review and Analysis. Charts reproduced by KBW Research from http://www.cornerstone.com/files/Publications/a0e54ba8-2830-4c00-9481-108208ec4ed8/Presentation/PublicationAttachment/f03e4174-ec8a-4eb3-ba22-19bd5162f09e/Cornerstone_Research_Settlements_2011_Analysis.pdf *Cornerstone Research uses as a simplified approach to calculate ‗estimated damages‘ and do not intend for any damages estimate to be indicative of actual economic damages borne by shareholders.
Settlement % typically
a fraction of potential
damages
Please refer to important disclosures and analyst certification information on pages 22 - 25. 7
16 July 2012
Clearly, each case has to be taken in isolation, and the numbers related to LIBOR are
potentially larger than anything that we know of, but we observe the following with
regard to prior securities class actions:
The typical duration between filing date and settlement hearing date is around
3.5 years, but can be substantially longer.
Credit-crisis related cases have settled at a slower rate than traditional cases,
and while those have settled for higher U$ amounts (than non credit-crisis
related cases), they have settled at a lower % of ‗estimated damages‘ (c3% on
average 2009-11).
Settlements generally increase as estimated damages increase, but also
settlements as a percentage of ‗estimated damages‘ typically decrease as
damages increase.
The burden of proof
We expect the burden of proof on the part of plaintiffs to be high, something which is
very apparent even in the Schwab case. We expect some of the challenges to be:
Establishing whether LIBOR was incorrectly stated in the first place.
With some firms acting as whistleblower and co-operating fully with
investigations, along with the Barclays fines and evidence, we think the trader
element should be straightforward to prove for at least some of the defendant
banks where trader emails and instructions/requests exist. However, this is a
small part of the case, and we think LIBOR will only have been marginally
impacted and not in the same direction.
The more difficult part of the case will be to prove that LIBOR rates were
suppressed for an extended period, which we expect to be the substantive part
of the potential damages claim.
If LIBOR is proven to have been incorrectly stated, the plaintiffs will need to
prove that a loss has actually taken place. Nearly all counterparties will have
some element of borrowing costs themselves, so saying that they lose out on
purchasing a LIBOR-based instrument ignores the economic profit from
being able to refinance oneself with cheaper funds as well.
Please refer to important disclosures and analyst certification information on pages 22 - 25. 8
16 July 2012

Appendix 1
Figure 9: Panel bank LIBOR submissions vs LIBOR & relative CDS (2007-12)
-160
-80
0
80
160
-100
-50
0
50
100
Jun-0
7
Jun
-08
Jun-0
9
Jun-1
0
Jun
-11
Jun-1
2
HSBC
US LIBOR delta, bps (LHS)
CDS Delta
-160
-80
0
80
160
-100
-50
0
50
100
Jun
-07
Jun
-08
Jun
-09
Jun
-10
Jun
-11
Jun-1
2
Barclays
-160
-80
0
80
160
-100
-50
0
50
100
Jun
-07
Jun
-08
Jun
-09
Jun
-10
Jun
-11
Jun
-12
Lloyds
-160
-80
0
80
160
-100
-50
0
50
100
Jun
-07
Jun
-08
Jun
-09
Jun
-10
Jun
-11
Jun
-12
RBS
-160
-80
0
80
160
-100
-50
0
50
100
Jun-0
7
Jun
-08
Jun-0
9
Jun-1
0
Jun
-11
Jun-1
2
UBS
-160
-80
0
80
160
-100
-50
0
50
100
Jun
-07
Jun
-08
Jun
-09
Jun
-10
Jun
-11
Jun-1
2
Credit Suisse
-160
-80
0
80
160
-100
-50
0
50
100
Jun
-07
Jun
-08
Jun
-09
Jun
-10
Jun
-11
Jun
-12
Deutsche Bank
-160
-80
0
80
160
-100
-50
0
50
100
Jun
-07
Jun
-08
Jun
-09
Jun
-10
Jun
-11
Jun
-12
Bank of America
Note: CDS delta = Bank CDS versus average CDS for panel banks Source: Bloomberg, BBA, KBW Research
Please refer to important disclosures and analyst certification information on pages 22 - 25. 9
16 July 2012
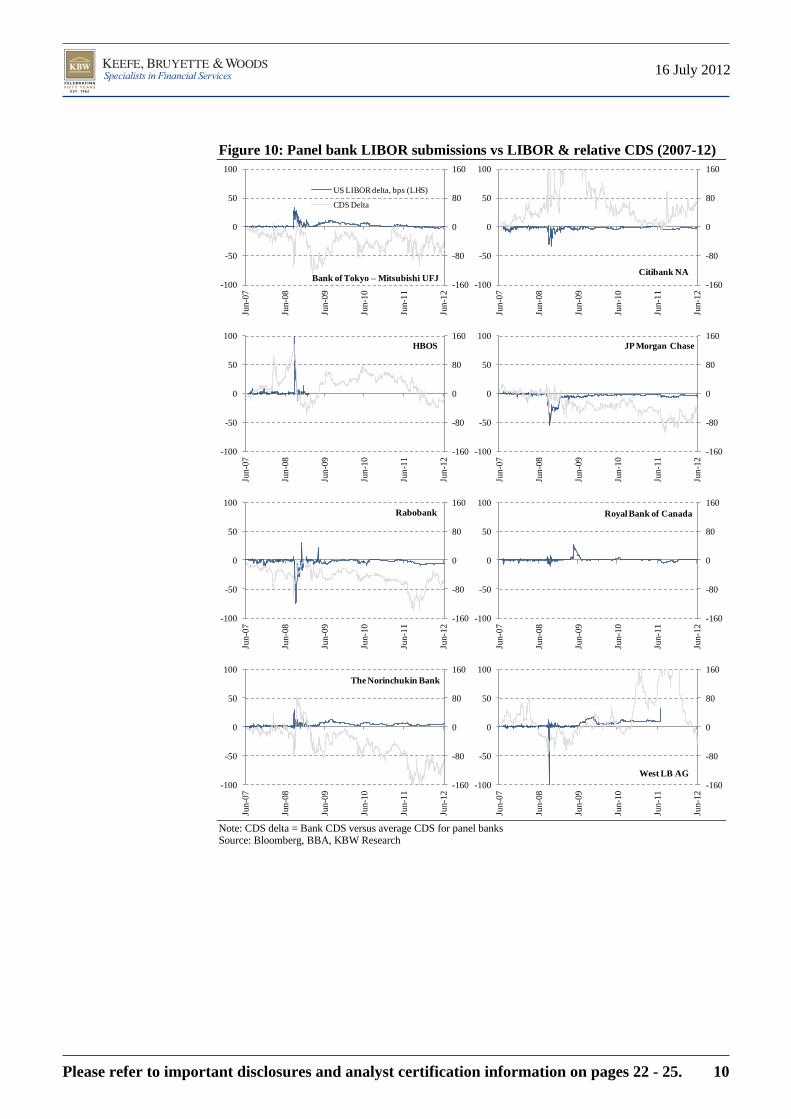
Figure 10: Panel bank LIBOR submissions vs LIBOR & relative CDS (2007-12)
-160
-80
0
80
160
-100
-50
0
50
100
Jun-0
7
Jun-0
8
Jun-0
9
Jun
-10
Jun
-11
Jun
-12
Bank of Tokyo – Mitsubishi UFJ
US LIBOR delta, bps (LHS)
CDS Delta
-160
-80
0
80
160
-100
-50
0
50
100
Jun
-07
Jun
-08
Jun-0
9
Jun-1
0
Jun
-11
Jun
-12
Citibank NA
-160
-80
0
80
160
-100
-50
0
50
100
Jun-0
7
Jun-0
8
Jun-0
9
Jun
-10
Jun
-11
Jun
-12
HBOS
-160
-80
0
80
160
-100
-50
0
50
100
Jun
-07
Jun
-08
Jun-0
9
Jun-1
0
Jun
-11
Jun
-12
JP Morgan Chase
-160
-80
0
80
160
-100
-50
0
50
100
Jun-0
7
Jun-0
8
Jun-0
9
Jun
-10
Jun
-11
Jun
-12
Rabobank
-160
-80
0
80
160
-100
-50
0
50
100Ju
n-0
7
Jun
-08
Jun-0
9
Jun-1
0
Jun
-11
Jun
-12
Royal Bank of Canada
-160
-80
0
80
160
-100
-50
0
50
100
Jun
-07
Jun
-08
Jun
-09
Jun
-10
Jun
-11
Jun
-12
The Norinchukin Bank
-160
-80
0
80
160
-100
-50
0
50
100
Jun
-07
Jun
-08
Jun
-09
Jun
-10
Jun
-11
Jun
-12
West LB AG
Note: CDS delta = Bank CDS versus average CDS for panel banks Source: Bloomberg, BBA, KBW Research
Please refer to important disclosures and analyst certification information on pages 22 - 25. 10
16 July 2012
Appendix 2: Report & Accounts extracts (2011)
Barclays
The FSA, the US Commodity Futures Trading Commission, the SEC, the US
Department of Justice Fraud Section of the Criminal Division and Antitrust Division
and the European Commission are amongst various authorities conducting
investigations into submissions made by Barclays and other panel members to the
bodies that set various interbank offered rates. Barclays is co-operating in the relevant
investigations and is keeping regulators informed. In addition, Barclays has been
named as a defendant in a number of class action lawsuits filed in US federal courts
involving claims by purported classes of purchasers and sellers of LIBOR-based
derivative products or Eurodollar futures or options contracts between 2006 and 2009.
The complaints are substantially similar and allege, amongst other things, that
Barclays and other banks individually and collectively violated US antitrust and
commodities laws and state common law by suppressing LIBOR rates during the
relevant period. Barclays has been informed by certain of the authorities investigating
these matters that proceedings against Barclays may be recommended with respect to
some aspects of the matters under investigation, and Barclays is engaged in
discussions with those authorities about potential resolution of those aspects. It is not
currently possible to predict the ultimate resolution of the issues covered by the
various investigations and lawsuits, including the timing and the scale of the potential
impact on the Group of any resolution.
Lloyds
Several government agencies in the UK, US and overseas, including the US
Commodity Futures Trading Commission, the US SEC, the US Department of Justice
and the FSA as well as the European Commission, are conducting investigations into
submissions made by panel members to the bodies that set various interbank offered
rates. The Group, and/or its subsidiaries, were (at the relevant time) and remain
members of various panels that submit data to these bodies. The Group has received
requests from some government agencies for information and is co-operating with
their investigations. In addition, recently the Group has been named in private
lawsuits, including purported class action suits in the US with regard to the setting of
London interbank offered rates (LIBOR). It is currently not possible to predict the
scope and ultimate outcome of the various regulatory investigations or private
lawsuits, including the timing and scale of the potential impact of any investigations
and private lawsuits on the Group.
RBS
Certain members of the Group have been named as defendants in a number of class
actions and individual claims filed in the US with respect to the setting of LIBOR.
The complaints are substantially similar and allege that certain members of the Group
and other panel banks individually and collectively violated US commodities and
antitrust laws and state common law by manipulating LIBOR and prices of LIBOR
based derivatives in various markets through various means. The Group considers
that it has substantial and credible legal and factual defences to these and prospective
claims.
The Group continues to receive requests from various regulators investigating the
setting of LIBOR and other interest rates, including the US Commodity Futures
Please refer to important disclosures and analyst certification information on pages 22 - 25. 11
16 July 2012

Trading Commission, the US Department of Justice, the European Commission, the
FSA and the Japanese Financial Services Agency. The authorities are seeking
documents and communications related to the process and procedures for setting
LIBOR and other interest rates, together with related trading information. In addition
to co-operating with the investigations as described above, the Group is also keeping
relevant regulators informed. It is not possible to estimate with any certainty what
effect these investigations and any related developments may have on the Group.
HSBC
Various regulators and competition and enforcement authorities around the world
including in the UK, the US and the EU, are conducting investigations related to
certain past submissions made by panel banks in connection with the setting of
London interbank offered rates (‗LIBOR‘) and European interbank offered rates. As
certain HSBC entities are members of such panels, HSBC and/or its subsidiaries have
been the subject of regulatory demands for information and are cooperating with their
investigations. In addition, HSBC and other panel banks have been named in putative
class action lawsuits filed by private parties in the US with respect to the setting of
US dollar LIBOR. Based on the facts currently known, it is not practicable at this
time for HSBC to predict the resolution of these regulatory investigations or putative
class action lawsuits, including the timing and potential impact, if any, on HSBC.
Deutsche
Deutsche Bank AG has received various subpoenas and requests for information from
certain regulators and governmental entities in the United States and abroad,
including the U.S. Department of Justice, the U.S. Commodity Futures Trading
Commission, the U.S. Securities and Exchange Commission, and the European
Commission, in connection with setting interbank offered rates for various currencies.
These inquiries relate to various periods between 2005 and 2011. Deutsche Bank is
cooperating with these investigations. In addition, a number of civil actions, including
putative class actions, have been filed in federal courts in the United States against
Deutsche Bank AG, an affiliate and numerous other banks on behalf of certain parties
who allege that they transacted LIBOR-based financial instruments and that the
defendants manipulated, through various means, the U.S. dollar LIBOR rate and
prices of U.S. dollar LIBOR-based derivatives in various markets. Claims for
damages are asserted under various legal theories, including violations of the
Commodity Exchange Act and the antitrust laws. The civil actions have been
consolidated for pre-trial purposes in the United States District Court for the Southern
District of New York. The litigations are in their early stages.
UBS
Several government agencies, including the SEC, the US Commodity Futures Trading
Commission, the DOJ and the FSA, are conducting investigations regarding
submissions with respect to British Bankers‘ Association LIBOR rates. We
understand that the investigations focus on whether there were improper attempts by
UBS (among others), either acting on our own or together with others, to manipulate
LIBOR rates at certain times. In addition, the Swiss Competition Commission
(WEKO) has commenced an investigation of numerous banks and financial
intermediaries concerning possible collusion relating to LIBOR and TIBOR reference
rates and certain derivatives transactions.
Please refer to important disclosures and analyst certification information on pages 22 - 25. 12
16 July 2012

UBS has been granted conditional leniency or conditional immunity from authorities
in certain jurisdictions, including the Antitrust Division of the DOJ and WEKO, in
connection with potential antitrust or competition law violations related to
submissions for Yen LIBOR and Euroyen TIBOR. WEKO has also granted UBS
conditional immunity in connection with potential competition law violations related
to submissions for Swiss franc LIBOR and certain transactions related to Swiss franc
LIBOR. The Canadian Competition Bureau has granted UBS conditional immunity in
connection with potential competition law violations related to submissions for Yen
LIBOR. As a result of these conditional grants, we will not be subject to prosecutions,
fines or other sanctions for antitrust or competition law violations in the jurisdictions
where we have conditional immunity or leniency in connection with the matters we
reported to those authorities, subject to our continuing cooperation. However, the
conditional leniency and conditional immunity grants we have received do not bar
government agencies from asserting other claims against us. In addition, as a result of
the conditional leniency agreement with the DOJ, we are eligible for a limit on
liability to actual rather than treble damages were damages to be awarded in any civil
antitrust action under US law based on conduct covered by the agreement and for
relief from potential joint-and-several liability in connection with such civil antitrust
action, subject to our satisfying the DOJ and the court presiding over the civil
litigation of our cooperation. The conditional leniency and conditional immunity
grants do not otherwise affect the ability of private parties to assert civil claims
against us.
On 16 December 2011, the Japan Financial Services Agency (JFSA) commenced an
administrative action against UBS Securities Japan Ltd (UBS Securities Japan) based
on findings by the Japan Securities and Exchange Surveillance Commission (SESC)
that (i) a trader of UBS Securities Japan engaged in inappropriate conduct relating to
Euroyen TIBOR (Tokyo Interbank Offered Rate) and Yen LIBOR, including
approaching UBS AG, Tokyo Branch, and other banks to ask them to submit TIBOR
rates taking into account requests from the trader for the purpose of benefiting trading
positions; and (ii) serious problems in the internal controls of UBS Securities Japan
resulted in its failure to detect this conduct. Based on the findings, the JFSA issued a
Business Suspension Order requiring UBS Securities Japan to suspend trading in
derivatives transactions related to Yen LIBOR and Euroyen TIBOR from 10 January
to 16 January 2012 (excluding transactions required to perform existing contracts).
The JFSA also issued a Business Improvement Order that requires UBS Securities
Japan to (i) develop a plan to ensure compliance with its legal and regulatory
obligations and to establish a control framework that is designed to prevent
recurrences of the conduct identified in the JFSA‘s administrative action, and (ii)
provide periodic written reports to the JFSA regarding the company‘s implementation
of the measures required by the order. On the same day the JFSA also commenced an
administrative action against UBS AG, Tokyo Branch, based on a finding that an
employee of the Tokyo branch ―continuously received approaches‖ from an employee
of UBS Securities Japan regarding Euroyen TIBOR rate submissions, which was
determined to be an inappropriate practice that was not reported to the branch‘s
management. Pursuant to this administrative action, the JFSA issued an order under
the Japan Banking Act which imposes requirements similar to those imposed under
the Business Improvement Order directed to UBS Securities Japan.
A number of putative class actions and other actions have been filed in federal courts
in the US against UBS and numerous other banks on behalf of certain parties who
transacted in LIBOR based derivatives. The complaints allege manipulation, through
Please refer to important disclosures and analyst certification information on pages 22 - 25. 13
16 July 2012
various means, of the US dollar LIBOR rate and prices of US dollar LIBOR based
derivatives in various markets. Claims for damages are asserted under various legal
theories, including violations of the US Commodity Exchange Act and antitrust laws.
Credit Suisse
On February 3, 2012, following related investigations in the US and in the UK by the
respective authorities, the Swiss Competition Commission commenced an
investigation involving twelve banks and certain other financial intermediaries,
including the Group, concerning alleged collusive behaviour among traders to affect
the bid ask spread for derivatives tied to the LIBOR and TIBOR reference rates fixed
with respect to certain currencies. The investigation also relates to alleged collusive
agreements to influence these reference rates. Credit Suisse is not a panel bank for
Yen LIBOR, Yen TIBOR or Euroyen TIBOR. Credit Suisse is cooperating fully with
these investigations.
Please refer to important disclosures and analyst certification information on pages 22 - 25. 14
16 July 2012
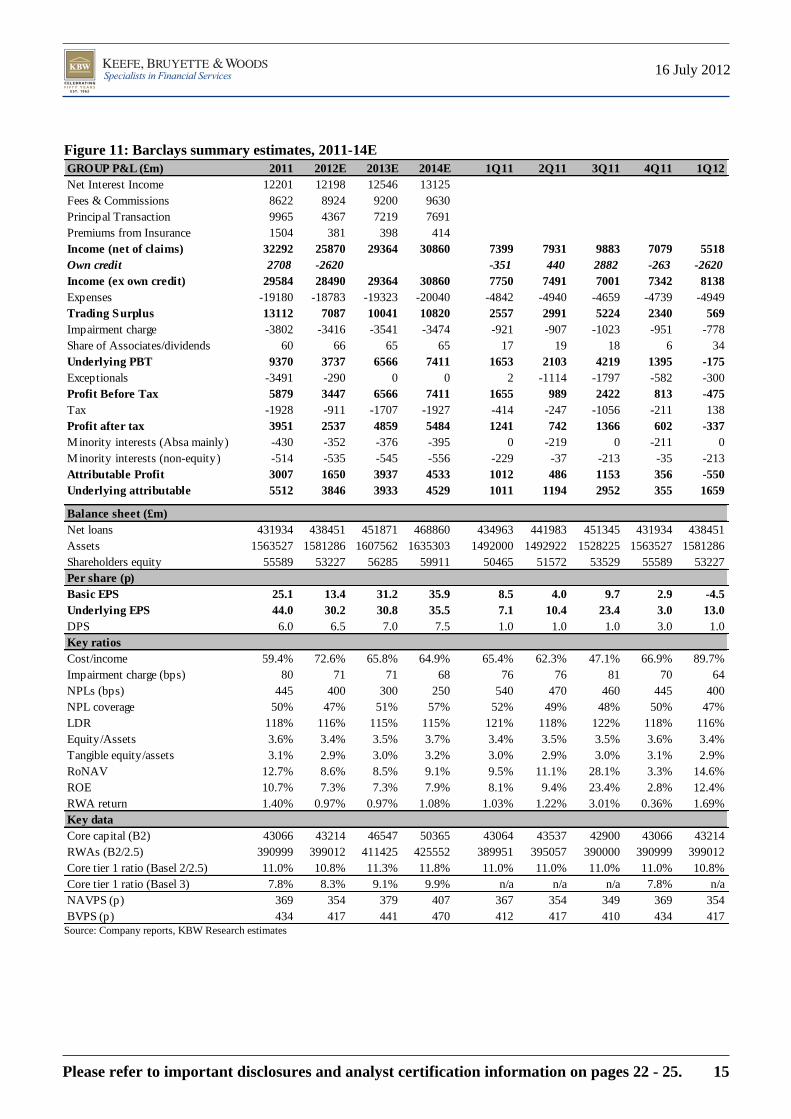
Figure 11: Barclays summary estimates, 2011-14E
GROUP P&L (£m) 2011 2012E 2013E 2014E 1Q11 2Q11 3Q11 4Q11 1Q12
Net Interest Income 12201 12198 12546 13125
Fees & Commissions 8622 8924 9200 9630
Principal Transaction 9965 4367 7219 7691
Premiums from Insurance 1504 381 398 414
Income (net of claims) 32292 25870 29364 30860 7399 7931 9883 7079 5518
Own credit 2708 -2620 -351 440 2882 -263 -2620
Income (ex own credit) 29584 28490 29364 30860 7750 7491 7001 7342 8138
Expenses -19180 -18783 -19323 -20040 -4842 -4940 -4659 -4739 -4949
Trading Surplus 13112 7087 10041 10820 2557 2991 5224 2340 569
Impairment charge -3802 -3416 -3541 -3474 -921 -907 -1023 -951 -778
Share of Associates/dividends 60 66 65 65 17 19 18 6 34
Underlying PBT 9370 3737 6566 7411 1653 2103 4219 1395 -175
Exceptionals -3491 -290 0 0 2 -1114 -1797 -582 -300
Profit Before Tax 5879 3447 6566 7411 1655 989 2422 813 -475
Tax -1928 -911 -1707 -1927 -414 -247 -1056 -211 138
Profit after tax 3951 2537 4859 5484 1241 742 1366 602 -337
Minority interests (Absa mainly) -430 -352 -376 -395 0 -219 0 -211 0
Minority interests (non-equity) -514 -535 -545 -556 -229 -37 -213 -35 -213
Attributable Profit 3007 1650 3937 4533 1012 486 1153 356 -550
Underlying attributable 5512 3846 3933 4529 1011 1194 2952 355 1659
Balance sheet (£m)
Net loans 431934 438451 451871 468860 434963 441983 451345 431934 438451
Assets 1563527 1581286 1607562 1635303 1492000 1492922 1528225 1563527 1581286
Shareholders equity 55589 53227 56285 59911 50465 51572 53529 55589 53227
Per share (p)
Basic EPS 25.1 13.4 31.2 35.9 8.5 4.0 9.7 2.9 -4.5
Underlying EPS 44.0 30.2 30.8 35.5 7.1 10.4 23.4 3.0 13.0
DPS 6.0 6.5 7.0 7.5 1.0 1.0 1.0 3.0 1.0
Key ratios
Cost/income 59.4% 72.6% 65.8% 64.9% 65.4% 62.3% 47.1% 66.9% 89.7%
Impairment charge (bps) 80 71 71 68 76 76 81 70 64
NPLs (bps) 445 400 300 250 540 470 460 445 400
NPL coverage 50% 47% 51% 57% 52% 49% 48% 50% 47%
LDR 118% 116% 115% 115% 121% 118% 122% 118% 116%
Equity/Assets 3.6% 3.4% 3.5% 3.7% 3.4% 3.5% 3.5% 3.6% 3.4%
Tangible equity/assets 3.1% 2.9% 3.0% 3.2% 3.0% 2.9% 3.0% 3.1% 2.9%
RoNAV 12.7% 8.6% 8.5% 9.1% 9.5% 11.1% 28.1% 3.3% 14.6%
ROE 10.7% 7.3% 7.3% 7.9% 8.1% 9.4% 23.4% 2.8% 12.4%
RWA return 1.40% 0.97% 0.97% 1.08% 1.03% 1.22% 3.01% 0.36% 1.69%
Key data
Core capital (B2) 43066 43214 46547 50365 43064 43537 42900 43066 43214
RWAs (B2/2.5) 390999 399012 411425 425552 389951 395057 390000 390999 399012
Core tier 1 ratio (Basel 2/2.5) 11.0% 10.8% 11.3% 11.8% 11.0% 11.0% 11.0% 11.0% 10.8%
Core tier 1 ratio (Basel 3) 7.8% 8.3% 9.1% 9.9% n/a n/a n/a 7.8% n/a
NAVPS (p) 369 354 379 407 367 354 349 369 354
BVPS (p) 434 417 441 470 412 417 410 434 417 Source: Company reports, KBW Research estimates
Please refer to important disclosures and analyst certification information on pages 22 - 25. 15
16 July 2012

Figure 12: HSBC summary estimates, 2011-14E
PROFIT & LOSS (U$m) 2010 2011 2012E 2013E 2014E 1Q11 2Q11 3Q11 4Q11 1Q12
Net interest income 39441 40662 37600 37671 39981 9911 10324 10370 10057 10087
Fee income 17355 17160 17947 18949 20064 4371 4436 4257 4096 4310
Trading income 7210 6506 8317 8739 9329 2556 2256 106 1588 2882
Other income 4241 7952 910 3452 3645 202 1638 5214 898 -1078
Non-interest income 28806 31618 27174 31141 33038 7129 8330 9577 6582 6114
Total income 68247 72280 64774 68812 73019 17040 18654 19947 16639 16201
o/w own debt fair value -63 3933 -2644 0 0 -589 446 4114 -38 -2644
Total income (ex FVOD) 68310 68347 67418 68812 73019 17629 18208 15833 16677 18845
Expenses -37688 -41545 -38802 -37843 -38628 -10369 -10141 -9869 -11166 -10353
Pre-impairment profit 30559 30735 25972 30969 34392 6671 8513 10078 5473 5848
Pre-impairment profit (ex FVOD) 30622 26802 28616 30969 34392 7260 8067 5964 5511 8492
Impairment -14039 -12127 -10571 -9823 -8816 -2384 -2882 -3890 -2971 -2366
Profit after impairment 16520 18608 15401 21146 25575 4287 5631 6188 2502 3482
Associates/JV's 2517 3264 3779 4272 4831 619 937 967 741 840
Underlying PBT 19037 21872 19181 25417 30406 4906 6568 7155 3243 4322
Exceptionals 0 0 2900 0 0 0 0 0 0 0
PBT 19037 21872 22081 25417 30406 4906 6568 7155 3243 4322
o/w own debt fair value -63 3933 -2644 0 0 -589 446 4114 -38 -2644
PBT before fair value 19100 17939 24725 25417 30406 5495 6122 3041 3281 6966
Attributable 12746 16224 15930 18474 22414 4010 4919 5079 2216 2438
Balance Sheet
Gross loans 978449 957940 1008251 1046119 1096162 1016417 1056620 982148 957940 978860
Assets 2454689 2555579 2614855 2685336 2793354 2627728 2690987 2747732 2555579 2637218
Deposits 1227725 1253925 1316621 1382452 1451575 1274820 1318987 1271044 1253925 1284428
Per share (U$)
Basic EPS 0.72 0.91 0.87 1.00 1.20 0.22 0.28 0.28 0.12 0.13
Underlying EPS 0.72 0.91 0.71 1.00 1.20 0.23 0.27 0.28 0.12 0.13
DPS 0.36 0.41 0.45 0.50 0.54 0.09 0.09 0.09 0.14 0.09
BVPS 7.9 8.3 9.1 9.7 10.5 8.2 8.5 8.2 0.0 8.6
ROE 9.7% 11.3% 8.3% 10.7% 12.0% 11.3% 13.2% 13.6% 6.0% 6.4%
NAV 6.2 6.7 7.5 8.1 8.9 6.5 6.7 6.4 0.0 7.0
RoNAV 12.5% 14.2% 10.2% 12.9% 14.2% 14.3% 16.7% 17.3% 7.6% 8.0%
Key ratios
Margin (bps) 268 251 228 218 221
Cost/income (ex FVO) 55% 61% 58% 55% 53% 59% 56% 62% 67% 55%
Impairment charge (bps) 143 119 108 96 82
NPLs (bps) 479 434 430 400 350 492 434
NPL coverage 43% 42% 38% 41% 45% 73% 42%
Equity/assets 6.0% 6.2% 6.7% 7.0% 7.3% 5.8% 6.0% 5.8% 6.2% 6.2%
Tangible equity/assets 4.8% 5.1% 5.5% 5.9% 6.2% 4.7% 4.8% 4.6% 5.1% 5.1%
Core tier 1 ratio (Basel 2/2.5) 10.5% 10.1% 11.6% 12.3% 13.0% 10.7% 10.8% 10.6% 10.1% 10.5%
Core tier 1 ratio (B3) 7.5% 8.0% 9.5% 10.6% 11.4% n/a n/a n/a 8.0% n/a
GEOGRAPHIC SUMMARY
Europe 4302 4671 739 4532 5486 652 1495 2955 -431 -997
Hong Kong 5692 5823 6388 6654 7385 1562 1519 1288 1454 1897
Rest of Asia Pacific 5902 7471 8187 9150 10262 1634 2108 2008 1721 2024
Middle East 892 1492 1485 1698 1893 335 412 405 340 332
North America 454 100 309 635 2301 181 425 -265 -241 462
Latin America 1795 2315 2072 2748 3080 542 609 764 400 604
Total 19037 21872 19181 25417 30406 4906 6568 7155 3243 4322 Source: Company reports, KBW Research estimates
Please refer to important disclosures and analyst certification information on pages 22 - 25. 16
16 July 2012

Figure 13: Lloyds summary estimates, 2011-14E
GROUP P&L 2011 2012E 2013E 2014E 1Q11 2Q11 3Q11 4Q11 1Q12
Net interest income 12233 10570 10292 9620 3303 3063 3051 2816 2645
Other income 9111 8736 8716 8915 2391 2540 1952 2228 2194
Effects of liability mge, volatility & asset sales122 -240 0 0 -775 -146 159 884 -240
Operating income 21466 19066 19008 18534 4919 5457 5162 5928 4599
Insurance claims -343 -347 -344 -340 -114 -84 -87 -58 -108
Non-interest income 8768 8389 8373 8574 2277 2456 1865 2170 2086
Income (net of claims) 21123 18719 18665 18194 4805 5373 5075 5870 4491
Underlying income (net of claims) 21001 18959 18665 18194 5580 5519 4916 4986 4731
Expenses -10621 -10224 -9994 -9614 -2751 -2581 -2577 -2712 -2564
Operating profit 10502 8495 8671 8580 2054 2792 2498 3158 1927
Impairment charge -9787 -6697 -4343 -3102 -2608 -2814 -1956 -2409 -1657
Associates/joint ventures 27 21 16 11 9 3 5 10 3
PBT (before FV unwind) 742 1818 4344 5489 -545 -19 547 759 273
FV unwind 1943 750 -50 -300 829 839 97 178 355
PBT (pro-forma) 2685 2568 4294 5189 284 820 644 937 628
Exceptionals -6227 -1550 -418 -500 -3754 -601 -1251 -621 -340
PBT -3542 1018 3875 4689 -3470 219 -607 316 288
Attributable -2787 436 2746 2110 -2439 134 -519 37 0
Underlying attributable 1984 1211 2859 3519 189 558 514 165 12
Balance sheet
Gross loans (£bn) 584 534 470 466 n/d 607 596 584 557
Assets (£bn) 971 941 886 897 n/d 979 984 971 967
Shareholders equity (£bn) 45.9 46.6 49.3 52.1 n/d 44.9 45.7 45.9 46.1
AIEA (£bn) 585.4 547.0 509.9 453.6
Per share (p)
Basic EPS -4.1 0.6 4.0 4.5 -3.6 0.2 -0.8 0.1 0.0
o/w Core 7.4 5.5 5.6 6.1 0.0 0.0 1.8 2.4 2.0
o/w Non-Core -11.5 -4.9 -1.7 -1.6 0.0 0.0 -2.6 -2.4 -2.0
Basic diluted EPS -4.1 0.6 4.0 4.5 -3.6 0.2 -0.8 0.1 0.0
Diluted underlying EPS 2.9 1.8 4.1 5.1 0.3 0.8 0.8 0.2 0.0
DPS 0.0 0.0 0.0 1.5 0.0 0.0 0.0 0.0 0.0
Key ratios
Cost/income 50.3% 54.6% 53.5% 52.8% 57.3% 48.0% 50.8% 46.2% 57.1%
Margin (bps) 207 193 199 209 216 209 205 197 195
Impairment charge (bps) 164 120 87 66 130 163 116
NPLs (bps) 1031 850 756 356 1048 1031
NPL coverage 46% 56% 61% 89% 45% 45% 46% 46% 47%
LDR 139% 122% 111% 106% 150% 149% 146% 139% 131%
Tangible equity/assets 4.0% 4.3% 4.9% 5.2% 3.7% 3.9% 4.0% 4.0% 4.1%
Key data
Core tier 1 ratio (Basel 2.5) 10.8% 11.7% 13.4% 14.7% 10.0% 10.1% 10.3% 10.8% 10.9%
Tier 1 ratio (Basel 2.5) 12.5% 13.5% 15.4% 16.8% 11.4% 11.6% 11.9% 12.5% 12.6%
Core tier 1 ratio (Basel 3) 7.0% 7.5% 9.0% 10.5% n/a n/a n/a 7.0% n/a
NAVPS (p) 57 58 63 68 54 56 57 57 57
DIVISIONAL SUMMARY
Retail 2,797 2,250 2,215 2,210
Wholesale -1,346 -240 532 1,116
Commercial 446 457 500 549
Wealth & International -4,130 -2,301 -672 -247
Insurance 1,465 1,484 1,544 1,617
Group & Central 1,510 169 226 243 Source: Company reports, KBW Research estimates
Please refer to important disclosures and analyst certification information on pages 22 - 25. 17
16 July 2012

Figure 14: RBS summary estimates, 2011-14E
GROUP P&L (£m) 2011 2012E 2013E 2014E 1Q11 2Q11 3Q11 4Q11 1Q12
Net interest income 12689 11738 11292 11642 3302 3233 3078 3076 3007
Non-interest income (ex premiums) 10764 9948 9822 11274 3662 3459 1979 1664 3186
Insurance premiums (net of claims) 1288 1166 1158 0 237 297 302 452 289
Non-interest income 12052 11114 10980 11274 3899 3756 2281 2116 3475
Total income (net of claims) 24741 22852 22273 22917 7201 6989 5359 5192 6482
Operating Expenses -15478 -14862 -13766 -12988 -4121 -3892 -3821 -3644 -3984
Pre-impairment profit 9263 7990 8506 9929 3080 3097 1538 1548 2498
Impairment charges -7439 -4989 -3817 -2617 -1947 -2264 -1536 -1692 -1314
Operating Profit 1824 3000 4689 7312 1133 833 2 -144 1184
Exceptionals -2590 -3472 -692 -492 -1249 -1511 2002 -1832 -2588
PBT -766 -472 3997 6820 -116 -678 2004 -1976 -1404
Attributable profit -1997 -1730 2124 4403 -528 -897 1226 -1798 -1524
Balance sheet
Loans 454112 424267 389810 381298 494148 489572 485573 454112 440406
Assets 1506867 1333514 1235504 1172971 1413253 1445969 1607728 1506867 1403021
Funded balance sheet 977249 909820 875363 866851 1052205 1051097 1035384 977249 949667
S/hers equity (incl B Shares) 70075 68866 70990 75392 69332 70000 72699 70075 68672
Per share (B share diluted)
Basic EPS (p) -18.1 -15.8 19.1 39.7 -4.9 -8.3 10.4 -16.2 -14.1
Adjusted EPS (p) 2.1 8.8 24.4 43.6 3.9 2.9 -1.9 -2.5 4.2
Core adjusted EPS (p) 38.9 36.5 42.7 47.5 15.2 11.4 6.7 5.7 11.7
Key ratios
Cost/income 62.6% 65.0% 61.8% 56.7% 57.2% 55.7% 71.3% 70.2% 61.5%
Margin (bps) 192 183 186 199 200 196 184 184 189
Impairment charge (bps) 151 113 94 68 152 181 119 141 116
NPLs (bps) 862 800 700 400 799 830 844 862 864
NPLs (£m) 40845 33941 27287 15252 41041 42350 42726 40845 39800
NPL coverage 49% 58% 54% 74% 47% 49% 49% 49% 51%
RoNAV 0.4% 1.8% 5.0% 8.4% 3.1% 2.3% -1.7% -2.1% 3.5%
RoE 0.3% 1.4% 3.9% 6.7% 2.5% 1.8% -1.3% -1.6% 2.8%
Key data
Basel II
Core tier 1 ratio (Basel 2) 10.6% 11.4% 11.9% 13.5% 11.2% 11.1% 11.3% 10.6% 10.8%
Core tier 1 ratio (Basel 3) 6.8% 8.0% 9.5% 11.0% n/a n/a n/a 6.8% 7.2%
Tier 1 ratio (Basel 2) 13.0% 13.9% 14.2% 15.9% 13.5% 13.5% 13.8% 13.0% 13.2%
NAVPS (p) 477 480 499 539 493 493 499 477 480
BVPS (p) 612 613 632 672 625 625 633 612 614
Tangible equity/assets 3.5% 4.0% 4.5% 5.2% 3.9% 3.5% 3.5% 3.5% 3.8%
Tangible equity/assets (ex derivs) 5.5% 5.9% 6.4% 7.0% 5.2% 5.4% 5.4% 5.5% 5.7%
DIVISIONAL SUMMARY
Markets 899 1683 2043 2156 1029 327 -348 -109 824
International Banking 755 485 548 619 226 149 228 152 97
UK Retail 2021 1890 1834 1950 518 535 510 458 477
UK Corporate 1924 1840 1761 1879 617 472 429 406 492
Wealth 248 312 364 410 70 60 45 73 45
Ulster Bank -984 -1001 -306 -35 -365 -178 -208 -233 -310
US Retail & Commercial 537 601 706 819 94 143 123 177 102
RBS Insurance 454 388 452 n/a 67 139 123 125 84
Central items 191 -144 0 0 -32 56 78 89 -144
Total Core 6045 6054 7403 7798 2224 1703 980 1138 1667
Non-Core -4221 -3053 -2714 -486 -1091 -870 -978 -1282 -483
Underlying PBT 1824 3000 4689 7312 1133 833 2 -144 1184 Source: Company reports, KBW Research estimates
Please refer to important disclosures and analyst certification information on pages 22 - 25. 18
16 July 2012

Figure 15: Credit Suisse summary estimates, 2009-14E Group 2009 2010 2011 2012E 2013E 2014E 1Q11 2Q11 3Q11 4Q11 1Q12 2Q12E 2Q12 / 2Q12 /
CHF mn 1Q12 2Q11
Net interest income 6,891 6,541 6,433 7,592 8,068 9,094 1,753 1,377 1,646 1,657 1,884 1,807 -4% 31%
Fee and commission income 13,750 14,078 12,952 13,489 15,209 16,666 3,671 3,463 3,061 2,757 3,172 3,427 8% -1%
Net trading income 12,151 9,338 5,020 2,379 4,256 3,853 2,011 1,116 1,920 -27 189 880 366% -21%
Other income 502 1,429 1,820 1,252 1,000 1,000 721 936 62 101 802 150 -81% -84%
Revenues 33,294 31,386 26,225 24,712 28,532 30,613 8,156 6,892 6,689 4,488 6,047 6,264 4% -9%
Loan loss charge -506 79 -187 -218 -316 -320 7 -13 -84 -97 -34 -57 66% —
Personnel expense -15,013 -14,599 -13,213 -12,309 -11,955 -12,810 -4,029 -3,096 -3,067 -3,021 -3,711 -2,800 -25% -10%
Other expense -9,698 -9,379 -9,364 -8,186 -8,505 -9,137 -2,168 -2,143 -2,694 -2,359 -2,104 -2,076 -1% -3%
Operating profit 8,077 7,487 3,461 3,999 7,756 8,347 1,966 1,640 844 -989 198 1,332 572% -19%
Intangible effects 0 0 0 0 0 0 0 0 0 0 0 0 — —
Extraordinary items, net 0 0 0 0 0 0 0 0 0 0 0 0 — —
Accounting changes, net 0 0 0 0 0 0 0 0 0 0 0 0 — —
Discontinued operations, net 169 -19 0 0 0 0 0 0 0 0 0 0 — —
Pre-tax profit 8,246 7,468 3,461 3,999 7,756 8,347 1,966 1,640 844 -989 198 1,332 572% -19%
Tax -1,835 -1,548 -671 -879 -1,788 -1,941 -465 -271 -332 397 16 -315 -2069% 16%
Minorities 313 -822 -837 -560 -959 -948 -362 -601 171 -45 -170 -130 -24% -78%
Net profit [before pref dividend] 6,724 5,098 1,953 2,560 5,009 5,457 1,139 768 683 -637 44 887 1915% 15%
Preferred dividend -131 -162 -216 -200 -200 -200 0 -102 0 -114 0 -100 — —
Net profit [after pref dividend] 6,593 4,936 1,737 2,360 4,809 5,257 1,139 666 683 -751 44 787 1688% 18%
Deduct: unvested share awards -388 -309 -195 -142 -280 -306 -65 -91 -39 0 -3 -47 — —
Net profit [for basic EPS] 6,205 4,627 1,542 2,218 4,529 4,951 1,074 575 644 -751 41 739 1703% 29%
Net profit [for basic EPS] – reported 6,205 4,627 1,542 2,218 4,529 4,951 1,074 575 644 -751 41 739 1703% 29%
Deduct: disposal gains, net -188 0 0 -146 — — — — — 0 -146 —
Add: intangible effects 0 0 0 0 — — — — — 0 0 —
Add: restructuring charges, net 0 0 1,284 272 — — — 94 209 981 47 75
Add: litigation charges etc 602 183 453 0 — — — — 428 25 0 —
Deduct: own-debt gains [FVOD, stand-alone & DVA] 1,088 -162 -1,194 1,110 0 0 467 -69 -1,245 -348 1,110 0
Deduct: other -601 -522 0 0 0 — 0 0 0 0 0 0
Net profit – adjusted 7,105 4,126 2,085 3,454 4,529 4,951 1,541 600 36 -93 1,052 814 — 36%
LLC / net loans 0.21% -0.04% 0.08% 0.10% 0.14% 0.14% -0.01% 0.02% 0.15% 0.17% 0.06% 0.10%
Cost / income 74% 76% 86% 83% 72% 72% 76% 76% 86% 120% 96% 78%
Tax rate [effective] 22% 21% 19% 22% 23% 23% 24% 17% 39% 40% -8% 24%
Op. RoNAV 31.9% 17.2% 9.1% 14.4% 15.5% 15.1% 26.0% 10.3% 0.6% -1.7% 18.4% 13.8%
Shares outstanding [basic] 1,169 1,174 1,220 1,268 1,311 1,311 1,201 1,199 1,203 1,220 1,225 1,268
Ø shares outstanding [FD] 1,210 1,201 1,207 1,290 1,333 1,333 1,188 1,208 1,224 1,207 1,257 1,301
EPS [diluted] 5.13 3.85 1.28 1.72 3.40 3.71 0.90 0.48 0.53 -0.62 0.03 0.57
Operating EPS [diluted] 5.87 3.44 1.73 2.68 3.40 3.71 1.30 0.50 0.03 -0.08 0.84 0.63
Book per share [basic] 32.1 28.4 27.6 27.9 30.7 33.7 28.4 26.0 27.9 27.6 27.4 26.7
NAV per share [basic] 23.9 20.8 20.32 21.17 24.13 27.13 21.1 19.2 20.7 20.3 20.4 20.0 -2% 4%
ANAV per share [basic] 20.8 19.6 18.15 20.01 23.00 27.13 20.3 18.4 18.7 18.2 19.2 18.8 -2% 2%
Buy-back per share [basic] 0.0 0.0 0.0 0.0 0.0 0.0
Dividend per share [basic] 2.00 1.30 0.75 0.75 1.00 1.50
Group AUM 1,229,000 1,253,000 1,229,500 1,290,669 1,355,202 1,422,962 1,282,400 1,233,300 1,196,800 1,229,500 1,249,600 1,244,434
AUM growth 4.7% 2.0% -1.9% 5.0% 5.0% 5.0% 2.3% -3.8% -3.0% 2.7% 1.6% -0.4%
Group inflows 44,200 69,000 40,900 21,820 38,649 54,234 19,100 14,300 7,100 400 -7,100 7,804
'Headline' tier 1 capital 36,207 37,725 36,844 38,728 38,108 43,099 38,514 37,076 37,124 36,844 36,668 37,674
Deduct: 'hybrid capital' [CS basis] -12,198 -11,098 -10,888 -9,046 -9,046 -9,046 -10,948 -10,364 -10,564 -10,888 -9,046 -9,046
Deduct: perpetual notes -1,742 -3,350 -3,365 -3,417 -3,417 -3,417 -3,492 -3,526 -3,435 -3,365 -3,417 -3,417
'Equity' tier 1 capital 22,267 23,277 22,591 26,265 25,645 30,636 24,074 23,186 23,125 22,591 24,205 25,211
Risk-weighted assets 221,609 218,702 241,753 216,211 279,020 282,221 212,196 203,741 210,138 241,753 234,390 227,594
Ø RWA 239,309 227,478 214,076 228,162 247,616 280,620 215,449 207,969 206,940 225,946 238,072 230,992
'Headline' tier 1 ratio 16.3% 17.2% 15.2% 17.9% 13.7% 15.3% 18.2% 18.2% 17.7% 15.2% 15.6% 16.6%
'Equity' tier 1 ratio 10.0% 10.6% 9.3% 12.1% 9.2% 10.9% 11.3% 11.4% 11.0% 9.3% 10.3% 11.1%
Basel 3 common tier 1 capital (KBWe) 11,674 18,206 13,546 19,561 25,645 30,636 16,964 16,959 16,197 13,546 15,240 17,132
Basel 3 RWA [no phasing] (KBWe) 371,857 393,185 335,690 282,651 279,020 282,221 387,966 372,093 369,731 335,690 293,768 296,095
Basel 3 common tier 1 ratio (KBWe) 3.1% 4.6% 4.0% 6.9% 9.2% 10.9% 4.4% 4.6% 4.4% 4.0% 5.2% 5.8%
Tier 1 leverage ratio [FINMA style] 4.2% 4.4% 4.6% 4.9% 4.8% 5.4% 4.7% 4.7% 4.9% 4.6% 4.7% 4.8% Source: KBW estimates
Please refer to important disclosures and analyst certification information on pages 22 - 25. 19
16 July 2012

Figure 16: Deutsche Bank summary estimates, 2009-14E Group 2009 2010 2011 2012E 2013E 2014E 1Q11 2Q11 3Q11 4Q11 1Q12 2Q12E 2Q12 / 2Q12 /
€ mn 1Q12 2Q11
Net interest income 12,460 15,582 17,444 14,953 15,849 16,355 4,167 4,492 4,274 4,511 4,193 3,908 -7% -13%
Commissions 8,915 10,670 11,544 11,305 11,997 12,597 3,081 3,047 2,806 2,610 2,849 2,854 0% -6%
Trading revenues, net 2,581 3,353 3,059 6,229 6,553 6,867 2,653 710 -422 118 2,399 1,319 -45% 86%
Other -527 -1,039 1,181 61 416 400 573 291 657 -340 -248 102 -141% -65%
Revenues 23,429 28,566 33,228 32,263 34,815 36,219 10,474 8,540 7,315 6,899 9,193 7,858 -15% -8%
Loan loss charge -2,630 -1,273 -1,840 -1,569 -1,394 -1,294 -373 -464 -463 -540 -314 -419 34% -10%
Compensation and benefits -11,310 -12,672 -13,135 -13,175 -13,820 -14,058 -4,278 -3,365 -2,694 -2,798 -3,656 -3,135 -14% -7%
Other expenses -8,949 -10,616 -12,863 -11,123 -11,308 -11,502 -2,802 -2,933 -3,216 -3,912 -3,334 -2,565 -23% -13%
Operating profit 540 4,005 5,390 6,396 8,293 9,365 3,021 1,778 942 -351 1,889 1,739 -8% -2%
Intangible effects 134 -29 0 -10 0 0 0 0 0 0 -10 0 — —
Accounting changes, net 0 0 0 0 0 0 0 0 0 0 0 0 — —
Pre-tax profit 674 3,976 5,390 6,386 8,293 9,365 3,021 1,778 942 -351 1,879 1,739 -7% -2%
Tax -243 -1,646 -1,064 -1,907 -2,654 -2,997 -891 -545 -165 537 -478 -557 16% —
Minority Interest 14 -20 -194 -110 -120 -120 -68 -35 -52 -39 -20 -30 — —
Net profit 445 2,310 4,132 4,368 5,520 6,248 2,062 1,198 725 147 1,381 1,153 — -4%
Net profit – reported 445 2,310 4,132 4,368 5,520 6,248 2,062 1,198 725 147 1,381 1,153 — —
Add: restructuring charges, net 296 0 293 304 225 0 59 30 31 173 68 83 — —
Deduct: disposal gains, net -807 0 407 193 0 0 — — — 407 193 0 — —
Provisions/releases, net -74 0 285 0 0 0 — — — 285 0 0 — —
Other, net 0 2,338 259 0 0 0 259 — — — 0 0 — —
Add: intangible effects -134 -179 0 0 0 0 — — — — 0 0 — —
Tax releases etc -1,159 0 0 0 0 0 — — — — 0 0 — —
Net profit – adjusted -1,433 4,469 5,375 4,865 5,745 6,248 2,380 1,228 756 1,012 1,642 1,235 -25% 1%
Cost / income 86% 82% 78% 75% 72% 71% 68% 74% 81% 97% 76% 73%
LLC / net loans 1.02% 0.31% 0.45% 0.40% 0.37% 0.33% 0.38% 0.47% 0.45% 0.52% 0.31% 0.42%
Pre-tax return on Ø 'active equity' 2.0% 9.7% 10.7% 11.5% 13.9% 14.5% 24.8% 14.4% 7.5% -2.7% 14.0% 12.6%
Tax rate [effective] 36.1% 41.4% 19.7% 29.9% 32.0% 32.0% 29.5% 30.7% 17.5% 153.0% 25.4% 32.0%
ROE 1.3% 5.6% 8.2% 7.9% 9.3% 9.6% 16.7% 9.6% 5.7% 1.1% 10.2% 8.4%
Op. RONAV -6.0% 15.8% 15.2% 12.2% 13.0% 12.7% 27.9% 14.0% 8.4% 10.9% 17.1% 12.5%
# shares outstanding [basic] 697 932 919 914 914 914 940 928 914 919 916 923
Ø # shares [diluted] 714 773 959 955 957 957 969 968 951 949 960 958
EPS [diluted] 0.62 2.99 4.31 4.57 5.77 6.53 2.13 1.24 0.76 0.15 1.44 1.20
Operating EPS [diluted] -2.01 5.79 5.60 5.09 6.01 6.53 2.46 1.27 0.79 1.07 1.71 1.29
Book per share [basic] 52.6 52.4 58.1 62.6 67.9 74.0 53.2 53.9 56.8 58.1 60.0 60.0
NAV per share [basic] 38.0 35.6 40.9 45.4 50.7 56.8 37.1 37.9 39.8 40.9 42.8 43.0
Dividend per share [basic] 0.68 0.75 0.75 0.75 0.75 1.00
Group AUM 880,000 1,179,000 1,116,000 n/a n/a n/a 1,112,000 1,109,000 1,083,000 1,116,000 1,128,000 n/a
Group AUM growth 7.8% 34.0% -5.3% n/a n/a n/a n/a -0.3% -2.3% 3.0% 1.1% n/a
Group inflows 13,000 -1,000 -2,000 n/a n/a n/a 5,000 0 -10,000 3,000 -2,000 n/a
Group inflows / AUM 1.6% -0.1% -0.2% n/a n/a n/a 0.4% 0.0% -0.9% 0.3% -0.2% n/a
B2.5 B2.5 B3 B3 B2 B2 B2.5 B2
'Headline' tier 1 capital 34,406 42,565 49,047 51,852 52,249 59,101 43,802 44,658 46,638 49,047 49,419 50,400
Deduct: hybrid capital -10,616 -12,593 -12,734 -12,416 -12,416 -12,416 -12,222 -12,141 -12,548 -12,734 -12,416 -12,416
Add: unrealised gain on industrial holdings n/a n/a n/a n/a n/a n/a n/a n/a n/a n/a n/a n/a
'Equity' tier 1 capital 23,790 29,972 36,313 39,436 39,833 46,685 31,580 32,517 34,090 36,313 37,003 37,984
B2.5 B2.5 B3 B3
Credit RWA 217,003 285,218 258,398 224,779 364,385 369,356 266,361 261,803 278,498 258,398 251,775 232,038
Market RWA 24,880 23,660 68,123 82,000 82,000 82,000 24,553 21,490 22,423 68,123 64,929 82,000
Operational RWA 31,593 37,326 50,697 50,700 50,700 50,700 36,960 36,376 36,697 50,697 51,718 50,700
Risk-weighted assets (RWA) 273,476 346,204 381,200 357,479 497,085 502,056 327,874 319,669 337,618 381,200 368,422 364,738
RWA growth -11% 27% 10% -6% 39% 1% -5% -3% 6% 13% -3% -1%
'Headline' tier 1 ratio 12.6% 12.3% 12.9% 14.5% 10.5% 11.8% 13.4% 14.0% 13.8% 12.9% 13.4% 13.8%
'Equity' tier 1 ratio [no transition] 8.7% 8.7% 9.5% 11.0% 8.0% 9.3% 9.6% 10.2% 10.1% 9.5% 10.0% 10.4%
Basel 3 common tier 1 capital (KBWe) 31,419 34,849 39,833 46,685 31,393 30,815 31,399 31,419 32,444 33,294
Basel 3 RWA [no phasing] (KBWe) 525,380 482,466 497,085 502,056 616,436 592,085 591,459 525,380 507,609 499,217
Basel 3 common tier 1 ratio (KBWe) 6.0% 7.2% 8.0% 9.3% 5.1% 5.2% 5.3% 6.0% 6.4% 6.7%
Level 3 assets 58,220 46,656 47,573 n/a n/a 0 44,089 45,521 49,533 47,573 42,409 n/a
Level 3 liabilities 18,169 13,003 13,421 n/a n/a 0 11,673 11,866 15,140 13,421 11,883 n/a
Level 3 assets & liabilities 76,389 59,659 60,994 n/a n/a 0 55,762 57,387 64,673 60,994 54,292 n/a
Level 3 assets & liabilities / tier 1 2.2x 1.4x 1.2x n/a n/a 0.0x 1.3x 1.3x 1.4x 1.2x 1.1x n/a
Total assets [IFRS] 1,500,664 1,906,000 2,164,000 1,912,428 1,768,670 1,678,541 1,842,000 1,850,000 2,282,000 2,164,000 2,103,000 2,029,823
Deduct: derivative netting / other -609,664 -695,000 -897,000 -656,428 -512,670 -422,541 -640,000 -641,000 -986,000 -897,000 -847,000 -773,823
Total assets [US GAAP style] 891,000 1,211,000 1,267,000 1,256,000 1,256,000 1,256,000 1,202,000 1,209,000 1,296,000 1,267,000 1,256,000 1,256,000
Adjusted sh' equity [DBK style] 39,269 52,368 59,160 61,163 65,997 71,560 53,290 53,278 57,608 59,160 58,905 59,368
Leverage multiple [DBK style] 22.7x 23.1x 21.4x 20.5x 19.0x 17.6x 22.6x 22.7x 22.5x 21.4x 21.3x 21.2x Source: KBW estimates
Please refer to important disclosures and analyst certification information on pages 22 - 25. 20
16 July 2012

Figure 17: UBS summary estimates, 2009-14E Group [incl. indu hldgs] 2009 2010 2011 2012E 2013E 2014E 1Q11 2Q11 3Q11 4Q11 1Q12 2Q12E 2Q12E / 2Q12E /
CHF mn 1Q12 2Q11Net interest income 6,445 6,215 6,827 6,149 6,260 6,592 1,781 1,440 1,861 1,745 1,591 1,600 1% 11%
Net fee and commission income 17,711 17,160 15,236 15,341 16,685 17,918 4,240 3,879 3,557 3,560 3,843 3,700 -4% -5%
Net trading income -324 7,471 4,342 5,842 7,714 8,019 2,203 1,724 -28 443 961 1,569 63% -9%
Other income 599 1,214 1,468 193 0 0 117 112 1,111 128 93 100 8% -11%
Total revenues 24,431 32,060 27,873 27,526 30,659 32,530 8,341 7,155 6,501 5,876 6,488 6,969 7% -3%
Loan loss charge -1,832 -66 -84 -119 -208 -269 3 16 -89 -14 37 -52 -241% -425%
Personnel expense -16,542 -16,920 -15,591 -14,806 -16,191 -16,708 -4,407 -3,925 -3,758 -3,501 -3,643 -3,685 1% -6%
Other expense -7,296 -7,503 -6,721 -6,159 -6,208 -6,284 -1,679 -1,569 -1,623 -1,850 -1,556 -1,564 1% 0%
Operating profit -1,239 7,571 5,477 6,442 8,051 9,268 2,258 1,677 1,031 511 1,326 1,668 26% -1%
Amort. of intangibles -1,324 -117 -126 -92 -92 -133 -24 -22 -51 -29 -23 -23 0% 5%
Discontinued operations, net -7 2 0 0 0 0 0 0 0 0 0 0 — —
Pre-tax profit -2,570 7,456 5,351 6,350 7,959 9,135 2,234 1,655 980 482 1,303 1,645 26% -1%
Tax 443 380 -923 -1,111 -1,393 -1,599 -426 -377 40 -160 -476 -329 -31% -13%
Minorities -611 -304 -268 -271 -260 -260 -2 -262 -2 -2 -1 -270 26900% 3%
Net profit -2,738 7,532 4,160 4,968 6,306 7,277 1,806 1,016 1,018 320 826 1,046 27% 3%
Net profit, reported -2,738 7,532 4,160 4,968 6,306 7,277 1,806 1,016 1,018 320 826 1,046 27% 3%
Deduct: disposal gains, net 311 -392 -578 0 0 0 0 0 -578 0 0 0
Add: intangible effects 1,324 117 126 92 92 133 24 22 51 29 23 23
Add: restructuring charges, net 575 105 317 101 0 0 0 0 310 7 101 0
Add: litigation charges etc 0 173 0 0 0 0 0 0 0 0 0 0
Deduct: own-debt & MCN gains 1,725 558 -1,536 1,164 0 0 133 25 -1,765 71 1,164 0
Deduct: other -1,240 0 0 -388 0 0 0 0 0 0 -388 0
Operating profit, net -43 8,093 2,489 5,937 6,398 7,410 1,963 1,063 -964 427 1,726 1,069 -38% 1%
Cost / income 98% 76% 80% 76% 73% 71% 73% 77% 83% 91% 80% 75%
LLC / net loans 0.60% 0.02% 0.03% 0.04% 0.07% 0.09% 0.00% -0.02% 0.11% 0.02% -0.05% 0.07%
Tax rate [effective] 17.2% -5.1% 17.2% 17.5% 17.5% 17.5% 19.1% 22.8% -4.1% 33.2% 36.5% 20.0%
ROE -7.8% 16.7% 8.5% 9.1% 10.8% 11.6% 15.4% 8.7% 8.2% 2.4% 6.2% 7.8%
Op. RoNAV -0.2% 23.6% 6.3% 13.2% 13.0% 13.8% 21.2% 11.3% -9.5% 4.0% 15.7% 9.7%
Shares outstanding [basic] 3,794 3,793 3,747 3,776 3,776 3,776 3,804 3,768 3,741 3,747 3,776 3,776
Ø shares outstanding [diluted] 3,669 3,837 3,834 3,819 3,819 3,819 3,849 3,869 3,815 3,800 3,819 3,819
EPS [diluted] -0.75 1.96 1.09 1.30 1.65 1.91 0.47 0.26 0.27 0.08 0.22 0.27
Operating EPS [diluted] -0.01 2.11 0.65 1.55 1.68 1.94 0.51 0.27 -0.25 0.11 0.45 0.28
Book per share [basic] 10.81 12.35 14.29 15.09 15.96 17.24 12.28 12.54 13.85 14.29 14.10 14.27
NAV per share [basic] 7.91 9.76 11.70 12.64 13.53 14.84 9.74 10.19 11.34 11.70 11.62 11.80 2% 16%
Buy-back per share 0.00 0.00 0.00 0.00 0.00 0.00 0.00 0.00 0.00 0.00 0.00 0.00
Dividend per share 0.00 0.00 0.10 0.40 0.65 0.80
Group AUM 2,233,000 2,152,000 2,167,000 2,138,092 2,270,183 2,426,976 2,198,000 2,069,000 2,025,000 2,167,000 2,088,000 2,076,515
Group AUM growth 2.7% -3.6% 0.7% -1.3% 6.2% 6.9% 2.1% -5.9% -2.1% 7.0% -3.6% -0.6%Group inflows -147,300 -14,400 41,400 29,709 44,531 66,005 22,300 8,700 5,200 5,200 2,700 7,278
Group inflows / AUM -6.8% -0.6% 1.9% 1.4% 2.1% 2.9% 1.0% 0.4% 0.3% 0.3% 0.1% 0.3%
'Headline' tier 1 capital 31,798 35,272 38,370 42,579 46,431 49,437 36,379 37,387 38,121 38,370 39,570 40,238
Deduct: hybrid capital -7,224 -4,903 -4,356 -4,286 -4,286 -3,036 -4,561 -4,252 -4,327 -4,356 -4,286 -4,286
'Equity' tier 1 capital 24,574 30,369 34,014 38,293 42,145 46,401 31,818 33,135 33,794 34,014 35,284 35,952
Credit RWA 140,494 119,919 126,804 111,988 183,716 187,511 121,854 115,986 123,543 126,804 116,654 115,907
Non-counterparty 7,026 6,195 6,050 6,051 6,051 6,051 6,153 5,862 5,924 6,050 6,051 6,051
Market RWA 12,861 20,813 49,241 40,087 40,087 38,453 25,389 34,832 28,462 49,241 34,387 40,087
Operational RWA 46,144 51,948 58,867 53,999 53,999 49,000 49,964 49,544 49,328 58,867 53,999 53,999
Risk-weighted assets 206,525 198,875 240,962 212,125 283,853 281,014 203,361 206,224 207,257 240,962 211,092 216,044
Ø RWA 247,701 206,244 209,190 216,946 291,477 282,434 201,118 204,793 206,741 224,110 226,027 213,568
RWA growth -32% -4% 21% -12% 34% -1% 2% 1% 1% 16% -12% 2%
'Headline' tier 1 ratio 15.4% 17.7% 15.9% 20.1% 16.4% 17.6% 17.9% 18.1% 18.4% 15.9% 18.7% 18.6%
'Equity' tier 1 ratio 11.9% 15.3% 14.1% 18.1% 14.8% 16.5% 15.6% 16.1% 16.3% 14.1% 16.7% 16.6%
Basel 3 RWA (KBWe) 350,594 389,608 380,000 317,171 283,853 281,014 407,044 402,231 400,000 380,000 350,000 333,438
Basel 3 common tier 1 capital (KBWe) 14,400 19,190 25,400 29,302 34,798 39,554 21,108 24,101 24,600 25,400 26,100 26,644
B3 CET1 ratio 4.1% 4.9% 6.7% 9.2% 12.3% 14.1% 5.2% 6.0% 6.2% 6.7% 7.5% 8.0%
Level 3 assets, net 37,600 24,500 25,200 n/a n/a n/a 23,500 20,800 24,500 25,200 21,200 n/a
Level 3 liabilities, net 27,700 24,700 23,500 n/a n/a n/a 22,200 20,100 20,800 23,500 20,400 n/a
Level 3 assets & liabilities 65,300 49,200 48,700 n/a n/a n/a 45,700 40,900 45,300 48,700 41,600 n/a
Level 3 assets & liabilities / tier 1 2.1x 1.4x 1.3x n/a n/a n/a 1.3x 1.1x 1.2x 1.3x 1.1x n/a
Tier 1 leverage ratio [FINMA style] 3.9% 4.4% 5.4% 6.2% 6.9% 7.5% 4.8% 4.9% 5.5% 5.4% 5.6% 5.8% Source: KBW estimates
Please refer to important disclosures and analyst certification information on pages 22 - 25. 21
16 July 2012
IMPORTANT DISCLOSURES
RESEARCH ANALYST CERTIFICATION: We, Mark Phin, CFA, Andrew Stimpson, Vasco Moreno and Luke Birtwistle, herebycertify that the views expressed in this research report accurately reflect our personal views about the subject companies and theirsecurities. We also certify that We have not been, and will not be receiving direct or indirect compensation in exchange for expressing thespecific recommendation in this report.
Analysts’ Compensation: The equity research analysts responsible for the preparation of this report receive compensation based uponvarious factors, including the quality and accuracy of research, client feedback, competitive factors, and overall firm revenues, whichinclude revenues from, among other business units, Institutional Equities and Investment Banking.
For disclosures pertaining to recommendations or estimates made on a security mentioned in this report, please see the most recentlypublished company report or visit our global disclosures page on our website at http://www.kbw.com/research/disclosures or see thesection below titled "Disclosure Information" for further information on how to obtain these disclosures.
AFFILIATE DISCLOSURES: This report has been prepared by Keefe, Bruyette & Woods Inc. (“KBWI”) and/or its affiliates Keefe,Bruyette & Woods Limited and Keefe, Bruyette & Woods Asia Limited all of which are subsidiaries of KBW, Inc. (collectively“KBW”). Keefe, Bruyette & Woods Inc. is regulated by FINRA, NYSE, and the United States Securities and Exchange Commission, andits headquarters is located at 787 7th Avenue, New York, NY 10019. Keefe, Bruyette & Woods Limited is registered in England andWales, no. 04605071 and its registered office is 7th Floor, One Broadgate, London EC2M 2QS. KBWL is authorised and regulated by theUK Financial Services Authority ("FSA"), entered on the FSA's register, no. 221627 and is a member of the London Stock Exchange.Keefe, Bruyette & Woods Asia Limited is a licensed corporation regulated by the Securities and Futures Commission of Hong Kong("SFC") (CE No.: AUI281). Its headquarters is located at 3101, 31/F Central Plaza, 18 Harbour Road, Wanchai, Hong Kong. Disclosuresin the Important Disclosures section referencing KBW include one or all affiliated entities unless otherwise specified.
Registration of non-US Analysts: Any non-US Research Analyst employed by a non-US affiliate of KBWI contributing to this report isnot registered/qualified as research analyst with FINRA and/or the NYSE and may not be an associated person of KBWI and thereforemay not be subject to NASD Rule 2711 or NYSE Rule 472 restrictions on communications with a subject company, public appearances,and trading securities held by a research analyst account.
Disclosure Information. For current company specific disclosures please write to one of the KBW entities: Keefe, Bruyette &Woods Research Department at the following address: 787 7th Avenue, 4th Floor, New York, NY 10019. The Compliance Officer,Keefe, Bruyette and Woods Limited, 7th Floor, One Broadgate, London EC2m 2QS. The Compliance Officer, Keefe, Bruyette andWoods Asia Limited, 3101, 31/F Central Plaza, 18 Harbour Road, Wanchai, Hong Kong. Or visit our website athttp://www.kbw.com/research/disclosures. KBW has arrangements in place to manage conflicts of interest including information barriersbetween the Research Department and certain other business groups. As a result, KBW does not disclose certain client relationships with,or compensation received from, such companies in its research reports.
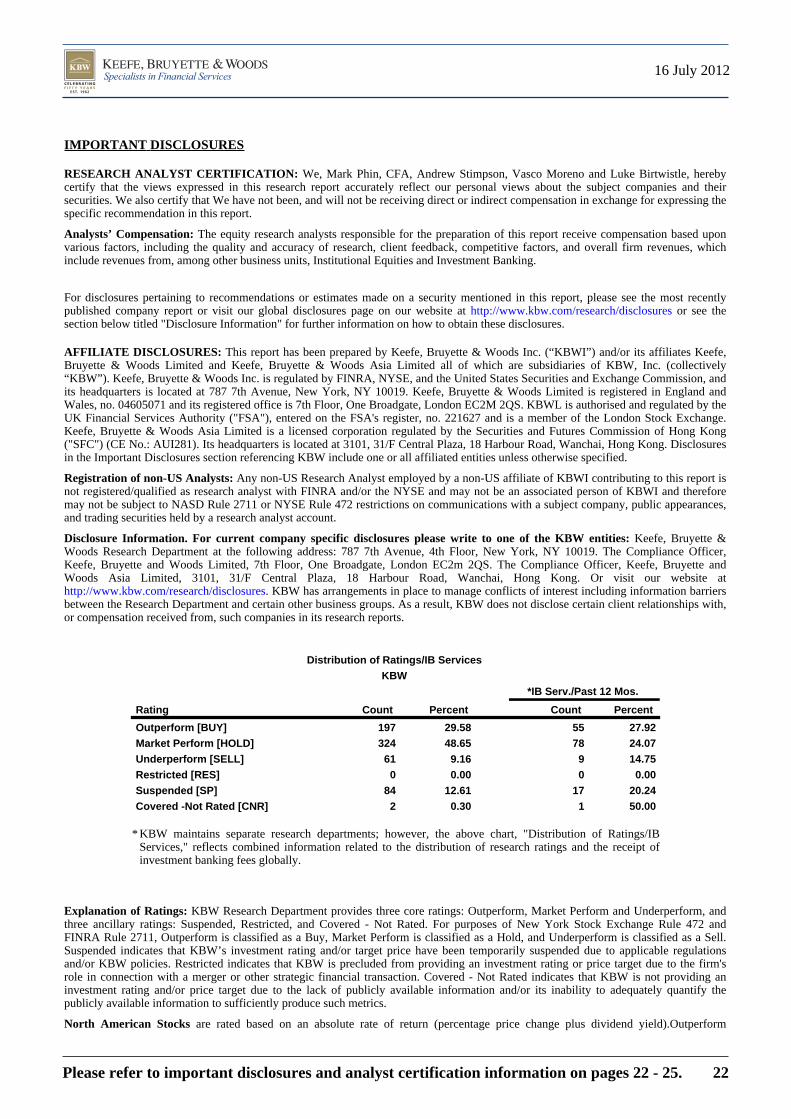
Distribution of Ratings/IB ServicesKBW
*IB Serv./Past 12 Mos.
Rating Count Percent Count Percent
Outperform [BUY] 197 29.58 55 27.92Market Perform [HOLD] 324 48.65 78 24.07Underperform [SELL] 61 9.16 9 14.75Restricted [RES] 0 0.00 0 0.00Suspended [SP] 84 12.61 17 20.24Covered -Not Rated [CNR] 2 0.30 1 50.00
* KBW maintains separate research departments; however, the above chart, "Distribution of Ratings/IBServices," reflects combined information related to the distribution of research ratings and the receipt ofinvestment banking fees globally.
Explanation of Ratings: KBW Research Department provides three core ratings: Outperform, Market Perform and Underperform, andthree ancillary ratings: Suspended, Restricted, and Covered - Not Rated. For purposes of New York Stock Exchange Rule 472 andFINRA Rule 2711, Outperform is classified as a Buy, Market Perform is classified as a Hold, and Underperform is classified as a Sell.Suspended indicates that KBW’s investment rating and/or target price have been temporarily suspended due to applicable regulationsand/or KBW policies. Restricted indicates that KBW is precluded from providing an investment rating or price target due to the firm'srole in connection with a merger or other strategic financial transaction. Covered - Not Rated indicates that KBW is not providing aninvestment rating and/or price target due to the lack of publicly available information and/or its inability to adequately quantify thepublicly available information to sufficiently produce such metrics.
North American Stocks are rated based on an absolute rate of return (percentage price change plus dividend yield).Outperform
Please refer to important disclosures and analyst certification information on pages 22 - 25. 22
16 July 2012
represents a total rate of return of 15% or greater. Market Perform represents a total rate of return in a range between -5% and+15%.Underperform represents a total rate of return at or below -5%.
European and Asian Stocks are rated based on the share price upside to target price relative to the relevant sector index performance ona 12-month horizon. Outperform rated stocks have a greater than 10 percentage point (“pp”) relative performance versus the sector,Market Perform rated stocks between +10pp to -10pp relative performance versus the sector, and Underperform rated stocks a lower than10pp relative performance versus the sector. The 12-month price target may be determined by the stock’s fundamentally driven fair valueand/or other factors (e.g., takeover premium or illiquidity discount).
KBW Model Portfolio: "Model Portfolio Buy" - Companies placed on this list are expected to generate a total rate of return (percentageprice change plus dividend yield) of 10% or more over the next 3 to 6 months.
"Model Portfolio Sell" - Companies placed on this list are expected to generate a total rate of return (percentage price change plusdividend yield) at or below -10% over the next 3 to 6 months.
The purpose of the Model Portfolio is to inform institutional investors of KBWI’s short-term (as described above) outlook for a particularindustry sector. The Portfolio is not available for purchase or sale, cannot be duplicated as shown, is hypothetical and is for illustrativepurposes only. For a more detailed description of the selection criteria and other specifics related to the construction of the ModelPortfolio, please refer to the January 5, 2010 Model Portfolio Primer and/or contact your KBWI representative for more information.
The Model Portfolio should be viewed as a short-term outlook of a particular industry sector, not as individual security recommendations.The Model Portfolio uses a three-to-six-month time horizon and should not be considered when making longer term investments. KBWIResearch publishes research with a 12-month outlook on each issuer of securities contained in the Model Portfolio. Investors who areinterested in a particular security should request KBWI Research’s coverage of such securities by contacting your KBWI representative.KBW research contains analyses of fundamentals underlying each issuer.
KBWI’s long-term recommendations may differ from recommendations made for the Model Portfolio. These differences are the result ofdifferent time horizons -- KBWI research has a 12-month outlook and the Model Portfolio has a three-to-six-month outlook.
Although the model portfolio is based upon actual performance of actual investments, KBWI did not recommend that investors purchasethis combination -- or hypothetical portfolio -- of investments during the time period depicted here. As this hypothetical portfolio wasdesigned with the benefit of hindsight, the choice of investments contained in it reflects a subjective choice by KBWI. Accordingly, thishypothetical portfolio may reflect a choice of investments that performed better than an actual portfolio, which was recommended duringthe depicted time frame, would have performed during the same time period. Moreover, unlike an actual performance record, these resultsdo not represent actual trading wherein market conditions or other risk factors may have caused the holder of the portfolio to liquidate orretain all or part of the represented holdings.
Other Research Methods: Please be advised that KBW provides to certain customers on request specialized research products orservices that focus on covered stocks from a particular perspective. These products or services include, but are not limited to,compilations, reviews and analysis that may use different research methodologies or focus on the prospects for individual stocks ascompared to other covered stocks or over differing time horizons or under assumed market events or conditions.
OTHER DISCLOSURES
Indices: The following indices: U.S.: KBW Bank Index (BKX), KBW Insurance Index (KIX), KBW Capital Markets Index (KSX),KBW Regional Banking Index (KRX), KBW Mortgage Finance Index (MFX), KBW Property & Casualty Index (KPX), KBW PremiumYield Equity REIT Index (KYX); KBW Financial Sector Dividend Yield Index (KDX); Europe: KBW Large-Cap Banks Index (KEBI),KBW Mid/Small Cap Banks Index (KMBI), KBW Large-Cap Insurance Index (KEII), KBW Miscellaneous Financials Index (KMFI),KBW Emerging Europe Financials Index (KEEI); and Global: KBW Global ex-U.S. Financial Sector Index (KGX), are the property ofKBWI.
KBWI does not guarantee the accuracy and/or completeness of the Indices, makes no express or implied warranties with respect to theIndices and shall have no liability for any damages, claims, losses or expenses caused by errors in the index calculation. KBWI makes norepresentation regarding the advisability of investing in options on the Index. Past performance is not necessarily indicative of futureresults.
ETFs: The shares ("Shares") of KBW ETFs are not sponsored, endorsed, sold or promoted by KBWI. KBWI makes no representation orwarranty, express or implied, to the owners of the Shares or any member of the public regarding the advisability of investing in securitiesgenerally or in the Shares particularly or the ability of its Indices to track general stock market performance. The only relationship ofKBWI to Invesco PowerShares Capital Management LLC and ProShares is the licensing of certain trademarks and trade names of KBWIand its Indices which are determined, composed and calculated by KBWI without regard to Invesco PowerShares Capital ManagementLLC and ProShares, the fund, or the Shares. KBWI has no obligation to take the needs of Invesco PowerShares Capital ManagementLLC and ProShares or the owners of the shares into consideration in determining, composing, or calculating the Indices. KBWI is notresponsible for and has not participated in any determination or calculation made with respect to issuance or redemption of the Shares.KBWI has no obligation or liability in connection with the administration, marketing or trading of the Shares.
ETFs trade like stocks, are subject to investment risk, fluctuate in market value and may trade at prices above or below the ETFs net assetvalue. Investing in a single sector may be subject to more volatility than funds investing in a diverse group of sectors. Brokeragecommissions and ETF expenses will reduce returns. In general, ETFs can be expected to move up or down in value with the value of theapplicable index. Although ETFs may be bought and sold on the exchange through any brokerage account, ETFs are not individually
Please refer to important disclosures and analyst certification information on pages 22 - 25. 23
16 July 2012
redeemable from the Fund. Investors may acquire ETFs and tender them for redemption through the Fund in Creation Unit Aggregationsonly, please see the prospectus for more details. There are risks involved with investing in ETFs, including possible loss of money. Sharesare not actively managed and are subject to risks including those regarding short selling and margin maintenance requirements. Pastperformance is not necessarily indicative of future results.
Leverage and Inverse ETFs: ProShares Ultra KBW Regional Banking (KRU) and ProShares Short KBW Regional Banking (KRS)ETFs seek returns that are either 2x, -1x, respectively, the return of an index or other benchmark (target) for a single day, as measuredfrom one NAV calculation to the next. Due to the compounding of daily returns, returns over periods other than one day will likelydiffer in amount and possibly direction from the target return for the same period. These effects may be more pronounced in fundswith larger or inverse multiples and in funds with volatile benchmarks. These funds may not be suitable for all investors and should beused only by knowledgeable investors who understand the potential consequences of seeking daily leveraged investment results.Investing involves risk, including the possible loss of principal. ProShares Short are non-diversified and should lose value whentheir market indexes rise—a result that is opposite from traditional ETFs—and they entail certain risks including risk associatedwith the use of derivatives, imperfect benchmark correlation, leverage and market price variance, all of which can increase volatility anddecrease performance.
For more on correlation, leverage and other risks, please read the prospectus.
An investor should consider the Funds’ investment objectives, risks, charges and expenses carefully before investing. This and otherinformation can be found in their prospectuses. For this and more complete information about the Funds, call InvescoPowerShares at1-800-983-0903 or visit https://invescopowershares.com; or call ProShares Client Services at 1-866-776-5125 or visithttp://www.proshares.com/resources/litcenter/ for a prospectus. The prospectus should be read carefully before investing.
Shares of the ETFs funds are not guaranteed or insured by the FDIC or by another governmental agency; they are not obligations of theFDIC nor are they deposits or obligations of or guaranteed by KBWI, Invesco PowerShares Capital Management LLC or ProShares.ETFs are distributed by Invesco Distributors, Inc. the distributor of the PowerShares Exchange-Traded Fund Trust II. PowerShares® is aregistered trademark of Invesco PowerShares Capital Management LLC; ProShares are distributed by SEI Investments Distribution Co.which is not affiliated with ProFunds Group or its affiliates.
General Risk Disclosure: Investments in securities or financial instrument involve numerous risks which may include market risk,counterparty default risk, liquidity risk and exchange rate risk. No security or financial instrument is suitable for all investors and someinvestors may be prohibited in certain states or other jurisdictions from purchasing securities mentioned in this communication. Thesecurities of some issuers may not be subject to the audit and reporting standards, practices and requirements comparable to thosecompanies located in the investor’s local jurisdiction. Where net dividends to ADR investors are discussed, these are estimated, usingwithholding tax rate conventions, and deemed accurate, but recipients should always consult their tax advisor for exact dividendcomputations.
COUNTRY SPECIFIC AND JURISDICTIONAL DISCLOSURES: United States: This report is being distributed in the US byKeefe, Bruyette & Woods Inc. Where the report has been prepared by a non-US affiliate, Keefe, Bruyette & Woods Inc., acceptsresponsibility for its contents. U.K. and European Economic Area (EEA): This report is issued and approved for distribution in theEEA by Keefe Bruyette & Woods Limited, which is regulated in the United Kingdom by the Financial Services Authority. Hong Kong:This document has been distributed by Keefe, Bruyette & Woods Asia Limited for the information of institutional customers and is notintended for, and should not be distributed to, retail investors in Hong Kong. Keefe, Bruyette & Woods Asia Limited acceptsresponsibility for the information set out in this document. Singapore: This communication is distributed in Singapore only to personswho are "institutional investors" as defined in the Securities and Futures Act, Chapter 289 of Singapore and is not intended for, andshould not be distributed to, any person in Singapore who is not an "institutional investor”.
In jurisdictions where KBW is not already licensed or registered to trade securities, transactions will only be affected in accordance withlocal securities legislation which will vary from jurisdiction to jurisdiction and may require that a transaction is carried out in accordancewith applicable exemptions from registration and licensing requirements. Non US customers wishing to effect a transaction shouldcontact a representative of the KBW entity in their regional jurisdiction except where governing law permits otherwise. US customerswishing to effect a transaction should do so by contacting a representative of Keefe, Bruyette & Woods Inc.
ONLY DISTRIBUTE UNDER REGULATORY LICENSE: This communication is only intended for and will only be distributed topersons residing in any jurisdictions where such distribution or availability would not be contrary to local law or regulation. Thiscommunication must not be acted upon or relied on by persons in any jurisdiction other than in accordance with local law or regulationand where such person is an investment professional with the requisite sophistication and resources to understand an investment in suchsecurities of the type communicated and assume the risks associated therewith.
CONFIDENTIAL INFO: This communication is confidential and is intended solely for the addressee. It is not to be forwarded to anyother person or copied without the permission of the sender. Please notify the sender in the event you have received this communicationin error.
NO SOLICITATION OR PERSONAL ADVICE: This communication is provided for information purposes only. It is not a personalrecommendation or an offer to sell or a solicitation to buy the securities mentioned. Investors should obtain independent professionaladvice before making an investment.
ASSUMPTIONS, EFFECTIVE DATE AND UPDATES: Certain assumptions may have been made in connection with the analysispresented herein, so changes to assumptions may have a material impact on the conclusions or statements made in this communication.Facts and views presented in this communication have not been reviewed by, and may not reflect information known to, professionals inother business areas of KBW, including investment banking personnel.
Please refer to important disclosures and analyst certification information on pages 22 - 25. 24
16 July 2012

The information relating to any company herein is derived from publicly available sources and KBW makes no representation as to theaccuracy or completeness of such information. Neither KBW nor any of its officers or employees accept any liability whatsoever for anydirect, indirect or consequential damages or losses arising from any use of this report or its content.
This communication has been prepared as of the date of the report.
KBW does not undertake to advise clients of any changes in information, estimates, price targets or ratings, all of which are subject tochange without notice. The recipients should assume that KBW will not update any fact, circumstance or opinion contained in this report.
COPYRIGHT: This report is produced for the use of KBW customers and may not be reproduced, re-distributed or passed to any otherperson or published in whole or in part for any purpose without the prior consent of KBW.
Please refer to important disclosures and analyst certification information on pages 22 - 25. 25
16 July 2012

Julianna Balicka 1 415 591 5078 Kristin Brown 1 212 887 7738 Luke Birtwistle +44 20 7663 5284 Stanley Tsai, CFA +852 3973 8328John Barber 1 212 887 7747 Smedes Rose 1 212 887 3696 Jean-Pierre Lambert +44 20 7663 5292Frank Barlow 1 404 231 6542 Robert Simone, CFA 1 212 887 2059 Vasco Moreno +44 20 7663 5282Timur Braziler 1 860 722 5935 Taylor Schimkat 1 212 887 7729 Mark Phin, CFA +44 20 7663 5279 Jean Bao +852 3973 8331Jacquelynne Chimera, CFA 1 415 591 5074 Antonio Ramirez +44 20 7663 5283 Sam Hilton +852 3973 8330Matthew Dinneen 1 212 887 3862 Ronny Rehn +44 20 7663 3214 Brian Hunsaker +852 3973 8324Andrew Del Medico 1 212 887 3680 Tai DiMaio 1 212 887 7719 Marta Sanchez Romero +44 20 7663 5288 Steven Lam +852 3973 8326Damon DelMonte 1 860 722 5908 Bose George 1 212 887 3843 Andrew Stimpson +44 20 7663 3233 Udith Sikand +852 3973 8334Brian Finneran 1 212 887 6751 Steven Kwok, CFA 1 212 887 7713 David Threadgold, CFA +813 5770 2551Brady Gailey, CFA 1 404 231 6546 Ryan O'Steen 1 212 887 7736David Gong 1 415 591 1634 Jade J. Rahmani 1 212 887 3882 Ekaterina Isaeva +44 20 7663 3213Jefferson Harralson, CFA 1 404 231 6540 Sanjay Sakhrani 1 212 887 7723 Ronny Rehn +44 20 7663 3214 Sam Hilton +852 3973 8330Derek Hewett 1 404 231 6549Catherine Klinchuch 1 415 591 5075Brian Klock 1 415 591 5072 Frederick Cannon, CFA 1 212 887 3887 Paris Hadjiantonis +44 20 7663 3120 Stanley Tsai, CFA +852 3973 8328David J. Konrad, CFA 1 212 887 6719 Brian Kleinhanzl 1 212 887 3699 William Hawkins +44 20 7663 5294 David Threadgold, CFA +813 5770 2551Christopher McGratty, CFA 1 212 887 7704 Ralph Hebgen +44 20 7663 3221Catherine Mealor 1 404 231 6548 Chris Hitchings +44 20 7663 3232Stephen Scouten 1 404 231 6547 Marcantonio Ramos 1 212 887 3691 Karl Morris +44 20 7663 5296 Jean Bao +852 3973 8331
Greig Paterson, CFA, FFA +44 20 7663 5289 Bill Stacey +852 3973 8332
Niamh Alexander 1 212 887 3695 Kelly Motta 1 212 887 7717Alison Heffernan 1 212 887 3692 Melissa A. Roberts 1 212 887 3820 Chris Hitchings +44 20 7663 3232 Bill Stacey +852 3973 8332Joel Jeffrey 1 212 887 3865 Tom Mills +44 20 7663 5295Robert Lee 1 212 887 7732 Karl Morris +44 20 7663 5296Alim Shaikh 1 212 887 7730 Brian Gardner 1 202 450 3576 Andrew Stimpson +44 20 7663 3233Jacob Troutman 1 212 887 3688
William T. Clark 1 860 722 5936Neil Cybart 1 860 722 5933Robert Farnam 1 860 722 5901Cliff Gallant, CFA 1 212 887 7705Frank Lee 1 212 887 7709Matthew Rohrmann 1 212 887 3677Jeffrey Schuman 1 860 722 5902Brett Shirreffs 1 212 887 4713
Index Research
Quantitative Analysis
Washington Research
Asian Exchanges
Asian Insurance
Asian Securities Companies
Asian Strategy
European Insurance
European Miscellaneous Financial
Keefe, Bruyette & Woods Asia LimitedDavid Threadgold, CFA
European Banks Asian Asset Managers
Keefe, Bruyette & Woods Limited
European Emerging Markets
Director of Research
Insurance
+813 5770 2551
Banks
Capital Markets
Asian Banks
1 212 887 3887 +44 20 7663 5282
Diversified Financials
Equity Strategy
Director of ResearchFrederick Cannon, CFA Vasco Moreno
Keefe, Bruyette & Woods, Inc.
Equity REITs
Director of Research
787 Seventh Avenue, 4th Floor One Constitution Plaza 3455 Peachtree Road NE 225 Franklin StreetNew York, NY 10019 17th Floor Suite 450 Suite 1720
1 212 887 7777 Hartford, CT 06103 Atlanta, GA 30326 Boston, MA 021101 800 966 1559 1 860 722 5900 1 404 231 6565 1 617 848 2777
3200 Southwest Freeway 101 California Street, Suite 3700 Two James Center 10 South Wacker Drive, Suite 3400Suite 2250 San Francisco, CA 94111 1021 East Cary Street, Suite 1950 Chicago, IL 60606
Houston, Texas 77027 1 415 591 5060 Richmond, VA 23219 1 312 423 82001 832 214 1800 1 877 778 5330 1 804 643 4250 1 800 929 6113
Keefe, Bruyette & Woods, Inc.
Keefe, Bruyette & Woods Limited
One Broadgate 18 Harbour Rd Moto-Akasaka MI Building 4F7th Floor Central Plaza, Suite 3101 1-3-26 Moto-Akasaka, Minato-ku
London EC2M 2QS Wanchai, Hong Kong Tokyo 107-0051, Japan+44 20 7663 5260 +852 3973 8300 +813 5770 2550
Keefe, Bruyette & Woods Asia Limited