liberty, missouri community forest conservation assessment
TRANSCRIPT

Liberty, Missouri
Community Forest Conservation Assessment

This Page Left Intentionally Blank

A portion of the funding for this project was made available through the Missouri Department of
Conservation's Tree Resource Improvement and Maintenance (TRIM) grant program.
Project partners:
Special thanks to our Project Advisory Team:
Project Partners & Acknowledgements
Chris Wilson – Parks & Open Space Manager, City of Liberty
Katherine Sharp – City Planner, City of Liberty
David Jones – Planner, City of Liberty
Cynthia Matney – GIS Coordinator, City of Liberty
Janet Snook – Director of Parks & Recreation, City of Liberty
Stephen Van Rhein – Heartland Conservation Alliance
Wendy Sangster – Missouri Department of Conservation
Steve Rhoades – Vireo Planning & Design
Helene Miller – TreeLiberty
Chris Veach – Liberty Tree Board

This Page Left Intentionally Blank

Executive Summary pg. 1
Major Findings pg. 2
Project Background pg. 3
Terms & Acronyms pg. 5
Steps to Complete CFCA (graphic) pg. 6
Results
Conservation Priority Ranking Model Results pg. 7
Development Compatibility & Forest
Restoration areas Results pg. 9
i-Tree Canopy Land Cover Change Analysis pg. 12
i-Tree Eco Ecosystem Services Results pg. 14
Methods
Conservation Priority Ranking Model Methods pg. 15
Criteria Used to Determine Conservation Priority pg. 17
i-Tree Canopy Methods pg. 19
i-Tree Eco Methods pg. 20
Conclusions pg. 21
Strategies for Maintaining and Increasing
Forest Cover pg. 23
Appendices
Appendix 1 pg. 24
Appendix 2 pg. 40
Appendix 3 pg. 44
Table of Contents

This Page Left Intentionally Blank

1
The City of Liberty lies at the northeastern
edge of the Kansas City Urban Area in a
region that continues to experience rapid
growth and development. Liberty’s citizens
strive to maintain their community’s identity
and character by appreciating the contribution
of trees and forests toward quality of life for
residents, businesses and visitors. Liberty’s
community forest is comprised of forest tracts
and all of the individual trees that shade the
lawns, line the streets, beautify the parks, and provide habitat for the
wildlife in undeveloped woodlots and streamside corridors that are
ingrained in the fabric of the City.
Liberty’s Community Forest Conservation Assessment project assesses
the multiple values of existing tracts of forest across the city and ranks
tracts by conservation value based on community input, mapping, and
analysis tools. The final map and other information gained support
ongoing planning processes to ensure these values are preserved as
Liberty continues to grow.
Some of the key findings from this project are provided at left and in
the Major Findings on the next page.
Executive Summary
Liberty’s Tree Cover in 2012
Change in Liberty’s Tree
Cover from 1990 – 2012
(a 28% increase)
The number of forest tracts in
Liberty assessed in this
project
Percent of Liberty’s total tree
canopy that is in forest tracts
Pounds of air pollutants
removed by Liberty’s forest
tracts each year
Change in Liberty’s
Impervious Cover from
1990 – 2012 (a 68% increase)

2
Major Findings
Liberty currently has 6,478 acres of tree canopy that covers 35% of the city. Sampling of an
aerial image from 1990 indicated canopy cover has increased from 27% (an 8% increase).
Roughly 55% of the total tree canopy cover (3,500 acres) is contained in contiguous forest
tracts with the rest coming from individual trees.
In an online Forest Values survey, Liberty respondents chose the provision of wildlife habitat
as the highest ranking benefit that forest tracts provide. The next highest ranking benefits
were stormwater retention/flood protection and stream protection (stream bank stabilization
and reduction in bank erosion and sedimentation).
Liberty’s largest forest tracts tend to have the highest priority for conservation. Many of the
city’s largest tracts also cover riparian and floodplain areas, maximizing benefits.
Liberty has 6,671 acres of land that is potentially available for development without resulting
in a loss of any forest tracts.
There are 4,097 acres where restoring forests would be a priority for enhancing forest values
especially along riparian and floodplain corridors. If half of these areas are restored,
Liberty’s canopy cover would be 46% (an 11% increase).
Maps in this report: o Forest tracts in Liberty (page 4) o Community Forest Conservation Values (page 8) o Development Compatibility of Undeveloped Land (page 10) o Forest Restoration Priority Areas (page 11) o Forest Tracts: Tract ID Numbers (page 25) o Forest Tracts: Overall Ecological Quality (page 26) o Forest Tracts: Amount of Invasive Species (page 27)

3
Goal of the Liberty CFCA: To measure the
conservation values of Liberty’s natural forest
tracts:
Map forest tracts within the city limits
Conduct a survey to determine what makes a
forest tract valuable to the city & its citizens
Create a GIS model that prioritizes tracts for
preservation
Develop tools to promote and enhance future
use of this data for decision making
In 2012, the City of Liberty received a Tree Resource
Improvement and Maintenance (TRIM) grant from the
Missouri Department of Conservation to conduct a
Community Forest Conservation Assessment (CFCA).
With this funding, the city contracted with Plan-It Geo
LLC (Arvada, Colo.) to provide professional mapping,
assessment, and reporting services.
The overarching goal was to measure the conservation
values of the many natural forest tracts throughout the
City of Liberty. The objectives are to inventory forest
tracts in the city, assess the value that each tract provides to Liberty’s citizens, and to develop a
forest conservation values map (see pg. 8). This project serves as a baseline inventory of
Liberty’s forested areas to be used as an informational tool for future community planning.
Forest tracts were mapped using Geographic Information Systems (GIS) and 2012 aerial imagery
(see Figure 1 on page 4). After mapping tracts, careful consideration was given to the question
“What makes a forest tract valuable to the City of Liberty and its citizens?” Plan-It Geo, the
City, and a Project Advisory Team (PAT) collaborated to identify criteria for measuring the
value of individual forest tracts. Tracts were mapped in a GIS and cataloged by size, shape, and
relative location to other key landscape features (see Methods on page 15 for a complete listing
and description of criteria). Ecosystem services (see Terms and Acronyms on page 5) were
estimated for each forest tract using the i-Tree suite of software tools.
Criteria were released to the
public through an online survey to
include citizen’s input. These
criteria were then used as inputs
to a GIS-based Conservation
Priority Ranking Model (CPRM)
which was used to assign a score
for each tract based on the criteria.
Additionally, a land cover change
assessment was conducted to
measure change between 1990
and 2012.
Project Background

4
Figure 1: Forest stands (green) were assessed for conservation priority in this study.

5
CFCA - Community Forest
Conservation Assessment
The title of this project.
CPRM - Conservation Priority
Ranking Model
The GIS model used to prioritize
forest tracts by their conservation
priority.
Ecosystem Services
The benefits and functions provided
by trees and the environment. This
includes removal of air pollutants,
absorption of stormwater, storage of
atmospheric carbon, and energy
savings in homes.
Forest Tract Any area where tree canopy covers
>90% the ground over a contiguous
area of at least 0.5 acre when viewed
from above (map view).
GIS – Geographic Information
System
Computer software for conducting
spatial analysis and creating map
products based on data layers with
real-world coordinates. The GIS
software used in this assessment is
ArcGIS v10.1 from ESRI.
UTC - Urban Tree Canopy The area of trees, branches, and
foliage when viewed from above (map
view).

6
Map Forest Tracts – using aerial imagery &
GIS
Determine Forest Tract Values – develop a list of forest ranking criteria with
input from the PAT
Weight Forest Criteria by
Importance – conduct a community survey to get
public opinions
Create a GIS Model to Rank Tracts by their
Conservation Priority – use forest values criteria and
survey results
Present Results – in the form of a report and
accompanying maps
Use The Results –
Liberty planners and managers will use this information to
develop future management plans
Figure 2: Flowchart of the process used in the Community Forest Conservation Assessment

7
Conservation Priority Ranking Model Results
The CPRM ranked 228 forest tracts in Liberty with a priority ranking score of 1-100 (11 tracts
less than 1 acre in size were not ranked). Scores are based on an aggregation of how well each
tract meets each piece of criteria. A score of 100 signifies the most valuable stand, or the stand
which best meets all of the weighted criteria.
Based on input from the Project Advisory Team and results of the public survey, overall
ecological quality (habitat quality) was the most important criteria in the model. Forested
floodplains and forested streams were assigned the next highest values for the stormwater
retention, flood protection, and stream conservation benefits they provide. The enhancement of
forested areas for outdoor recreation was incorporated as the least important.
Liberty’s highest ranked stands are generally in the southern portion of the city, along Rush
Creek and Little Shoal Creek, and in less developed floodplains near the old oxbow of the
Missouri River. See Community Forest Conservation Values map in Figure 4 on the next page.
Results
Figure 3: The priority ranking scores illustrate the relative value associated with each of the
City’s forest tracts based on selected criteria and citizen input.
0
2
4
6
8
10
12
1 5 9 13 17 21 25 29 33 37 41 45 49 53 57 61 65 69 73 77 81 85 89 93 97
Fre
qu
en
cy
Priority Ranking Score
Histogram of Priority Ranking Scores

8
Change to Priority
Ranking Score
Figure 4: Community forest values for Liberty’s forest tracts. Higher scores reflect tracts more
important to the Liberty community.

9
Through a public survey the city learned that, to its citizens, the most important value of
a forest tract is providing habitat for wildlife.
Development Compatibility & Forest Restoration Areas Results
One goal of this assessment was to develop a mapping tool to assist planners in identifying and-
where possible-preserving existing forest tracts with the highest overall conservation
values. Healthy, functioning natural ecosystems provide the greatest amount of benefits through
countless natural interactions that are impossible to fully quantify. It is exceedingly difficult, if
not impossible, for humans to recreate all of the components of a complex natural ecosystem like
those provided by Liberty’s forest tracts. Therefore, prioritizing development away from the
city’s most valuable tracts (and avoiding development over any tracts where possible) is the
primary way these ecosystem benefits will be preserved.
The second important method of preserving forest values is to restore or establish natural forest
where possible. Tree plantings, restoration, and other conservation initiatives will be most
effective if they are done strategically to maximize their future values by connecting and
expanding forest tracts. By identifying forest restoration priority areas we can ensure that our
efforts today make the biggest possible difference tomorrow.
As tools to visualize these conservation methods, the maps on the following two pages were
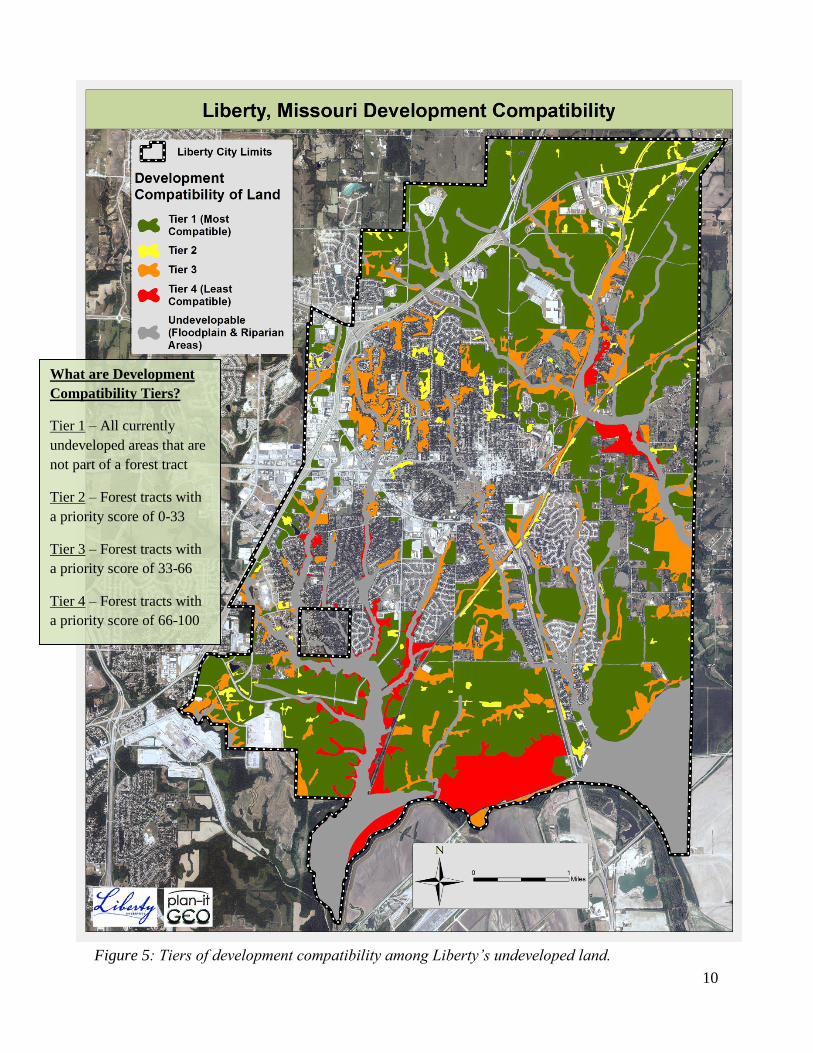
created. The Development Compatibility Map (Figure 5) shows all currently undeveloped
areas of the city. These “developable” areas are symbolized by how desirable they are to
develop, with respect to preserving Liberty’s forest values. The most compatible areas (Tier 1 in
the map) are those that would not require removal of any forest in order to develop. Where
development would impact forest tracts, its level of compatibility is greater where forest
conservation values are lowest. Development would be most incompatible where it would
eliminate all or parts of forest tracts with the highest conservation values.
The Forest Restoration Priorities Map (Figure 6) identifies areas in Liberty where it is the
most ecologically advantageous to conduct forest restoration. Forest restoration would provide
the highest levels of overlapping values in riparian areas (Tier 1). The next priority for
restoration would be to connect forest tracts that are near one another (Tier 2). Tier 3 would
include non-forested floodplains. In Liberty, the greatest amount of area for prioritized
restoration exists around the edges of existing tracts (Tier 4). In these areas it is more likely that
the native plant communities already existing in the forest will be able to effectively reclaim the
land than if plantings are focused elsewhere.
10
Figure 5: Tiers of development compatibility among Liberty’s undeveloped land.
What are the Tiers?
Tier 1 – All currently
undeveloped areas that are
not part of a forest tract
Tier 2 – Forest tracts with
a priority score of 0-33
Tier 3 – Forest tracts with
a priority score of 33-66
Tier 4 – Forest tracts with
a priority score of 66-100
Update
What are Development
Compatibility Tiers?
Tier 1 – All currently
undeveloped areas that are
not part of a forest tract
Tier 2 – Forest tracts with
a priority score of 0-33
Tier 3 – Forest tracts with
a priority score of 33-66
Tier 4 – Forest tracts with
a priority score of 66-100

11
Figure 6: Forest restoration priority tiers in Liberty.
What are the Forest
Restoration Priority
Tiers?
Tier 1 – Stream corridors
(riparian areas) that are not
forested
Tier 2 – Areas within 100ft
of the edge of an existing
forest tract
Tier 3 – Areas where there
is a closable gap and it is
feasible to connect two
tracts into one larger one.
What are the Forest
Restoration Priority
Tiers?
Tier 1 – Stream corridors
(riparian areas) that are not
forested
Tier 2 – Areas where there
is a closable gap and it is
feasible to connect two
tracts into one larger one.
Tier 3 – Floodplain areas
that are not forested
Tier 4 – Areas within 100ft
of the edge of an existing
forest tract

12
Liberty 1990
Land Cover
Class
Number of
Points
Percent of
Points
Standard
Error95% CI*
Tree Canopy 317 27.6% 0.013 2.586
Impervious 72 6.3% 0.010 2.055
Other LC 759 66.1% 0.011 2.236
Total 1148 100.0% 0.035
Liberty 2012
Land Cover
Class
Number of
Points
Percent of
Points
Standard
Error95% CI*
Tree Canopy 405 35.3% 0.014 2.764
Impervious 121 10.5% 0.010 2.055
Other LC 622 54.2% 0.011 2.236
Total 1148 100.0% 0.036
i-Tree Canopy Land Cover Change Assessment Results
The land cover change analysis
revealed that Liberty’s tree
canopy increased from an
estimated 28% in 1990 to 35%
in 2012 representing a
substantial (28%) increase in
forest cover and associated
benefits for the City in a
relatively short time span.
Increases in canopy are likely
the result of natural
regeneration and the growth of
existing trees between the two
time periods. The assessment
included land areas annexed by
the City between 1990 and
2012.
Between 1990 and 2012 Liberty gained
4.3% (about 800 acres) impervious
surface cover from new development, an
increase of 68%!
Between 1990 and 2012, Liberty gained
7.7% (about 1,400 acres) of tree canopy,
an increase of 28%! Much of this is from
growth of existing trees and natural
regeneration of forest.
Tables 1a, 1b, 1c: Statistical estimates of land cover change in Liberty from 1990 to 2012.
Liberty Change 1990 - 2012
Land Cover
Class
Change in
Number of
Points
Percent of
Points
Tree Canopy 88 7.7%
Impervious 49 4.3%
Other LC -137 -11.9%
Total 0 0.0%
12

13
Forest Loss Example:
The Liberty Triangle in March 1990. There is little development and a large patch of forest occupies much of the central and west.
The Liberty Triangle in September 2012. Commercial development has replaced the forest tract. Note the bareness of the large parking lots; this is a prime area to replace some of the canopy lost to development while also maximizing ecosystem service benefits.
Forest Gain Example: A vacant field in south Liberty next to the railroad tracks in March 1990. There is predominantly small scrub and grass cover.
The same vacant field 22 years later (9/2012) where natural regeneration of forest cover in this area is quite impressive. Medium and large trees now dominate the area.
Figure 7: Examples of forest gain and forest loss in Liberty between 1990 and 2012.
13

14
Trees improve air quality by absorbing
and storing pollutants, and lowing air
temperature.
Trees sequester carbon from the
atmosphere and store it within leaves,
stems, and roots.
Trees reduce storm water runoff and
prevent flooding by absorbing rain and
increasing soil percolation.
Trees reduce energy costs by providing
shade when planted near a home.
i-Tree Eco Ecosystem Services Assessment Results
Trees and forests in Liberty provide many ecosystem services that enhance the environment,
economy, and well-being for the City’s residents. In 2007, the Mid-America Regional Council
(MARC) conducted an i-Tree Eco analysis to assess the structure, value, and function
(ecosystem services) provided by trees and forests in the Kansas City Metro region. Plan-It Geo
used the results of this field survey data to estimate the annual value of the average acre of forest
cover in Liberty for several benefit types.
Results show that for every acre of forest in Liberty, the city saves roughly $129 per year in the
installation and maintenance costs of stormwater management infrastructure. Additionally, each
acre of forest saves more than $500 per year in avoided public health costs associated with
reduced air pollution (i.e. reduced hospital visits for people with respiratory problems). Over its
lifetime, each managed tree or forest tract can yield a positive return on investment that is far
greater than the cost of planting and maintenance.
Category→ Stormwater Mitigation
Carbon Removal Pollution Removal
Benefit→ Stormwater Intercepted
C Stored C sequestered O3 SO2 NO2 CO PM <10μ
PM <2.5μ
Total Pollution
Units→ (gal/acre/yr) (lbs/acre/yr) (lbs/acre/yr) (lbs/acre/yr)
Amount (units/ac/yr)→
14,443 51,555 4,237 59 10 4 3 30 4 109
Value ($/ac/yr)→ $129 $1,834 $151 $71 $1 $1 $2 $265 $187 $528
Table 2: Ecosystem services provided by each acre of forest in Liberty each year

15
Conservation Priority Ranking Model (CPRM) Methodology
The first step in developing the CPRM was to map (digitize) forest tracts within
Liberty’s city limits using GIS. The 2012 National Agricultural Imagery
Program (NAIP) aerial imagery at 1-meter pixel resolution was used for this
step. Forest tracts were defined as a contiguous area greater than one half acre
with continuous tree cover greater than 90 percent.
Next, criteria were developed to describe qualities that make a tract valuable to
the community. All criteria were created using the following qualifications:
A criterion must be directly related to positive benefits of a forest tract
A criterion must be easily measurable (can put numbers to it)
A criterion must be differentiable between forest tracts
GIS data must exist to support any analysis needed to calculate a
criterion
Criteria used to rank forests by conservation value were grouped into the
following three types. The complete list of final criteria is on pages 17 and 18.
Tract size and shape (top of page 17)
Location of a tract in relation to other features of interest (bottom of
page 17)
The ecological/environmental quality of a tract, where ecological criteria
were assessed in the field by the City via rapid windshield survey using
five sub-criteria that were scored and summarized (page 18).
It should be noted that the quality and value associated with a forest tract can be
subjective based on differing knowledge base or opinion. The project team
consulted with forestry and social science experts to determine appropriate
forest tract criteria and surveyed citizens to select and rank criterion by
importance to individuals (details about survey methodology can be found in
Appendix 2).
Using the survey results, each criterion was weighted from 1-10 with 10 being
the most important (highest weighting). The weights were then used to prioritize
and assign scores for each forest tract based on local conditions (as they relate
to the selected criteria) through the CPRM.
Methods

16
Weights reflect the relative importance of each criterion for computing the final priority scores
for each forest tract. By adjusting the weight to apply to each criterion in the CPRM, the final
score of each forest tract will change based on characteristics of the tract. Assigning a higher
weighting factor will increase the influence of that criterion in determining a tract’s final score.
Weighting Factors Used in Computing
Priority Ranking Scores
57 Acres
of Forest
½ Mile
Figure 8: Weighting factors used to prioritize tracts in the CPRM.

17
Criteria Definition (GIS Query) Conservation
Ranking Notes/Reasoning
Size & Shape Criteria
Size of Tract Size of tract Greater Size = Higher Ranking
Bigger tracts are harder to replace, also increased size leads to increases in
positive benefits.
Edge Effect (Viable Interior)
Ratio of forest edge (area in tract within 30ft of edge of tract) to
forest core (area in tract more than 30ft from edge of tract)
Lower edge/core = higher ranking
This is based on the ecological principal that the farther any given point in the forest is from the edge of that forest,
the less susceptible it is to outside disturbances and the more likely that it
is ecologically healthy Location-Based
Criteria
Overlap with Floodplain
Amount of overlap between forest tract and floodplain (zones A and
X500)
More Overlap = higher ranking
Floodplains will not/cannot be developed, so conservation here is
feasible. Forests in floodplains also help prevent flood damage through
interception, absorption and soil stabilization
Overlap with Riparian Areas
Amount of overlap between forest tract and Riparian Areas (100ft
buffer of streams)
More Overlap = higher ranking
Riparian areas will not/cannot be developed (usually), so conservation is
feasible. They are of high importance for ecosystem quality
Overlap with Recreation Areas
Amount of overlap between forest tract and recreation areas ( 750ft
buffer of park boundaries & 250 ft buffer of trails)
More Overlap = higher ranking
Trees provide aesthetic benefits to rec. areas and enhance recreation
experiences through their multiple benefits
Overlap with Public Facilities
Amount of overlap with grounds of important public facilities (parcels
containing: schools, health care facilities, community centers, golf
courses, cemeteries)
More Overlap = higher ranking
Trees enhance the character of public areas and improve quality of life
Potential for Citizen
Interaction
Weighted average of the number of housing units in census blocks that
the tract intersects (weighted by the amount of overlap between each census block and the tract)
Higher Average Housing Units = higher ranking
Trees that citizens see/interact with on a day-to-day basis enhance community character, stimulate community pride
and improve quality of life
Criteria Used to Determine Conservation Priority
Urban trees enhance the
ecological stability of important
riparian areas. They also
enhance the quality of public
recreation areas
Table 3: Description of the criteria used to prioritize forest tracts for preservation
17

18
Criteria Definition (GIS Query) Conservation
Ranking Notes/Reasoning
Ecological/Environmental Criteria
Forest Structure Forest structure is a measure of the maturity of the ecosystem within a tract. Tracts with better structure have mature trees of different sizes
and species. Qualitative ranking 1(poor structure) - 3(good structure)
higher structure = higher ranking
Healthier trees provide more ecosystem
services
Species composition of tract Species composition refers to the types of trees growing in a tract. Desirable species are those that fit in well with the local ecosystem (native
species). Qualitative ranking 1(more undesirable species) - 3 (more desirable species)
more desirable species = higher
ranking
Desirable species are those that provide the
greatest amount of ecosystem services in
this area/climate
Amount of invasive species Invasive species are non-native species that are detrimental to the ecosystem. Qualitative
ranking 1(lots of invasives) - 3(few invasives)
less invasives = higher ranking
Less invasives = healthier ecosystem &
more ecosystem. Services
Health of trees in stand Health concerns in trees include: diseases, pests and storm damage. Qualitative ranking
1(unhealthy) - 3(healthy)
healthier = higher ranking
Healthier trees provide more ecosystem
services
Past Disturbance This is a measure of the amount of human disturbance to a tract. Disturbances can include: reworking of soil, non-native groundcover, and littering/vandalism. Qualitative ranking 1 (more
disturbed) - 3 (less disturbed)
less disturbance = higher ranking
Less disturbance = healthier ecosystem &
more ecosystem services. Stands with
more disturbance may require additional work
to return them to a natural state.
Connectivity The number of acres of forest that fall within a half mile buffer of a tract (excluding the tract
itself)
More acres of forest within
1/2 mile = higher ranking
Maintaining connectivity/movability between natural areas
is a key factor in preserving ecosystem
health.
Criteria Used to Determine Conservation Priority (cont’d.)
Unhealthy stands have mostly
immature trees and may be
overgrown with invasive species.
Healthy stands have a mix of
mature and young trees with few
invasive species.
18

19
In i-Tree Canopy,
users view random
points within their
study area one at a
time in the map
window and then
record the land cover
at each point in the
datasheet on the right.
Figure 9: Screenshot of using the web-based i-Tree Canopy Tool
i-Tree-Canopy Methodology
i-Tree Canopy® is a web-based tool that is a part of the i-Tree suite
of software developed by the U.S. Forest Service. i-Tree Canopy
combines a Google Maps® base map with a data spreadsheet to
record and statistically assess land cover data in a study area and
continually assess statistical error. i-Canopy provides a quick tool
for estimating the amount of different land cover types. Using
historical imagery in Google Earth® allows for analysis of past
land cover conditions for land cover change assessment.
Random points used to assess land cover in i-Canopy (1,150 total) →

20
An example of one of the 30 forested sample plots used in
Plan-It Geo’s analysis.
i-Tree Eco Methodology
The 2007 MARC ecosystem services study, from which values in this assessment are derived,
used the i-Tree Eco model (also in the i-Tree suite of tools). i-Eco uses on-the-ground tree
surveys to measure tree and forest structure which is used to estimate ecosystem service benefits
in dollars and resource units in a study area. A typical i-Eco study comprises one or more field
survey crews working for long periods of time to inventory 200-300 1/10th
-acre sample plots in a
study area. Each sample plot is exhaustively surveyed including all trees, groundcover, and
buildings. Survey results are then sent electronically to the U.S. Forest Service and processed
through ecological models for calculating ecosystem service values.
Plan-It Geo undertook a reanalysis of the original MARC study data. They modified the original
i-Eco plot data to reflect this assessment. Each original plot was visually assesse d using aerial
imagery in GIS. Plots which
were forested (>90% tree
cover) were exported as a
subset of the original data.
This new dataset, consisting
of only survey plots that are
forested, was rerun through
the i-Eco processing models.
These results provide a good
estimation of the value that
forest tracts provide in
Liberty.
Figure 10: Example of
an output from i-Tree-
Eco, this graph shows
total amount of
pollutants removed in
tons (blue bars) as well
as the associated dollar
values of each pollutant
(triangles). Note that
particulate matter (PM)
has a particularly high
value, as it is a leading
cause of pollution
related human health
issues.

21
This study assessed the natural tracts of forest that---along with
the individual trees and groups of trees along streets, in lawns,
parks, and elsewhere throughout the city---comprise Liberty’s
Community Forest. Results indicate that trees cover 35% of the
City of Liberty, and most of this cover comes from natural tracts
of forest along streams, bottomlands, and other undeveloped
areas. Tree cover has increased nearly 8% in the past two
decades due to growth of existing trees and the expansion of
forest in undeveloped areas. This study identified 239 tracts of
forest throughout the city, and it evaluated these tracts based on
the multiple values they provide for individuals, the community,
and the environment.
Forests provide multiple benefits by reducing pollution, holding
stormwater, protecting streambanks, providing wildlife habitat,
and enhancing outdoor recreation. Specifically, Liberty’s forest
tracts prevent nearly 52 million gallons of stormwater runoff each year at an estimated value of
$461,581. Air pollution removal was valued at nearly $2 million annually.
The study utilized a criteria-based Conservation Priority Ranking Model to produce a map that
shows the relative importance of every forest tract in Liberty. Large tracts along Little Shoal
Creek, Rush Creek, and the old Missouri River oxbow ranked among the most important tracts
for conservation. These tracts are highly valued for stream protection, stormwater retention,
wildlife habitat, and future recreation opportunities---especially as potential greenways for a trail
network.
While forest cover has increased since 1990, the report noted a significant increase in impervious
cover from new development. Impervious cover includes surfaces such as rooftops and parking
lots that do not absorb rainwater, thus contributing to stormwater runoff. Total impervious cover
increased from 6.3% to 10.5%, representing a gain of approximately 800 acres from new
development.
The models used in this study also generated mapping tools for conducting future forest
restoration, as well as for identifying areas where development would be most compatible with
forest conservation. A Forest Restoration Priorities Map identifies areas in Liberty where it is
most ecologically advantageous to conduct forest restoration, which includes non-forested
riparian zones and areas that would connect fragmented forest tracts. A Development
Compatibility Map shows all currently undeveloped areas of the city based on their desirability
Conclusions

22
to develop, with respect to preserving Liberty’s forest values. Development would be most
incompatible where it would eliminate all or parts of forest tracts with the highest conservation
values.
This report and its associated maps should serve as an informational tool to facilitate long-term
forest conservation in Liberty. Assessment results can be used to identify key areas for further
study, discover areas to target outreach and communication with community members, and
develop new tools for protecting and enhancing Liberty’s existing forest tracts. As Liberty
continues to grow and develop, maintaining forest values will require thoughtful and strategic
planning.
Conservation strategies to protect, enhance, and reforest urban and community
tree canopy are presented on the next page followed by appendices with
additional information on this assessment.

23
Strategies for Maintaining and Increasing Forest Cover
Liberty’s city managers and planners will use the products of this assessment to develop forest
management strategies as the city grows. Unique forest management methods that fit into
Liberty’s community, ecosystem, and growth plans will be necessary. While the City must make
final decisions about actions to be taken, a general set of techniques will serve as a starting point.
Below are 29 different techniques for maintaining current canopy and increasing canopy into the
future. They were developed by the US Forest Service State and Private Forestry division. These
techniques could all be developed into customized action plans for the city.
Table 4: Recommendations for maintaining and increasing forest cover, taken from the
US Forest Service’s Urban Watershed Forestry Manual, Part 1: Methods for
Increasing Forest Cover in a Watershed.

24
The appendices contain information that is not critical to understanding the Liberty CPRM
assessment but which is necessary for fully interpreting the results. There are three appendices:
Appendix 1: Detailed Results
o Map of forest tracts with tract ID numbers for use as a reference with data tables
o Map of forest tracts by total ecological quality score
o Map of forest tracts by amount of invasive species
o Table of ecosystem services provided by each forest tract
o Table of complete CPRM results for each tract
Appendix 2: Detailed Methodology
o Public survey methods
o CommunityViz priority ranking (aka suitability model) methods
Appendix 3: References
o Works Cited
o Photo Credits
Appendix 1: Detailed Results
References Appendices

25
Figure 11: Liberty forest tracts labeled with their tract ID numbers, these numbers correspond to
the values in the detailed results tables below in this appendix (tables 4 & 5)

26
Figure 12: Liberty forest tracts shown symbolized by their ecological quality score. Tracts with a
higher score have a healthier, more productive ecosystem within them

27
Figure 13: Liberty forest tracts shown symbolized by their amount of invasive species. Tracts with
a higher value have fewer invasive species, and a healthier ecosystem within them.

28
Tract ID Number
Tract Size
(Acres)
Carbon Sequestered
Carbon Stored
Air Pollution Removed
Stormwater Mitigated
lbs/year $/year lbs/year $/year lbs/year $/year gal/year $/year
1 2 6,896 $247.01 83,915 $2,984.93 178 $859.41 23,509 $209.24
2 4 18,020 $645.44 219,268 $7,799.57 464 $2,245.63 61,428 $546.73
3 4 18,723 $670.61 227,818 $8,103.71 482 $2,333.20 63,824 $568.05
4 3 14,313 $512.64 174,152 $6,194.75 369 $1,783.58 48,789 $434.24
5 4 15,374 $550.66 187,067 $6,654.15 396 $1,915.84 52,407 $466.44
6 1 5,854 $209.68 71,231 $2,533.76 151 $729.51 19,956 $177.61
7 22 94,603 $3,388.45 1,151,113 $40,946.16 2,436 $11,789.11 322,486 $2,870.25
8 20 83,461 $2,989.37 1,015,539 $36,123.68 2,149 $10,400.63 284,505 $2,532.20
9 14 58,262 $2,086.82 708,927 $25,217.20 1,500 $7,260.47 198,607 $1,767.68
10 1 3,666 $131.30 44,604 $1,586.62 94 $456.81 12,496 $111.22
11 8 32,452 $1,162.37 394,875 $14,046.06 836 $4,044.10 110,625 $984.60
12 26 110,309 $3,951.01 1,342,221 $47,744.08 2,841 $13,746.35 376,026 $3,346.77
13 3 10,672 $382.25 129,855 $4,619.08 0 $1,329.91 36,379 $323.79
14 8 32,555 $1,166.05 396,126 $14,090.56 838 $4,056.92 110,975 $987.72
15 3 12,241 $438.44 148,947 $5,298.18 315 $1,525.44 41,728 $371.39
16 4 16,120 $577.40 196,151 $6,977.27 415 $2,008.88 54,952 $489.09
17 4 15,388 $551.16 187,237 $6,660.18 396 $1,917.58 52,455 $466.87
18 47 201,030 $7,200.40 2,446,094 $87,009.88 5,177 $25,051.65 685,278 $6,099.22
19 6 25,392 $909.50 308,971 $10,990.40 654 $3,164.32 86,559 $770.41
20 15 62,063 $2,222.93 755,166 $26,861.95 1,598 $7,734.02 211,561 $1,882.97
21 5 21,084 $755.18 256,545 $9,125.56 118 $2,627.41 71,872 $639.68
22 3 13,110 $469.55 159,514 $5,674.06 338 $1,633.66 44,688 $397.74
23 1 6,244 $223.65 75,978 $2,702.60 161 $778.13 21,285 $189.45
24 2 10,418 $373.16 126,770 $4,509.33 268 $1,298.31 35,515 $316.09
25 14 59,441 $2,129.04 723,268 $25,727.33 1,531 $7,407.34 202,625 $1,803.44
26 15 64,073 $2,294.93 779,624 $27,731.95 1,641 $7,984.51 218,413 $1,943.96
27 5 20,707 $741.69 251,963 $8,962.56 239 $2,580.48 70,588 $628.26
28 5 19,988 $715.91 243,207 $8,651.10 515 $2,490.80 68,135 $606.42
29 9 36,903 $1,321.76 449,025 $15,972.24 950 $4,598.68 125,795 $1,119.62
30 6 24,732 $885.84 300,934 $10,704.51 637 $3,082.01 84,307 $750.36
31 5 22,351 $800.55 271,958 $9,673.81 576 $2,785.26 76,190 $678.12
32 3 13,559 $485.65 164,984 $5,868.63 349 $1,689.68 46,220 $411.38
33 4 19,037 $681.87 231,643 $8,239.77 490 $2,372.37 64,895 $577.59
34 4 18,547 $664.31 225,676 $8,027.52 478 $2,311.26 63,224 $562.71
35 5 22,574 $808.54 274,675 $9,770.45 581 $2,813.08 76,951 $684.89
36 4 14,872 $532.67 180,957 $6,436.82 383 $1,853.27 50,696 $451.21
37 9 36,515 $1,307.87 444,306 $15,804.38 940 $4,550.35 124,473 $1,107.86
38 4 18,496 $662.48 225,056 $8,005.46 476 $2,304.91 63,050 $561.17
39 18 77,149 $2,763.28 938,730 $33,391.49 1,987 $9,613.99 262,987 $2,340.68
40 11 48,495 $1,736.99 590,083 $20,989.82 1,249 $6,043.33 165,313 $1,471.35
41 13 53,398 $1,912.59 649,736 $23,111.73 1,375 $6,654.27 182,025 $1,620.09
42 14 58,944 $2,111.22 717,215 $25,512.03 1,518 $7,345.35 200,929 $1,788.34
43 9 39,411 $1,411.60 479,544 $17,057.82 1,015 $4,911.24 134,345 $1,195.72
44 5 21,907 $784.66 266,561 $9,481.84 564 $2,729.98 74,678 $664.66
45 5 23,040 $825.25 280,352 $9,972.37 593 $2,871.22 78,541 $699.04
46 45 190,315 $6,816.61 2,315,713 $82,372.11 4,901 $23,716.36 648,751 $5,774.12
Table 5: Approximate ecosystem service benefit values provided by each forest tract in Liberty annually

29
Tract ID Number
Tract Size
(Acres)
Carbon Sequestered
Carbon Stored
Air Pollution Removed
Stormwater Mitigated
lbs/year $/year lbs/year $/year lbs/year $/year gal/year $/year
47 12 49,494 $1,772.74 602,229 $21,421.85 1,275 $6,167.72 168,716 $1,501.63
48 28 118,590 $4,247.61 1,442,983 $51,328.26 3,054 $14,778.29 404,254 $3,598.01
49 5 21,337 $764.24 259,624 $9,235.08 549 $2,658.94 72,734 $647.36
50 1 2,928 $104.87 35,626 $1,267.24 75 $364.86 9,981 $88.83
51 1 2,831 $101.39 34,443 $1,225.16 73 $352.75 9,649 $85.88
52 2 6,458 $231.32 78,585 $2,795.33 166 $804.82 22,016 $195.95
53 6 23,872 $855.03 290,467 $10,332.18 615 $2,974.81 81,375 $724.27
54 1 4,462 $159.83 54,296 $1,931.37 115 $556.07 15,211 $135.39
55 1 3,207 $114.87 39,024 $1,388.11 83 $399.66 10,933 $97.30
56 25 105,746 $3,787.57 1,286,699 $45,769.09 1,910 $13,177.71 360,471 $3,208.32
57 11 48,095 $1,722.64 585,208 $20,816.41 802 $5,993.41 163,947 $1,459.19
58 7 31,362 $1,123.32 381,611 $13,574.27 54 $3,908.27 106,909 $951.53
59 3 12,594 $451.07 153,237 $5,450.80 324 $1,569.38 42,930 $382.09
60 5 19,628 $703.02 238,827 $8,495.30 505 $2,445.94 66,908 $595.50
61 8 34,832 $1,247.59 423,828 $15,075.96 897 $4,340.63 118,736 $1,056.80
62 1 4,892 $175.20 59,520 $2,117.17 126 $609.57 16,675 $148.41
63 1 5,615 $201.11 68,322 $2,430.28 145 $699.72 19,141 $170.36
64 25 105,446 $3,776.84 1,283,053 $45,639.39 2,715 $13,140.37 359,449 $3,199.23
65 7 29,495 $1,056.43 358,886 $12,765.92 760 $3,675.53 100,543 $894.87
66 4 15,754 $564.28 191,695 $6,818.77 406 $1,963.24 53,704 $477.98
67 120 506,673 $18,147.81 6,165,107 $219,298.70 13,048 $63,139.88 1,727,166 $15,372.41
68 5 22,977 $822.98 279,580 $9,944.91 592 $2,863.31 78,325 $697.12
69 17 71,354 $2,555.72 868,220 $30,883.42 1,837 $8,891.87 243,234 $2,164.87
70 5 22,472 $804.88 273,430 $9,726.15 579 $2,800.33 76,602 $681.78
71 8 33,527 $1,200.84 407,945 $14,510.98 863 $4,177.96 114,286 $1,017.19
72 28 117,663 $4,214.41 1,431,702 $50,927.00 3,030 $14,662.77 401,094 $3,569.88
73 13 54,847 $1,964.47 667,363 $23,738.71 1,412 $6,834.79 186,963 $1,664.04
74 18 77,942 $2,791.70 948,384 $33,734.92 2,007 $9,712.87 265,692 $2,364.75
75 35 148,801 $5,329.69 1,810,582 $64,404.10 3,832 $18,543.05 507,238 $4,514.60
76 14 58,852 $2,107.95 716,105 $25,472.54 1,516 $7,333.98 200,618 $1,785.58
77 5 20,952 $750.46 254,945 $9,068.62 540 $2,611.01 71,423 $635.69
78 7 31,770 $1,137.92 386,571 $13,750.70 818 $3,959.06 108,299 $963.90
79 37 158,103 $5,662.88 1,923,774 $68,430.45 4,071 $19,702.31 538,949 $4,796.84
80 8 32,383 $1,159.90 394,036 $14,016.23 834 $4,035.51 110,390 $982.51
81 4 18,531 $663.73 225,480 $8,020.53 477 $2,309.25 63,169 $562.22
82 7 29,455 $1,055.01 358,404 $12,748.78 759 $3,670.59 100,408 $893.66
83 3 13,714 $491.21 166,871 $5,935.74 290 $1,709.00 46,749 $416.08
84 3 13,435 $481.22 163,480 $5,815.13 295 $1,674.27 45,799 $407.62
85 2 8,474 $303.50 103,105 $3,667.53 218 $1,055.95 28,885 $257.09
86 7 28,794 $1,031.31 350,354 $12,462.42 741 $3,588.15 98,152 $873.59
87 4 16,762 $600.39 203,962 $7,255.10 432 $2,088.87 57,140 $508.57
88 4 17,597 $630.30 214,122 $7,616.52 453 $2,192.93 59,987 $533.90
89 4 18,874 $676.04 229,661 $8,169.27 486 $2,352.07 64,340 $572.65
90 4 17,780 $636.85 216,349 $7,695.74 276 $2,215.74 60,611 $539.46
91 5 21,712 $777.68 264,190 $9,397.49 559 $2,705.70 74,013 $658.75
Table 5 (Continued)

30
Tract ID Number
Tract Size
(Acres)
Carbon Sequestered
Carbon Stored
Air Pollution Removed
Stormwater Mitigated
lbs/year $/year lbs/year $/year lbs/year $/year gal/year $/year
92 28 119,285 $4,272.49 1,451,434 $51,628.88 3,072 $14,864.85 406,622 $3,619.08
93 28 119,636 $4,285.06 1,455,706 $51,780.84 3,081 $14,908.60 407,819 $3,629.74
94 4 17,946 $642.77 218,359 $7,767.24 462 $2,236.32 61,174 $544.47
95 3 10,600 $379.65 128,973 $4,587.68 273 $1,320.87 36,132 $321.59
96 8 31,907 $1,142.82 388,234 $13,809.85 822 $3,976.09 108,765 $968.04
97 2 7,007 $250.98 85,261 $3,032.81 180 $873.20 23,886 $212.59
98 13 57,120 $2,045.89 695,023 $24,722.62 1,471 $7,118.07 194,712 $1,733.01
99 1 3,168 $113.46 38,543 $1,371.00 82 $394.73 10,798 $96.10
100 10 41,532 $1,487.56 505,350 $17,975.77 1,070 $5,175.53 141,575 $1,260.07
101 3 11,263 $403.41 137,044 $4,874.77 290 $1,403.53 38,393 $341.71
102 9 39,920 $1,429.83 485,735 $17,278.07 1,028 $4,974.65 136,080 $1,211.16
103 4 16,643 $596.12 202,513 $7,203.56 429 $2,074.03 56,734 $504.96
104 63 266,976 $9,562.42 3,248,510 $115,552.60 6,875 $33,269.58 910,076 $8,100.01
105 3 11,261 $403.35 137,023 $4,874.04 290 $1,403.32 38,387 $341.66
106 2 8,235 $294.96 100,203 $3,564.30 212 $1,026.22 28,072 $249.85
107 2 10,291 $368.59 125,215 $4,454.01 265 $1,282.39 35,079 $312.22
108 3 13,013 $466.11 158,344 $5,632.46 335 $1,621.68 44,360 $394.82
109 21 88,044 $3,153.53 1,071,305 $38,107.32 2,267 $10,971.76 300,128 $2,671.25
110 3 14,405 $515.94 175,272 $6,234.60 371 $1,795.05 49,103 $437.03
111 426 1,803,462 $64,595.67 21,944,198 $780,575.80 46,205 $224,741.28 6,147,706 $54,716.84
112 146 618,444 $22,151.16 7,525,111 $267,675.30 15,926 $77,068.35 2,108,173 $18,763.51
113 25 107,343 $3,844.78 1,306,134 $46,460.43 2,764 $13,376.76 365,916 $3,256.78
114 15 64,232 $2,300.63 781,561 $27,800.87 1,654 $8,004.35 218,956 $1,948.79
115 11 47,363 $1,696.43 576,306 $20,499.75 1,220 $5,902.23 161,453 $1,436.99
116 3 11,721 $419.82 142,621 $5,073.15 302 $1,460.65 39,955 $355.62
117 6 23,522 $842.49 286,209 $10,180.72 606 $2,931.21 80,182 $713.65
118 23 99,389 $3,559.88 1,209,348 $43,017.65 2,559 $12,385.52 338,801 $3,015.45
119 8 31,830 $1,140.06 387,298 $13,776.57 820 $3,966.51 108,502 $965.71
120 44 185,117 $6,630.44 2,252,468 $80,122.39 4,767 $23,068.62 631,033 $5,616.42
121 11 47,856 $1,714.07 582,298 $20,712.89 1,232 $5,963.60 163,132 $1,451.93
122 16 69,074 $2,474.06 840,479 $29,896.65 1,779 $8,607.76 235,462 $2,095.70
123 8 35,809 $1,282.60 435,721 $15,498.99 922 $4,462.43 122,068 $1,086.45
124 37 158,711 $5,684.64 1,931,166 $68,693.40 4,087 $19,778.02 541,020 $4,815.27
125 5 21,235 $760.59 258,385 $9,191.01 547 $2,646.25 72,387 $644.27
126 7 27,804 $995.89 338,319 $12,034.34 716 $3,464.89 94,781 $843.58
127 33 138,901 $4,975.11 1,690,126 $60,119.39 3,577 $17,309.41 473,492 $4,214.25
128 3 12,805 $458.65 155,813 $5,542.40 330 $1,595.75 43,651 $388.51
129 3 12,897 $461.94 156,927 $5,582.05 332 $1,607.17 43,963 $391.29
130 23 95,694 $3,427.54 1,164,391 $41,418.49 2,464 $11,925.10 326,206 $2,903.36
131 19 79,149 $2,834.94 963,075 $34,257.50 2,038 $9,863.33 269,807 $2,401.38
132 20 84,686 $3,033.25 1,030,443 $36,653.82 2,181 $10,553.27 288,680 $2,569.36
133 14 58,224 $2,085.46 708,464 $25,200.75 1,499 $7,255.73 198,478 $1,766.52
134 7 28,525 $1,021.68 347,082 $12,346.02 735 $3,554.63 97,236 $865.43
135 45 192,610 $6,898.83 2,343,645 $83,365.68 4,960 $24,002.42 656,576 $5,843.77
136 45 189,405 $6,784.02 2,304,643 $81,978.32 4,875 $23,602.98 645,650 $5,746.52
Table 5(Continued)

31
Tract ID Number
Tract Size
(Acres)
Carbon Sequestered
Carbon Stored
Air Pollution Removed
Stormwater Mitigated
lbs/year $/year lbs/year $/year lbs/year $/year gal/year $/year
137 2 10,142 $363.27 123,408 $4,389.74 261 $1,263.88 34,573 $307.71
138 4 18,633 $667.38 226,720 $8,064.64 480 $2,321.95 63,516 $565.32
139 1 5,593 $200.33 68,056 $2,420.82 144 $696.99 19,066 $169.69
140 41 173,668 $6,220.35 2,113,155 $75,166.90 4,472 $21,641.85 592,004 $5,269.05
141 30 127,074 $4,551.50 1,546,219 $55,000.46 2,209 $15,835.58 433,176 $3,855.42
142 30 126,004 $4,513.16 1,533,194 $54,537.14 3,245 $15,702.19 429,527 $3,822.95
143 8 33,047 $1,183.67 402,112 $14,303.51 851 $4,118.23 112,652 $1,002.65
144 7 30,098 $1,078.04 366,229 $13,027.10 775 $3,750.73 102,600 $913.17
145 2 8,793 $314.95 106,994 $3,805.88 226 $1,095.78 29,975 $266.78
146 33 138,042 $4,944.32 1,679,665 $59,747.26 3,555 $17,202.27 470,561 $4,188.17
147 5 22,286 $798.22 271,167 $9,645.66 574 $2,777.15 75,968 $676.14
148 4 17,040 $610.32 207,337 $7,375.16 439 $2,123.44 58,086 $516.98
149 20 83,949 $3,006.85 1,021,475 $36,334.82 2,162 $10,461.42 286,168 $2,547.00
150 8 34,174 $1,224.02 415,819 $14,791.07 880 $4,258.60 116,492 $1,036.83
151 15 62,116 $2,224.85 755,817 $26,885.13 1,600 $7,740.69 211,744 $1,884.60
152 43 182,748 $6,545.60 2,223,647 $79,097.22 4,706 $22,773.46 622,959 $5,544.56
153 1 5,854 $209.66 71,226 $2,533.56 151 $729.46 19,954 $177.60
154 13 54,972 $1,968.97 668,892 $23,793.11 1,416 $6,850.45 187,391 $1,667.85
155 10 44,367 $1,589.12 539,851 $19,202.99 1,143 $5,528.87 151,240 $1,346.09
156 32 134,281 $4,809.63 1,633,908 $58,119.64 3,458 $16,733.65 457,742 $4,074.07
157 15 63,936 $2,290.03 777,961 $27,672.79 1,646 $7,967.48 217,947 $1,939.81
158 10 41,349 $1,481.01 503,123 $17,896.57 0 $5,152.73 140,951 $1,254.51
159 3 10,693 $383.01 130,116 $4,628.34 275 $1,332.58 36,452 $324.44
160 2 6,964 $249.43 84,737 $3,014.18 0 $867.83 23,739 $211.29
161 3 12,112 $433.83 147,378 $5,242.39 0 $1,509.37 41,288 $367.48
162 8 33,615 $1,204.02 409,024 $14,549.38 0 $4,189.02 114,589 $1,019.88
163 20 85,861 $3,075.34 1,044,744 $37,162.52 2,211 $10,699.73 292,687 $2,605.02
164 7 30,300 $1,085.29 368,690 $13,114.66 780 $3,775.94 103,289 $919.31
165 46 196,812 $7,049.34 2,394,776 $85,184.43 5,068 $24,526.07 670,901 $5,971.26
166 17 71,458 $2,559.46 869,491 $30,928.61 1,840 $8,904.88 243,589 $2,168.04
167 1 4,787 $171.45 58,243 $2,071.75 123 $596.49 16,317 $145.23
168 1 4,347 $155.69 52,890 $1,881.35 112 $541.67 14,817 $131.88
169 6 25,995 $931.06 316,297 $11,250.97 669 $3,239.35 88,611 $788.67
170 5 21,455 $768.46 261,057 $9,286.05 553 $2,673.61 73,136 $650.93
171 97 413,004 $14,792.79 5,025,351 $178,756.50 10,636 $51,467.08 1,407,861 $12,530.48
172 9 36,262 $1,298.81 441,228 $15,694.90 934 $4,518.83 123,611 $1,100.18
173 3 11,443 $409.87 139,238 $4,952.82 295 $1,426.00 39,008 $347.18
174 1 5,074 $181.75 61,742 $2,196.24 131 $632.34 17,297 $153.95
175 4 14,983 $536.64 182,306 $6,484.80 386 $1,867.09 51,073 $454.57
176 4 17,216 $616.63 209,478 $7,451.33 443 $2,145.37 58,686 $522.32
177 2 8,898 $318.69 108,264 $3,851.04 229 $1,108.78 30,330 $269.95
178 1 4,030 $144.36 49,041 $1,744.44 104 $502.25 13,739 $122.28
179 41 172,030 $6,161.70 2,093,229 $74,458.14 4,430 $21,437.79 586,422 $5,219.37
180 6 24,618 $881.76 299,547 $10,655.17 634 $3,067.81 83,919 $746.91
181 1 4,578 $163.98 55,706 $1,981.51 118 $570.51 15,606 $138.90
Table 5(Continued)

32
Tract ID Number
Tract Size
(Acres)
Carbon Sequestered
Carbon Stored
Air Pollution Removed
Stormwater Mitigated
lbs/year $/year lbs/year $/year lbs/year $/year gal/year $/year
182 1 4,065 $145.59 49,459 $1,759.31 105 $506.54 13,856 $123.32
183 3 11,235 $402.40 136,702 $4,862.61 289 $1,400.03 38,297 $340.86
184 8 35,812 $1,282.70 435,754 $15,500.19 922 $4,462.77 122,077 $1,086.53
185 1 5,151 $184.49 62,674 $2,229.38 133 $641.88 17,558 $156.28
186 1 5,907 $211.58 71,876 $2,556.68 152 $736.11 20,136 $179.22
187 8 35,976 $1,288.59 437,755 $15,571.35 926 $4,483.26 122,638 $1,091.52
188 1 4,760 $170.50 57,921 $2,060.32 123 $593.20 16,227 $144.42
189 1 6,003 $215.03 73,048 $2,598.37 155 $748.12 20,464 $182.14
190 1 5,724 $205.01 69,644 $2,477.30 147 $713.26 19,511 $173.65
191 2 7,861 $281.58 95,657 $3,402.62 202 $979.67 26,799 $238.52
192 6 25,298 $906.10 307,816 $10,949.30 651 $3,152.49 86,235 $767.52
193 2 6,769 $242.44 82,361 $2,929.68 174 $843.50 23,074 $205.36
194 2 9,002 $322.42 109,531 $3,896.12 232 $1,121.76 30,685 $273.11
195 8 33,834 $1,211.87 411,692 $14,644.27 871 $4,216.34 115,336 $1,026.53
196 3 11,830 $423.72 143,943 $5,120.20 305 $1,474.19 40,326 $358.92
197 1 5,584 $199.99 67,941 $2,416.74 144 $695.82 19,034 $169.41
198 3 13,487 $483.09 164,113 $5,837.64 347 $1,680.76 45,976 $409.21
199 5 19,627 $702.98 238,815 $8,494.87 505 $2,445.82 66,904 $595.47
200 3 14,171 $507.57 172,430 $6,133.51 365 $1,765.94 48,307 $429.95
201 10 44,385 $1,589.77 540,072 $19,210.88 1,143 $5,531.14 151,302 $1,346.65
202 5 21,971 $786.96 267,344 $9,509.67 566 $2,738.00 74,897 $666.61
203 6 23,686 $848.37 288,206 $10,251.76 610 $2,951.66 80,741 $718.63
204 1 6,230 $223.15 75,809 $2,696.60 160 $776.40 21,238 $189.03
205 1 4,637 $166.10 56,427 $2,007.16 119 $577.90 15,808 $140.70
206 2 7,576 $271.37 92,188 $3,279.22 195 $944.14 25,827 $229.87
207 2 9,386 $336.17 114,203 $4,062.31 242 $1,169.61 31,994 $284.76
208 1 4,915 $176.03 59,799 $2,127.12 127 $612.44 16,753 $149.11
209 2 9,333 $334.28 113,561 $4,039.49 240 $1,163.04 31,814 $283.16
210 2 7,126 $255.25 86,712 $3,084.42 184 $888.06 24,292 $216.21
211 2 9,979 $357.44 121,427 $4,319.27 257 $1,243.59 34,018 $302.77
212 2 7,459 $267.15 90,757 $3,228.31 192 $929.49 25,426 $226.30
213 2 6,986 $250.23 85,008 $3,023.82 180 $870.61 23,815 $211.96
214 0 1,923 $68.88 23,401 $832.40 50 $239.66 6,556 $58.35
215 129 547,216 $19,599.96 6,658,424 $236,846.40 14,092 $68,192.18 1,865,369 $16,602.47
216 17 71,899 $2,575.24 874,852 $31,119.32 1,852 $8,959.79 245,091 $2,181.40
217 10 43,169 $1,546.20 525,269 $18,684.32 1,112 $5,379.54 147,155 $1,309.73
218 12 52,322 $1,874.05 636,644 $22,646.04 1,347 $6,520.19 178,357 $1,587.44
219 0 820 $29.38 9,980 $355.01 21 $102.21 2,796 $24.89
220 2 8,675 $310.73 105,559 $3,754.85 223 $1,081.09 29,573 $263.21
221 2 6,410 $229.59 77,994 $2,774.33 165 $798.78 21,850 $194.47
222 6 27,028 $968.09 328,875 $11,698.39 408 $3,368.17 92,135 $820.03
223 11 47,467 $1,700.16 577,570 $20,544.72 172 $5,915.18 161,807 $1,440.14
224 22 94,999 $3,402.62 1,155,924 $41,117.32 2,133 $11,838.39 323,834 $2,882.24
225 8 32,143 $1,151.27 391,105 $13,911.96 828 $4,005.49 109,569 $975.20
226 3 10,753 $385.14 130,839 $4,654.06 277 $1,339.98 36,655 $326.24
Table 5(Continued)

33
Tract ID Number
Tract Size
(Acres)
Carbon Sequestered
Carbon Stored
Air Pollution Removed
Stormwater Mitigated
lbs/year $/year lbs/year $/year lbs/year $/year gal/year $/year
227 9 40,061 $1,434.87 487,450 $17,339.05 1,032 $4,992.21 136,560 $1,215.43
228 3 11,708 $419.37 142,465 $5,067.63 302 $1,459.06 39,912 $355.23
229 6 23,959 $858.16 291,532 $10,370.05 605 $2,985.72 81,673 $726.92
230 1 4,057 $145.30 49,362 $1,755.85 104 $505.54 13,829 $123.08
231 3 11,798 $422.59 143,560 $5,106.58 304 $1,470.27 40,219 $357.96
232 1 3,577 $128.11 43,520 $1,548.06 92 $445.71 12,192 $108.52
233 7 31,213 $1,117.97 379,794 $13,509.63 804 $3,889.66 106,400 $947.00
234 1 5,798 $207.66 70,546 $2,509.37 149 $722.49 19,763 $175.90
235 416 1,762,081 $63,113.47 21,440,673 $762,665.00 45,377 $219,584.43 6,006,642 $53,461.32
236 18 77,832 $2,787.74 947,039 $33,687.08 2,004 $9,699.09 265,315 $2,361.40
237 17 70,336 $2,519.28 855,839 $30,443.00 1,811 $8,765.07 239,765 $2,133.99
238 2 9,505 $340.45 115,655 $4,113.96 245 $1,184.48 32,401 $288.38
239 1 5,127 $183.63 62,381 $2,218.96 132 $638.88 17,476 $155.54
Total 3,591 15,213,667 544,917 185,117,099 6,584,790 382,715 1,895,875 51,860,881 461,581
Table 5(Continued)

34
Tract ID Number
Tract Size
Viable Interior Index
Overlap w/
floodplain
Overlap w/
Riparian Areas
Overlap w/ Rec. Areas
Overlap w/
Schools
Ecological Quality Score
Connectivity Potential
for Citizen Interaction Priority
Ranking Score
(1-100)
Priority Rank
(1-239)
(Acres) (0-1) (% of tract) (% of tract)
(% of tract)
(% of tract)
(5-15) (acres of
forest within 1/2 mile)
(avg. housing
density of CB's in tract)
1 2 0.74 0% 0% 92% 0% N/A 4 0.0 17 202
2 4 0.85 0% 26% 0% 0% N/A 35 0.0 19 191
3 4 0.50 0% 0% 0% 0% 11 63 0.0 27 165
4 3 0.23 0% 0% 0% 0% 11 66 0.0 22 180
5 4 0.88 0% 0% 0% 0% 7 31 0.1 21 183
6 1 0.85 0% 0% 0% 0% N/A 24 0.0 14 215
7 22 0.70 0% 19% 3% 0% 8 115 0.0 28 163
8 20 0.69 0% 21% 5% 0% 8 119 0.4 28 162
9 14 0.74 0% 0% 0% 0% 7 70 0.3 20 188
10 1 0.36 0% 0% 100% 18% N/A 0 0.0 13 224
11 8 0.73 0% 54% 100% 0% 10 64 0.0 44 90
12 26 0.81 0% 5% 99% 0% 10 60 0.1 38 123
13 3 0.88 0% 0% 100% 0% N/A 76 0.0 22 179
14 8 0.85 0% 0% 20% 0% 13 124 0.0 43 96
15 3 0.67 0% 87% 0% 0% N/A 109 0.0 29 156
16 4 0.58 0% 0% 40% 0% 10 109 0.1 30 155
17 4 0.74 0% 0% 6% 0% 12 115 0.2 37 125
18 47 0.90 27% 31% 5% 0% 11 142 3.7 52 57
19 6 0.29 7% 13% 33% 0% 6 173 0.3 18 194
20 15 0.81 29% 56% 97% 0% 13 112 0.8 64 20
21 5 0.81 0% 44% 0% 0% 11 47 0.0 41 107
22 3 0.66 0% 15% 0% 0% 10 26 0.0 29 161
23 1 0.78 0% 0% 100% 0% N/A 52 0.2 20 189
24 2 0.87 0% 0% 100% 0% N/A 51 0.3 21 182
25 14 0.66 0% 17% 91% 0% 13 35 1.7 45 89
26 15 0.88 0% 28% 83% 0% 11 60 1.9 45 87
27 5 0.89 0% 62% 92% 0% 11 75 0.0 52 53
28 5 0.81 0% 85% 100% 0% 8 62 12.6 47 78
29 9 0.90 55% 37% 0% 0% 14 181 0.6 68 15
30 6 0.93 0% 0% 0% 0% 14 172 0.3 48 75
31 5 0.75 12% 29% 53% 0% 14 167 0.3 56 37
32 3 0.79 0% 1% 0% 0% 12 156 0.3 39 116
33 4 0.76 0% 60% 100% 0% 11 85 0.1 50 61
34 4 0.72 0% 0% 0% 0% 11 117 0.1 33 140
35 5 0.78 0% 59% 0% 0% 13 25 0.2 48 74
36 4 0.74 0% 71% 0% 0% 13 49 0.1 50 60
37 9 0.55 3% 36% 0% 0% 13 97 0.3 43 98
38 4 0.69 0% 0% 0% 0% 13 103 0.1 38 121
39 18 0.89 0% 34% 63% 0% 14 181 0.6 58 32
40 11 0.84 0% 0% 0% 0% 14 240 0.6 49 73
41 13 0.59 10% 18% 47% 0% 8 281 0.6 36 129
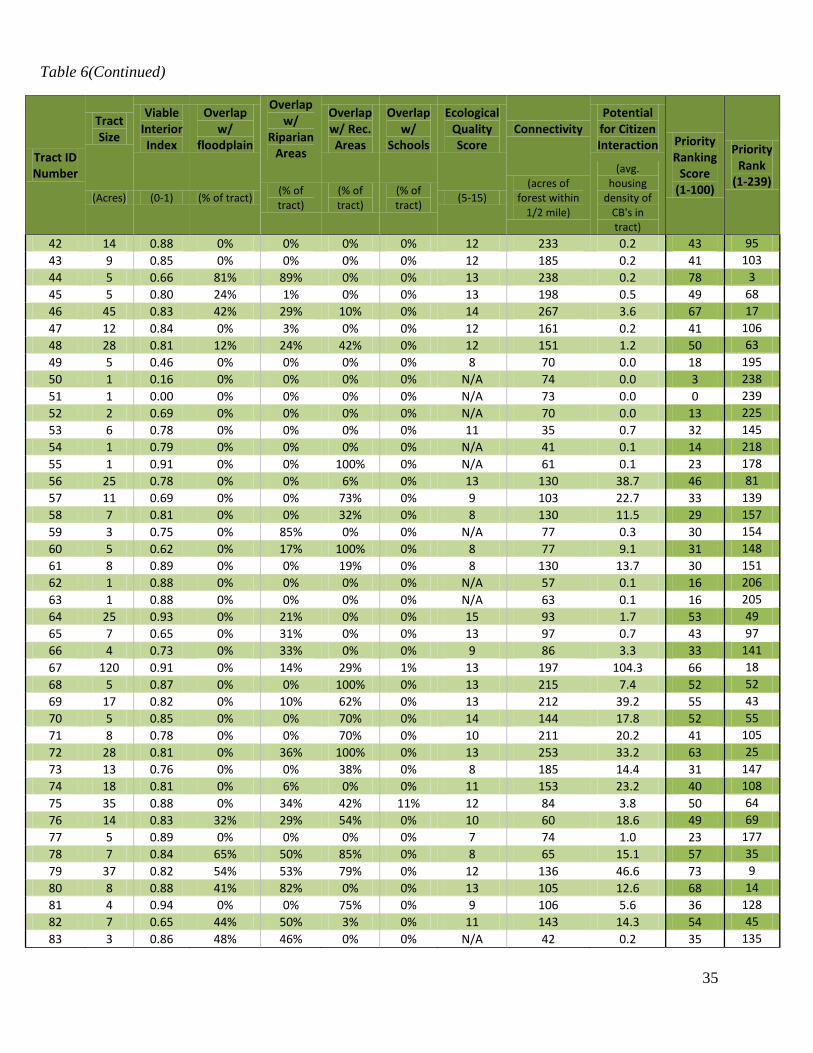
Table 6: Complete results of each factor in the CPRM for each forest tract
35
Tract ID Number
Tract Size
Viable Interior Index
Overlap w/
floodplain
Overlap w/
Riparian Areas
Overlap w/ Rec. Areas
Overlap w/
Schools
Ecological Quality Score
Connectivity Potential
for Citizen Interaction Priority
Ranking Score
(1-100)
Priority Rank
(1-239) (Acres) (0-1) (% of tract)
(% of tract)
(% of tract)
(% of tract)
(5-15) (acres of
forest within 1/2 mile)
(avg. housing
density of CB's in tract)
42 14 0.88 0% 0% 0% 0% 12 233 0.2 43 95
43 9 0.85 0% 0% 0% 0% 12 185 0.2 41 103
44 5 0.66 81% 89% 0% 0% 13 238 0.2 78 3
45 5 0.80 24% 1% 0% 0% 13 198 0.5 49 68
46 45 0.83 42% 29% 10% 0% 14 267 3.6 67 17
47 12 0.84 0% 3% 0% 0% 12 161 0.2 41 106
48 28 0.81 12% 24% 42% 0% 12 151 1.2 50 63
49 5 0.46 0% 0% 0% 0% 8 70 0.0 18 195
50 1 0.16 0% 0% 0% 0% N/A 74 0.0 3 238
51 1 0.00 0% 0% 0% 0% N/A 73 0.0 0 239
52 2 0.69 0% 0% 0% 0% N/A 70 0.0 13 225
53 6 0.78 0% 0% 0% 0% 11 35 0.7 32 145
54 1 0.79 0% 0% 0% 0% N/A 41 0.1 14 218
55 1 0.91 0% 0% 100% 0% N/A 61 0.1 23 178
56 25 0.78 0% 0% 6% 0% 13 130 38.7 46 81
57 11 0.69 0% 0% 73% 0% 9 103 22.7 33 139
58 7 0.81 0% 0% 32% 0% 8 130 11.5 29 157
59 3 0.75 0% 85% 0% 0% N/A 77 0.3 30 154
60 5 0.62 0% 17% 100% 0% 8 77 9.1 31 148
61 8 0.89 0% 0% 19% 0% 8 130 13.7 30 151
62 1 0.88 0% 0% 0% 0% N/A 57 0.1 16 206
63 1 0.88 0% 0% 0% 0% N/A 63 0.1 16 205
64 25 0.93 0% 21% 0% 0% 15 93 1.7 53 49
65 7 0.65 0% 31% 0% 0% 13 97 0.7 43 97
66 4 0.73 0% 33% 0% 0% 9 86 3.3 33 141
67 120 0.91 0% 14% 29% 1% 13 197 104.3 66 18
68 5 0.87 0% 0% 100% 0% 13 215 7.4 52 52
69 17 0.82 0% 10% 62% 0% 13 212 39.2 55 43
70 5 0.85 0% 0% 70% 0% 14 144 17.8 52 55
71 8 0.78 0% 0% 70% 0% 10 211 20.2 41 105
72 28 0.81 0% 36% 100% 0% 13 253 33.2 63 25
73 13 0.76 0% 0% 38% 0% 8 185 14.4 31 147
74 18 0.81 0% 6% 0% 0% 11 153 23.2 40 108
75 35 0.88 0% 34% 42% 11% 12 84 3.8 50 64
76 14 0.83 32% 29% 54% 0% 10 60 18.6 49 69
77 5 0.89 0% 0% 0% 0% 7 74 1.0 23 177
78 7 0.84 65% 50% 85% 0% 8 65 15.1 57 35
79 37 0.82 54% 53% 79% 0% 12 136 46.6 73 9
80 8 0.88 41% 82% 0% 0% 13 105 12.6 68 14
81 4 0.94 0% 0% 75% 0% 9 106 5.6 36 128
82 7 0.65 44% 50% 3% 0% 11 143 14.3 54 45
83 3 0.86 48% 46% 0% 0% N/A 42 0.2 35 135
Table 6(Continued)

36
Tract ID Number
Tract Size
Viable Interior Index
Overlap w/
floodplain
Overlap w/
Riparian Areas
Overlap w/ Rec. Areas
Overlap w/
Schools
Ecological Quality Score
Connectivity Potential
for Citizen Interaction Priority
Ranking Score
(1-100)
Priority Rank
(1-239) (Acres) (0-1) (% of tract)
(% of tract)
(% of tract)
(% of tract)
(5-15) (acres of
forest within 1/2 mile)
(avg. housing
density of CB's in tract)
84 3.1 0.83 48% 43% 0% 1% N/A 58 0.1 36 130
85 2 0.86 0% 0% 0% 0% N/A 49 0.0 15 210
86 7 0.78 54% 0% 58% 0% 7 92 17.0 40 110
87 4 0.87 20% 29% 0% 0% 13 44 0.3 50 62
88 4 0.77 0% 0% 71% 0% 9 93 2.9 32 142
89 4 0.84 59% 57% 100% 0% 10 104 2.3 63 24
90 4 0.83 20% 33% 6% 13% 8 67 0.0 37 124
91 5 0.71 0% 17% 75% 0% 10 73 0.0 36 127
92 28 0.75 46% 34% 32% 0% 13 104 13.5 61 27
93 28 0.82 64% 52% 53% 0% 15 275 24.7 84 2
94 4 0.68 71% 2% 0% 0% N/A 88 1.3 31 149
95 3 0.68 56% 0% 33% 0% N/A 95 0.7 29 159
96 8 0.82 15% 9% 7% 0% 15 91 2.5 52 51
97 2 0.55 10% 0% 1% 0% N/A 94 0.6 13 220
98 13 0.80 74% 46% 71% 0% 14 128 4.5 75 6
99 1 0.37 0% 0% 0% 0% N/A 50 0.0 6 234
100 10 0.89 0% 0% 0% 0% 11 80 0.0 35 134
101 3 0.28 0% 0% 5% 0% N/A 80 0.1 6 236
102 9 0.71 0% 0% 17% 0% 10 94 0.0 30 152
103 4 0.74 0% 0% 0% 0% 13 95 0.0 39 115
104 63 0.85 33% 11% 0% 0% 13 38 0.0 51 58
105 3 0.68 0% 0% 0% 0% N/A 96 0.0 13 219
106 2 0.74 0% 0% 15% 0% N/A 86 0.0 15 211
107 2 0.50 0% 0% 0% 0% N/A 64 0.0 9 231
108 3 0.44 0% 0% 3% 0% 11 71 0.0 27 167
109 21 0.94 0% 0% 0% 0% 12 61 0.1 39 113
110 3 0.73 0% 0% 0% 0% 13 102 0.0 39 114
111 426 0.99 64% 24% 13% 0% 15 428 34.4 100 1
112 146 0.93 36% 15% 47% 0% 14 472 0.0 77 5
113 25 0.73 1% 27% 47% 0% 12 416 0.0 55 42
114 15 0.86 0% 0% 0% 0% 13 207 0.0 45 85
115 11 0.95 0% 0% 0% 0% 13 217 0.0 47 79
116 3 0.90 0% 0% 0% 0% N/A 200 0.0 21 185
117 6 0.88 0% 0% 0% 0% 14 78 0.0 44 93
118 23 0.90 0% 0% 7% 0% 13 183 0.0 46 83
119 8 0.90 0% 0% 0% 0% 13 164 0.3 44 92
120 44 0.79 0% 0% 3% 0% 14 191 17.1 49 67
121 11 0.84 70% 31% 0% 0% 15 201 0.0 73 8
122 16 0.78 85% 49% 43% 0% 13 86 0.0 72 10
123 8 0.84 0% 0% 52% 0% 8 153 8.5 32 144
124 37 0.88 1% 0% 87% 0% 14 47 7.2 51 59
125 5 0.93 0% 0% 0% 0% 13 63 0.8 41 101
Table 6(Continued)

37
Tract ID Number
Tract Size
Viable Interior Index
Overlap w/
floodplain
Overlap w/
Riparian Areas
Overlap w/ Rec. Areas
Overlap w/
Schools
Ecological Quality Score
Connectivity Potential
for Citizen Interaction Priority
Ranking Score
(1-100)
Priority Rank
(1-239) (Acres) (0-1) (% of tract)
(% of tract)
(% of tract)
(% of tract)
(5-15) (acres of
forest within 1/2 mile)
(avg. housing
density of CB's in tract)
126 7 0.71 0% 0% 20% 0% 13 49 1.0 38 120
127 33 0.77 61% 71% 57% 0% 9 148 10.8 62 26
128 3 0.85 0% 0% 83% 0% 8 84 0.7 30 150
129 3 0.68 0% 0% 100% 0% 13 46 0.4 42 99
130 23 0.79 0% 78% 100% 0% 13 136 25.0 65 19
131 19 0.82 52% 60% 5% 0% 10 135 7.7 58 33
132 20 0.70 0% 29% 0% 0% 10 95 5.9 35 133
133 14 0.85 0% 50% 100% 0% 13 67 12.6 57 34
134 7 0.90 0% 38% 0% 0% 13 59 2.0 48 76
135 45 0.88 23% 23% 1% 0% 12 169 20.5 54 44
136 45 0.77 17% 28% 68% 0% 10 221 55.4 56 39
137 2 0.87 100% 38% 0% 0% N/A 144 0.0 50 65
138 4 0.87 0% 0% 0% 0% 9 156 1.5 31 146
139 1 0.95 0% 0% 0% 0% N/A 172 0.5 21 186
140 41 0.88 41% 35% 86% 6% 14 203 13.8 73 7
141 30 0.85 12% 32% 25% 0% 11 136 38.8 52 56
142 30 0.83 67% 58% 100% 0% 12 110 49.1 77 4
143 8 0.74 14% 0% 100% 0% 12 76 11.4 46 82
144 7 0.75 0% 0% 0% 0% 9 87 4.2 27 166
145 2 0.72 0% 0% 56% 0% N/A 196 2.5 21 184
146 33 0.80 0% 40% 0% 0% 8 147 52.0 41 104
147 5 0.74 0% 63% 4% 0% 11 187 12.3 49 72
148 4 0.59 0% 0% 0% 0% 8 191 8.6 25 171
149 20 0.77 0% 0% 0% 0% 12 137 25.1 41 102
150 8 0.78 0% 0% 0% 0% 10 124 2.3 32 143
151 15 0.68 0% 0% 0% 0% 7 140 18.1 23 175
152 43 0.86 11% 23% 51% 0% 12 215 2.2 53 47
153 1 0.71 0% 0% 0% 0% N/A 89 0.1 14 217
154 13 0.79 0% 49% 58% 0% 12 129 18.1 53 50
155 10 0.56 0% 8% 46% 0% 7 129 19.1 25 170
156 32 0.87 0% 27% 32% 0% 10 119 25.2 44 94
157 15 0.78 0% 62% 96% 12% 10 65 10.4 50 66
158 10 0.79 13% 41% 0% 0% 9 55 20.3 40 111
159 3 0.78 0% 0% 0% 0% N/A 110 3.9 16 204
160 2 0.51 45% 86% 0% 44% N/A 30 1.0 40 109
161 3 0.66 39% 80% 0% 0% N/A 33 0.4 35 136
162 8 0.67 32% 56% 57% 0% 9 82 22.1 49 71
163 20 0.67 1% 3% 11% 0% 11 175 22.4 39 117
164 7 0.47 0% 0% 0% 0% 10 106 0.6 25 168
165 46 0.90 7% 8% 25% 0% 13 207 3.2 52 54
166 17 0.93 6% 41% 0% 0% 13 146 0.5 53 46
167 1 0.82 85% 14% 96% 0% N/A 153 0.0 47 80
Table 6(Continued)

38
Tract ID Number
Tract Size
Viable Interior Index
Overlap w/
floodplain
Overlap w/
Riparian Areas
Overlap w/ Rec. Areas
Overlap w/
Schools
Ecological Quality Score
Connectivity Potential
for Citizen Interaction Priority
Ranking Score
(1-100)
Priority Rank
(1-239) (Acres) (0-1) (% of tract)
(% of tract)
(% of tract)
(% of tract)
(5-15) (acres of
forest within 1/2 mile)
(avg. housing
density of CB's in tract)
168 1 0.67 0% 67% 0% 0% N/A 87 0.0 25 169
169 6 0.88 66% 66% 100% 0% 10 177 1.1 69 12
170 5 0.61 0% 0% 52% 0% 7 156 1.1 23 174
171 97 0.95 25% 20% 98% 0% 14 214 13.2 70 11
172 9 0.91 2% 0% 100% 0% 10 151 1.8 42 100
173 3 0.89 0% 0% 0% 98% N/A 80 0.8 29 160
174 1 0.90 0% 0% 0% 0% N/A 69 0.1 17 201
175 4 0.68 25% 0% 0% 0% 12 207 0.3 44 91
176 4 0.72 60% 71% 0% 0% 9 141 0.1 55 41
177 2 0.73 65% 83% 0% 0% N/A 94 0.1 45 86
178 1 0.45 7% 0% 60% 0% N/A 185 0.0 17 200
179 41 0.88 0% 24% 49% 0% 13 264 1.2 55 40
180 6 0.48 0% 16% 40% 0% 6 223 0.1 22 181
181 1 0.78 0% 0% 0% 0% N/A 31 0.0 13 221
182 1 0.61 0% 0% 0% 0% N/A 29 0.0 10 229
183 3 0.23 0% 0% 0% 0% N/A 35 0.1 3 237
184 8 0.66 0% 0% 0% 0% 8 35 0.0 20 187
185 1 0.62 0% 0% 0% 0% N/A 11 0.0 9 230
186 1 0.75 0% 0% 0% 0% N/A 39 0.0 13 223
187 8 0.79 32% 63% 0% 0% 13 57 0.5 58 31
188 1 0.66 0% 0% 0% 0% N/A 180 0.0 16 207
189 1 0.77 0% 0% 0% 0% N/A 177 0.0 17 197
190 1 0.79 0% 0% 0% 0% N/A 131 0.1 16 203
191 2 0.61 0% 100% 100% 0% N/A 64 1.3 35 132
192 6 0.63 0% 82% 65% 0% 8 54 1.8 39 112
193 2 0.55 0% 28% 0% 0% N/A 57 0.5 15 212
194 2 0.38 0% 0% 28% 0% N/A 117 0.0 10 228
195 8 0.74 60% 89% 10% 0% 10 149 11.6 64 21
196 3 0.90 46% 63% 62% 0% N/A 107 2.3 45 88
197 1 0.86 0% 86% 75% 0% N/A 76 0.3 36 126
198 3 0.77 100% 93% 100% 0% 7 105 1.2 69 13
199 5 0.50 92% 81% 100% 0% 8 131 0.5 64 22
200 3 0.61 0% 0% 0% 0% 5 147 3.4 14 216
201 10 0.54 7% 11% 23% 0% 6 216 4.3 23 173
202 5 0.67 0% 0% 2% 0% 12 99 1.4 35 137
203 6 0.52 29% 64% 99% 0% 12 88 1.6 56 36
204 1 0.68 0% 0% 0% 0% N/A 77 2.1 13 222
205 1 0.81 0% 90% 0% 0% N/A 31 1.8 30 153
206 2 0.60 0% 66% 19% 0% N/A 41 0.1 23 176
207 2 0.62 0% 99% 0% 0% N/A 5 0.0 27 164
208 1 0.83 0% 0% 98% 0% N/A 22 0.0 20 190
209 2 0.67 0% 98% 0% 0% N/A 36 0.0 29 158
Table 6(Continued)

39
Tract ID Number
Tract Size
Viable Interior Index
Overlap w/
floodplain
Overlap w/
Riparian Areas
Overlap w/ Rec. Areas
Overlap w/
Schools
Ecological Quality Score
Connectivity Potential
for Citizen Interaction Priority
Ranking Score
(1-100)
Priority Rank
(1-239) (Acres) (0-1) (% of tract)
(% of tract)
(% of tract)
(% of tract)
(5-15) (acres of
forest within 1/2 mile)
(avg. housing
density of CB's in tract)
210 2 0.79 0% 0% 0% 0% N/A 160 0.0 17 199
211 2 0.62 0% 0% 0% 0% N/A 80 0.1 12 226
212 2 0.73 0% 0% 55% 0% N/A 100 0.6 18 196
213 2 0.66 40% 58% 97% 0% N/A 76 0.5 39 118
214 0 0.00 77% 20% 11% 0% N/A 92 0.1 24 172
215 129 0.95 19% 9% 96% 0% 14 104 8.8 64 23
216 17 0.85 14% 12% 99% 0% 13 182 1.2 56 38
217 10 0.91 0% 0% 0% 0% 12 74 0.6 39 119
218 12 0.69 0% 0% 0% 0% 12 67 0.7 34 138
219 0 0.38 0% 0% 0% 0% N/A 38 0.0 6 235
220 2 0.52 0% 0% 0% 0% N/A 39 0.1 9 232
221 2 0.67 0% 0% 0% 0% N/A 54 0.1 12 227
222 6 0.92 4% 51% 56% 0% 12 106 0.0 53 48
223 11 0.94 0% 0% 66% 0% 13 124 0.1 48 77
224 22 0.77 0% 0% 85% 0% 13 217 0.2 49 70
225 8 0.89 0% 0% 5% 0% N/A 86 0.1 17 198
226 3 0.95 0% 0% 0% 0% N/A 103 0.0 19 192
227 9 0.85 0% 47% 80% 0% 14 136 0.1 59 29
228 3 0.84 0% 0% 4% 0% N/A 138 0.0 18 193
229 6 0.94 0% 0% 97% 0% 9 139 0.0 38 122
230 1 0.66 0% 0% 0% 0% N/A 143 0.0 14 214
231 3 0.34 0% 31% 34% 0% N/A 95 0.0 15 213
232 1 0.74 0% 0% 9% 0% N/A 112 0.0 15 209
233 7 0.59 0% 10% 62% 0% 13 196 0.1 45 84
234 1 0.59 0% 86% 99% 0% N/A 164 0.0 35 131
235 416 0.99 0% 2% 34% 0% 14 214 0.5 67 16
236 18 0.98 0% 28% 0% 0% 15 263 0.0 60 28
237 17 0.70 0% 57% 1% 0% 13 397 0.0 59 30
238 2 0.67 0% 0% 40% 0% N/A 90 0.0 15 208
239 1 0.27 0% 4% 0% 0% N/A 96 0.4 7 233
Table 6(Continued)

40
Appendix 2: Detailed Methodology
Survey methods
A short survey was administered to get community member opinions on which values were most
important to each respondent. Surveys were comprised of 16 questions where respondents were
asked to rank preservation criteria according to personal preference. The survey used a pairwise
ranking method. In this method the survey-taker is prompted with every possible pair of factors,
one pair at a time, and asked simply “Which do you feel is more important?”. In this way each
factor is compared to every other factor and their relative order of importance can be easily
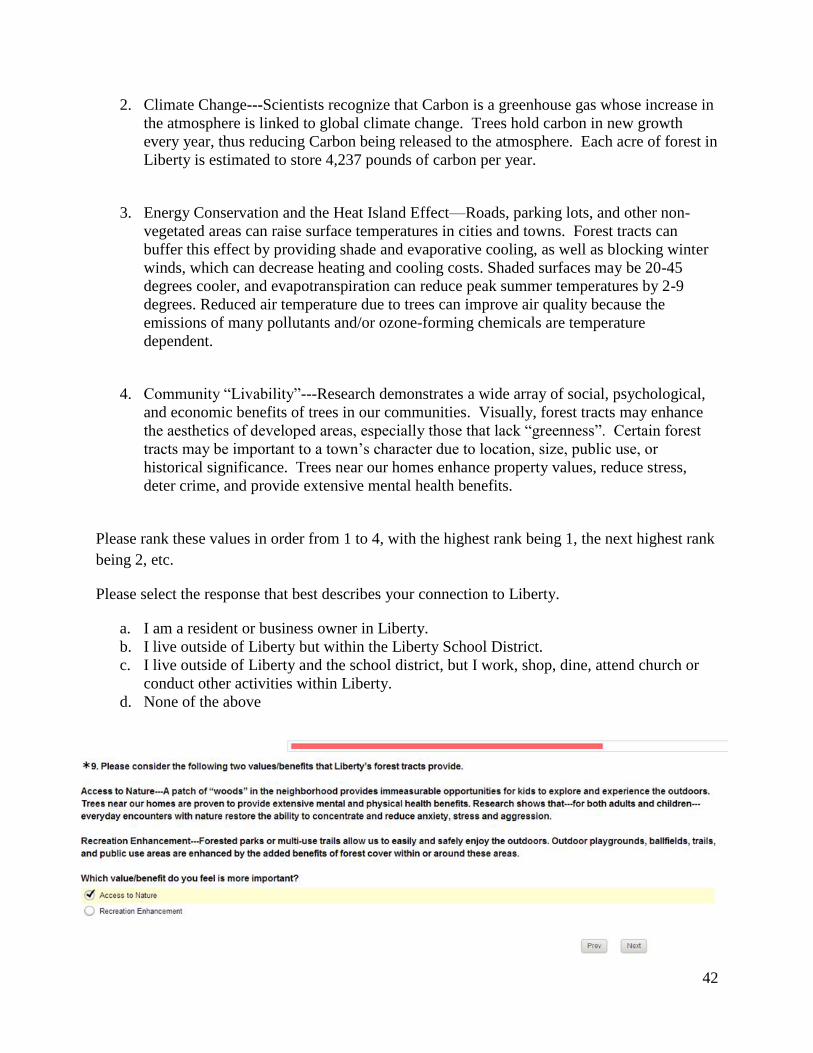
found. The survey was administered using a web-based survey tool called Survey Monkey
(www.surveymonkey.com). The full text of the survey is below, followed by a screenshot of
what the survey interface looked like to survey takers.
Survey Text:
Liberty Parks and Recreation is using a Tree Resource Improvement and Maintenance (T.R.I.M.)
grant to conduct a Community Forest Conservation Assessment. This assessment will determine
the relative importance of forest tracts across the City based on several important values. Citizen
input is a key part of the model that will tell us which tracts hold the most overall value to our
community. The results of this study will be used to develop partnerships, pursue funding
opportunities, provide vital data for future Parks and Open Space planning efforts, and inform
future land use, stormwater, and development plans and programs.
This assessment has found that the canopy of our entire community forest--- the individual trees
in lawns, parks, roadsides, and forest tracts---comprises approximately 23% of Liberty’s land
cover. We all recognize that trees provide many benefits to humans and wildlife. Intact tracts of
forest are especially important for the extensive environmental, social, and economic values and
benefits they provide to our community. For the purpose of this study, a “forest tract” is any area
with at least 90% tree cover over an area greater than one acre.
This short survey will use several questions to get your opinions on which of these
values/benefits are most important to you. The survey is comprised of 16 questions and will take
approximately 10 minutes to complete. We appreciate your contribution to this important study.
For the first several questions, you will be asked to compare two values/benefits that forest tracts
provide to our community and to choose which value you feel is the more important of the two
choices. As you consider your response, keep in mind that you are not choosing one value as
important and another as unimportant; you are simply choosing the value that you feel is more
important than the other.
1. Please consider the following two values/benefits that Liberty’s forest tracts provide.
41
Which value/benefit do you feel is more important?
(The next several questions asked this question as a pairwise comparison among all of the
following values/benefits).
Air Quality Enhancement and Carbon Storage--Trees improve air quality via direct leaf
absorption of pollutants, including nitrogen dioxide, sulfur dioxide, carbon monoxide, ozone, and
particulate matter such as dust, pollen, and smoke. Trees hold carbon in new growth every year,
thus reducing the amount of this greenhouse gas being released to the atmosphere.
Access to nature--- A patch of “woods” in the neighborhood provides immeasurable
opportunities for kids to explore and experience the outdoors. Trees near our homes are proven
to provide extensive mental and physical health benefits. Research shows that---for both adults
and children---everyday encounters with nature restore the ability to concentrate and reduce
anxiety, stress and aggression.
Stream Protection---Forested streams help to stabilize streambanks and hold soil in place. This
reduces bank erosion and sedimentation that degrades downstream water quality. Trees provide
habitat for fish and birds, and shade prevents excess algae buildup in streams.
Stormwater Retention and Flood Protection---Forested floodplains capture rainwater on tree
leaves and absorb stormwater through tree roots and forest litter, thus slowing the volume and
velocity of runoff into streams. This reduces the impacts of major storm events while helping to
recharge groundwater.
Providing Natural Habitat---Forest tracts differ in their ecological quality and their value as
wildlife habitat. Tracts with high ecological quality would have large trees, high species
diversity, and little presence of invasive species. Such tracts would be expected to provide
essential food and cover for birds and other forest wildlife.
Recreation Enhancement---Forested parks or multi-use trails allow us to easily and safely enjoy
the outdoors. Outdoor playgrounds, ballfields, trails, and public use areas are enhanced by the
added benefits of forest cover within or around these areas.
For the next question, you will be asked to rank four different values or benefits that forest tracts
provide to our community. A short summary is provided as background for each value. Please
read through the four summaries, and then rank their importance.
1. Air Quality---Trees improve air quality via direct leaf absorption of pollutants, including
nitrogen dioxide, sulfur dioxide, carbon monoxide, ozone, and particulate matter such as
dust, pollen, and smoke. Liberty is especially susceptible to air pollution from the
Kansas City Metro Area due to prevailing winds from the south. Breathing these
pollutants can trigger a variety of respiratory problems including bronchitis, emphysema,
and asthma.
42
2. Climate Change---Scientists recognize that Carbon is a greenhouse gas whose increase in
the atmosphere is linked to global climate change. Trees hold carbon in new growth
every year, thus reducing Carbon being released to the atmosphere. Each acre of forest in
Liberty is estimated to store 4,237 pounds of carbon per year.
3. Energy Conservation and the Heat Island Effect—Roads, parking lots, and other non-
vegetated areas can raise surface temperatures in cities and towns. Forest tracts can
buffer this effect by providing shade and evaporative cooling, as well as blocking winter
winds, which can decrease heating and cooling costs. Shaded surfaces may be 20-45
degrees cooler, and evapotranspiration can reduce peak summer temperatures by 2-9
degrees. Reduced air temperature due to trees can improve air quality because the
emissions of many pollutants and/or ozone-forming chemicals are temperature
dependent.
4. Community “Livability”---Research demonstrates a wide array of social, psychological,
and economic benefits of trees in our communities. Visually, forest tracts may enhance
the aesthetics of developed areas, especially those that lack “greenness”. Certain forest
tracts may be important to a town’s character due to location, size, public use, or
historical significance. Trees near our homes enhance property values, reduce stress,
deter crime, and provide extensive mental health benefits.
Please rank these values in order from 1 to 4, with the highest rank being 1, the next highest rank
being 2, etc.
Please select the response that best describes your connection to Liberty.
a. I am a resident or business owner in Liberty.
b. I live outside of Liberty but within the Liberty School District.
c. I live outside of Liberty and the school district, but I work, shop, dine, attend church or
conduct other activities within Liberty.
d. None of the above

43
CPRM Methods
The CPRM was built using CommunityViz software (Placeways LLC). CommunityViz (CV) is
an extension to ESRI ArcGIS, the most commonly used GIS software. Extensions are programs
that work “on top of” ArcGIS. Users interact with both ArcGIS and CV at the same time as
though they are the same software.
One of the many tools in CV is the suitability wizard, which was used for the CPRM. This tool
looks at a set of features and, for each feature, calculates a score of how suitable (desirable) that
feature is for a certain activity (e.g. development, conservation, restoration, management regime,
etc.). The scores are based on input criteria given by the user.
In Liberty’s CPRM, the suitability wizard analyzed each forest tract by computing a priority
ranking score representing how suitable that forest tract is for conservation. The priority ranking
scores are calculated using a weighted average formula. The numerical value of each criterion
describe in Table 3 (pg. 17) was calculated for each forest tract. For example, the tract size
criterion is simply a measure of how big the tract is (in acres). The four ‘overlap factors’ are a
measure of how much of the tract overlaps with the features of interest (expressed as a
percentage of the tract area). The ecological quality factors are qualitative; they are based on a
visual field survey completed by Chris Wilson (Liberty Parks & Open Space Manager). The
numerical values for each criterion are then normalized from 1-100 for all tracts (i.e for each
criteria the tract with the lowest numerical value gets a 0 and the tract with the highest numerical
value gets a 100 with the rest proportionately dispersed between). This normalization is done so
the numerical values of all factors can be accurately compared. For instance, the values for the
overlap factors can only be between 0 and 100 since they are percentages, but the value for tract
size acres ranges from <1 to 425. With normalization, the relative values of criteria in each tract
are preserved while making the absolute magnitude of all criteria the same. Once the values for
each criterion have been normalized, they are multiplied by their respective weighting factors
(Figure 8 pg. 16). These weighted scores for each criterion are summed for each forest tract to
get a raw suitability score. The last step is to normalize the raw suitability scores from 1-100 to
arrive at the final suitability (Priority Ranking Score).
An example of the weighted average calculation on one criterion for one tract:
Tract number 67 is the fifth largest in Liberty at 119 acres. When the tract size criterion is
normalized across all tracts, tract 67 gets a value of 98 (which is close to 100 because this is one
of the largest tracts). The weighting factor for the tract size criteria is 5. The normalized tract size
of 98 gets multiplied by the weighting factor of 5. This calculation happens for each criterion for
tract 67 (and every other tract too). All of tract 67’s normalized, weighted values are summed to
find its raw suitability score. Tract 67’s raw suitability score is 44. The raw suitability scores for
all tracts ranges from 1 to 67. When the raw suitability scores are normalized to find the final
Priority Ranking Scores tract 67 gets a final score of 66 (which is equal to (44/67)*100).

44
Appendix 3: References
1. Urban Watershed Forestry Manual – Part 1: Methods for Increasing Forest Cover in a
Watershed. US Department of Agriculture, Forest Service, Northeastern Area, State and
Private Forestry. July 2005. www.na.fs.fed.us
Photo Credits:
Cover page photo
http://steve-karol.artistwebsites.com/products/barn-in-liberty-mo-steve-karol-art-
print.html?currencyid=EUR
Residential Home – i-Tree Eco Ecosystem Services Results (pg. 14):
http://www.reeceandnichols.com/homes-for-sale/MO/Liberty
Invasive overgrown stand (pg. 18):
http://www.invasive.org/weedcd/images/1536x1024/2132058.jpg
Healthy forest stand (pg. 18):
http://1.bp.blogspot.com/_gzPWxB1yBog/TI5MSnrmq8I/AAAAAAAAA_8/lsSoCD3uJi
I/s1600/palos+singletrack.JPG
Raccoons – CPRM methodology (pg. 9):
http://commons.wikimedia.org/wiki/File:Raccons_in_a_tree.jpg
Downy Woodpecker – CPRM methodology (pg. 9): http://stevecreek.com/a-downy-woodpecker-
with-a-mouthful/
Squirrel CPRM methodology (pg. 9): http://www.colorsphere.com/photographs/Squirrels/
Photos taken by Ian Hanou, Plan-It Geo on 2/07/2013
Trees along road – project background (pg. 3)
Field and forest tract panoramic – i-Tree Canopy results (pg. 12)
Curving road w/ mailbox – i-Tree Eco results (pg. 19)
Trees and forests in Liberty – Conclusions (pg. 21 and 22)
Photos taken by Chris Wilson, Liberty Parks & Open Space
Stream corridor, large tree, tree planting – Executive Summary (pg. 1)
Bridge with dog walker, hikers on trail – Executive Summary (pg. 2)