lexington's affordable housing challenge and potential strategy
DESCRIPTION
2014TRANSCRIPT
Lexington’s Affordable Housing Challenge and Poten8al StrategyFebruary 2014
czb for the City of Lexington, KY
czb
Execu&ve SummaryBecause of a great deal of hard work, Lexington, Kentucky is in the midst of a prosperous economic expansion. High wage jobs are being created. Businesses are loca8ng to Lexington. Quality of life in Lexington is high. Moreover, Lexington remains a very affordable place to live with great housing choices at excep8onally good prices across most of the housing spectrum.
Since 2000, however, as Lexington has shiPed to a more high-‐tech, service-‐oriented, new economy, the demand for high skilled workers has grown. With that, the cohort of Lexington workers with higher incomes has also grown.
One important result of rising incomes is rising housing costs.
As more households have more to spend on housing, prices rise. And if overall demand rises as well -‐ which has been the case -‐ housing price escala8on becomes even sharper. For Lexington, this means a two-‐part narra8ve has been taking shape the last decade.
For households making $40,000 or more a year, Lexington offers great value: extraordinarily high quality of life, ameni8es, and housing opportuni8es. For
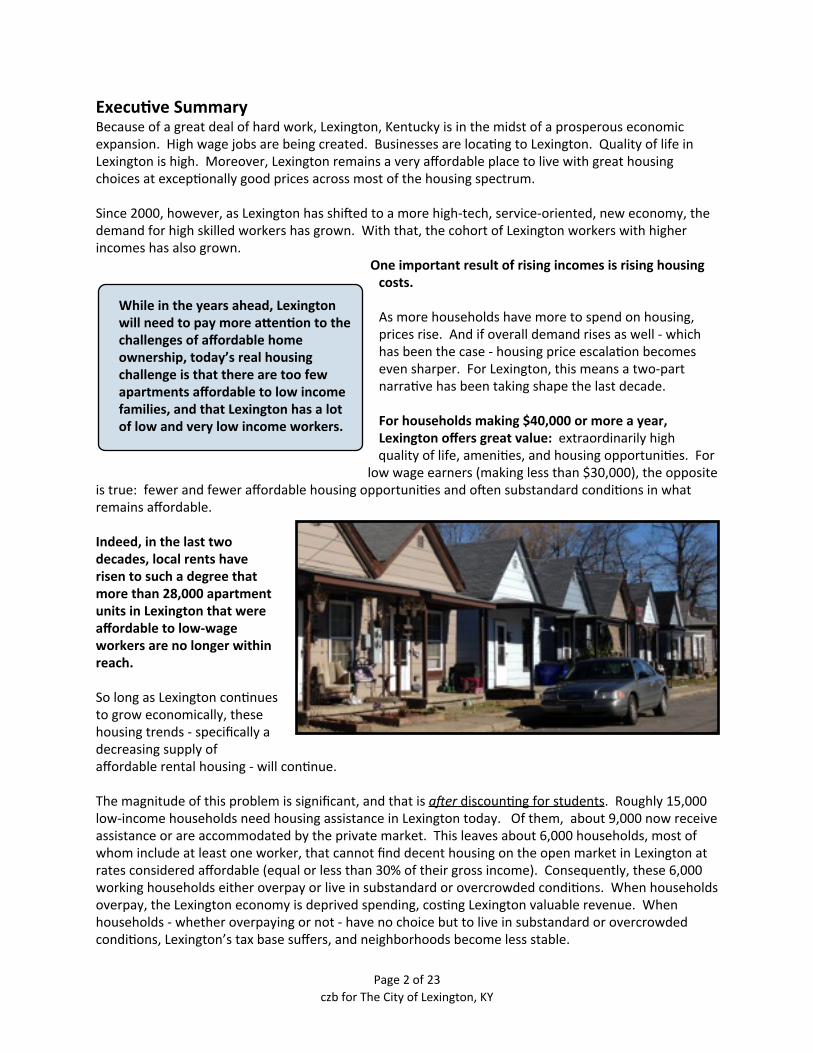
low wage earners (making less than $30,000), the opposite is true: fewer and fewer affordable housing opportuni8es and oPen substandard condi8ons in what remains affordable.
Indeed, in the last two decades, local rents have risen to such a degree that more than 28,000 apartment units in Lexington that were affordable to low-‐wage workers are no longer within reach.
So long as Lexington con8nues to grow economically, these housing trends -‐ specifically a decreasing supply of affordable rental housing -‐ will con8nue.
The magnitude of this problem is significant, and that is a"er discoun8ng for students. Roughly 15,000 low-‐income households need housing assistance in Lexington today. Of them, about 9,000 now receive assistance or are accommodated by the private market. This leaves about 6,000 households, most of whom include at least one worker, that cannot find decent housing on the open market in Lexington at rates considered affordable (equal or less than 30% of their gross income). Consequently, these 6,000 working households either overpay or live in substandard or overcrowded condi8ons. When households overpay, the Lexington economy is deprived spending, cos8ng Lexington valuable revenue. When households -‐ whether overpaying or not -‐ have no choice but to live in substandard or overcrowded condi8ons, Lexington’s tax base suffers, and neighborhoods become less stable.
Page 2 of 23 czb for The City of Lexington, KY
While in the years ahead, Lexington will need to pay more aKen&on to the challenges of affordable home ownership, today’s real housing challenge is that there are too few apartments affordable to low income families, and that Lexington has a lot of low and very low income workers.

Also, this problem is likely to become more significant going forward. It is probably the case that the Lexington market will shed an addi8onal 400 affordable rental units (on average) in each of the coming years.
If the Mayor and City Council want to do something about this problem, it is important to start with an understanding of the roots of this problem, of which there are two.
- PRICE OF SUCCESS. First, recent changes in the Lexington economy to one requiring more skills and educa8on is at the center of today’s affordability challenges. Think of this as a cost of becoming an increasingly compe88ve and prosperous city. Had Lexington gone more in the direc8on of St. Louis and Cincinna8 (becoming weaker) instead of tracking with Raleigh and Chabanooga and Oakland and Albuquerque (becoming stronger), resul8ng and persistent soP market condi8ons would have meant cheaper housing. Buffalo and Detroit and Trenton remain cheap because too few businesses want to locate there and too few workers want to live there, and, consequently, demand is low, and prices reflect that. By contrast, Lexington is becoming more expensive -‐ though s8ll affordable to most -‐ because the exact opposite is true. This is a problem resul8ng from prosperity. As Boulder and Seable and Aus8n have discovered, addressing rising housing costs is a price of success.
- STAGNATING WAGES FOR SOME. Second, low-‐skilled workers’ wages are not keeping pace. In Lexington there are thousands of poor residents in households who for genera8ons have not been part of the mainstream economy. The majority of these households have been helped by federal programs, but the underlying situa8on has not changed much. This is a legacy problem. In this respect, Lexington resembles Durham, Richmond, Nashville, and Indianapolis – ci8es on the move in the right direc8on, but with large por8ons of their working but low-‐income popula8on unable to keep up.
The recommended way to think about Lexington’s current affordability gap – arising both from legacy on the one hand and as a prosperity consequence on the other – is as a problem that requires Lexington to catch up. That is, to close a gap that now (already) exists, a gap we es8mate to consist of 6,000 households.
What about going forward? In addi8on to the work of catching up (closing the current gap), the Lexington market will likely con8nue to become ever more expensive. That will likely result in an addi8onal annual loss of another 400 affordable units. We project that by 2025, today’s gap of 6,000 could become much larger. The way to think about the future affordability gap – arising from con8nued increases in prosperity and resul8ng housing price escala8on – is as a problem that will require that Lexington keep up (i.e. not let the gap get any bigger than it already is).
Regardless of the pace that local housing prices have risen and will rise, the key underlying issue for the Mayor and City Council to come to terms with is that wages for low-‐skilled workers have not and will not keep pace with rising housing costs, and so there will be an affordability gap un8l they do. Furthermore, if this affordability gap for low-‐wage workers is not closed -‐ for whatever reason -‐ the problem is not one whose costs will simply go away. Rather, the costs will emerge in alterna8ve form as declining neighborhood health, reduced tax base, higher crime and crime-‐figh8ng costs, higher demand for services and their costs, or commu8ng pressures and the costs of conges8on, as well as air and water pollu8on. Housing affordability gaps are a “when” and “in what form” challenge, not an “if” problem.
Page 3 of 23czb for The City of Lexington, KY

WHAT IS THE SOLUTION? Affordability gaps can be closed in two basic ways: by reducing housing costs, or by increasing incomes. And they can be addressed through income subsidies on the demand side, or produc8on efforts on the supply side. And, of course, all such approaches can be combined.
Most cri8cal of all as regards a response -‐ no maber how the gap is closed -‐ is that the unit cost of addressing this problem will be roughly $6,000 per year per household. Whether as a rental subsidy of $500 per month (on average) per low-‐income working household, or as repayment of amor8zed debt taken on to construct new units, the per unit/per year scalable variable is $6,000.
Typical Low-Income Wage Earner HH in Lexington(based on a range of income earning possibilities and range of market rents)
Typical Low-Income Wage Earner HH in Lexington(based on a range of income earning possibilities and range of market rents)
Typical Low-Income Wage Earner HH in Lexington(based on a range of income earning possibilities and range of market rents)
Typical Low-Income Wage Earner HH in Lexington(based on a range of income earning possibilities and range of market rents)
Typical Low-Income Wage Earner HH in Lexington(based on a range of income earning possibilities and range of market rents)
Annual Hours Worked (Range) (Average) 1,8071,807 1,9551,955
Hourly Wage (Average) $7.25$7.25$7.25$7.25
Monthly Gross Income (Average) $1,092$1,092 $1,181$1,181
Affordable Rent (Average) $328$328 $354$354
Market Rent 2+ BR Range (Average) $723 $807$807 $860
Est. Annual Gap Range (Average) $4,428 $5,436$5,436 $6,072
Est. Annual Mortgage Payment to Retire $75,000/unit Development Costs $5,988$5,988$5,988$5,988
For the sake of craPing policy, this $6,000 per year per household figure is the rounded mul8plier that the community needs to understand. It is the mul8plier that translates the problem of catching up completely to about $36M per year, (it is also the average annual cost to LHA in subsidies to a sec8on 8 household. In addi8on, we project the cost of keeping up to be an amount that will grow by $2.4M annually thereaPer un8l wages keep pace with housing prices.
This is a lot of money. The aggregate amount that Lexington employers pay in wages each year is roughly $5.7B, which works out to 6/10th of one percent of what’s paid annually. While $36M a year is a lot of money, it is also a 8ny frac8on of the overall amount of wages paid, and is a form of employer cost shiPing whereby employers pay a low wage, and the impacts of that low wage are paid for by everybody else in the form of higher taxes. Lexington’s wage-‐housing cost gap is $36M a year of private gain at public expense, and this is growing by an addi8onal $2.4 annually.
Beyond the scale of the problem is a capacity issue. Even if the City “found” $36M+ a year to close these affordability gaps (regardless of where the money might come from), the Lexington housing system today is insufficient to the task; it does not have the capacity to implement a 6,000-‐unit program. Not today.
Page 4 of 23 czb for The City of Lexington, KY

To adequately address exis8ng -‐ and future -‐ affordability gaps, Lexington needs both the financial resources to do so, and a system capable of implemen8ng the strategies selected. Having neither at the present 8me, what is recommended is a scaled, two 8ered approach.
First, It is recommended that the Mayor and Council set a goal of catching up within 11 years; that is completely closing today’s gap of 6,000 units by steadily and persistently providing more rental subsidy to working families priced out of the market, and, when possible, through the development of new affordable units. Semng measurable, aggressive, and abainable goals of this kind is the hallmark of effec8ve public policy. Second, it is recommended that the Mayor and City Council aim to keep up thereaYer; that is, to add to the market the number of new affordable units each year needed to keep pace with con8nued price escala8on.
To summarize, this work should be understood and described locally as having two vital parts: catching up (reducing the current 6,000 unit gap to 0) and keeping up. It should be based on our recommenda8on that the Mayor, Urban County Council and Planning Commission formally endorse a stated community objec8ve that by 2025 any employee working in Lexington will be able to afford to live in Lexington.
1.Most of the catching up should be done through the provision of rental subsidies aKached to inspec&on requirements. Working households in Lexington who are priced out of decent housing are instead procuring substandard housing or paying too much for it, or someNmes both. Catching up should be done by providing these households with rental vouchers. These vouchers -‐ worth an average of $6,000 per year per household -‐ would only be redeemable if the housing unit meets certain Lexington standards. This will have the immediate effect of triggering upgrades that will bring units into line with minimum standards, a direct result of which will be more stable property values and stronger neighborhoods. Most of the gap could be closed this way, given exis8ng capacity that exists now and could be expanded at the Housing Authority (or other appropriate partners) to manage vouchers and property inspec8ons. The balance could be closed through infill redevelopment.
2. Keeping up (addressing the annual addi&onal projected shor^all of 400 units) is best done through proac&ve planning measures that tap into and leverage the market. Policies such as density bonuses, transfers of development rights, tax increment financing, and land banking all are proven tools for raising development revenue. For such tools to work, they need to be deeply embedded into Lexington’s Comprehensive Plan, its Zoning and Development Codes, its Design Guidelines, its Small Area or Neighborhood Plans, its transporta8on policy, and its economic development strategy. Such explicit emphasis on affordable housing does not now exist in Lexington’s guiding planning tools. The City of Lexington’s Comprehensive Plan -‐ new and exci8ng and visionary in many respects -‐ should be revised to state that “any employee working in the City of Lexington will be able to afford to live in Lexington.
At its most basic, this is a $36M a year problem to solve. Lexington can get there in numerous ways -‐ policy tools, development, rental subsidy -‐ but it is a $36M a year problem, and, as noted growing.
Page 5 of 23czb for The City of Lexington, KY
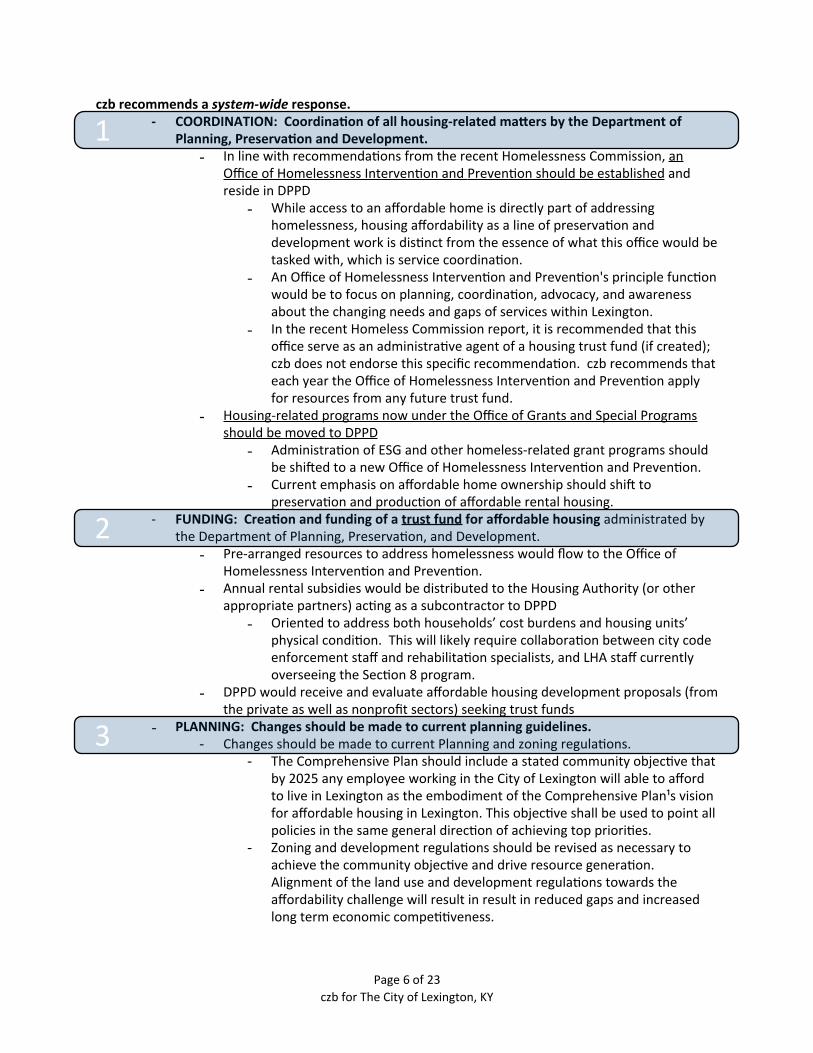
czb recommends a system-‐wide response.-‐ COORDINATION: Coordina&on of all housing-‐related maKers by the Department of
Planning, Preserva&on and Development.- In line with recommenda8ons from the recent Homelessness Commission, an
Office of Homelessness Interven8on and Preven8on should be established and reside in DPPD- While access to an affordable home is directly part of addressing
homelessness, housing affordability as a line of preserva8on and development work is dis8nct from the essence of what this office would be tasked with, which is service coordina8on.
- An Office of Homelessness Interven8on and Preven8on's principle func8on would be to focus on planning, coordina8on, advocacy, and awareness about the changing needs and gaps of services within Lexington.
- In the recent Homeless Commission report, it is recommended that this office serve as an administra8ve agent of a housing trust fund (if created); czb does not endorse this specific recommenda8on. czb recommends that each year the Office of Homelessness Interven8on and Preven8on apply for resources from any future trust fund.
- Housing-‐related programs now under the Office of Grants and Special Programs should be moved to DPPD - Administra8on of ESG and other homeless-‐related grant programs should
be shiPed to a new Office of Homelessness Interven8on and Preven8on.- Current emphasis on affordable home ownership should shiP to
preserva8on and produc8on of affordable rental housing.-‐ FUNDING: Crea&on and funding of a trust fund for affordable housing administrated by
the Department of Planning, Preserva8on, and Development.- Pre-‐arranged resources to address homelessness would flow to the Office of
Homelessness Interven8on and Preven8on.- Annual rental subsidies would be distributed to the Housing Authority (or other
appropriate partners) ac8ng as a subcontractor to DPPD- Oriented to address both households’ cost burdens and housing units’
physical condi8on. This will likely require collabora8on between city code enforcement staff and rehabilita8on specialists, and LHA staff currently overseeing the Sec8on 8 program.
- DPPD would receive and evaluate affordable housing development proposals (from the private as well as nonprofit sectors) seeking trust funds
- PLANNING: Changes should be made to current planning guidelines.-‐ Changes should be made to current Planning and zoning regula8ons.
-‐ The Comprehensive Plan should include a stated community objec8ve that by 2025 any employee working in the City of Lexington will able to afford to live in Lexington as the embodiment of the Comprehensive Plan¹s vision for affordable housing in Lexington. This objec8ve shall be used to point all policies in the same general direc8on of achieving top priori8es.
-‐ Zoning and development regula8ons should be revised as necessary to achieve the community objec8ve and drive resource genera8on. Alignment of the land use and development regula8ons towards the affordability challenge will result in result in reduced gaps and increased long term economic compe88veness.
Page 6 of 23 czb for The City of Lexington, KY
1
2
3

One closing point must be made in this summary, and that is the issue of leverage.
Leverage should be thought of as the mul8plier effect -‐ the amount of addi8onal resources brought to bear on a problem by an ini8al investment, resources that would otherwise not exist and which thus would have have been triggered, or leveraged. When a developer of affordable housing u8lizes a federal tax credit to help finance a project, at some point they have to put their own money in the deal. Their own money is what leverages the tax credit; their own money is what leverages debt financing.
Right now, 15,000 non-‐student, low-‐income households need assistance in Lexington. They either don’t have jobs or the jobs they have pay too lible.
Presently, the United States federal government and the government of the Commonwealth of Kentucky are paying to help house 9,000 of these households. In fact, the federal and state share of this help is very nearly 100%.
In effect, Lexington now benefits from a near infinite leverage ra8o, having put in close to zero dollars towards its affordable housing problem, and having the federal and state government pay nearly all of the tens of millions of dollars a year that is spent on current and legacy housing costs (all HUD costs for public housing, vouchers, and other assistance direct and indirect, averaged, since the 1937 construc8on of Bluegrass-‐Aspendale).
That leaves about 6,000 households without assistance; 6,000 primarily working households.
We es8mate that future federal and state assistance for these 6,000 households will be nearly zero. This means that if any assistance for these 6,000 households is to materialize, it will have to come from local sources almost exclusively. On balance, over 8me, this probably works out to a leverage ra8o of 1:1, or for every Lexington dollar commibed to housing (provided all 15,000 households are assisted) it will have been matched by one non-‐Lexington dollar.
Page 7 of 23czb for The City of Lexington, KY

The ChallengeLexington has a serious affordable housing problem. For tens of thousands of Lexington families, decent housing costs more than they can afford to pay. What’s more, the Lexington market has all the signs of becoming even stronger in the years ahead. Therefore, the City must find ways to strike a balance through redevelopment: to preserve affordability and also manage and enhance neighborhood quality of life.
While in the years ahead, Lexington will need to pay more aben8on to the challenges of affordable home ownership, today’s real housing challenge is that there are too few apartments affordable to low income families, and that Lexington has a lot of low and very low income workers.
What policymakers in Lexington need to be aware of is that the magnitude of the affordable rental housing problem is so acute that, at current produc8on rates for low and moderate income working households, it would take an es8mated 100 years to close exis8ng deficits (to catch up). If the Lexington community is truly commibed to addressing this problem -‐ the costs of which the whole of Lexington already pays in the form of neighborhood distress, reduced tax receipts, and costly public services -‐ it will have to come to terms with the fact that it is truly a big problem.
Housing advocates in Lexington have long known the problem is serious. Recent studies have confirmed that. Abempts have been made to create funding streams to address the problem, but so far major changes in the way Lexington handles this issue have not emerged. And, in the combina8on of Lexington’s post-‐recession economic strength (boos8ng rents faster than wages for poor households could keep up) and the net loss of public housing units owing to Hope VI redevelopment, it is clear that this is a serious problem requiring a serious response
What are the root causes of Lexington’s affordable housing challenge?
There are principally two: 1) PROSPERITY, or a strong market that is resul8ng in higher cost housing, and 2) LEGACY, a large unskilled labor force not earning livable wages owing mainly to lack of skills and educa8on suited for the new economy Lexington has now moved fully into.
To elaborate, the reason that many Lexington households are not able to keep up with housing costs is that the Lexington housing market -‐ and the Lexington economy overall – is becoming stronger.
As Lexington has become stronger economically –with the influx of employers, recovery from the recession, slight changes in the nature of the economy, and UK growth -‐ the demand for rental housing
Page 8 of 23 czb for The City of Lexington, KY
Rising Demandin Middle and Top
Large Unskilled Labor Force
Strong and ChangingLexington Market
Increased Value ofOwner Occupied Homes
Rising Rents
Low Wages (Not Livable)
Cost of Housing
Ability to Pay
GapLoss of Manufacturing
Trading Down of Jobs

has increased, and as demand has increased, exis8ng supplies have become more expensive. In addi8on, new development of rental proper8es has pushed rents higher.
Second, while the rental market has been growing in value, wages paid for the jobs performed by Lexington’s low-‐income earners have not kept pace either with rising housing costs or with wage gains made by others.
This in turn has two elements.
• One is that Lexington has a large number of poor families without the skills to compete for higher wages. In other words, while many poor Lexington families struggle to make a housing payment, the real underlying problem is not a housing problem but a structural workforce quality problem. As long as Lexington has a large underclass, it will have a large number of households with housing cost burdens; as long as this can is kicked down the road, these legacy costs will con8nue. Regarding workers in retail, arts and entertainment, educa8onal services, and the food industry, wages from 1998-‐2011 rose just 36%. During that same period, wages for health care workers, finance, management, insurance, and other sectors rose between 60% and 80%. As workers in other fields have more purchasing power, they push rents up beyond what earners in jobs with more stagnant wages can afford. Adding to this is the loss of manufacturing jobs -‐ a 54% decline from 1998-‐2011 -‐ which means many trade down and obtain lower wages as they seek replacement employment.
Job CategoryAverage Hourly Wage
AverageAnnual Income(if Full-‐8me)
Maximum Affordable
Rent
Number of Employees
Accommoda8ons and Food Services $7.25 $15,080 $377 16,567Educa8onal Services $11.42 $23,744 $594 2,762Retail; Arts, Entertainment and Recrea8on $11.59 $24,109 $603 21,627Other Services $13.33 $27,733 $693 15,445All Jobs $19.76 $41,104 $1,028 139,249
Sources: County Business PaSerns, czbLLC.
• The result: typical wages in several lower-‐paying sectors are no longer “livable,” i.e. not high enough to afford housing in Lexington’s private housing market. This is a structural problem that stems from how the economy func8ons. From 2000-‐2004, the average wage in these low-‐wage sectors was consistently high enough to afford a 1-‐bedroom apartment in Lexington priced at Fair Market Rent. In 2005, however, a gap began to develop between the rent level affordable to the average wage for low wage work and the fair market rent for a 1-‐bedroom apartment. Since then, this gap has only grown: by 2011, households at the average wage in these sectors were about $130 short of affording this rent each month.
Page 9 of 23czb for The City of Lexington, KY

Sources: County Business PaSerns, Department of Housing and Urban Development, czbLLC.
For a sense of scale: there are roughly 15,000 low-‐income, non-‐student households and now just 8,945 low-‐cost rentals to accommodate them – nearly twice as many households as rentals.
In 2000, nearly half (44%) the apartments with cash rents had gross rents below $500 per month – and were therefore affordable to households with incomes up to $20,000 (30% of the Area Median Income). By 2012, just 17% of apartments had rents below $500, and the number of apartments at this price range had fallen by more than half – from 20,238 in 2000 to 8,945 in 2012. That year, nearly all (90%) of the city’s renter households with incomes below $20,000 (the equivalent of a full &me job at $10/hr) had unaffordable rents – paying more than 30% of their household income on rent.
A significant number of these low-‐cost rental units (6,105 in all) are public or publicly subsidized units. Lexington has 1,365 public housing units and 2,046 Housing Choice Vouchers operated and overseen by LHA, and 2,694 privately-‐owned but publicly subsidized units, developed using monies from HUD’s project based Sec8on 8, Sec8on 811, Sec8on 202, Sec8on 221 (D) (4), Sec8on 236, and Sec8on 221 (D)(3) BMIR programs; and the Low-‐Income Housing Tax Credit Program and the HOME Investment Partnerships Program.
Rounded Numbers to Facilitate Discussion and UnderstandingRounded Numbers to Facilitate Discussion and Understanding
Total # of Poor (NON STUDENT) Households 15,000
Exis8ng Affordable (Public and Private) Housing Units 9,000
Remaining Gap 6,000
Page 10 of 23 czb for The City of Lexington, KY
2000 2011

To reiterate, PROSPERITY (Lexington becoming a stronger market with rising rents) and LEGACY (Lexington being home to a large number of low-‐income households, for whom market-‐rate rentals are proving increasingly out of reach) have leP the city with a 6,000 unit gap.
FindingsHaving recently draPed a 10-‐Year Plan to End Homelessness and through the work of the Mayor’s Commission on Homelessness, Lexington public officials and community stakeholders are well aware of the challenges the city’s low-‐income households face when it comes to affording a place to live. Beyond the nearly 1,500 county residents living in shelters or on the streets, thousands more live at risk of becoming homeless – paying well in excess of 30 percent of household income on rent or mortgage payments. This reality is driven by the troublesome mix of stagna8ng incomes and rising housing costs.
The problem of housing stability and affordability is par8cularly acute for households at the bobom of the income spectrum or in the lowest income quin8le -‐ those with incomes less than roughly $20,000. Nearly all (94%) of renter households with incomes below $10,000 pay more than 30% of income on rent, as do the vast majority (87%) of those with incomes between $10,000 and $19,999.
Source: U.S. Census, 2012 American Community Survey 1-‐Year Es8mates, Table B25074
If Lexington policy makers and advocates are to fully understand the nature of the local “affordable housing challenge,” it is necessary to know more about who these low-‐income households – those most likely to face such housing costs burdens – are, as well as how many of them there are.
One challenge of looking at the data on all households is that Lexington’s large student popula8on – roughly 43,000 undergraduate and graduate students – tends to skew the numbers. Most college students either do not work while enrolled in school or work only part 8me, meaning their incomes for
% Lexington HHs Paying More Than 30% of Income on Rent (2012)
< $10,000 $10,000-$19,999 $20,000-$34,999 $35,000-$49,999 $50,000-$74,999 $75,000-$99,999 $100,000 +
0%0%0%19%60%87%94%
Page 11 of 23czb for The City of Lexington, KY
60% of Lexington WORKERS earning between $10-‐$16/hr are paying more than 30% of their monthly income for housing. This costs the Lexington economy in numerous ways.
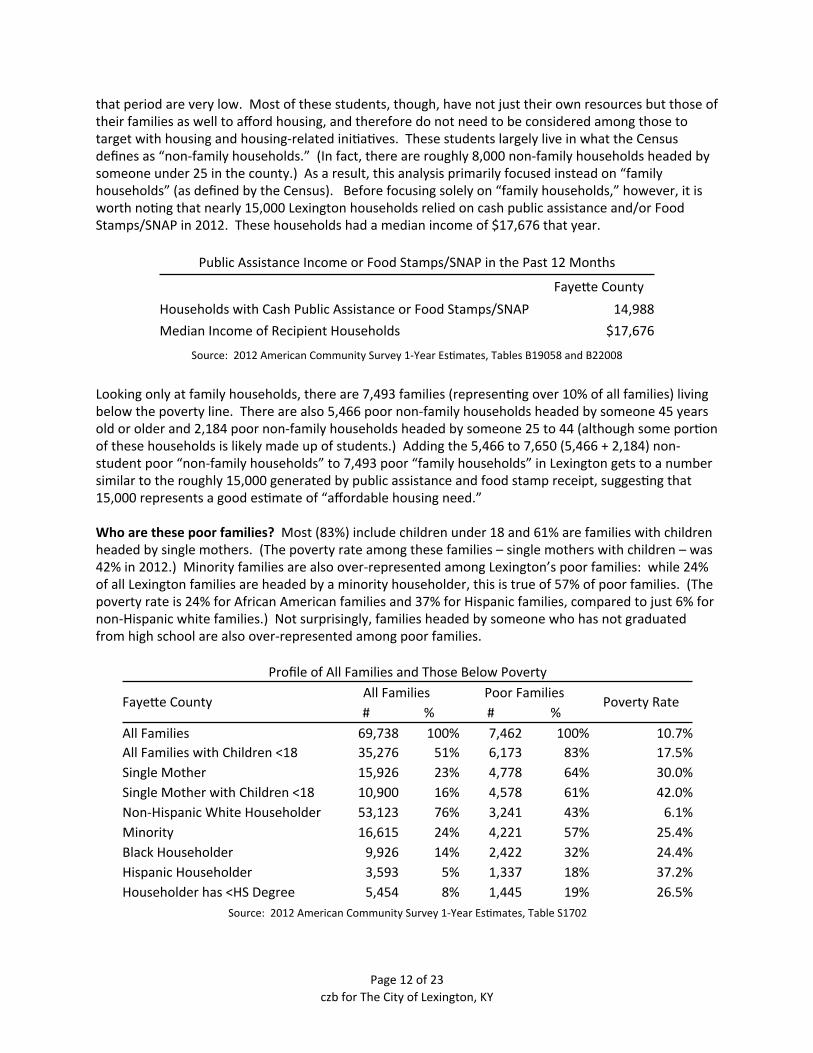
that period are very low. Most of these students, though, have not just their own resources but those of their families as well to afford housing, and therefore do not need to be considered among those to target with housing and housing-‐related ini8a8ves. These students largely live in what the Census defines as “non-‐family households.” (In fact, there are roughly 8,000 non-‐family households headed by someone under 25 in the county.) As a result, this analysis primarily focused instead on “family households” (as defined by the Census). Before focusing solely on “family households,” however, it is worth no8ng that nearly 15,000 Lexington households relied on cash public assistance and/or Food Stamps/SNAP in 2012. These households had a median income of $17,676 that year.
Public Assistance Income or Food Stamps/SNAP in the Past 12 MonthsPublic Assistance Income or Food Stamps/SNAP in the Past 12 Months
Fayebe CountyHouseholds with Cash Public Assistance or Food Stamps/SNAP 14,988Median Income of Recipient Households $17,676
Source: 2012 American Community Survey 1-‐Year Es8mates, Tables B19058 and B22008Source: 2012 American Community Survey 1-‐Year Es8mates, Tables B19058 and B22008
Looking only at family households, there are 7,493 families (represen8ng over 10% of all families) living below the poverty line. There are also 5,466 poor non-‐family households headed by someone 45 years old or older and 2,184 poor non-‐family households headed by someone 25 to 44 (although some por8on of these households is likely made up of students.) Adding the 5,466 to 7,650 (5,466 + 2,184) non-‐student poor “non-‐family households” to 7,493 poor “family households” in Lexington gets to a number similar to the roughly 15,000 generated by public assistance and food stamp receipt, sugges8ng that 15,000 represents a good es8mate of “affordable housing need.”
Who are these poor families? Most (83%) include children under 18 and 61% are families with children headed by single mothers. (The poverty rate among these families – single mothers with children – was 42% in 2012.) Minority families are also over-‐represented among Lexington’s poor families: while 24% of all Lexington families are headed by a minority householder, this is true of 57% of poor families. (The poverty rate is 24% for African American families and 37% for Hispanic families, compared to just 6% for non-‐Hispanic white families.) Not surprisingly, families headed by someone who has not graduated from high school are also over-‐represented among poor families.
Profile of All Families and Those Below PovertyProfile of All Families and Those Below PovertyProfile of All Families and Those Below PovertyProfile of All Families and Those Below PovertyProfile of All Families and Those Below PovertyProfile of All Families and Those Below Poverty
Fayebe CountyAll FamiliesAll Families Poor FamiliesPoor Families
Poverty RateFayebe County# % # %
Poverty Rate
All Families 69,738 100% 7,462 100% 10.7%All Families with Children <18 35,276 51% 6,173 83% 17.5%Single Mother 15,926 23% 4,778 64% 30.0%Single Mother with Children <18 10,900 16% 4,578 61% 42.0%Non-‐Hispanic White Householder 53,123 76% 3,241 43% 6.1%Minority 16,615 24% 4,221 57% 25.4%Black Householder 9,926 14% 2,422 32% 24.4%Hispanic Householder 3,593 5% 1,337 18% 37.2%Householder has <HS Degree 5,454 8% 1,445 19% 26.5%
Source: 2012 American Community Survey 1-‐Year Es8mates, Table S1702Source: 2012 American Community Survey 1-‐Year Es8mates, Table S1702Source: 2012 American Community Survey 1-‐Year Es8mates, Table S1702Source: 2012 American Community Survey 1-‐Year Es8mates, Table S1702Source: 2012 American Community Survey 1-‐Year Es8mates, Table S1702Source: 2012 American Community Survey 1-‐Year Es8mates, Table S1702
Page 12 of 23 czb for The City of Lexington, KY

Most poor families (71%, or 5,357 out of 7,493) and an even larger share of families receiving Food Stamps (84%, or 8,198 out of 9,786) include at least one worker. In all, there are 16,211 employed Lexington residents living below the poverty level.
Why are they facing housing cost burdens in such high numbers? The need for more affordable housing in Lexington appears so acute today not only due to the large number of very-‐low-‐income families but also because, not long ago, these households were fairly well served by the private housing market. As recently as 2000, for example, almost half (44%) of all apartments with cash rents had gross rents below $500 per month – and therefore affordable to households with incomes up to $20,000 (30% of the Area Median Income). By 2012, just 17% of apartments had rents below $500, and the number of apartments at this price range had fallen by more than half – from 20,238 in 2000 to 8,945 in 2012.
Source: 2000 Census, 2012 American Community Survey 1-‐Year Es8mates, Table B25063 for ACS, H062 for 2000 Census
Page 13 of 23czb for The City of Lexington, KY
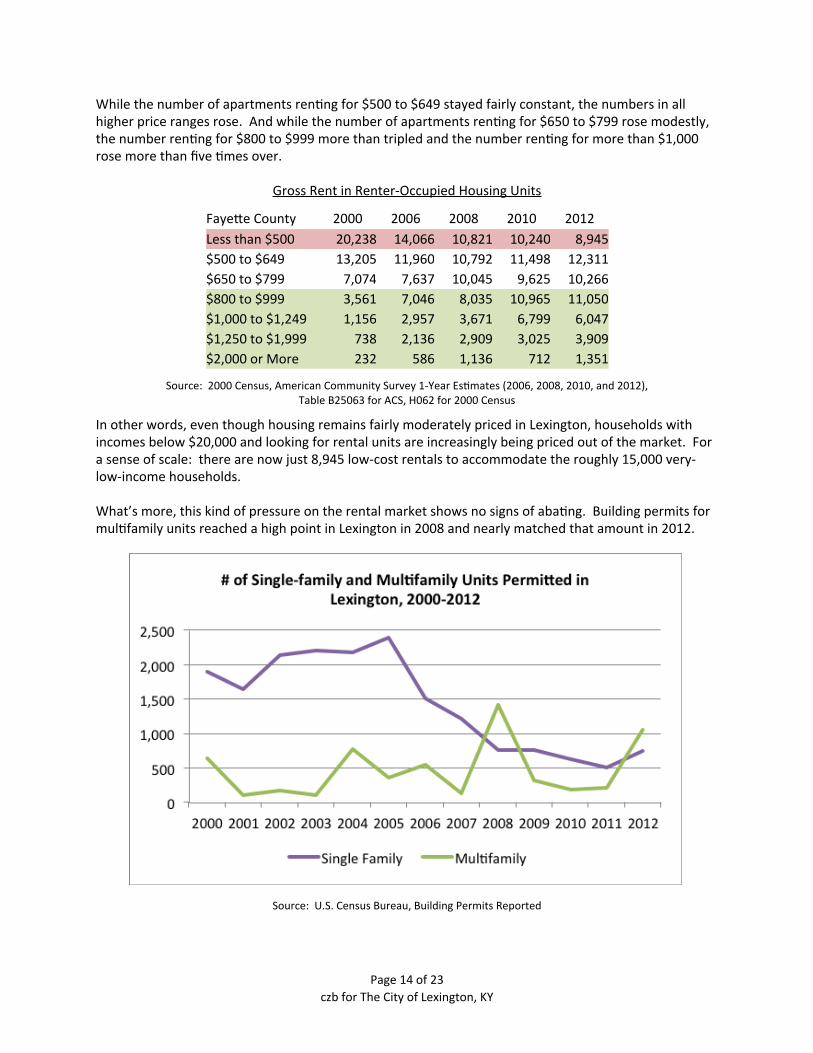
While the number of apartments ren8ng for $500 to $649 stayed fairly constant, the numbers in all higher price ranges rose. And while the number of apartments ren8ng for $650 to $799 rose modestly, the number ren8ng for $800 to $999 more than tripled and the number ren8ng for more than $1,000 rose more than five 8mes over.
Gross Rent in Renter-‐Occupied Housing Units
Fayebe County 2000 2006 2008 2010 2012Less than $500 20,238 14,066 10,821 10,240 8,945$500 to $649 13,205 11,960 10,792 11,498 12,311$650 to $799 7,074 7,637 10,045 9,625 10,266$800 to $999 3,561 7,046 8,035 10,965 11,050$1,000 to $1,249 1,156 2,957 3,671 6,799 6,047$1,250 to $1,999 738 2,136 2,909 3,025 3,909$2,000 or More 232 586 1,136 712 1,351
Source: 2000 Census, American Community Survey 1-‐Year Es8mates (2006, 2008, 2010, and 2012),Table B25063 for ACS, H062 for 2000 Census
In other words, even though housing remains fairly moderately priced in Lexington, households with incomes below $20,000 and looking for rental units are increasingly being priced out of the market. For a sense of scale: there are now just 8,945 low-‐cost rentals to accommodate the roughly 15,000 very-‐low-‐income households.
What’s more, this kind of pressure on the rental market shows no signs of aba8ng. Building permits for mul8family units reached a high point in Lexington in 2008 and nearly matched that amount in 2012.
Source: U.S. Census Bureau, Building Permits Reported
Page 14 of 23 czb for The City of Lexington, KY

At the same 8me, the University of Kentucky “is in the midst of a building boom” with plans to update and add to its on-‐campus and near-‐campus housing op8ons for students. And this while the campus is experiencing record enrollments, exceeding 29,000 for the first 8me in the University’s history (link to UK).
Sources: hSp://www.kentucky.com/2013/09/10/2814457/university-‐of-‐kentucky-‐enrollment.html#storylink=cpy; hSp://www.uky.edu/IRPE/students/enrollment/histcollege/enroll.deglev.f9403.all.html; hSp://www.uky.edu/IRPE/students/enrollment/histstatus/9908all_ukbystatus.html
Put together, these trends have translated into more housing instability and higher housing cost burdens for Lexington’s lower income households. To improve the housing situa8on of low-‐income households, 10-‐Year Plan to End Homelessness as well as the Report of the Mayor’s Commission on Homelessness both recommend working to increase incomes and wages on the one hand, and increase the amount of affordable housing, transi8onal units, and rental vouchers on the other.
Page 15 of 23czb for The City of Lexington, KY

The Current ResponseThe City of Lexington and the Lexington Housing Authority (LHA) have several efforts working along these lines. In addi8on to 1,365 public housing units and 2,046 Housing Choice Vouchers operated and overseen by LHA, there are also 2,694 privately-‐owned but publicly subsidized units, developed using monies from HUD’s project based Sec8on 8, Sec8on 811, Sec8on 202, Sec8on 221 (D) (4), Sec8on 236, and Sec8on 221 (D)(3) BMIR programs; and the Low-‐Income Housing Tax Credit Program and the HOME Investment Partnerships Program.
City of Lexington’s Subsidized Housing Stock
Source: City of Lexington/Fayebe County
Yet, even with these efforts -‐ ALL OF WHICH ARE FUNDED WITH NON-‐LEXINGTON DOLLARS -‐ the city remains roughly 6,000 units short of mee8ng its needs. This leaves roughly 6,000 Lexington households – most of whom include at least one child, and most of whom include at least one worker – facing serious housing cost burdens and housing instability.
Page 16 of 23 czb for The City of Lexington, KY
Programma&c Recommenda&ons for “Catching Up” and “Keeping Up”Several recent planning and community outreach processes – primarily around the issue of homelessness – have highlighted how important it is for the city to act on this substan8al gap between the number of low-‐income households and the number of available low-‐cost (par8cularly rental) housing units in Lexington. With a robust approach to preven8ng and addressing homelessness gaining more support, it makes sense to move the conversa8on to one focused on how the city should go about addressing this remaining gap. The op8ons before the city are somewhat constrained by the fact that the amount of federal and state funding going to municipali8es for the development or provision of affordable housing, funding that has been largely responsible for producing the city’s current supply of public and publicly subsidized units, is decreasing.
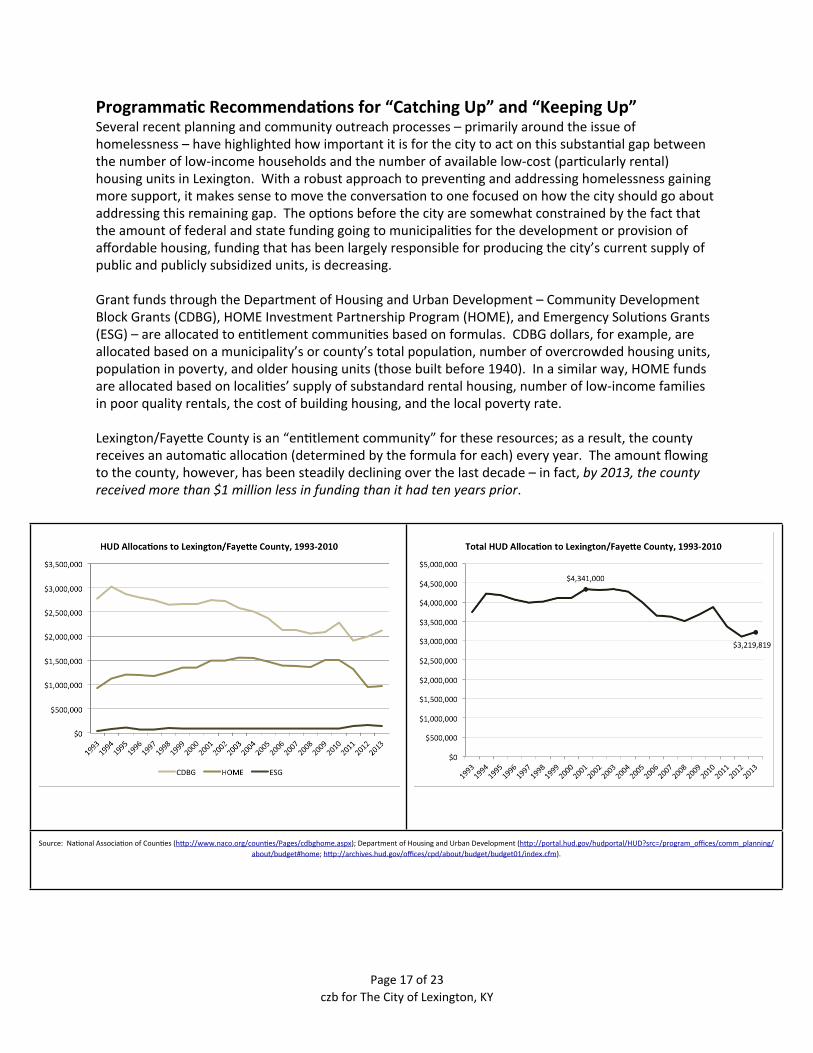
Grant funds through the Department of Housing and Urban Development – Community Development Block Grants (CDBG), HOME Investment Partnership Program (HOME), and Emergency Solu8ons Grants (ESG) – are allocated to en8tlement communi8es based on formulas. CDBG dollars, for example, are allocated based on a municipality’s or county’s total popula8on, number of overcrowded housing units, popula8on in poverty, and older housing units (those built before 1940). In a similar way, HOME funds are allocated based on locali8es’ supply of substandard rental housing, number of low-‐income families in poor quality rentals, the cost of building housing, and the local poverty rate.
Lexington/Fayebe County is an “en8tlement community” for these resources; as a result, the county receives an automa8c alloca8on (determined by the formula for each) every year. The amount flowing to the county, however, has been steadily declining over the last decade – in fact, by 2013, the county received more than $1 million less in funding than it had ten years prior.
Page 17 of 23czb for The City of Lexington, KY
Source: Na8onal Associa8on of Coun8es (hbp://www.naco.org/coun8es/Pages/cdbghome.aspx); Department of Housing and Urban Development (hbp://portal.hud.gov/hudportal/HUD?src=/program_offices/comm_planning/about/budget#home; hbp://archives.hud.gov/offices/cpd/about/budget/budget01/index.cfm).
Source: Na8onal Associa8on of Coun8es (hbp://www.naco.org/coun8es/Pages/cdbghome.aspx); Department of Housing and Urban Development (hbp://portal.hud.gov/hudportal/HUD?src=/program_offices/comm_planning/about/budget#home; hbp://archives.hud.gov/offices/cpd/about/budget/budget01/index.cfm).

At the same 8me, the Lexington Housing Authority (LHA) -‐ which is funded by the federal government -‐ is able to provide far less housing than local residents demand. According to the Report of the Mayor’s Commission on Homelessness, as of November 2012, 2,376 households were on the wai8ng list a public housing unit and 316 were on the wai8ng list for a Sec8on 8 rental voucher (17). Making a local monetary commitment “to increase the supply of affordable housing units…, and to provide services necessary to ensure stability for those in housing,” is increasingly necessary in the face of rising housing cost burdens for the working poor and declining federal funds available to respond.
Recent studies further suggest that inac8on actually brings its own significant costs. The Housing First program would address Lexington’s problem of chronic homelessness, thereby reducing costs while providing help.
As a result, the Mayor’s Commission on Homelessness proposed a 1% increase in the fee levied by the local government on insurance premiums would generate nearly $4 million in funding per year to spend on these goals – split in half between efforts to reduce housing cost burdens and make quality affordable housing more readily available; and as targeted homelessness interven8ons such as a Housing First approach to serving currently homeless individuals and families (19).
Page 18 of 23 czb for The City of Lexington, KY
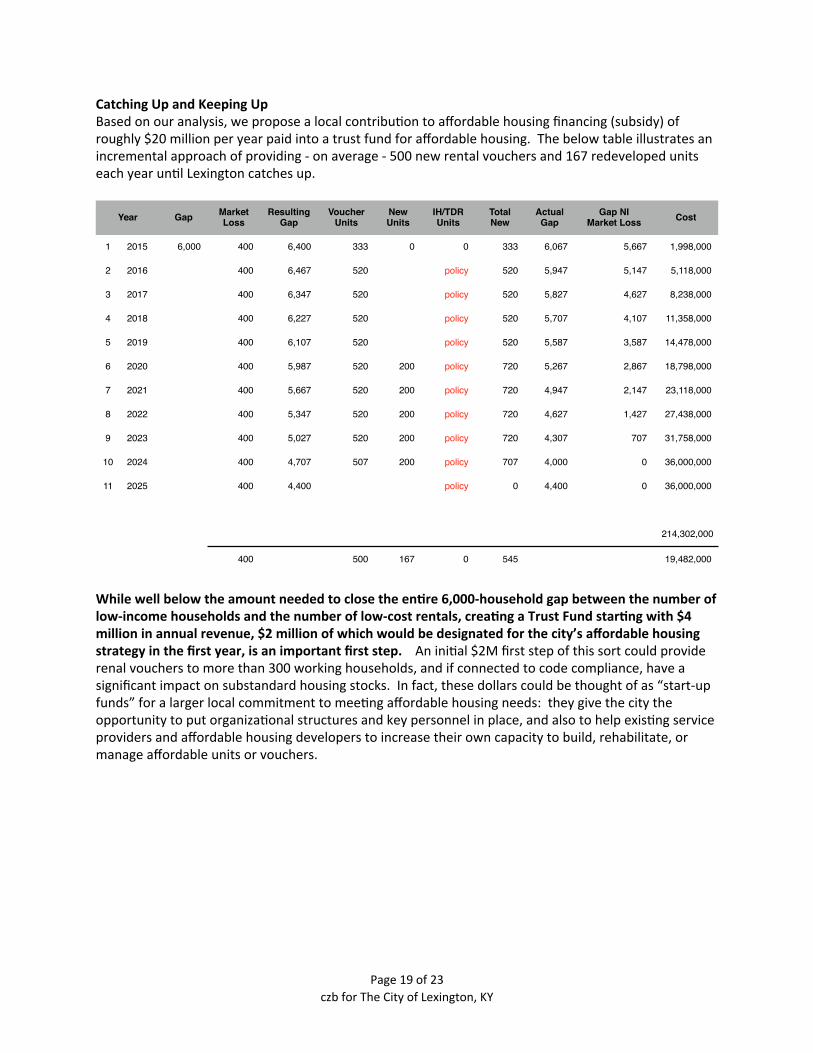
Catching Up and Keeping UpBased on our analysis, we propose a local contribu8on to affordable housing financing (subsidy) of roughly $20 million per year paid into a trust fund for affordable housing. The below table illustrates an incremental approach of providing -‐ on average -‐ 500 new rental vouchers and 167 redeveloped units each year un8l Lexington catches up.
YearYear Gap Market Loss
Resulting Gap
Voucher Units
New Units
IH/TDRUnits
TotalNew
ActualGap
Gap NIMarket Loss Cost
1 2015 6,000 400 6,400 333 0 0 333 6,067 5,667 1,998,000
2 2016 400 6,467 520 policy 520 5,947 5,147 5,118,000
3 2017 400 6,347 520 policy 520 5,827 4,627 8,238,000
4 2018 400 6,227 520 policy 520 5,707 4,107 11,358,000
5 2019 400 6,107 520 policy 520 5,587 3,587 14,478,000
6 2020 400 5,987 520 200 policy 720 5,267 2,867 18,798,000
7 2021 400 5,667 520 200 policy 720 4,947 2,147 23,118,000
8 2022 400 5,347 520 200 policy 720 4,627 1,427 27,438,000
9 2023 400 5,027 520 200 policy 720 4,307 707 31,758,000
10 2024 400 4,707 507 200 policy 707 4,000 0 36,000,000
11 2025 400 4,400 policy 0 4,400 0 36,000,000
214,302,000
400 500 167 0 545 19,482,000
While well below the amount needed to close the en&re 6,000-‐household gap between the number of low-‐income households and the number of low-‐cost rentals, crea&ng a Trust Fund star&ng with $4 million in annual revenue, $2 million of which would be designated for the city’s affordable housing strategy in the first year, is an important first step. An ini8al $2M first step of this sort could provide renal vouchers to more than 300 working households, and if connected to code compliance, have a significant impact on substandard housing stocks. In fact, these dollars could be thought of as “start-‐up funds” for a larger local commitment to mee8ng affordable housing needs: they give the city the opportunity to put organiza8onal structures and key personnel in place, and also to help exis8ng service providers and affordable housing developers to increase their own capacity to build, rehabilitate, or manage affordable units or vouchers.
Page 19 of 23czb for The City of Lexington, KY

PLANNING TOOLS
TDRs, IZ, Land Trust, Density Bonuses
HEALTHY NEIGHBORHOOD TRUST FUND
FOCUS ON UPGRADING EXISTING STOCKS
Legacy
Recent Prosperity
Current Gap
Build20%
Rental Subsidy80%
Catch Up
Future Gap Keep UpFuture Prosperity
LEXINGTON, KY AFFORDABILITY STRATEGY100% Goal by 2025
czbLLC 2014
Federal 100%
Lexington 100%
Lexington 100%
Rental Subsidy20%
Build80%
In the interim, it is important to realize that when it comes to subsidizing affordable housing, $2 million is not a lot of money.
One challenge with relying on new construc8on to tackle the city’s gap is its shear expense (financial and poli8cal), in addi8on to the distance between the local capacity to build affordable housing (LIHTC and HOME funds support roughly 75 and 80 units per year) and the number that would need to be produced to make a no8ceable dent in local affordable housing needs.
Alterna8vely, market-‐rate rents, though clearly out of reach for households between 0% and 30% of the Area Median Income, are not excessively expensive. As a result, there is only a small spread between what a poor household can afford to pay and what private apartments cost. Addressing that spread – u8lizing subsidies modeled aPer the federal Housing Choice Voucher Programming – is a possibly far more efficient way of making housing affordable. For example, the average Sec8on 8 subsidy for rental assistance in Lexington is $6,000 per household per year, a figure well below the roughly $100,000 it
Page 20 of 23 czb for The City of Lexington, KY
Reduce Housing Costs(BRING THEM DOWN)
Increase Purchasing Power(BRING WAGES UP)
Reduce Land Costs
Reduce Hard Costs
Livable Wages
Improve Employability
DEVELOP
RENTAL SUBSIDY UPGRADE EXISTING HOUSING
would take to build a new unit of affordable housing. In other words, while $2 million would fund the construc8on of just 20 new affordable housing units, it could support rental assistance for 300 households – nearly enough to clear the en8re Sec8on 8 wai8ng list.
It is recommended that there be an alignment of the management and oversight of these new locally funded rental vouchers with the system currently managing and overseeing the federally funded Sec8on 8 program, par8cularly in terms of program accoun8ng and intake (determining eligibility, gemng onto a wait list, etc.) This would be a chance, too, to address ways to strengthen the Sec8on 8 program and make it work beber for households and neighborhoods – for example, ensuring proper8es are inspected regularly and making par8cipa8ng landlords eligible for grants and/or low-‐cost loans to address code viola8ons and make façade improvements.
Ul8mately, the goal should be designing a program that makes it worth landlords’ while to par8cipate and also requires good behavior on landlords’ part that will generate spillover benefits beyond affordability, most notably in terms of housing quality and neighborhood quality.
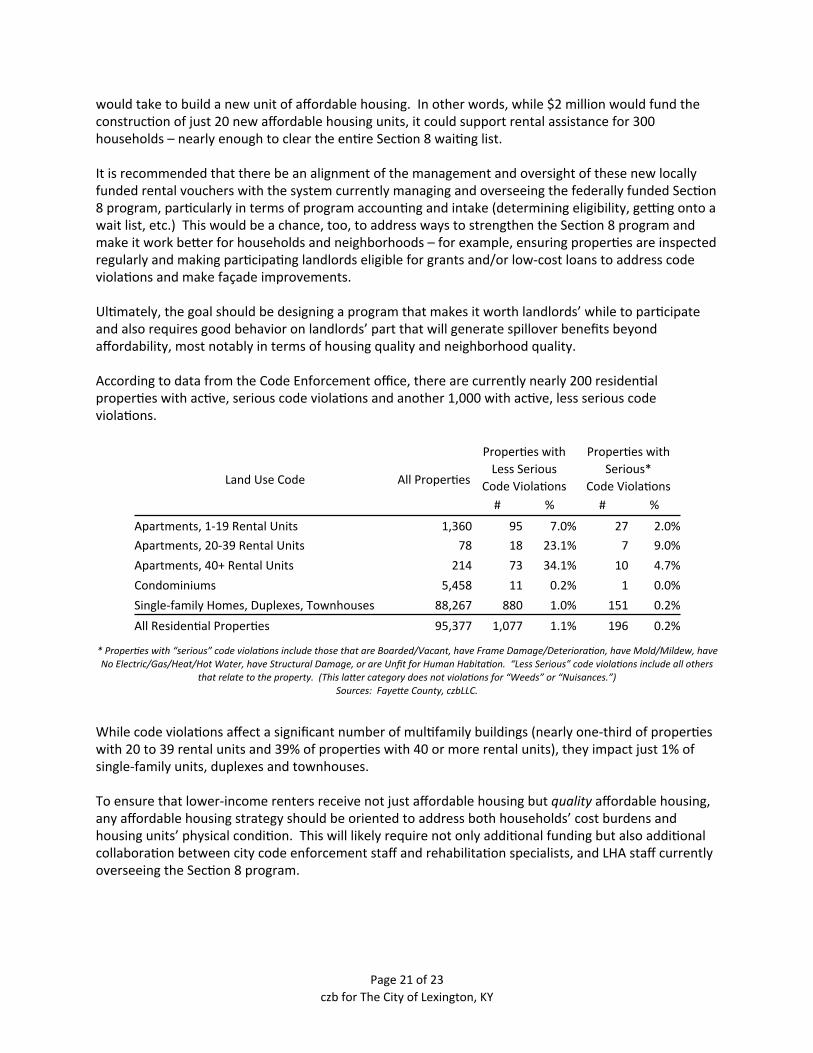
According to data from the Code Enforcement office, there are currently nearly 200 residen8al proper8es with ac8ve, serious code viola8ons and another 1,000 with ac8ve, less serious code viola8ons.
Land Use Code All Proper8es
Proper8es withLess Serious
Code Viola8ons
Proper8es withLess Serious
Code Viola8ons
Proper8es with Serious*
Code Viola8ons
Proper8es with Serious*
Code Viola8onsLand Use Code All Proper8es
# % # %
Apartments, 1-‐19 Rental Units 1,360 95 7.0% 27 2.0%Apartments, 20-‐39 Rental Units 78 18 23.1% 7 9.0%Apartments, 40+ Rental Units 214 73 34.1% 10 4.7%Condominiums 5,458 11 0.2% 1 0.0%Single-‐family Homes, Duplexes, Townhouses 88,267 880 1.0% 151 0.2%All Residen8al Proper8es 95,377 1,077 1.1% 196 0.2%
* ProperNes with “serious” code violaNons include those that are Boarded/Vacant, have Frame Damage/DeterioraNon, have Mold/Mildew, have No Electric/Gas/Heat/Hot Water, have Structural Damage, or are Unfit for Human HabitaNon. “Less Serious” code violaNons include all others
that relate to the property. (This laSer category does not violaNons for “Weeds” or “Nuisances.”)Sources: FayeSe County, czbLLC.
While code viola8ons affect a significant number of mul8family buildings (nearly one-‐third of proper8es with 20 to 39 rental units and 39% of proper8es with 40 or more rental units), they impact just 1% of single-‐family units, duplexes and townhouses.
To ensure that lower-‐income renters receive not just affordable housing but quality affordable housing, any affordable housing strategy should be oriented to address both households’ cost burdens and housing units’ physical condi8on. This will likely require not only addi8onal funding but also addi8onal collabora8on between city code enforcement staff and rehabilita8on specialists, and LHA staff currently overseeing the Sec8on 8 program.
Page 21 of 23czb for The City of Lexington, KY

The combina8on of rental subsidy plus new construc8on -‐ as shown in the table on p 19 -‐ can reduce the gap of 6,000 to zero by 2025, and by tying subsidies to property inspec8ons, trigger needed upgrades across Lexington. This means the “system” that is recommended be built fundamentally consist of three pipelines.
1. The first is the delivery of rental subsidy to low income households for use in pre-‐inspected code compliant rental units.
2. The second is the construc8on of new or redevelopment of exis8ng units when possible.3. The third is policy-‐created units through planning and zoning frameworks as noted.
This third point is crucial. Crea8ng and resourcing a trust fund -‐ even one that fully zeros out the current 6,000 unit gap by 2025 -‐ s8ll leaves Lexington in an addi8onal 4,400 unit gap by 2025, because, as noted, the market will con8nue to shed affordable units at a sizable annual clip. In 1990, 88% of the rental units in Lexington were affordable to low-‐income working households. By 2000 that had shrunk to 44% By 2010 it had dropped to 19% and by 2012 to 17%
To ensure that by 2025 this gap is also zeroed out, the City of Lexington will have to aggressively refine its current repertoire of planning tools. Tools such as zoning and development rights transfers are market-‐oriented planning mechanisms that trade addi8onal profit to the market in exchange for housing resources or more economically sustainable neighborhood outcomes. The Department of Planning, Preserva8on and Development would have the responsibility of working with Lexington’s planning division and related boards and commissions to refine the city’s Comprehensive Plan and related development documents, poin8ng all municipal tools in one common direc8on, something that does not now exist.
Page 22 of 23 czb for The City of Lexington, KY

SummaryLexington is short 6,000 affordable rental units. This will grow by about 400 a year if the city does nothing.
Each of these units will cost about $6,000 per year per household to address, and this cost will not go away. Affordable housing gaps (problems) are not ever solved in the conven8onal way solu8ons tend to be thought of. The only way to “solve” such a problem is to raise the earning power of workers to the point where wages keep pace with housing costs.
In the absence of such a shiP in earning (either through actual wages or wage subsidies), working low-‐income earners in Lexington will either overpay for housing or live in substandard condi8ons, and in either case, cost the Lexington economy in one way or another.
Crea&ng a housing trust fund to begin addressing this problem is a wise direc&on to take. But the magnitude of the challenge is so large that unless a trust fund is commensurately large, the problem will remain significant, and, as noted, actually grow. In addi8on to crea8ng a fund to close affordability gaps, it is important that the whole armada of city land use and development policies be reshaped so as to harness market capacity in ways that keep the affordability problem from gemng worse.
Fully funding the tools needed for such a large endeavor will be very costly. But the Lexington economy is very large, and fully capable of absorbing these costs. This is not an issue of whether Lexington can zero out its affordable housing gaps and keep them narrow, but whether it wants to badly enough.
Seable wanted it badly enough to twice pass affordable housing levies each in excess of $100M. Boulder, Colorado requires all single family housing developers to pay a 25% inclusionary zoning in lieu fee into a local trust fund that also collects a 20% inclusionary fee for mul8family rental housing development. In the case of Seable, the funds are distributed annually on a compe88ve basis -‐ aligned with many of the elements of the State of Washington’s tax credit alloca8on process -‐ to local nonprofit developers that -‐ over the last 20 years, have build significant capacity. In Boulder the funds are generally distributed back to Boulder Housing Partners, the city’s housing authority. New York City under the Bloomberg Administra8on wanted it badly enough to massively upzone large sec8ons of four of the five city’s boroughs, and in the process created 165,000 affordable housing units. Park City, Utah wanted it badly enough to create a development rights trading bank, with incen8ves for developers to provide affordable units. Alexandria, Virginia wants it badly enough to evaluate all development proposals from the perspec8ve of impact on affordable housing; in Alexandria, city staff provide City Council with an es8mate of affordable units projected to be, and, in turn, developers must remedy that.
The common denominator in the above examples is that these are ci8es in the thick of coping with the consequences of prosperity. And they have been at it for a long while, and thus have become accustomed to addressing housing affordability as a maber of course. That doesn’t mean they have “solved” their problems. They haven’t. But they are commibed to addressing affordability gaps for low-‐income working households using their own resources.
Page 23 of 23czb for The City of Lexington, KY