levine-clark, michael, “questioning assumptions: e-book usage on a global scale,” proquest,...
TRANSCRIPT

Questioning Assumptions: E-Book Usage on A Global Scale
PortlandMarch 26, 2015
Michael Levine-ClarkUniversity of Denver

What (we think) we know
• E-books are better/worse
– For some subjects than others
– For some types of use than others
• E-books don’t work for immersive reading
• E-books don’t work for the humanities

Tons of Data
The Project
• Worldwide usage data
– EBL 2013-2014
– ebrary 2013-2014
– All customers
– Aggregated by title
• Today:– EBL 2013
– ebrary 2014

The Shape of the Data
• Spreadsheets for the world and by region
• One title, with all associated data
– LC Class, Subclass, BISAC
– Publication Year
– Number of libraries with title available
– Number of libraries with usage
– Multiple measures of usage

Some Data Snags
• EBL and ebrary data are not yet merged
• Call numbers
– Missing
– Errors
• xQ102… (Q102)
• BBF1427… (BF)
• Not easy to retroactively build a list of titles visible to a library at a particular time

Benchmarking
• What can we learn from worldwide usage data?
• Do trends across a huge data set matter?
• Is every institution so unique that only local data is meaningful?– Every institution has other resources competing
for each user’s time.
– e-books take up varying portions of an overall collection

Usage Definitions
• Session– Any time that a user
interacts with an e-book
• Page View– A count of the number
of pages examined
• Download– A download of the entire
book (EBL and ebrary)
• Chapter Download (ebrary)
• Usage Time– Minutes (EBL) or
seconds (ebrary) spent looking at the book
• Copies– A count of pages
copied/pasted
• Prints– A count of the number
of pages printed

Academic Complete
• Subscription package
• About 120,000 titles
• Same package at about 2,000 libraries worldwide
• BIG IMPACT on ebrary data

Titles Available
0
100000
200000
300000
400000
500000
600000
700000

Titles Available Worldwide By LC Class
0
20000
40000
60000
80000
100000
120000

Titles Available Worldwide By LC Class
0
10000
20000
30000
40000
50000
60000
70000
80000

ONE TITLE, WORLDWIDE DATA

Booth, Craft of Research
0
500
1000
1500
2000
2500
3000
Libraries with availability
Libraries with Usage

Booth, Craft of Research
97%
17,089 Sessions
Academic
Public
Special
86%
Sessions by Region
Africa
Asia Pacific
AUS/NZ
Europe
Latin America
Middle East
North America
South Asia
UK/Ireland

Booth, Craft of Research
• Additional Measures of Usage
– 368,879 page views
– 1,162 pages copied
– 62,009 pages printed
– 0 downloads
– 2,323 chapter downloads
– Used 17,453,759 seconds (4,848 hours)

How do you make sense of that?

Categories of Analysis
• LC Class and subclass
– Broad academic division (humanities, social sciences, STEM)
– Subject
• BISAC
• Publication date
• Region (Africa, Asia Pacific, etc.)
• Publisher or publisher type

Academic Divisions
Arts & HumanitiesB (Philosophy, Religion)
excluding BF (Psychology)
C, D, E, F (History)
M (Music)
N (Fine Arts)
P (Language & Literature)
TR (Photography)
OtherA (General)
G (Geography, Anthropology, Recreation)
Z (Bibliography, LIS)
Social Sciences BF (Psychology)
H (Social Sciences)
J (Political Science)
K (Law)
L (Education)
U, V (Military, Naval Sciences)
STEMQ (Science)
R (Medicine)
S (Agriculture)
T (Technology) (excluding TR)

Titles Available by Academic Division
194,420
185,558
184,053
78,854
STEM A&H Soc Sci Other
(12%)
(30%)
(29%)
(29%)
110,292
102,409
118,732
53,561
(14%)
(29%)
(27%)
(31%)

Average Number of Libraries with Title Available
0
50
100
150
200
250
300
350
400
450

Average Number of Libraries with Title Available – Academic Divisions
0
100
200
300
400
500
600
Arts & Humanities Social Sciences STEM Other
412.26

Average Number of Libraries with Title Available – Academic Divisions
0
20
40
60
80
100
120
Arts & Humanities Social Sciences STEM Other
88.89

Average Number of Libraries with Title Available - LC Class
0
100
200
300
400
500
600
700
800
900
412.26

Average Number of Libraries with Title Available - LC Class
0
20
40
60
80
100
120
88.89
LIKELIHOOD THAT A LIBRARY WILL SEE USAGE OF A TITLE
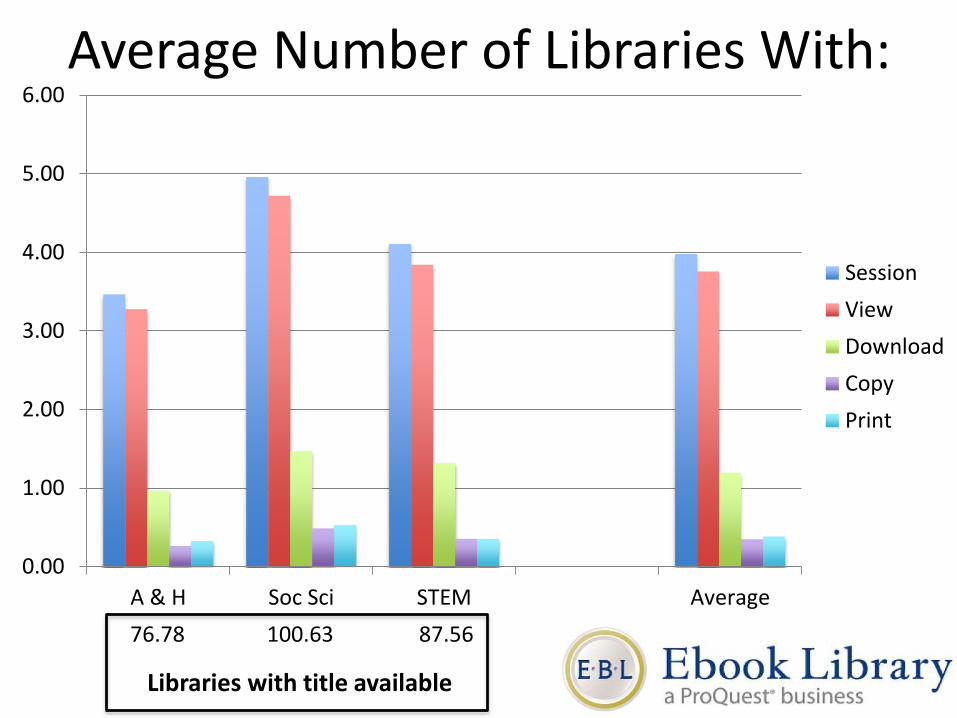
Average Number of Libraries With:
0.00
1.00
2.00
3.00
4.00
5.00
6.00
A & H Soc Sci STEM Average
Session
View
Download
Copy
Libraries with title available
76.78 100.63 87.56

Percentage of Libraries With:
0
0.01
0.02
0.03
0.04
0.05
0.06
0.07
A & H Soc Sci STEM Average
Session
View
Download
Copy

For every library that has a session…
A & H Soc Sci STEM Average
View 0.946 0.951 0.936 0.944
Download 0.278 0.296 0.321 0.300
Copy 0.075 0.098 0.085 0.087
Print 0.094 0.106 0.085 0.096
0.000
0.100
0.200
0.300
0.400
0.500
0.600
0.700
0.800
0.900
1.000
View
Download
Copy
Expressed as percentage of sessions, with sessions = 1.00

Average Number of Libraries with a View
0.90
0.91
0.92
0.93
0.94
0.95
0.96
0.97
Relative to libraries with sessions

Average Number of Libraries with Download
0.00
0.05
0.10
0.15
0.20
0.25
0.30
0.35
0.40
Relative to libraries with sessions

Average Number of Libraries with Copy
0.00
0.02
0.04
0.06
0.08
0.10
0.12
0.14
Relative to libraries with sessions

Average Number Libraries with Print
0.00
0.02
0.04
0.06
0.08
0.10
0.12
0.14
0.16
0.18
Relative to libraries with sessions

Percentage of Libraries Using a Title
Region Average # of Libraries with Title
Average # of Libraries with Use of Title
% of Libraries Using Title
UK/Ireland 18.97 2.15 11.33%
Australia/NZ 16.86 1.39 8.22%
North America 204.70 5.26 2.57%
Europe 60.36 1.48 2.46%
Asia Pacific 169.97 1.78 1.05%
South Asia 58.06 0.56 0.96%
Middle East 87.51 0.71 0.81%
Africa 69.14 0.51 0.77%
Latin America 119.40 0.93 0.68%
World 412.26 9.25 2.24%

Percentage of Libraries Using a Title, By Academic Division
Discipline Average # of Libraries with Title
Average # of Libraries with Use
Percentage of Libraries Using Title
Social Sciences 509.16 12.61 2.48%
STEM 378.90 8.95 2.36%
Arts & Humanities 554.74 10.71 1.93%
All Subjects 440.54 14.17 3.22%
Percentage of Libraries Using a Title, By Discipline
Region Arts & Humanities Social Sciences STEM
Africa 0.33% 1.08% 0.85%
Asia Pacific 0.71% 1.24% 1.31%
Australia/NZ 6.23% 9.42% 9.34%
Europe 2.07% 2.81% 2.47%
Latin America 0.42% 0.80% 1.19%
Middle East 0.54% 0.88% 1.12%
North America 2.42% 2.72% 2.58%
South Asia 0.60% 1.04% 1.32%
UK/Ireland 9.84% 13.22% 11.01%
World 1.93% 2.48% 2.36%

Conclusions about Likelihood of Use by a Library
• For EBL, a library has the most chance of seeing at least one use of a title in:
– Arts & Humanities for sessions and views
– STEM for downloads
– Social Sciences for copies and prints
• For ebrary, a higher percentage of libraries use titles in STEM and Social Sciences with variation by region

LIKELIHOOD THAT A BOOK WILL BE USED: ARE THESE THE RIGHT BOOKS?

Titles Available / Titles Used
53.08%46.88% 46.71%
38.59% 36.20% 33.13% 32.62% 32.16% 30.81%25.41%
0%
10%
20%
30%
40%
50%
60%
70%
80%
90%
100%
Titles With a Session Titles without a Session

Percentage of Titles Used By Discipline
63.84%59.47%
50.20%53.08%
0%
10%
20%
30%
40%
50%
60%
70%
80%
90%
100%
Social Sciences Arts & Humanities STEM All Subjects
Useed Unused

Percentage of Titles Used By Discipline
73.99%
67.36% 67.36% 68.75%
0%
10%
20%
30%
40%
50%
60%
70%
80%
90%
100%
Social Sciences Arts & Humanities STEM All Subjects
Useed Unused

Percentage of Titles Used By LC Class
0%
10%
20%
30%
40%
50%
60%
70%
80%
90%
100%
Session No Session

Titles Used By LC Class
0
20000
40000
60000
80000
100000
120000
Session No Session

Percentage of Titles Used, By DivisionRegion Arts & Humanities Social Sciences STEM
Africa 14.95% 30.77% 33.96%
Asia Pacific 45.80% 48.95% 46.48%
Australia/NZ 35.61% 40.24% 40.69%
Europe 36.79% 37.97% 25.36%
Latin America 26.83% 35.65% 34.11%
Middle East 25.65% 29.62% 41.59%
North America 54.16% 54.67% 43.94%
South Asia 24.01% 32.28% 43.88%
UK/Ireland 38.17% 38.45% 31.66%
World 59.47% 63.84% 50.20%

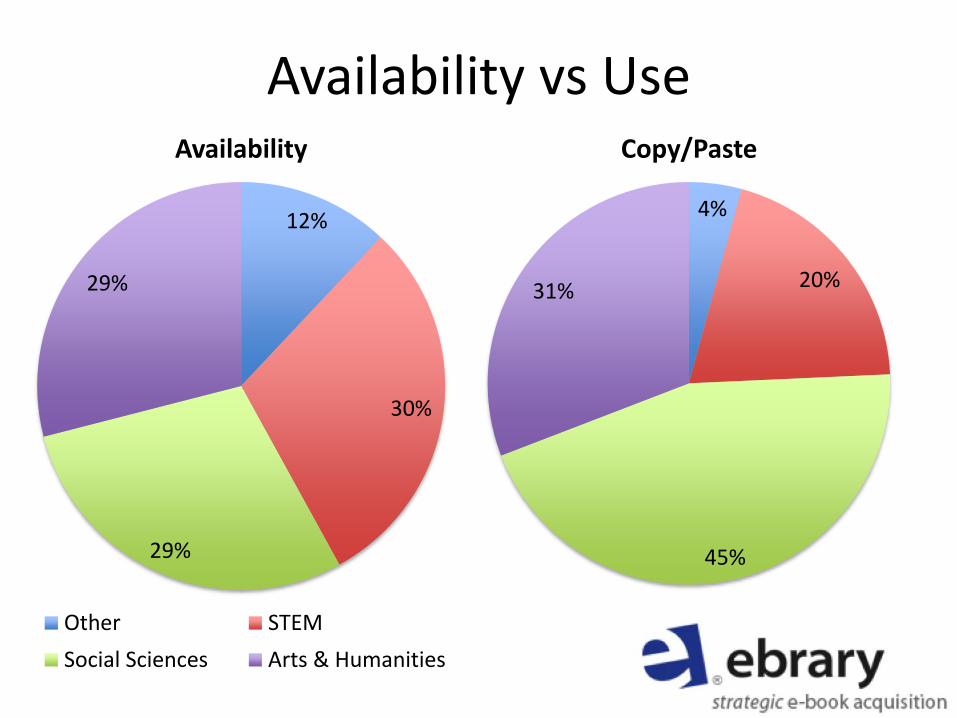
Availability vs Use
12%
30%
29%
29%
Availability
Other STEM
Social Sciences Arts & Humanities
5%
29%
34%
32%
Titles with a Session

Availability vs Use
12%
30%
29%
29%
Availability
Other STEM
Social Sciences Arts & Humanities
4%
26%
40%
30%
Sessions

Availability vs Use
12%
30%
29%
29%
Availability
Other STEM
Social Sciences Arts & Humanities
4%
28%
39%
29%
Page Views

Availability vs Use
12%
30%
29%
29%
Availability
Other STEM
Social Sciences Arts & Humanities
4%
28%
39%
29%
Downloads

Availability vs Use
12%
30%
29%
29%
Availability
Other STEM
Social Sciences Arts & Humanities
4%
33%
35%
28%
Titles with a Download
Availability vs Use
12%
30%
29%
29%
Availability
Other STEM
Social Sciences Arts & Humanities
4%
20%
45%
31%
Copy/Paste

Availability vs Use
12%
30%
29%
29%
Availability
Other STEM
Social Sciences Arts & Humanities
4%
25%
38%
33%
Titles with Copy/Paste

Availability vs Use
12%
30%
29%
29%
Availability
Other STEM
Social Sciences Arts & Humanities
4%
32%
36%
28%
Printing

Availability vs Use
12%
30%
29%
29%
Availability
Other STEM
Social Sciences Arts & Humanities
4%
26%
36%
34%
Titles with Printing

Availability vs Use
12%
30%
29%
29%
Availability
Other STEM
Social Sciences Arts & Humanities
4%
24%
40%
32%
Time Spent

Conclusions about Likelihood of Use
• Social Science titles are more likely to have at least one use
– But, some humanities subjects are most heavily used. P (languages and literature) is relatively poorly used.
• In general, social sciences titles are used above what one would predict, with sciences lower.

LIKELIHOOD OF HIGH USE

Page Views Per Session
0.00
2.00
4.00
6.00
8.00
10.00
12.00
14.00
16.00
18.00

Page Views Per Session: By Academic Division and Region
0
2
4
6
8
10
12
14
16
18
20
A&H Soc Sci STEM

Page Views Per Session By LC Class
0.00
2.00
4.00
6.00
8.00
10.00
12.00
14.00
16.00
18.00
20.00

Downloads Per Session
0
0.1
0.2
0.3
0.4
0.5
0.6
0.7

Downloads Per Session: By Academic Division and Region
0
0.1
0.2
0.3
0.4
0.5
0.6
0.7
0.8
A&H Soc Sci STEM

Downloads Per Session by LC Class
0
0.05
0.1
0.15
0.2
0.25
0.3

Copies Per Session
0
0.02
0.04
0.06
0.08
0.1
0.12
0.14
0.16
0.18
0.2

Copies Per Session: By Academic Division and Region
0
0.05
0.1
0.15
0.2
0.25
A&H Soc Sci STEM

Copies Per Session by LC Class
0
0.02
0.04
0.06
0.08
0.1
0.12
0.14
0.16
0.18

Prints Per Session
0
1
2
3
4
5
6

Prints Per Session: By Academic Division and Region
0
1
2
3
4
5
6
7
8
9
A&H Soc Sci STEM

Prints Per Session by LC Class
0
0.5
1
1.5
2
2.5
3

Time Per Session
0
200
400
600
800
1000
1200
1400
1600

Time Per Session: By Academic Division and Region
0
200
400
600
800
1000
1200
1400
1600
1800
A&H Soc Sci STEM

Time Per Session by LC Class
0
200
400
600
800
1000
1200
1400

Likelihood of High Use: Conclusions
• Views Per Session
– Lowest in Developing world
– Generally highest for STEM
• Copy/Paste Per Session
– Regional variations
– Generally highest for Social Sciences, lowest for STEM
• Downloads Per Session
– Highest in Developing world
– Generally highest for STEM
• Printing Per Session
– Regional variations
– Generally highest for STEM

Time Per Session
• Shorter in developing world
• Longest in Arts & Humanities
• Shortest in STEM

THE MOST HEAVILY-USED TITLES

Top 10%* of Titles with Sessions
• Worldwide– 45,350 titles (10.08%)
• 107 sessions or more
– 13,708,391 sessions (70.20% of all sessions)
– Available at 1,681 libraries on average
*Based on an earlier, smaller data set that did not include some of the unused titles

% of Sessions Represented by Top 10% of Titles
0.00%
10.00%
20.00%
30.00%
40.00%
50.00%
60.00%
70.00%
80.00%

Disciplinary Representation Within Top 10% of Titles Used
A&H32%
Soc Sci38%
STEM26%
Other4%
Titles
A&H28%
Soc Sci41%
STEM27%
Other4%
Sessions

Titles Available by Academic Division
30%
29%
29%
12%STEM (Q, R, S, T-TP, TS-TX)
Arts & Humanities (B-BD,BH-BX, C, D, E, F, M, N, P,TR)
Social Sciences (BF, H, J,K, L, U, V)
Other

Disciplinary Spread within Top 10% of Titles Used
0%
10%
20%
30%
40%
50%
60%
70%
80%
90%
100%
Other
A & H
STEM
Soc Sci

% of Sessions within Top 10% of Titles
0%
10%
20%
30%
40%
50%
60%
70%
80%
90%
100%
A & H Soc Sci STEM Other

% of Sessions Represented by Top 10% of Titles
65.06%
73.66%
70.69%
60.00%
62.00%
64.00%
66.00%
68.00%
70.00%
72.00%
74.00%
76.00%
A & H Soc Sci STEM

% of Sessions Represented by Top 10% of Titles
0.00%
10.00%
20.00%
30.00%
40.00%
50.00%
60.00%
70.00%
80.00%
A & H Soc Sci STEM

High-Use Titles: Conclusions
• Top 10% of titles represent 70% of sessions worldwide
• Social Sciences more heavily represented than in the data set as a whole
• Arts & Humanities more heavily represented, but accounts for fewer sessions than would be expected
– Usage spread more deeply across titles for A&H

INTENSIVE / EXTENSIVE USE

Breadth vs Depth
PERCENTAGE OF TITLES USED
AV
ERA
GE
AM
OU
NT
OF
USE

SESSIONS
Percentage of Titles in LC Class With Session
Ave
rage
Ses
sio
ns
Per
Titl
e

VIEWS
Percentage of Titles in LC Class With View
Ave
rage
Vie
ws
Per
Titl
e

DOWNLOADS
Percentage of Titles in LC Class With Download
Ave
rage
Do
wn
load
s Pe
r Ti
tle

COPIES
Percentage of Titles in LC Class With Copy
Ave
rage
Co
pie
s Pe
r Ti
tle

PRINTS
Percentage of Titles in LC Class With Print
Ave
rage
Pri
nts
Per
Tit
le

COMBINED
Sessions
Views
Downloads
Copies
Prints

SESSIONS
Percentage of Titles in LC Class With Session
Ave
rage
Ses
sio
ns
Per
Titl
e

VIEWS
Percentage of Titles in LC Class With View
Ave
rage
Vie
ws
Per
Titl
e

DOWNLOADS
Percentage of Titles in LC Class With Download
Ave
rage
Do
wn
load
s Pe
r Ti
tle

COPIES
Percentage of Titles in LC Class With a Copy
Ave
rage
Co
pie
s Pe
r Ti
tle

PRINTING
Percentage of Titles in LC Class With a Print
Ave
rage
Pri
nts
Per
Tit
le

COMBINED
Sessions
Views
Downloads
Copies
Prints

USAGE BY YEAR OF PUBLICATION

Titles Available
0
10000
20000
30000
40000
50000
60000
70000
80000
16
51
17
64
17
72
17
78
17
87
17
92
17
99
18
04
18
09
18
15
18
20
18
25
18
30
18
35
18
40
18
45
18
50
18
55
18
60
18
65
18
70
18
75
18
80
18
85
18
90
18
95
19
00
19
05
19
10
19
15
19
20
19
25
19
30
19
35
19
40
19
45
19
50
19
55
19
60
19
65
19
70
19
75
19
80
19
85
19
90
19
95
20
00
20
05
20
10
20
15
All Arts & Humanities STEM Social Sciences

Titles Available
0
5000
10000
15000
20000
25000
16
51
17
64
17
72
17
78
17
87
17
92
17
99
18
04
18
09
18
15
18
20
18
25
18
30
18
35
18
40
18
45
18
50
18
55
18
60
18
65
18
70
18
75
18
80
18
85
18
90
18
95
19
00
19
05
19
10
19
15
19
20
19
25
19
30
19
35
19
40
19
45
19
50
19
55
19
60
19
65
19
70
19
75
19
80
19
85
19
90
19
95
20
00
20
05
20
10
20
15
Arts & Humanities STEM Social Sciences

Titles Available by Publication Year, 2000-2015
0
10000
20000
30000
40000
50000
60000
70000
80000
2000 2001 2002 2003 2004 2005 2006 2007 2008 2009 2010 2011 2012 2013 2014 2015
All Arts & Humanities STEM Social Sciences

Titles Available by Publication Year, 2000-2015
0
5000
10000
15000
20000
25000
2000 2001 2002 2003 2004 2005 2006 2007 2008 2009 2010 2011 2012 2013 2014 2015
Arts & Humanities STEM Social Sciences

Titles with a Session by Publication Year, 2000-2015
0
5000
10000
15000
20000
25000
30000
35000
40000
45000
2000 2001 2002 2003 2004 2005 2006 2007 2008 2009 2010 2011 2012 2013 2014 2015
World A & H Soc Sci STEM

Titles with a Session by Publication Year, 2000-2015
0
2000
4000
6000
8000
10000
12000
14000
16000
2000 2001 2002 2003 2004 2005 2006 2007 2008 2009 2010 2011 2012 2013 2014 2015
A & H Soc Sci STEM

Sessions by Publication Year, 2000-2015
0
500000
1000000
1500000
2000000
2500000
2000 2001 2002 2003 2004 2005 2006 2007 2008 2009 2010 2011 2012 2013 2014 2015
World A & H Soc Sci STEM

Sessions by Publication Year, 2000-2015
0
100000
200000
300000
400000
500000
600000
700000
800000
900000
2000 2001 2002 2003 2004 2005 2006 2007 2008 2009 2010 2011 2012 2013 2014 2015
A & H Soc Sci STEM

Titles with Session vs Availability, by Date, 2000-2015

CONCLUSIONS

One Size Does Not Fit All
• Arts & Humanities– Highest likelihood a library with access to a title will make
use of it
• Social Sciences– Highest percentage of available titles used– Even higher percentage of overall sessions
• STEM– Most page views per session– Most downloads per session– Least amount of time in the book

Don’t Rely on a Single Measure of Use
• Comparing multiple factors tells a more complete story
– Actions per session
– Use relative to availability
– Intensive vs extensive use

Think Broadly
• All subjects get used
• Publication date does not appear to be a major factor

Questions?