leveraging adiabatic quantum computation for election … · mann machines using a quantum device....
TRANSCRIPT
Leveraging Adiabatic Quantum Computation for Election
Forecasting
Maxwell Henderson1, John Novak2, and Tristan Cook1
1QxBranch2Standard Cognition
Abstract
Accurate, reliable sampling from fully-connectedgraphs with arbitrary correlations is a difficult prob-lem. Such sampling requires knowledge of the prob-abilities of observing every possible state of a graph.As graph size grows, the number of model states be-comes intractably large and efficient computation re-quires full sampling be replaced with heuristics andalgorithms that are only approximations of full sam-pling. This work investigates the potential impactof adiabatic quantum computation for sampling pur-poses, building on recent successes training Boltz-mann machines using a quantum device. We inves-tigate the use case of quantum computation to trainBoltzmann machines for predicting the 2016 Presi-dential election.
1 Introduction
As the results of the 2016 US Presidential Electionwere finalized, it was clear that the majority of pro-fessional polling groups, many of whom had pre-dicted the probability of a Clinton victory to be wellover 90%, were had significantly overestimated theirpredictions ([1, 2, 3])). While it could be argued thatthe underlying models were correct and that the par-ticular result was just a very rare event, post-mortemanalyses have revealed flaws that led to large pre-diction biases. According to multiple post-electionanalyses, it was concluded that a leading cause of er-ror in the majority of election forecasting models wasa lack of correlation between individual states pre-dictions ([4, 5, 6, 7]). Uncorrelated models, thoughmuch simpler to build and train, cannot capture themore complex behavior of a fully-connected system.To capture these higher-order relationships, a fully-
connected graphical model would be ideal. Whilethese models are more powerful, practical roadblockshave prevented their widespread adoption due to dif-ficulties in implementation using classical computa-tion. However, recent studies have shown that quan-tum computing is a competitive alternative whengenerating such networks ([8, 9, 10, 11, 12]).
Quantum machine learning (QML) is a blossom-ing field. As summarized in the comprehensive re-view of QML in [13], machine learning applicationsfrom support vector machines to principal compo-nent analysis are being reimagined on various quan-tum devices. One of the most exciting research ar-eas within QML is deep quantum learning, which fo-cuses on the impact quantum devices and algorithmscan have on classical deep neural networks (DNNs)and graphical models. A particular class of DNNs isthe Boltzmann machine (BM), which is an incred-ibly powerful fully-connected graphical model thatcan be trained to learn arbitrary probability distri-butions. A downside of these networks is that BMsare incredibly costly to train, a fact that has limitedtheir practical application. This large computationaltraining cost has drawn attention to the implemen-tation of quantum computation to help train suchnetworks. BMs realized on quantum devices (partic-ularly adiabatic quantum devices such as those pro-duced by D-Wave Systems ([9]) may possess inherentbenefits compared to those realized on classical de-vices. Research groups have realized various formsof BMs (fully-connected BM, restricted Boltzmannmachines (RBMs), and Helmholtz machines) trainedusing quantum computation, and this research hasshown quantum computation can be used to effec-tively train neural networks for image recognitiontasks ([9, 11, 12]).
In this work, we will leverage the power of adia-batic quantum computation to efficiently train fully-
1
arX
iv:1
802.
0006
9v1
[qu
ant-
ph]
30
Jan
2018

connected BMs for the novel purpose of electionmodeling. Additionally, we have systematically ex-plored a number of the assumptions underlying theapproach of using adiabatic quantum computers(AQC) to model BMs, and we have demonstratedthat for most systems of interest (such as this one)the approach does appear to be valid. We believe themethods proposed in this paper could bring an in-teresting new factor into the conversation of electionforecasting at large, one in which quantum compu-tation could play a future role.
2 Methodology
2.1 Modeling Boltzmann Machineswith AQC
In this work, we will be generating fully-connectedBMs trained using a D-Wave 2X 1152 qubit quan-tum device using the general method described in[9]. While the methodology for training both RBMsand BMs using a D-Wave machine have been laidout in previous papers ([9, 11]), we will briefly re-view the logic and methodology here.
A BM is a fully-connected graph of (N) binaryunits (neurons). These neurons can be either “visi-ble” (directly model some aspect of a data distribu-tion) or “hidden” (not tied to any particular aspectof the data distribution and used only for captur-ing features from the data distribution). Each net-work has 2N possible states, and the probability ofsampling a particular state s = (s1, ..., sN ) from themodel is
p(s) =e−E(s)
Z, (1)
wherein Z it the well-known partition function andE is an energy function defined as
E(s) = −∑si∈s
bisi −∑
si,sj∈sWijsisj , (2)
wherein b represent the linear “bias” on each unitand W represents the “weight” of the coupling be-tween two units (b and W will be referred to as our“model parameters”). To properly train the net-work, we need to adjust the model parameters sothat the model distribution produced by repeatedlysampling the model is as close as possible to the un-derlying data distribution; more precisely, we wantto maximize the log-likelihood, L, of the data dis-tribution. To calculate the model parameters for
maximizing L, we use the familiar gradient descentmethod and learning rate η to get model parameterupdate equations
∆Wij =1
η
(〈sisj〉D − 〈sisj〉M
)(3)
∆bi =1
η
(〈si〉D − 〈si〉M
). (4)
In equations 3 and 4, the values inside 〈∗〉 representexpectation values over the data (D) and model (M)distributions. The model would be perfectly trainedif first (〈si〉) and second (〈sisj〉) order moments wereidentical for both the data and model distribution.
To properly adjust the model parameters we needto calculate expectation values over the model it-self. Getting the “true” values would thus require acalculation for all 2N possible states of the model,which is clearly intractable as the system size in-creases. These particular calculations are where theuse of quantum computation is ideal, and we see apotential for a speedup in our overall training algo-rithm.
The quantum devices produced by D-Wave Sys-tems perform a quantum annealing algorithm. Intheory, this algorithm can leverage quantum effectsto take an initial quantum system that is in a well-known ground state and transform this into a finalHamiltonian - one in which the system should stillbe in the ground state (assuming the annealing pro-cess was slow enough, as well as many other factorsdiscussed elsewhere [14]). The original use case ofthis algorithm lies in the fact that if you can prop-erly map a computationally difficult problem of in-terest into this final Hamiltonian, then measuringthe ground state of this final Hamiltonian shouldproduce the optimal solution to the original prob-lem. However, this use case has been elusive at scale;as shown in the research of [15], which focuses onfundamental limitations of quantum devices at fi-nite temperatures. Even taking some optimistic as-sumptions (such as perfect, instant thermalization),as the system (problem) size grows, the probabil-ity of measuring the optimal (ground) state of thesystem decreases exponentially. Rather than return-ing the ground state solution, repeatedly measuringfrom such a device returns a Boltzmann distributionof energies.
While these results prove challenging for usingsuch hardware for optimization, it presents an idealopportunity for training BMs. At a high level, in-
2

stead of trying to calculate 〈si〉M and 〈sisj〉M di-rectly, we can instead map our network onto the D-Wave quantum device. By obtaining a finite num-ber of samples from the hardware device, the goalis to generate better approximations of 〈si〉M and〈sisj〉M than classical heuristics. This method seemsall the more natural as the form of the HamiltonianH of the D-Wave device is
H(S) = −∑Si∈S
hiSi −∑
Si,Sj∈S
JijSiSj , (5)
which is the same functional form as the BM en-ergy in equation 2. In this equation, S is the vectorof qubit spin states, hi are the bias terms on eachqubit, and Jij are the (anti)ferromagnetic couplingsbetween the qubits. By mapping the model param-eters of a BM to the hardware parameters of a D-Wave device and making a set of measurements ofthe device, one can use these measurements to con-struct approximations of 〈si〉M and 〈sisj〉M . Ad-vantages have been shown in using fully-connectedBM on QC devices because using the methods of[9], the effective temperature of the device does nothave to be taken into account. Equation 1 is a spe-cial case of the more general representation; ratherthan raising the exponential to −E(s), the more gen-eral expression raises its to −E(s)β, where β is the“effective” temperature of the system (parameter re-lated to temperature of the system). If β = 1 thenwe arrive at equation 1, but in general when usinga quantum device one will not know the effectivetemperature beforehand, which can experience largefluctuations between measurements. While this canbe problematic for training RBMs using quantumannealers, and requires different techniques to esti-mate this parameter ([10, 8, 11]), fully connectedBMs do not require these additional calculations foreffective training ([9]).
Though the structure of the BM graph to embedon the device is fully connected, we are in practicelimited by the graph structure physically realizedin the hardware. The adiabatic quantum device weused for this research was a D-Wave 2X, which has1,152 qubits connected in a Chimera graph archi-tecture consisting of 8 qubit cells arranged as K4,4
bipartite graphs. The qubits within each cells arecross connected, and each cell is connected to fouradjacent cells (with the exception of cells along theboundaries) as shown in Figure 1. To properly mapthe BM energy function of (2) to the device, the
graph minor-embedding problem must be solved; weneed a hardware embedding which uses a chain ofmultiple physical qubits to realize a single logicalqubit in the problem Hamiltonian of (5). Using thesame method as [9], we find embeddings using theembedding heuristic provided by D-Wave’s API andresolve discrepancies of the qubit chains using ma-jority vote (a post-processing step of the measure-ments).
Figure 1: Four bipartite cells of a Chimera grapharchitecture showing how the cells interconnect. Ineach cell there are four horizontal and four verti-cal qubits, colored alternately blue and burnt orange.Within cells, where two qubits overlap they are cou-pled by means of a Josephson junction, indicated bygreen circles. Each qubit can be coupled to two ad-dtional qubits from adjacent cells, also by means ofJosephson junctions, indicated by light green circles.
2.2 Quantum Boltzmann Machinesfor Forecasting Elections
The methodology outlined in section 2.1 lays outour approach for training fully-connected BM usinga D-Wave quantum device. This section will detailour procedure for implementing these networks toforecast elections. In this research, we study theUS Presidential election, and each binary unit inthe BM represents a single US state. The winnerof a particular election simulation is determined by
3

the candidate with the most electoral college votes.Each US state has a particular number of electoralcollege votes to award to a candidate (2 + an integerwhich scales as a function of the state’s population),and these votes are awarded entirely to one candi-date (winner-take-all). We assert that each samplereturned from a fully-connected BM will in effectbe a simulation of a US presidential election. Eachsample from the BM returns a binary vector, whereeach entry in the vector corresponds to the vot-ing results of a particular US state. These individ-ual state voting results are mapped to a particularcandidate/party (i.e., 1 = Democrat, 0 = Republi-can). To determine the election simulation outcome,we weight each of these US state outcomes accord-ing to their net weight in the national vote (eachstate’s electoral votes). The winner of each simu-lation (sample) is determined by the sum of eachparty’s overall national vote, which is calculated us-ing the binary results (from sample) and nationalweight (electoral votes) for each state.
The goal is to train the BM which is being sam-pled from so that the first and second order mo-ment terms of the model distribution approach thoseof the data distribution. This training process hasalready been discussed in section 2.1, and in thissection we will expand on how we determined thefirst and second order moment terms for the datadistribution of our election model. The first ordermoment terms represent the probability that eachstate will vote for a particular candidate. As anexample, if we believe that there is a 80% chancethat the Democratic candidate wins Colorado, thenthe first order moment for the binary variable as-signed to represent Colorado should be equal to 0.8.To determine all the first order moments for eachstate in our model, we use the current time-averagedpolling results made publicly available on FiveThir-tyEight ([16]). We obtain a projected vote sharefor both candidates for each day that data is avail-able (6 months before, and including, November 8th2016). These projected vote shares are then usedas input to a sigmoidal model (same model usedby FiveThirtyEight [17]) which rightly assumes thatelections are stochastic, and that the result for eachstate/country follows a probabilistic rather than de-terministic curve based on the popular-vote / pro-jected vote share margin. This method for convert-ing a popular-vote margin to a probability of victoryis shown for a particular state in Figure 2.
Figure 2: Model for interpreting projected vote shareto probabilities. A. Plot of Maine’s polling projec-tions over time, where the solid lines are the time-averaged projected vote share for both candidates,and the dashed lines are the resulting probabilitiesof victory for each candidate, calculated using thebest fit function shown in B.
Given the underlying projected vote shares foreach state and the best fit function shown in Fig-ure 2B, calculating the first order moment termsfor each state is straightforward. Calculating thesecond order terms, the effective “correlations” be-tween states, is much more difficult. These correla-tions express the likelihood that two states will endup with the same (or different) voting result in anelection. States that vote the same are more cor-related (higher second order moment), and statesthat don’t have a lower correlation (lower second or-der moment). These correlations are influenced by aplethora of demographic (race, age, education), geo-graphic, and additional factors. Professional model-ers (such as those at FiveThirtyEight) have com-plex methodologies for determining these correla-tions; however, a rigorous analysis of these corre-
4

lations is outside the scope of this particular work.We used data obtained publicly, which is sufficientto validate the general approach of our model.
To calculate the second order moment terms, weuse one source of data and make two particularansatz. The data source we use is presidential elec-tion results from the last 11 US Presidential elec-tions. This data contains the date and results perstate for each election. Our first ansatz is that if weconsider two states, these states should have highercorrelations (second order terms) if they had votedsimilarly in previous elections. This correlation isagnostic towards which candidate was voted for ineach of these previous elections; the only importantfactor for the two states in question is if the votewas for the same candidate or a different one. Thesecond ansatz is that in terms of weighting previ-ous election results, more recent elections are morerelevant. This means recent elections increase corre-lations between two states more than those that hap-pened longer ago. We assume a linear relationshipbetween time and importance. The raw correlations〈sisj〉Draw between states i and j are calculated asfollows:
〈sisj〉Draw=
∑n=1:11 n
(2injn − in − jn + 1
)∑n=1:11 n
(6)
wherein n refers to a particular election year in theset [1968, 1972, ... , 2008, 2012] (higher n is more re-cent) and in and jn are the results for election n forboth respective states. We then enforce a hard con-straint that second order correlations should nevercontradict first order moments (which are calculateddirectly from current polling data). This is accom-plished by finally calculating the second order mo-ments between states i and j as
〈sisj〉D = 〈sisj〉Drawmin(〈si〉D, 〈sj〉D). (7)
We have now a methodology for mapping electionforecasting models, specifically the 2016 US Pres-idential election, to BM by defining mathematicalmodels for calculating both first and second orderdata distribution terms. In the following section,we validate that this approach holds true for small,nonexistent countries and then attempt to simulatea “real time” forecast for 2016 Presidential electionusing quantum-trained BMs.
2.3 Caveats and limitations
In section 2.1 and 2.2, we reviewed the methodologyfor training fully-connected BM with a D-Wave ma-chine as well as describe our approach for mappingelection forecast models to the (to be trained) BM.While this work uses this approach as described, afew caveats and limitations deserve some additionalattention here.
2.3.1 Hardware constraints
The hardware size limitations of the D-Wave 2X doesnot allow us to fully embed a 50 state model as wellas the DC province, which are the 51 fundamen-tal voting blocks for the US Presidential election.Using the virtual full-yield Chimera capability of-fered by D-Wave, which uses a combination of thequantum device hardware in tandem with classicalsoftware for simulating missing qubits and couplers,we were able to embed 49 states and omitted DCand Maryland. These were omitted because theywere ranked as the most “definite” by model stan-dards (both were approaching 100% likelihood tovote Democrat), as well as geographically adjacent.
2.3.2 Assert that all states are winner-take-all
While the US Presidential election is winner-take-all at the state level, two states are exceptions tothis rule: Maine and Nebraska. Instead of winner-take-all, these states award delegates by district. Tosimplify the model and fit within the hardware con-straints, we treat these states as winner-take-all re-gardless. This decision was made for three reasons.First, the primary purpose of this paper is to val-idate the overall election methodology for model-ing such elections using QC-trained neural networks;such state specific rules fall outside this scope ofthis work. Second, these states have small weight(electoral college votes) in the broader election, sotreating them as winner-take-all has a reduced ef-fect compared to a much larger state under the samevoting system. Third, in the future we could treatthe provinces as individual states themselves, eachawarding electoral college votes with a winner-take-all system. However, due to our limitation alreadyexpressed in the previous issue, this experiment willbe left to future studies on a larger quantum device.
5
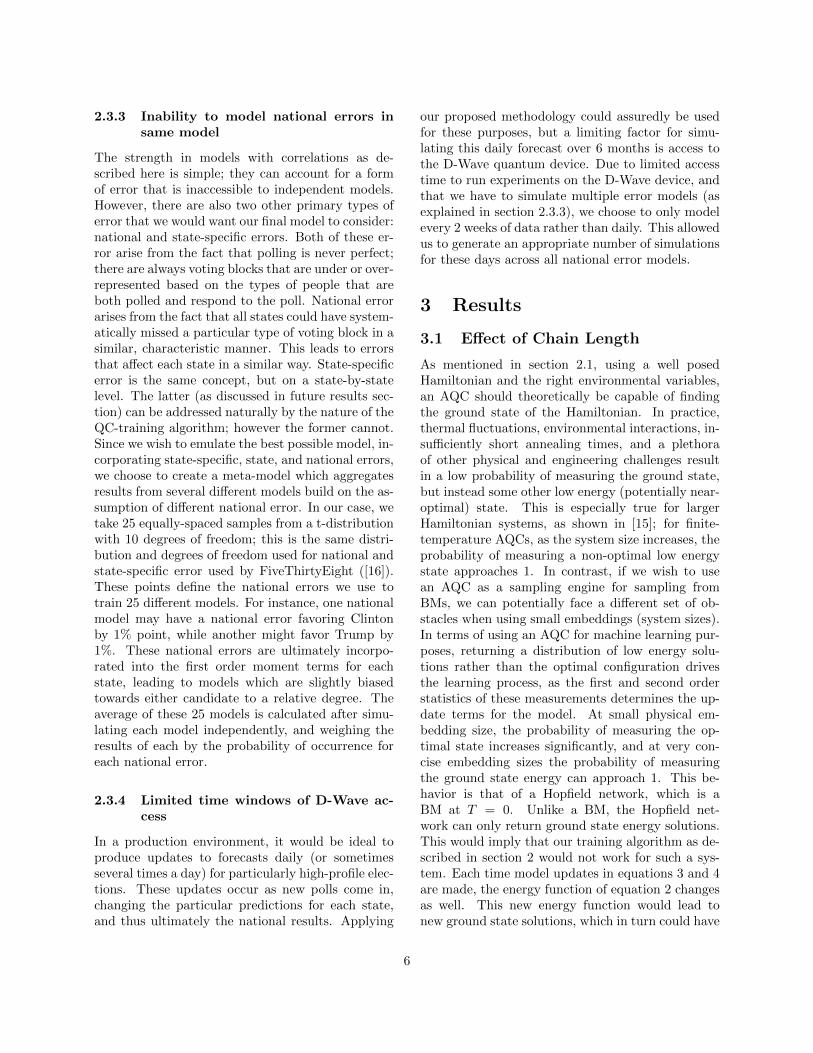
2.3.3 Inability to model national errors insame model
The strength in models with correlations as de-scribed here is simple; they can account for a formof error that is inaccessible to independent models.However, there are also two other primary types oferror that we would want our final model to consider:national and state-specific errors. Both of these er-ror arise from the fact that polling is never perfect;there are always voting blocks that are under or over-represented based on the types of people that areboth polled and respond to the poll. National errorarises from the fact that all states could have system-atically missed a particular type of voting block in asimilar, characteristic manner. This leads to errorsthat affect each state in a similar way. State-specificerror is the same concept, but on a state-by-statelevel. The latter (as discussed in future results sec-tion) can be addressed naturally by the nature of theQC-training algorithm; however the former cannot.Since we wish to emulate the best possible model, in-corporating state-specific, state, and national errors,we choose to create a meta-model which aggregatesresults from several different models build on the as-sumption of different national error. In our case, wetake 25 equally-spaced samples from a t-distributionwith 10 degrees of freedom; this is the same distri-bution and degrees of freedom used for national andstate-specific error used by FiveThirtyEight ([16]).These points define the national errors we use totrain 25 different models. For instance, one nationalmodel may have a national error favoring Clintonby 1% point, while another might favor Trump by1%. These national errors are ultimately incorpo-rated into the first order moment terms for eachstate, leading to models which are slightly biasedtowards either candidate to a relative degree. Theaverage of these 25 models is calculated after simu-lating each model independently, and weighing theresults of each by the probability of occurrence foreach national error.
2.3.4 Limited time windows of D-Wave ac-cess
In a production environment, it would be ideal toproduce updates to forecasts daily (or sometimesseveral times a day) for particularly high-profile elec-tions. These updates occur as new polls come in,changing the particular predictions for each state,and thus ultimately the national results. Applying
our proposed methodology could assuredly be usedfor these purposes, but a limiting factor for simu-lating this daily forecast over 6 months is access tothe D-Wave quantum device. Due to limited accesstime to run experiments on the D-Wave device, andthat we have to simulate multiple error models (asexplained in section 2.3.3), we choose to only modelevery 2 weeks of data rather than daily. This allowedus to generate an appropriate number of simulationsfor these days across all national error models.
3 Results
3.1 Effect of Chain Length
As mentioned in section 2.1, using a well posedHamiltonian and the right environmental variables,an AQC should theoretically be capable of findingthe ground state of the Hamiltonian. In practice,thermal fluctuations, environmental interactions, in-sufficiently short annealing times, and a plethoraof other physical and engineering challenges resultin a low probability of measuring the ground state,but instead some other low energy (potentially near-optimal) state. This is especially true for largerHamiltonian systems, as shown in [15]; for finite-temperature AQCs, as the system size increases, theprobability of measuring a non-optimal low energystate approaches 1. In contrast, if we wish to usean AQC as a sampling engine for sampling fromBMs, we can potentially face a different set of ob-stacles when using small embeddings (system sizes).In terms of using an AQC for machine learning pur-poses, returning a distribution of low energy solu-tions rather than the optimal configuration drivesthe learning process, as the first and second orderstatistics of these measurements determines the up-date terms for the model. At small physical em-bedding size, the probability of measuring the op-timal state increases significantly, and at very con-cise embedding sizes the probability of measuringthe ground state energy can approach 1. This be-havior is that of a Hopfield network, which is aBM at T = 0. Unlike a BM, the Hopfield net-work can only return ground state energy solutions.This would imply that our training algorithm as de-scribed in section 2 would not work for such a sys-tem. Each time model updates in equations 3 and 4are made, the energy function of equation 2 changesas well. This new energy function would lead tonew ground state solutions, which in turn could have
6

completely different model parameters. While train-ing a BM leads to model updates “smoothly” guid-ing the model parameters (〈si〉M , 〈sisj〉M ) towardsthe data distribution (〈si〉D, 〈sisj〉D), slight changesin the model parameters of a Hopfield network cancompletely change the ground state solutions, lead-ing to chaotic model parameter updates.
Figure 3: Training results for arbitrary Boltzmannmachines realized on D-Wave device using (A) 1xand (B) 2x embedding qubit embedding chains. Ineach subplot, the horizontal red lines are the respec-tive target values.
One potential way to mitigate these effects is todeliberately increase the size of the qubit chains forembedding the problem. For optimization purposes,the goal would be to find the minimum chain lengthfor embedding the problem Hamiltonian onto thephysical device. By keeping the embedding chainsminimal, the system size is as small as possible whichincreases the chance of measuring an optimal groundstate. The opposite should be true as well: themore we increase the chain lengths for embeddingthe logical qubits onto the hardware, the more lowenergy states become available to system, increasingthe probability that the system will transition awayfrom the ground state during the annealing process.This should enable one to properly train BM for anynumber of nodes, given that the qubit chain lengthsare long enough. By validating this assertion, wecan argue that our approach here for using AQCfor realizing BMs for election modeling could be ap-plied to any sized system, as well as validate that ourparticular experiments are in a regime where properlearning is possible.
To test this hypothesis, we performed experimentswith fully connected graphs of size 5 through 9, em-bedded with three different embeddings of variouschain lengths, and studied how well we could trainthe systems to reproduce activation probability dis-tributions defined by graphs with arbitrary first andsecond order terms. For each run, the activation (hi)and correlation (Ji,j) probabilities were selected ran-domly such that for node i the activation probabilityhi ∈ (0, 1) and for two nodes i and j, the correlationprobability Ji,j = ci,jhihj where ci,j is the correla-tion strength and ci,j ∈ (0, 1).
Three embeddings were used for each graph: amaximally concise embedding, an embedding de-rived from a maximally concise graph of twice asmany nodes (denoted by “2x”), and an embeddingderived from a maximally concise graph of threetimes as many nodes (denoted by “3x”). The de-cision to approach the problem in this way was donebecause the D-Wave API has been set up for op-timization problems, and as such the hardware em-bedding functions in general attempt to return max-imally concise embeddings. The 2x and 3x embed-dings returned from the API were for graphs of 2xand 3x the size of the problem graph, so they werereduced to the correct size by joining the physicalqubits representing pairs (in the case of 2x) andtriples (in the case of 3x) of logical qubits (usuallyrepresented by chains of physical qubits) into single
7

logical qubits of chains of physical qubits 2x and 3xtimes as long as in the original embedding. An ex-ample of training by the shortest (1x) and medium(2x) chain lengths are shown in Figure 3.
For all the subgraphs of Figure 3, the x-axis ofeach graph is the number of completed iterations inthe training algorithm while the y-axis is the acti-vation probability when sampling the graph multi-ple times. The graphs on the diagonal are singlenode activation probabilities(first order moments)and the off-diagonal graphs are the two node cor-relations (second order moments). In Figure 3A,the activation probabilities fail to converge to thedesired values, indicating that the qubit chains arenot allowing sufficient degrees of freedom for the sys-tem to model a Boltzmann machine. However, usingthe same network but with the 2x embedding qubitchains, the network was able to converge over timetowards the target first and second order momentvalues. In Table 1, we show the root mean squarederror (RMSE) for training iterations 191-200 for dif-ferent QC-trained networks at different embeddingchain lengths.
Nodes Chain RMSE5 1x 0.437 ± 0.0725 2x 0.106 ± 0.0365 3x 0.060 ± 0.0389 1x 0.149 ± 0.1019 2x 0.038 ± 0.0289 3x 0.045 ± 0.034
Table 1: RMSE for QC-trained networks at differ-ent embedding chain lengths. As the networks growlarger, the chain length differences grows more negli-gible as chains are naturally getting longer to satisfythe embedding.
Given the current D-Wave qubit connectivitygraph, as the problem size grows larger, the averageembedding chain length similarly grows. As moststudies embed as large a problem as possible ontothe device, this has naturally led to longer chainlengths in previous research. As future hardwareimprovements are made and shorter qubit chains arefeasible (through increased connectivity), it may be-come important to validate that the individual log-ical qubits are properly learning the respective tar-get terms. The lengthening technique shown herecould provide a simple but efficient tool for ensuringBoltzmann-like behavior for all nodes in the logical
graph without having to perturb any of the individ-ual energy scalings.
3.2 Modeling the Presidential Elec-tion
The primary experiment we conducted was to at-tempt to simulate a “real-time election model fore-cast” using QC-trained Boltzmann machines. Start-ing on the date 2016-06-08 and continuing until elec-tion day 2016-11-08, we trained multiple fully con-nected Boltzmann machines using the D-Wave adi-abatic device.
Figure 4: Summed error as a function of trainingiterations for one national error model. The smallspikes of error occur deep into the training processare simply an artifact of the updates in the first or-der moments that happen at 2 week (25 iteration)intervals.
As mentioned in section 2.3.3 and 2.3.4, due tolimitations we retrained the network every two weeksrather than daily, and used 25 different networks tomodel different national errors (derived from a t-distribution with 10 degrees of freedom). The net-works starting on 2016-06-08 were initialized withsmall, random coefficients and then subsequentlytrained for 150 iterations each. Then, at each 2 weekinterval, the first order moment terms were updatedand trained for an additional 25 iterations. Thechanges to the first order moments were small, sofewer training iterations were necessary to convergeto a stable summed error (sum of squared first andsecond moment errors) across the networks. Thisled to 400 total training iterations per national er-ror (150 for 2016-06-08 + 25*10 for the next ten
8

Figure 5: Comparing 2016 Presidential election forecasting results from QC-trained methodology to thoseof FiveThirtyEight. QC-trained networks each had a national bias towards Clinton (CB), Trump (TB), orneither candidate.
two-week updates). An example of the training er-ror for a particular national error model is shown inFigure 4.
Knowing from section 3.1 that our qubit chainsare sufficiently long enough to learn properly, thetraining error results of Figure 4 are to be expected.Similar plots were observed across all national errormodels, as this translates into nothing more thanscaling the first order moment terms. We can thentake the samples from these networks at differentiterations as our election forecasting simulation re-sults. We choose to take samples for the last 10iterations of each forecasting date (this would be it-erations 141-150 for 2016-06-08 and 16-25 for thenext 10 forecasting dates). This allows us to sam-ple from the network once it has reached a generalsteady-state in terms of summed training error. Asdiscussed in section 2.2, each logical qubit is mappedto a particular state and each sample is equivalent toan election forecast. To determine which candidate“won” a particular sample, we simply map the qubitresults back to the particular state it represents, andadd each state’s number of electoral votes to the can-didate that state voted for in the sample. Since thedemocratic candidate was the heavy favorite in mostelection models, we choose to express our forecast-ing results in terms of the probability of a Clinton
victory. In this way, each sample results in a partic-ular candidate winning (270 electoral votes or more)or losing (we combined ties into this category forsimplicity, although an exact tie is very unlikely).For our experiments, we took 1,000 samples fromthe D-Wave device at every iteration for each na-tional error model. This gave us 10,000 samples foreach national error model for each forecasting date(10 training iterations, 1,000 samples per trainingiteration). The probability of a Clinton victory foreach national error model was simply the sum ofthe individual samples which were won by Clintondivided by the number of total samples (10,000 inour case, per national error model and time step).Finally, to get an average election forecast as a func-tion of time (shown in Figure 5), we calculated theweighted arithmetic mean across all national errormodels for each forecasting date. The weights foreach national error were defined as the t-distributionprobability density function of each national error(t-distribution with 10 degrees of freedom).
As evidenced in Figure 5, the QC-trained networkresults followed trends similar to the trends of theprofessional FiveThirtyEight forecasts. The overallprobabilities of the different national error networksalso follows naturally; networks that had a nationalerror in favor of Clinton increased the probability
9

of a Clinton victory, and networks with a nationalerror in favor of Trump decreased the probabilityof a Clinton victory. The largest apparent differ-ence between the QC-trained models was the overallprobability of a Clinton victory. While the Aver-age result line of the QC-trained networks follows avery similar pattern to the predictions of FiveThir-tyEight, the QC-trained results are almost uniformly20% lower. This result in no way says the quan-tum methodology is “better”, but rather highlightsthe differences in the overall approach. It is likelythat these results are mostly dependent on the un-derlying differences in how we calculated our sec-ond order moments terms between the states. Aninteresting future study would be to replicate thequantum-training protocol described here but usingsecond order moments driven by demographic dataof the individual state inhabitants.
An important factor forecasters also desire froma forecasting model is to know which states are themost important for predicting a particular outcome.A straightforward approach is to generate a vectorfor each state (1 = state voted Democrat, 0 = statevoted Republican) and a similar vector for the out-come (1 = Democratic victory, 0 = Republican vic-tory) of each simulation for the date November 8,2016. Then, we can calculate the Pearson correla-tion coefficient between the two vectors and take theabsolute value of these correlations. Table 2 showsthe 10 states with the highest and lowest correlationcoefficients. As expected, states that leaned heavilyDemocratic or Republican had very low correlationcoefficients; regardless of the outcome of the election,states like Illinois and Nebraska were virtual locks forthe Democratic and Republican candidates, respec-tively. Similarly, the states with the highest corre-lation coefficients contained many of the most con-tested states in the election. FiveThirtyEight’s fore-casts have a similar “tipping-point chance” metricwhich they define as “the probability that a state willprovide the decisive vote in the Electoral College”([16]). On election day, 7 out of the 10 states theyranked as the highest tipping-point chance stateswere similarly in the list of 10 most correlated statesin Table 2 (the differences: FiveThirtyEight includedVirginia, Minnesota, and Wisconsin, while ours in-cluded New Hampshire, Iowa, and Arizona).
Finally, we take into consideration the individualstate errors observed in our QC-trained models. Asmentioned previously, modelers (such as FiveThir-tyEight) will apply some degree of noise for individ-
State Correlation coefficientsOhio 0.204
Florida 0.163Nevada 0.178
New Hampshire 0.167Pennsylvania 0.155
Iowa 0.152Michigan 0.145
North Carolina 0.137Colorado 0.130Arizona 0.127Illinois 0.002
Nebraska 0.004Alabama 0.005
Oklahoma 0.006California 0.008
West Virginia 0.008Delaware 0.008Oregon 0.009Idaho 0.015
Arkansas 0.016
Table 2: Pearson correlation coefficients for the 10states most (top) and least (bottom) correlated withthe election forecasting results.
ual states, such as adding in state-specific error fromsampling. It would be useful to know how the natu-ral sampling of the quantum device during traininglends itself to state-specific error. For each iterationthat we used for determining the national averages,we calculated the difference between the target 〈s〉Dand current model output 〈s〉M . If this difference isnegative, this would be a state-specific error in fa-vor of the Democratic candidate, and vice versa apositive value translates to error benefiting the Re-publican candidate. By taking all these errors perstate, we can form different state-specific error dis-tributions per state. These distributions vary con-siderably, depending on the underlying target 〈s〉Dvalue, as evidenced in Figure 6.
At the extremes, we see that the error distribu-tions of states leaning heavily Democratic or Repub-lican are asymmetrical. This occurs naturally, dueto 〈s〉M being bound between 0 and 1. If 〈s〉D ≈ 0(state leaning heavily Republican), all error will bebiased in the negative direction; similarly, stateswith 〈s〉D ≈ 1 (state leaning heavily Democrat) willhave positively-biased error distributions. For swingstates, we see a much more uniform spread of error,which shows that in the absence of bounds (〈s〉D ≈
10

0 or 1), the error tends to be equally distributed.
Figure 6: Example distributions of state-specificerror for states leaning heavily Republican (top),Democratic (bottom), or swing states (middle).
One interesting finding was that heavily-learningDemocratic states seemed to have longer error dis-tribution tails compared to the heavily-leaning Re-publican states. As seen in Figure 6, while almost allthe probability mass of Alabama’s error distributionis contained within the range -5 to 5, a substantialamount of California’s error distribution falls out-side these bounds. This phenomena can introducean amount of bias in favor of one particular candi-date. One potential mitigation technique for deal-ing with this issue is taking the average of multiplegauges ([11]), some of which could “flip” the mea-surement value (flip Republican = 1, Democrat =0). Additionally, some interesting new techniquesusing “shimming” ([18]) have been shown to reduceoverall qubit error. In future work, it would be an in-teresting topic to explore the evolution of individuallogical qubit error distributions in QC-trained Boltz-
mann machines by using shimming techniques (re-ducing error) or introducing random noise (increas-ing error) on a per-qubit basis.
4 Conclusions
In this work, we have showed an initial implementa-tion of QC-trained Boltzmann machines, which canbe employed for the difficult task of sampling fromcorrelated systems, an essential problem at the heartof many applications such as election forecast mod-eling. We validated that this approach successfullylearned various data distributions based on statepolling results during the 2016 US Presidential cam-paign, and these QC-trained models generated fore-casts that had similar structural properties and out-comes compared to a best in class election modelinggroup. While quantum computers and samplers arean emerging technology, we believe this applicationarea could be of near-term interest. This methodol-ogy could be an interesting technique to bring to thebroader conversation of modeling in future electionforecasts.
References
[1] Survey finds Hillary Clinton has ‘more than99% chance’ of winning election over DonaldTrump, http://www.independent.co.uk/, 2016.
[2] The Huffington Post Presidential Forecast,http://elections.huffingtonpost.com/2016/fore-cast/president, 2016.
[3] Key model predicts big election win for Clinton,http://money.cnn.com/2016/11/01/news/econ-omy/hillary-clinton-win-forecast-moodys-analytics/index.html, 2016.
[4] How the polls, including ours, missed trump’svictory, http://www.reuters.com/article/us-usa-election-polls-idUSKBN1343O6, 2016.
[5] Analysis: Early thoughts about whatwent wrong with the election polls,http://www.wbur.org/politicker/2016/11/09/pollster-early-thoughts, 2016.
[6] The devil in the polling data,https://www.quantamagazine.org/why-nate-silver-sam-wang-and-everyone-else-were-wrong-part-2-20161111/, 2016.
11

[7] Epic fail, http://www.economist.com/news/united-states/21710024-how-mid-sized-error-led-rash-bad-forecasts-epic-fail, 2016.
[8] J. E. Dorband, ArXiv e-prints (2016),1606.06123.
[9] M. Benedetti, J. Realpe-Gomez, R. Biswas, andA. Perdomo-Ortiz, Phys. Rev. X 7, 041052(2017).
[10] M. Benedetti, J. Realpe-Gomez, R. Biswas, andA. Perdomo-Ortiz, Phys. Rev. A (2016).
[11] S. H. Adachi and M. P. Henderson, ArXiv e-prints (2015), 1510.06356.
[12] M. Benedetti, J. Realpe-Gomez, andA. Perdomo-Ortiz, ArXiv e-prints (2017),1708.09784.
[13] J. Biamonte et al., Nature 549, 195 (2017).
[14] E. Farhi et al., Science 292, 472 (2001).
[15] T. Albash, V. Martin-Mayor, and I. Hen, Phys.Rev. Lett. 119, 110502 (2017).
[16] A user’s guide to fivethirtyeight’s2016 general election forecast,https://fivethirtyeight.com/features/a-users-guide-to-fivethirtyeights-2016-general-election-forecast/, 2016.
[17] FiveThirtyEight, Election update: Clin-ton’s big lead means a steadier forecast,https://fivethirtyeight.com/features/election-update-clintons-big-lead-means-a-steadier-forecast/, 2016.
[18] S. Adachi, Qubit bias measurement and correc-tion, D-Wave Users Conference, 2017.
12