level of patient satisfaction with inpatient services and
TRANSCRIPT

Review ArticleLevel of Patient Satisfaction with Inpatient Services and ItsDeterminants: A Study of a Specialized Hospital in Ethiopia
Nebsu Asamrew,1 Abduilhafiz A. Endris ,2 and Musse Tadesse2
1Health Service Quality Directorate, Addis Ababa Regional Health Bureau, Addis Ababa, Ethiopia2Public Health Emergency Management Center, Ethiopian Public Health Institute, P.O. Box: 1242, Addis Ababa, Ethiopia
Correspondence should be addressed to Abduilhafiz A. Endris; [email protected]
Received 18 September 2019; Revised 24 July 2020; Accepted 31 July 2020; Published 13 August 2020
Academic Editor: Jonathan Haughton
Copyright © 2020 Nebsu Asamrew et al. +is is an open access article distributed under the Creative Commons AttributionLicense, which permits unrestricted use, distribution, and reproduction in any medium, provided the original work isproperly cited.
Background. +e health care industry is undergoing a rapid transformation to meet the ever-increasing needs and demands of itspatient population. Level of patients’ satisfaction is an important health outcome, which is regarded as a determinant measure forquality of care. +is study was performed with the aim of assessing the level of patient satisfaction with inpatient services and itsdeterminants in Black Lion Specialized Hospital, Addis Ababa, Ethiopia. Methods. A facility-based cross-sectional study wasconducted from November 25th to December 20th, 2015, using 398 randomly selected patients. Ethical clearance was obtainedfrom the Jimma University research review board, and verbal consent was also received from the study participants during datacollection time. A pretested structured interview questionnaire was used to collect data from study participants.+e collected datawere handled by using SPSS statistical software. Before analysis, relevant explanatory variables were identified using factor analysiswith varimax rotation, and bivariate analysis was carried out using linear regression for every independent variable with theoutcome variable independently. Explanatory variables scoring p value <−0.05 were used for the final model after checking theassumption. Study findings are presented by using tables, graphs, and description. Results. A total of 398 patients were participatedin the study, yielding a response rate of 100%. A total of 46.2% (95% CI: 41.2%–51.1%) patients were satisfied by the services theyreceived in the hospital. Patient and health care provider interaction and general facility amenity-related domains were found toexplain 96.4% of the variability in the net overall satisfaction score. Good quality services provided by hospital physicians,availability of laboratory and radiology services, pain management services, and inpatient pharmacy services of the hospital hadpositive influences. Besides toilet cleanliness, availability of rooms for accommodation and dietary service had significant relationwith level of patient satisfaction. Quality of the inpatient pharmacy service had a great influence on satisfaction; a unit increase in itresulted in 2.3 (95% CI: 2.1–2.5) times increment in patient satisfaction level at p≤ 0.001. For final predictors, regression estimatesfor level of satisfactionmoved from very dissatisfied to very satisfied when service improves by a unit. Conclusion. Overall patients’satisfaction is lower than other studies in the nation. A great opportunity is there to improve patient’s satisfaction level if theservice quality is improved around the time of patient and health care provider interaction and facility amenity services. Besides,improving the health literacy of service providers and devising a strategy to routinely assess satisfaction level of patients in thefacility is critical. On top of this, providing tailored on-the-job training for health care workers in the facility is a crucial step inorder to improve their knowledge and skills to render patient-centered quality service to improve their patients’ satisfaction. Usinga checklist during service delivery may improve client patient interaction and ensure the standard. Facility design dimension canbe considered for future research activities.
1. Background
1.1. Introduction. Health care quality is becoming a globalissue, which occasioned the health care industry to undergoa rapid transformation to meet the ever-increasing needs
and demands of its patient population [1, 2]. Quality ofhealth services was traditionally based on professionalpractice standards; however, over the last decade, patient’sperception about health care has been predominantly be-coming an important indicator for measuring the quality of
HindawiJournal of Environmental and Public HealthVolume 2020, Article ID 2473469, 12 pageshttps://doi.org/10.1155/2020/2473469
health care [3]. On top of this, patient satisfaction is be-coming a critical component of performance improvementand clinical effectiveness [2, 4–6].
Recent practices in the health system showed that healthauthorities are considering the patient as the best judge whoaccurately assesses and provides inputs to help in the overallimprovement of quality health care provision through therectification of the system weaknesses [1, 2, 6]. +e regu-latory and accreditation mandates imposed by agencies suchas the Joint Commission on Accreditation of HealthcareOrganizations (JCAHO) and the National Committee onQuality Assurance (NCQA) showed that quantifiable patientsatisfaction data as a critical component of performanceimprovement and clinical effectiveness programs are re-quired [7, 8].
Patient satisfaction, which is a perception and an attitudethat a consumer can have or view towards a total experienceof health care, is a multidimensional aspect, which repre-sents a vital key marker for the quality of health care delivery[1, 2, 4, 9]. Furthermore, level of patient satisfaction is aninternationally accepted factor, which needs to be studiedroutinely to complement other methods of quality assess-ment and assurance for smooth functioning of the healthcare system [2, 3, 5, 9–11]. +is wholistic approach can helpto better meet patients’ needs and improve quality of healthservice delivery by identifying and understanding of itsdeterminants through a continuous quality improvementprocess [3, 10, 12].
Various dimensions of patient satisfaction have beenidentified, health care services ranging from admission todischarge process, waiting time to receive care, as well asfrom medical care to interpersonal communication [13–16].It has also been reported that the interpersonal and technicalskills of health care provider are the two unique dimensionsinvolved in a patient assessment of hospital care [17–20].General amenities of the facility in terms of availability, itsquality, and structural design were also among the identifieddimensions, which significantly affect the patient satisfactionlevel [2, 21, 22].
Additionally, sociodemographic and economic status ofthe patients and their expectations of care and attitudestowards the health care system were among the dimensionsidentified to have direct influence on satisfaction level; otherpsychosocial factors, including pain and depression, are alsoknown to contribute to patient satisfaction level scores[9, 23–29].
In Ethiopia, the health care services are limited and ofpoor quality, which is a direct reflection of the countriessocioeconomic status.+is takes the lion share for the highermorbidity and mortality of the population due to theemerging and reemerging infectious and chronic healthproblems in the nation. +e lower life expectancy rate of thepeoples in the nation is a clear indication for this.
Considering this major bottleneck for the health system,the Ethiopian government has focused on improving thehealth care organizations and quality of health service de-livery to the population in recent years. In such effortstowards improving the quality health care service delivery,measuring the level of patient satisfaction is an integral
component of the health system for continuous qualityimprovement process [30]. On top of this, following in-creased levels of competition and the emphasis on con-sumerism, measuring patient satisfaction has become animportant measurement for monitoring health care per-formance of health plans.
+erefore, this study is aimed at measuring the level ofpatient satisfaction and its determinants in one of thespecialized hospitals in Addis Ababa so as to identify thecritical dimensions, which has a greater influence on patientsatisfaction level related to inpatient services in Ethiopiancontext.
1.2. Justification of the Study. In the context of Ethiopianhealth sector reform, health facilities are striving to improvethe efficiency, effectiveness, and quality of services provided.Among the range of indicators that has been used tomeasurequality health service delivery and to track its change overtime in Ethiopia, routine measuring of patient satisfactionlevel for improvement is the recommended approach forhealth care providers at all level [30]. On top of this, im-proving the patient’s satisfaction level by identifying themajor responsible factors for improvement is the integralcomponent of continuous quality improvement process andefficient way.
It is generally agreed that satisfaction data’s play a sig-nificant role in improving the strategy and tactics of healthcare providers in delivering health care services for clients.In addition to its role in improving quality health servicedelivery, measurement of patient satisfaction plays an im-portant role in the growing push toward accountabilityamong health care providers, which has a significant role indeveloping and delivering high-quality health care in thehospital with the involvement of patients in the managementof their problem and treatment [9, 11, 31]. It is also viewed asan established indicator for quality of care, despite it wasovershadowed by measures of organizational aspects in thequality of health care equation [30].
Different studies also indicated that a satisfied patienthas complied with the medical treatment prescribed, serviceprovider recommendation, and continually using medicalservices at a specific health provider, which might result withthe enhanced disease healing process and healthier andhappier clients, who are contributing to the development ofthe country [14, 32].
2. Methods
2.1. Study Setting, Sample Size, and Sampling Procedures.+is study was conducted at one of the specialized gov-ernmental hospitals in Addis Ababa, Ethiopia, aimed atassessing the level of patient satisfaction and its determi-nants. A facility-based cross-sectional study design wasapplied to understand patient’s satisfaction level by theservices provided in the facility. All admitted patients atBlack Lion Specialized Hospital during the study periodwere used as source population for this study. All admittedpatients at different wards who stayed for 48 hrs and above
2 Journal of Environmental and Public Health
during the time of data collection were the study population.During the data collection, patients who were selected andfulfilled the inclusion criteria for the study among the ad-mitted patients were included in the study. +ose seriouslyill, laboring mothers, and pediatric patients without parents/guardian were excluded from the study.
+e total sample size of this study was determined usinga single population proportion formula by taking the as-sumptions that the overall net patient satisfaction to be 62%[33], 95% CI and a 5% margin of error (d), and expected anonresponse rate of 10%. +is resulted in a total of 398samples for the study. Available bed capacity of wards andavailable patients during the study period was used to al-locate the total sample size in each ward to ensure theproportional allocation of samples from all service providingward of the hospital. Health Management InformationSystem (HMIS) report of the hospital made on October 2015was used to know the total available beds per ward andestimate the patients per ward. Systematic random samplingtechnique was used to ensure the random selection ofparticipants with every three intervals to recruit studyparticipants. Lists of patients from the patient register of anindividual ward were used as the sampling frame forselection.
2.2. Study Variables
2.2.1. Dependent Variables. Level of patient satisfaction withinpatient service was considered the dependent variable.
2.2.2. Independent Variables
(i) Sociodemographic variables
Sociodemographic variables including sex, age,marital status, living with status of the studyparticipant, educational status, occupational sta-tus, religion, ethnicity, permanent residence of thepatient, and financial income status of the re-spondents were considered. Besides, presence ofcaretaker during hospital admission was alsoconsidered.
(ii) Service utilization-related information variables
Information regarding waiting time to get requiredservice in the facility (as stated by the participant),official visiting hours of the facility, information’sreceived regarding the services provided by thehospital, admitting processes of the hospital forinpatient service, activities performed to ensureprivacy of the patient, measures taken to assureconfidentiality, and availability of signboardsdisplayed inside the hospital were collected.
(iii) Patient and health care provider interactionvariables
Health education provided by health workers,nursing care received during their stay, perceivedquality of physician service received, quality of
inpatient pharmacy service, abundancy on supplyand availability of drugs in the hospital, laboratoryand radiology services of the hospital, and thehospital pain management were considered.
(iv) General facility amenities of the hospital-relatedvariables
Under this category, availability of rooms for ac-commodation, dietary service given by the hos-pital, toilet, ward and bed services, and cleanlinesswere considered.
2.3. Data Collection Materials and Procedures. A structuredquestionnaire developed by reviewing other similar studies[12, 33–38] was used for questionnaire development, whichwe used to assess the level of patient satisfaction with in-patient services in Black Lion Specialized Hospital. To ensurethe required information is collected with greater under-standing, local language was used during data collection. Tofacilitate this, the data collection questionnaire was firstdeveloped in English, then translated to Amharic language,and back to English for its consistency. +ree diploma levelhealth professionals were used for data collection, and onefirst degree level health professional with three years ofexperience and one of the principal investigators acted as asupervisor during the data collection. +e data collectionteam was briefed about the objective andmethodology of thestudy and trained on the data collection process by theprincipal investigators. To avoid social desirability bias, boththe data collectors and supervisors were recruited from otherhealth facilities. Admitted patients were interviewed beingon their bed. To ensure the quality of the collected data, thecollected data have been collected by the supervisors toreview for clarity and completeness check on a daily basis.
2.4. Measurements
2.4.1. Patient Satisfaction. Considering that patient satis-faction is a collective outcome of different kinds of servicesprovided in the hospital, the level of patient satisfaction inthis study was measured by using 19-item questions, whichis composed of three dimensions. Service utilization, patientand health care provider interaction, and facility-relatedinformation were the three different dimensions assessed.Each item has a 5-point Likert scale ranging from 1 (verydissatisfied) to 5 (very satisfied).
2.4.2. Overall Patient Satisfaction. +is is measured by usingone item in the questionnaire stating “How do you rate youroverall level of satisfaction regarding the health service youreceived in this hospital?”
2.4.3. Net Overall Patient Satisfaction. Mean value ofparticipants’ level of satisfaction which was computedfrom the entire questions under the three dimensions(service utilization, patient and health care provider
Journal of Environmental and Public Health 3

interaction, and facility-related information) was used(Table 1).
2.5. Data Processing and Management. +e collected datawere entered and analyzed using SPSS version 21 statisticalsoftware. After data cleaning was completed, descriptivestatistics including frequencies and percentages were used todescribe the study participants. Before fitting to the model foranalysis, required assumption for the model in use was done.Statistical tests for normality such as Shapiro–will and Kol-mogorov–Smirnov were performed. During checking for theassumption for linear regression, the dependent variable wasnot normally distributed, and a two-step transformation wasperformed to ensure its normality. To reduce the load of theindependent variables and select critical variables, factoranalysis with varimax rotation was performed, variables withgreater than 0.443 rotated component matrix value wereconsidered, and bivariate analysis was performed for everyindependent variable with the outcome variable indepen-dently. Finally, explanatory variables which had a statisticallysignificant association with the dependent variables atp< 0.05 were considered for the final linear regression model.
2.6. Data Quality Management. Quality of the data for thestudywas assured throughout the study period starting from thedesigning phase of a data collection instrument. Simplicity ofthe questions for understanding and relevance of variables inthe study were considered during preparation followed pre-testing, and modification of the questionnaire based on thefindings was performed accordingly. Before actual data col-lection, training was given for data collectors and the supervisoron the techniques of data collection, proper categorization, andcoding of data. During data collection, the assigned supervisorand principal investigator checked the collected data on a dailybasis for its completeness, accuracy, and clarity. Cronbach alphawas calculated for all independent variables together in order todemonstrate the reliability of the variables to measure theoverall satisfaction level of the patients during analysis stage.+eCronbach alpha analysis indicated that reliability for variablesincluded in the study was 0.81.
2.7. Ethical Considerations. Ethical approval was obtainedfrom the Ethical Review Committee of Jimma University,College of Health Sciences. Verbal consent was also obtainedfrom the study participants before the data collection afterproviding clear information on the study objective and other
methodological issues. During the data collection, names ofthe participants were kept anonymous by using a studyrecord number only. It is believed that there is no anticipatedharm for the patients except for their time scarification at thetime of data collection.
3. Results
3.1. SociodemographicCharacteristics. A total of 398 patientswere participated in the study making a response rate of100%. Of the total study participants, 231 (58.0%) and 211(53.0%) were female and married, respectively. +e medianage of study participants was 34 years. One hundred twenty(30.2%) study participants had primary education and 69(17.3%) of them have no formal education. +e medianincome of the study participants was 1,500.00 Ethiopian Birr(ETB), and 273 (68.6%) of the participants were from a ruralpart of the country (Table 2).
3.2. Hospitalization Characteristics. About 249 (62.6%)study participants were admitted for the first time to thehospital, and 222 (55.8%) of the respondents were paying forthe hospital service. Among study participants, 239 (60.1%)of them stayed in the hospital for less than 15 days (Table 3).
3.3. Level of Patient Satisfaction with Different ServiceCategories. Among the three service categories used to as-sess the net overall satisfaction rate of patients, the majorityof the patients were satisfied with the services under patientand health care provider interaction and facility-relatedinformation. +is study finding showed that almost half ofthe study participants were satisfied with waiting time to getservice 190 (47%), 228 (57.3%) with official visiting hours ofthe hospital, 207 (52.0%) with information provided on theavailable service by the staffs, 194 (48.7%) with admissionprocesses of the hospital, 169 (42.5%) and 219 (55.0%) withmeasures taken to assure confidentiality and privacy of thepatients, respectively, and 187 (47.0%) with signboardsavailable inside the hospital (Table 4).
In patient and health care provider interaction, a total of235 (59.0%) patients claimed that they were satisfied with thephysician service. +e highest very dissatisfaction propor-tion in this study was registered regarding the observedcleanness status of the toilets in the facility. A total of 42(10.6%) study participants claimed that they were verydissatisfied with the cleanness of toilets in the facility(Table 4).
Table 1: Operational definitions used.
S. no Variable Definition used
(1) Patient satisfaction Perception of the patients regarding the outcome of care and the extent it meets their needs andexpectations
(2) Inpatients Patients who had a hospital stay greater than 48 hours in the facility(3) Service departments Service area serving inpatients in the facility during their stay in the hospital
(4) Waiting time +e time interval between the departure from registration for inpatient service and seen by a doctorto receive service
4 Journal of Environmental and Public Health

3.4. Overall Net Patient Satisfaction Level. Regarding theoverall satisfaction level with the hospital service, around150 (37.7%) patients were satisfied with the service providedby the hospital, and an equivalent number of study par-ticipants were neither satisfied nor dissatisfied. Besides, 8.5%of the respondents were very satisfied with the service, andaround 0.5% of the respondents were very dissatisfied withthe service provided by the hospital service (Figure 1).
3.5. Patients Satisfaction by Sociodemographic and Hospi-talization Variables. In this study, the sociodemographic andhospitalization characteristics variables were found to explain
27.1% of the variability in the net overall satisfaction score.Among the sociodemographic and hospitalization character-istics measuring variables to measure the net overall satisfactionlevel, patient’s age, marital status, and presence of caretakerduring admission shows independent association with netoverall satisfaction level at p< 0.05. +e net satisfaction level ofstudy participants aged >34 increased by 3.45 (95% CI: −1.33 to5.55) as age increased by one unit. +e net satisfaction score ofstudy participantswho have their own caretaker in their hospitalstay was increased by 4.66 (95% CI: −1.05 to 8.27) whencompared with study participants without a caretaker in theirhospital stay.
Table 2: Sociodemographic characteristics of study participants in Black Lion Specialized Hospital (BLSH), Addis Ababa, Ethiopia,December 2015 (N � 398).
Variables Categories Frequency Percentage (%)
Sex Male 167 42.0Female 231 58.0
Age ≤34 years 199 50.0>34 years 199 50.0
Marital status
Single 128 32.2Married 211 53.0Divorced 34 8.5Widowed 25 6.3
Presence of caretaker Yes 361 90.7No 37 9.3
Educational status
No formal education 69 17.3Elementary/1–8th grade 120 30.2
Secondary school 95 23.9Vocational/diploma 66 16.6Degree and above 48 12.1
Occupational status
Government employee 83 20.9Private/NGO 132 33.2
Farmer 56 14.1Student 48 12.1
Daily laborers 16 4.0Merchants 54 13.6Others 9 2.3
Religion
Orthodox 224 56.3Protestant 82 20.6Muslim 86 21.6Others 6 1.5
Ethnicity
Amhara 150 37.7Oromo 142 35.7Tigre 46 11.6Gurage 49 12.3Other 11 2.8
+e region they come
Addis Ababa 124 31.2Amhara 70 17.6Oromiya 124 31.2Tigray 35 8.8SNNP 38 9.5Others 7 1.8
Residence Urban 273 68.6Rural 125 31.4
Financial income status of the respondents
Less than 1000ETB 152 38.11000–2500ETB 173 43.52500–5000ETB 71 17.8
Greater than 5000ETB 2 0.6
Journal of Environmental and Public Health 5

3.6. Patient’s Satisfaction by Service Utilization-Related In-formation, Patient-Health Care Provider Interaction, andFacility-Related Information Variables. +e relationship be-tween service utilization-related variables, patient and healthcare provider interaction variables, and facility-related infor-mation variables with net overall satisfaction is quantified inTable 5. +ese variables were found to explain 96.5% of thevariability in the net overall satisfaction score. For almost allvariables in these domains, when facility service improves, the
regression estimates of satisfaction level moved from verydissatisfied to very satisfied, which means that an improvementof listed services to satisfy the clients can potentially have animprovement in the net satisfaction score of patients.
3.7. Final Predictors of Patient Satisfaction in Black LionHospital. +e variables included in the final modelexplained 96.4% of the variability in net overall patient
Table 3: Hospitalization characteristics of study participants in Black Lion Specialized Hospital (BLSH), Addis Ababa, Ethiopia, December2015 (N � 398).
Variables Categories Frequency %
Number of days of hospital stay
<7 days 140 35.27–14 days 99 24.914–21 days 79 19.821–28 days 25 6.328–35 days 26 6.535–42 days 11 2.842–49 days 5 1.349–56 days 1 0.3>56 days 12 3.0
Admission type New 249 62.6Repeat 149 37.4
Payment status Free 176 44.2Paying 222 55.8
Ward
Medical ward 75 18.8Surgical ward 56 14.1
Gynecology and obstetrics 88 22.1Orthopedics 27 6.8Pediatrics 85 21.4Oncology 67 16.8
Table 4: Satisfaction levels of study participants in Black Lion Specialized Hospital (BLSH) with different service categories, Addis Ababa,Ethiopia, December 2015 (N � 398).
Variables Very dissatisfied Dissatisfied Neutral Satisfied Very satisfiedServices utilization-related informationWaiting time to get service 32 (8.0%) 114 (28.6%) 26 (6.5%) 190 (47.7%) 36 (9.0%)Visiting hours 8 (2.0%) 61 (15.3%) 36 (9.0%) 228 (57.3%) 65 (16.3%)Information on the service 21 (5.3%) 99 (24.9%) 48 (12.1%) 207 (52.0%) 23 (5.8%)Admission processes 27 (6.8%) 108 (27.1%) 43 (10.8%) 194 (48.7%) 26 (6.5%)Privacy 19 (4.8%) 63 (15.8%) 38 (9.5%) 219 (55.0%) 59 (14.8%)Measures taken to assure confidentiality 26 (6.5%) 124 (31.2%) 42 (10.6%) 169 (42.5%) 37 (9.3%)Signboards 27 (6.8%) 105 (26.4%) 40 (10.1%) 187 (47.0%) 39 (9.8%)
Patient and health care provider interactionHealth education provided by the health workers 23 (5.8%) 140 (35.2%) 42 (10.6%) 165 (41.5%) 28 (7.0%)Nursing care 14 (3.5%) 47 (11.8%) 29 (7.3%) 242 (60.8%) 66 (16.6%)Physician service 11 (2.8%) 39 (9.8%) 33 (8.3%) 235 (59.0%) 80 (20.1%)Inpatient pharmacy services 25 (6.3%) 126 (31.7%) 38 (9.5%) 175 (44.0%) 34 (8.5%)Availability of drug and supply 10 (2.5%) 67 (16.8%) 22 (5.5%) 236 (59.3%) 63 (15.8%)Laboratory and radiology services 25 (6.3%) 72 (18.1%) 43 (10.8%) 216 (54.3%) 42 (10.6%)Pain management 20 (5.0%) 65 (16.3%) 30 (7.5%) 224 (56.3%) 59 (14.8%)
Facility amenity-related informationRoom accommodation 10 (2.5%) 67 (16.8%) 22 (5.5%) 236 (59.3%) 63 (15.8%)Dietary service given by the hospital 28 (7.0%) 79 (19.8%) 45 (11.3%) 205 (51.5%) 41 (10.3%)Toilet cleanliness 42 (10.6%) 124 (31.2%) 33 (8.3%) 164 (41.2%) 35 (8.8%)Ward cleanliness 8 (2.0%) 51 (12.8%) 57 (14.3%) 225 (56.5%) 57 (14.3%)Bed cleanliness 6 (1.5%) 45 (11.3%) 30 (7.5%) 242 (60.8%) 75 (18.8%)
6 Journal of Environmental and Public Health

satisfaction. Physician service, laboratory and radiologyservices, pain management, inpatient pharmacy service,toilet cleanliness, room accommodation, and dietary servicewere strong predictors of patient satisfaction. Table 6 pro-vides the regression estimates and the relative effect of eachpredictor variable for net overall patient satisfaction with allvariables, which were included for the final multilinearregression model.
From the variables categorized into three parts, none ofthe variables under service utilization-related indicators werepredictors of net overall satisfaction. Majority of variablesunder patient and health care provider interaction variables(physician service, laboratory and radiology services, painmanagement, and inpatient pharmacy service) were signifi-cant predictors of net overall satisfaction of patients.
As it is indicated in the table, a unit increases in phy-sician service score will lead to 1.423 unit times increase inthe net overall satisfaction score with a 95% CI of
1.164–1.682 at a p value less than 0.001. Pain managementfor patients was also a strong predictor of patient satisfac-tion. In a unit, increase in pain management score will leadto 1.379 increases in the patient satisfaction score with a 95%CI of 1.141–1.617 at a p value of less than 0.001. From allpredictor variables, inpatient pharmacy services have asignificant change in the satisfaction score of patients inBLSH. A unit increase in the inpatient pharmacy will in-crease the satisfaction score of patients by 2.311 unit with a95% CI of 2.118–2.504 at a p value of less than 0.001.
From the third category (i.e., facility amenity-relatedvariables), three variables (toilet cleanliness, room accom-modation, and dietary service) were significant predictors ofnet overall satisfaction of patients in BLSH. From thesevariables, toilet cleanliness was a strong predictor variable ofnet overall satisfaction score. A unit improvement in toiletcleanliness will increase the satisfaction level of patients by1.500 unit with a 95% CI of 1.300–1.700 at a p value of less
0.5
15.6
37.7 37.7
8.5
40
35
30
25
20
15
10
5
0
Perc
enta
ge o
f stu
dy p
artic
ipan
ts
Very dissatisfied Dissatisfied Neither satisfiednor dissatisfied
Satisfied Very satisfied
Level of satisfaction
Figure 1: Level of overall net patient satisfaction of study participant of Black Lion Specialized Hospital (BLSH), December 2015.
Table 5: Relationship of net overall patient satisfaction level with services of BLSH, Addis Ababa, Ethiopia, December 2015.
Variables B95% CI
p valueLower B Upper B
Services utilization-related informationInformation on services provided 5.957 5.157 6.757 <0.001Admitting processes of the hospital 5.213 4.419 6.006 <0.001Waiting time to receive service 1.891 1.016 2.766 <0.001Official visiting hours for service 2.814 1.773 3.855 <0.001Available signboards in the facility 5.313 4.558 6.068 <0.001
Patient and health care provider interactionNursing care 4.664 3.691 5.637 <0.001Physician service 5.561 4.590 6.533 <0.001Health education 2.834 1.937 3.732 <0.001Laboratory and radiology services 5.478 4.676 6.280 <0.001Pain management 5.576 4.765 6.387 <0.001Inpatient pharmacy services 5.084 4.322 5.846 <0.001
Facility-related informationToilet cleanliness 5.292 4.601 5.984 <0.001Ward cleanliness 6.942 6.033 7.850 <0.001Room accommodation 6.565 5.741 7.390 <0.001Bed cleanliness 7.375 6.467 8.282 <0.001Dietary service 1.861 0.938 2.784 <0.001
Journal of Environmental and Public Health 7
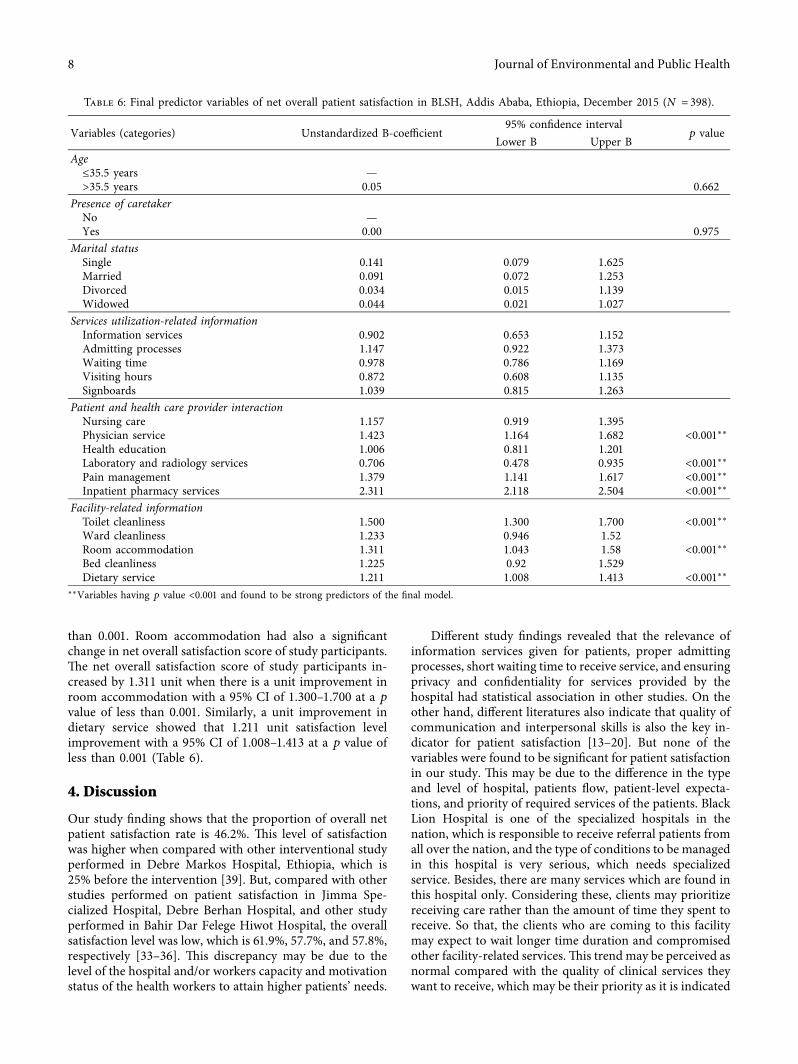
than 0.001. Room accommodation had also a significantchange in net overall satisfaction score of study participants.+e net overall satisfaction score of study participants in-creased by 1.311 unit when there is a unit improvement inroom accommodation with a 95% CI of 1.300–1.700 at a p
value of less than 0.001. Similarly, a unit improvement indietary service showed that 1.211 unit satisfaction levelimprovement with a 95% CI of 1.008–1.413 at a p value ofless than 0.001 (Table 6).
4. Discussion
Our study finding shows that the proportion of overall netpatient satisfaction rate is 46.2%. +is level of satisfactionwas higher when compared with other interventional studyperformed in Debre Markos Hospital, Ethiopia, which is25% before the intervention [39]. But, compared with otherstudies performed on patient satisfaction in Jimma Spe-cialized Hospital, Debre Berhan Hospital, and other studyperformed in Bahir Dar Felege Hiwot Hospital, the overallsatisfaction level was low, which is 61.9%, 57.7%, and 57.8%,respectively [33–36]. +is discrepancy may be due to thelevel of the hospital and/or workers capacity and motivationstatus of the health workers to attain higher patients’ needs.
Different study findings revealed that the relevance ofinformation services given for patients, proper admittingprocesses, short waiting time to receive service, and ensuringprivacy and confidentiality for services provided by thehospital had statistical association in other studies. On theother hand, different literatures also indicate that quality ofcommunication and interpersonal skills is also the key in-dicator for patient satisfaction [13–20]. But none of thevariables were found to be significant for patient satisfactionin our study. +is may be due to the difference in the typeand level of hospital, patients flow, patient-level expecta-tions, and priority of required services of the patients. BlackLion Hospital is one of the specialized hospitals in thenation, which is responsible to receive referral patients fromall over the nation, and the type of conditions to be managedin this hospital is very serious, which needs specializedservice. Besides, there are many services which are found inthis hospital only. Considering these, clients may prioritizereceiving care rather than the amount of time they spent toreceive. So that, the clients who are coming to this facilitymay expect to wait longer time duration and compromisedother facility-related services.+is trend may be perceived asnormal compared with the quality of clinical services theywant to receive, which may be their priority as it is indicated
Table 6: Final predictor variables of net overall patient satisfaction in BLSH, Addis Ababa, Ethiopia, December 2015 (N � 398).
Variables (categories) Unstandardized B-coefficient95% confidence interval
p valueLower B Upper B
Age≤35.5 years —>35.5 years 0.05 0.662
Presence of caretakerNo —Yes 0.00 0.975
Marital statusSingle 0.141 0.079 1.625Married 0.091 0.072 1.253Divorced 0.034 0.015 1.139Widowed 0.044 0.021 1.027
Services utilization-related informationInformation services 0.902 0.653 1.152Admitting processes 1.147 0.922 1.373Waiting time 0.978 0.786 1.169Visiting hours 0.872 0.608 1.135Signboards 1.039 0.815 1.263
Patient and health care provider interactionNursing care 1.157 0.919 1.395Physician service 1.423 1.164 1.682 <0.001∗∗Health education 1.006 0.811 1.201Laboratory and radiology services 0.706 0.478 0.935 <0.001∗∗Pain management 1.379 1.141 1.617 <0.001∗∗Inpatient pharmacy services 2.311 2.118 2.504 <0.001∗∗
Facility-related informationToilet cleanliness 1.500 1.300 1.700 <0.001∗∗Ward cleanliness 1.233 0.946 1.52Room accommodation 1.311 1.043 1.58 <0.001∗∗Bed cleanliness 1.225 0.92 1.529Dietary service 1.211 1.008 1.413 <0.001∗∗
∗∗Variables having p value <0.001 and found to be strong predictors of the final model.
8 Journal of Environmental and Public Health

in our finding that a total of 180 (45.2%) participants wantedimprovement in laboratory and pharmacy services.
Majority of variables under patient and health careprovider interaction domain (physician service, laboratoryand radiology services, pain management, and inpatientpharmacy service) were significant predictors of net overallsatisfaction of patients. From this domain, inpatient phar-macy service was the strong predictor variable of net overallsatisfaction score of the patients.
+e net overall satisfaction of study participantssatisfied with physician service in the facility had 1.423unit times greater satisfaction score with the service (95%CI (1.164–1.682)) at p< 0.001. A unit increase in thequality of laboratory and radiology services score willlead to 0.706 unit times increase in net overall satisfactionlevel of patients with a 95% CI of 0.478–0.935 at a p valueof less than 0.001. Our study finding is also in line withother studies performed in other different areas[33, 37, 40]. Pain management for patients is also strongpredictors of patient satisfaction in our study, which isagainst the study finding performed in other study areas[28]. Based on this study finding, the net overall satis-faction score of patients increases by 1.379 when there is aunit increase in the pain management with a 95% CI of1.141–1.617 at p< 0.001.
Regarding inpatient service of the facility, about half of(52.5%) of the participants were satisfied with the servicethey received in the hospital. +is finding is lower than thestudy performed in India on patient satisfaction in a tertiarycare teaching hospital, which shows about 69% of respon-dents were satisfied by the pharmacy service they receivedfrom the hospital. +e possible explanation for this differ-ence may be due to the difference in developmental status ofthe two countries. India is more developed country thanEthiopia and might have a strong health system structurewith numerous pharmaceutical factories, which may be thereason for the abundant availability of drugs in the facilitythat can satisfy the patients need. But it is almost similar withother study performed in Jimma Specialized Hospital, inwhich 54% of patients were satisfied by the drug availabilityand supply in the inpatient pharmacy.
Inpatient pharmacy service is found to be the highestpredictor of patient satisfaction in our study. +e findingshows that a unit increase in the inpatient pharmacyservices increases patient satisfaction level by 2.311 unitwith a 95% CI of 2.118–2.504 at p< 0.001. Another priorstudy conducted in a similar facility (Black Lion Hospital)before four years also revealed that the main reasons forpatient’s dissatisfaction in the hospital was the poorquality services they received from pharmacy, radiology,and laboratory department of the hospital, which cansignificantly indicate the persistence of the problem in thefacility after four years [12, 33–35, 38, 41, 42].
From the general facility amenity-related domain, threevariables (toilet cleanliness, room accommodation, anddietary service) were significant predictors of net overallsatisfaction of patients in BLSH. From these variables, toiletcleanliness was a strong predictor variable of net overallsatisfaction score of the patients.
Based on this study finding, a unit improvement intoilet cleanliness will have an average of 1.500 timesincrement in the net overall satisfaction rate of patients inthe hospital with 95% CI (1.300–1.700) at a p value of lessthan 0.001 and a unit increase in dietary services scorealso increase patient satisfaction by 1.211 unit with 95%CI (1.008–1.413) at a p value of less than 0.001. Otherstudy findings in other areas also showed that dietaryservice, cleanness of toilet and bed were an importantpredictor of patient satisfaction [33, 34, 36, 40, 42–45].+is result can be supported by the finding that, thehighest “very dissatisfaction” level among patients(10.6%) were with toilet cleanness problem. Almost 50%of participants were dissatisfied with the toilet service ofthe hospital. Our study finding is also similar with thestudy done in Bangladesh. Which indicate that a commoncomplaint of patients was against cleaner and sweepers ofthe hospital that they do not clean the hospital toilet andbathroom regularly [34]. +e possible reason for theircomplaint from patients’ sides maybe, they believe thatreceiving adequate food timely, clean toilet service andgood quality accommodation are the bases for psycho-logical satisfaction and healing process. Besides, they mayfear to develop health care -acquired infection due to thepoor sanitation of the facility which can debilitate theirhealth status.
In this study, none of the sociodemographic charac-teristics of the patients were found to be a predictor for thenet overall satisfaction of the patients. Other similar studieson the influence of sociodemographic characteristics onpatients’ satisfaction also showed that there is no consistentrelationship between patient satisfaction with age, race,gender, education, or income. However, some other studiesfound that older patients were more likely to report satis-faction compared with younger patients and that femaleswere more likely to express satisfaction than males[26, 27, 35].
In general, this study found that patient and health careprovider interaction domain and general facility amenity-related domains of patient satisfaction were found to explain96.4% of the variability in the net overall satisfaction score ofthe patients. Another new domain dimension of patientsatisfaction including facility design domain should beconsidered for future research.
5. Recommendations
Continuous quality improvement is linked to the use oftimely and useful feedback from clients. Patients constitutethe hospital’s direct client. +e overall satisfaction is animportant aspect of the service itself, and it is considered tobe an important outcome measure for health services. Pa-tient care is not considered to be of high quality unless thepatient is satisfied.
Improving patient satisfaction is one of the key indi-cators of quality of care and indicator of quality healthservice. Based on this study finding, we recommend thefollowing strategies to improve patient satisfaction in thehospital.
Journal of Environmental and Public Health 9

(i) +e hospital managers should routinely assess thepatients’ satisfaction status and provide tailoredon-the-job training to their professionals in thefacility in order to improve their skill for en-hancing patients’ satisfaction.
(ii) Managers of the hospital should devise a mecha-nism to improve the performance of staff andmonitor the implementation process in order totake appropriate improvement and action.
(iii) Periodic assessment of health services andfurther study in other dimensions of patientsatisfactions including facility design dimen-sion, which can explore from the user’s satis-faction perspective, is recommended as afundamental initiative in the improvement ofthe performance of health care delivery in thefacility.
(iv) Hospital reformation and modern hospital ad-ministration system could be considered to im-prove the level of patient satisfaction.
(v) +e hospital should improve the general facilityamenities including the meal need of the patientand the cleanliness of the toilet.
(vi) Considering that service unavailability is a majorsource of patient dissatisfaction, a system shouldbe in place to ensure the availability of hospital-specific tracer drugs in the hospital on a daily basis,and there should be drug information service inthe hospitals as recommended by EthiopianHospital Reform Implementation Guideline.
(vii) Improving the client-patient interaction shouldbe addressed by using an appropriately designedchecklist which considers the norm of thecommunity and other client needs, and astandard checklist for communication can po-tentially improve the satisfaction level of pa-tients regarding service delivery of differentdepartments.
(viii) Improving the health literacy status of serviceproviders in the facility should be addressed byproviding on-the-job trainings related to deter-minants of patients as soon as possible to supportthe compassionate and respectful care initiative ofthe hospital.
(ix) Last, we want to emphasize that this researchidentifies a number of indicators that are im-portant to improve the quality of hospital ser-vices and patient satisfaction in Black LionSpecialized Hospital. Since the study is con-ducted in one government medical hospital inAddis Ababa, we caution against generalizingthe results to the context of the entire country.But other hospital authorities may consider thetool and findings of this study to improve theservices of the hospital for patient satisfactionand better treatment.
6. Conclusion
Based on the study finding, around 46.2% of the patientswere satisfied by the services they received in the hospitals,and 15.6% of the patients reported that they were dissatisfiedby the hospital services. +e remaining 37.7% of the re-spondents were neither satisfied nor dissatisfied with theservice provided in the hospital service. Based on thisfinding, the overall patient satisfaction is low compared withother health facilities in the nation and compared with theaverage standard level expected. Majority of variables underpatient and health care provider interaction variables andfacility amenities have higher prediction capacity for the netoverall satisfaction of patients. Physician service, laboratoryand radiology services, pain management, inpatient phar-macy service, cleanliness of the toilet, room accommodation,and dietary service of the hospital were significant predictorsof net overall satisfaction of patients in Black Lion Spe-cialized Hospital.
Data Availability
+e data used to support the study are available from thecorresponding author upon request.
Conflicts of Interest
+e authors declare that there are no conflicts of interest.
Authors’ Contributions
+e work presented here was carried out in collaborationbetween all authors. NA and AA prepared the protocol; NA,AA, and MT participated in fieldwork, data organization,and cleaning; NA, AA, and MTcarried out the data analysis,interpretation, and write-up of the manuscript. All authorsread and approved the final manuscript.
Acknowledgments
+e authors would like to thank School of Public Health,Jimma University, for providing this opportunity to conductthis study. Staff and supervisors working at the universitywho had a contribution in this work also deserve the authors’gratefulness for their support. +e authors would also like toextend their special thanks to Black Lion Specialized Hos-pital administration and staff for their willingness during thestudy period. Finally, the authors’ sincere thanks go to theteam (supervisors and data collectors) and study participantsfor their willingness to participate in the study.
References
[1] Institute of Medicine Committee, “Quality of health care inAmerica, crossing the quality chasm a new health system forthe 21st century,” 2001.
[2] B. Prakash, “Patient satisfaction and normative decisiontheory,” Journal of Cutaneous and Aesthetic Surgery, vol. 3,no. 3, p. 151, 2010.
10 Journal of Environmental and Public Health
[3] P. D. Cleary, S. Edgman-Levitan, M. Roberts et al., “Patientsevaluate their hospital care: a national survey,” Health Affairs,vol. 10, no. 4, pp. 254–267, 1991.
[4] S. Woodring, R. C. Polomano, B. F. Haagen et al., “Devel-opment and testing of patient satisfaction measure for in-patient psychiatry care,” Journal of Nursing Care Quality,vol. 19, no. 2, pp. 137–148, 2004.
[5] S. F. Isenberg and F. Michael, “Utilizing patient satisfaction datato assess quality improvement in community based medicalpractices,” American Journal of Medical Quality, vol. 13, no. 4,1998.
[6] A. F. Al-Assaf and M. Sheikh, “Quality improvement inprimary health care: a pratical guide,” 2004.
[7] M. Pelletier, “Joint Commission on Accreditation ofHealthcare Organizations: accreditation guide for hospitals,”Joint Commission Journal on Quality and Patient Safety,vol. 66, pp. 37–39, 2012.
[8] A.U.S.H.Inc., National Committee for Quality Assurance(NCQA), 1999.
[9] R. Al-Abri and A. Al-Balushi, “Patient satisfaction survey as atool towards quality improvement,” Oman Medical Journal,vol. 29, no. 1, pp. 3–7, 2014.
[10] R. S. de Almeida, S. Bourliataux-Lajoinie, and M. Martins,“Satisfaction measurement instruments for healthcare serviceusers : a systematic review,” Cadernos de Saude Publica,vol. 31, no. 1, pp. 11–25, 2015.
[11] I. Ahmad and S. ud Din, “Patients’ satisfaction from the healthcare services,” Gomal Journal of Medical Sciences, vol. 8, no. 1,pp. 95–97, 2010.
[12] S. S. Qadri, R. Pathak, M. Singh, S. K. Ahluwalia, S. Saini, andP. K. Garg, “An assessment of patients satisfaction withservices obtained from a tertiary care hospital in rural Har-yana,” International Journal of Collaborative Research onInternal Medicine, vol. 4, no. 8, pp. 1524–1537, 2012.
[13] M. A. Abolfotouh, M. H. Al-assiri, R. T. Alshahrani,Z. M. Almutairi, R. A. Hijazi, and A. S. Alaskar, “Predictors ofpatient satisfaction in an emergency care centre in centralSaudi Arabia: a prospective study,” Emergency MedicineJournal, vol. 34, no. 1, pp. 27–33, 2017.
[14] C. Renzi, A. Picardi, D. Abeni et al., “Association of dissat-isfaction with care and psychiatric morbidity with poortreatment compliance,” Archives of Dermatology, vol. 138,no. 3, pp. 337–342, 2015.
[15] M. S. Sran, T. Pyra, L. Chen, B. R. Holroyd, and C. McCabe,“A scoping review of factors affecting patient satisfaction withcare in North American adult emergency departments,”Canadian Journal of Emergency Medicine, vol. 19, no. 1,p. S117, 2017.
[16] M. Preyde, K. Crawford, and L. Mullins, “Patients’ satisfactionand wait times at Guelph general hospital emergency de-partment before and after implementation of a process im-provement project,” CJEM, vol. 14, no. 3, pp. 157–168, 2012.
[17] C. Renzi, D. Abeni, A. Picardi et al., “Factors associated withpatient satisfaction with care among dermatological outpa-tients,” British Journal of Dermatology, vol. 145, no. 4,pp. 617–623, 2001.
[18] T. Cooke, D. Watt, W. Wertzler, and H. Quan, “Patientexpectations of emergency department care : phase II—across-sectional survey,” Canadian Journal of EmergencyMedicine, vol. 8, no. 3, pp. 148–157, 2016.
[19] J. Hopkins, “Defining the patient-physician relationship forthe 21st century,” Disease Management, vol. 7, no. 3,pp. 161–179, 2004.
[20] B. A. Wung, N. F. Peter, and J. Atashili, “Clients’ satisfactionwith HIV treatment services in Bamenda, Cameroon: a cross-sectional study,” BMC Health Services Research, vol. 16, no. 1,pp. 1–9, 2016.
[21] L. Papa, D. C. Seaberg, E. Rees et al., “Does a waiting roomvideo about what to expect during an emergency departmentvisit improve patient satisfaction?” CJEM, vol. 10, no. 4,pp. 347–354, 2008.
[22] R. S. Ulrich, “Essay evidence-based health-care architecture,”<e Lancet, vol. 368, pp. 38-39, 2006.
[23] Health Boards Executive (HeBE), “Measurement of patientsatisfaction guidelines: health strategy implementation proj-ect,” 2003.
[24] G. Soufi, J. Belayachi, S. Himmich et al., “Patient satisfactionin an acute medicine department in Morocco,” BMC HealthServices Research, vol. 10, pp. 1–12, 2010.
[25] D. Butler, S. L. Oswald, and D. E. Turner, “+e effects of de-mographics on determinants of perceived health-care servicequality,” Journal of Management in Medicine, vol. 10, no. 5,pp. 8–20, 1996.
[26] J. John, “Why are older patients and less educated patients lesssatisfied with health care quality ?” Health Marketing Quar-terly, vol. 10, no. 1-2, pp. 209–218, 1993.
[27] P. L. Nguyen+i, S. Briançon, F. Empereur, and F. Guillemin,“Factors determining inpatient satisfaction with care,” SocialScience & Medicine, vol. 54, no. 4, pp. 493–504, 2002.
[28] K. H. Todd, E. P. Sloan, C. Chen, S. Eder, and K. Wamstad,“Survey of pain etiology, management practices and patientsatisfaction in two urban emergency departments,” CJEM,vol. 4, no. 4, pp. 252–256, 2002.
[29] S. S. Andaleeb, “Service quality perceptions and patientsatisfaction: a study of hospitals in a developing country,”Social Science & Medicine, vol. 52, no. 9, pp. 1359–1370,2001.
[30] M. S. Directorate, EHospital, and MInitiative, “Hospitalperformance monitoring and improvement manual,” 2011.
[31] Health Boards Executive (HeBE), “Measurement of patientsatisfaction guidelines: health strategy implementation project2003,” 2003, http://hdl.handle.net/10147/43559.
[32] D. Gupta, M. Markman, M. Rodeghier, and C. Lis, “+erelationship between patient satisfaction with service qualityand survival in pancreatic cancer,” Patient Preference andAdherence, vol. 6, pp. 765–772, 2012.
[33] T. R. Woldeyohanes, T. E. Woldehaimanot, M. W. Kerie,M. A. Mengistie, and E. A. Yesuf, “Perceived patient satis-faction with in-patient services at Jimma University Spe-cialized Hospital, Southwest Ethiopia Public Health,” BMCResearch Notes, vol. 8, no. 1, 2015.
[34] F. Assefa, A.Mosse, and Y. H.Michael, “Assessment of clients’satisfaction with health service deliveries at Jimma UniversitySpecialized Hospital,” Ethiopian Journal of Health Sciences,vol. 21, no. 2, pp. 101–109, 2011.
[35] R. Mezemir, “Patients’ satisfaction and its determinants inoutpatient department of Deberebirhan Referral Hospital,North Shoa, Ethiopia,” International Journal of Economics &Management Sciences, vol. 3, no. 3, 2014.
[36] Y. A. Ambelie, “Patients’ satisfaction and associated factorsamong private wing patients at Bahirdar Felege Hiwot Re-ferral Hospital, North West Ethiopia,” Science Journal ofPublic Health, vol. 2, no. 5, p. 417, 2014.
[37] G. Gamo Sagaro, “Patients' satisfaction and associatedfactors among Outpatient Department at Wolaita SodoUniversity Teaching Hospital, southern Ethiopia: a cross
Journal of Environmental and Public Health 11

sectional study,” Science Journal of Clinical Medicine, vol. 4,no. 5, p. 109, 2015.
[38] B. Abdosh, “+e quality of hospital services in EasternEthiopia: patients’s perspective,” Science Journal of ClinicalMedicine, vol. 20, no. 3, 2009.
[39] S. Alemu, “Changes in inpatient satisfaction with nursing careand communication at Debre Markos Hospital, AmharaRegion, Ethiopia,” American Journal of Health Research,vol. 2, no. 4, p. 171, 2014.
[40] A. I. Modebe, “Patient satisfaction on admission in NnamdiAzikiwe university teaching hospital, Nnewi, Nigeria,” ScienceJournal of Public Health, vol. 2, no. 6, pp. 596–600, 2014.
[41] S. G. Lemessa, “Satisfaction with outpatient health services atJimma Hospital, South West Ethiopia,” Ethiopian Journal ofHealth Development, vol. 15, no. 3, pp. 179–184, 2001.
[42] M. Mulugeta, B. Aster, S. Ashenafi, and A. Yohannes, “As-sessment of adult patients satisfaction and associated factorswith nursing care in Black Lion Hospital, Ethiopia; institu-tional based cross sectional study,” International Journal ofNursing and Midwifery, vol. 6, no. 4, pp. 49–57, 2014.
[43] S. Shahzad, S. Hamid, Z. Masood, and R. Mustafa, “Patientsatisfaction,” OPD Services in a Tertiary Care Hospital ofLahore, vol. 20, no. 6, pp. 973–980, 2013.
[44] R. Hospital, G. Tadele, E. Ejeta, M. Desalegn, S. Abere, andK. Elias, “Patients satisfaction on clinical laboratory services atNekemte,” Food Science and Quality Management, vol. 30,no. 16, 2014.
[45] D. M. V. Rao, D.+ota, P. Srinivas, and C. D. Kumar, “Patientsatisfaction survey in inpatients of a tertiary care teachinghospital,” IOSR Journal of Dental and Medical Sciences,vol. 13, no. 11, pp. 1–6, 2014.
12 Journal of Environmental and Public Health