level 3 certificate in business statistics lcci international
TRANSCRIPT

Level 3 Certificate in Business Statistics
For further information contact us:
Tel. +44 (0) 8707 202909 Email. [email protected] www.lcci.org.uk
LCCI International Qualifications
Syllabus Effective from 1st October 2001

1

2
INTRODUCTION
EDI is a leading international awarding body that was formed through the merger of the London Chamber of Commerce and Industry Examinations Board (LCCI) and GOAL, a leading online assessment provider. EDI now delivers LCCI International qualifications (LCCI IQ) through a network of over 5000 registered centres in more than 120 countries worldwide. Our range of business-related qualifications is trusted and valued by employers worldwide and recognised by universities and professional bodies.
Level 3 Certificate in Business Statistics Aims
The aims of this syllabus are to enable candidates to develop: a knowledge and understanding of more advanced statistical techniques the ability to apply this knowledge and understanding in solving business problems.
Target Audience and Candidate Progression
This qualification is intended for those people who have an up-to-date knowledge of basic arithmetical processes can recognise and use the appropriate formulae provided with the examination paper have the ability to recognise and use the appropriate statistical tables provided with the
examination paper wish to progress to more advanced administrative, business and management
qualifications, including LCCI IQ Level 3 and 4 Diplomas
Level of English Required
Candidates should have a standard of English equivalent to LCCI IQ English for Business Level 2.

3
Structure of the Qualification
The level 3 Certificate in Business Statistics is a single unit qualification that consists of the range of topics detailed below.
Syllabus Topics
1 Quantitative Information 2 Descriptive Statistics 3 Forecasting 4 Uncertainty 5 Statistical Inference
Guided Learning Hours
EDI recommends that 140-160 Guided Learning Hours (GLHs) provide a suitable course duration for an ‘average’ candidate at this level. This figure includes direct contact hours as well as other time when candidates' work is being supervised by teachers. Ultimately, however, it is the responsibility of training centres to determine the appropriate course duration based on their candidates' ability and level of existing knowledge. EDI experience indicates that the number of GLHs can vary significantly from one training centre to another.
ASSESSMENT Assessment Objectives The examination will assess the candidate’s ability to: demonstrate a knowledge and understanding of basic and more advanced statistical
techniques including the collection and presentation of data. apply the above knowledge and understanding in solving business problems.
Coverage of Syllabus Topics in Examinations
For each examination full or part questions are set on Syllabus Topics 4 and 5. The remaining questions (or part questions) are taken from Syllabus Topics 1, 2, 3. Questions may be drawn from 2 or more syllabus topics. Examination Format
The time allowance for the examination is 3 hours Candidates will be required to answer 5 questions from a choice of 8 All questions carry equal marks

4
Answer Formats
Marks are awarded for correct working as well as for correct answers and for an appropriate level of accuracy. Where a correct answer is provided, without working, a candidate will normally be given full marks for that section. However, where a question asks for a specific method, then that method must be used and shown, otherwise the candidate will normally receive no marks for that section. Candidates are advised that it is normally to their advantage to show all working. Mark Allocation Marks will be awarded for the appropriateness of the method used as well as for the accuracy of the answer. Marks will not normally be reserved for appropriate use of English, correct use of grammar, for a specific format of answer, or for presentation, except where specifically stated in the question (such as asking for the answer in a particular format). Candidates should, however, be aware of the need for clear, intelligible and unambiguous answers. An answer must be comprehensible in order to gain marks.
Certification Successful candidates will be awarded the level 3 Certificate in Business Statistics based on the achievement of the percentages and grades below: Pass 50% Merit 60% Distinction 75%
Recommended Reading and Support Material Title Author Publisher ISBN Code
How to Pass Business Statistics D Friend LCCIEB 1 86247 005 7 Second and Third Levels Support Material Model answers and past question papers are available from the LCCI website www.lcci.org.uk. A Solutions Booklet to support the Passport to Success book is also available from the website. Formulae
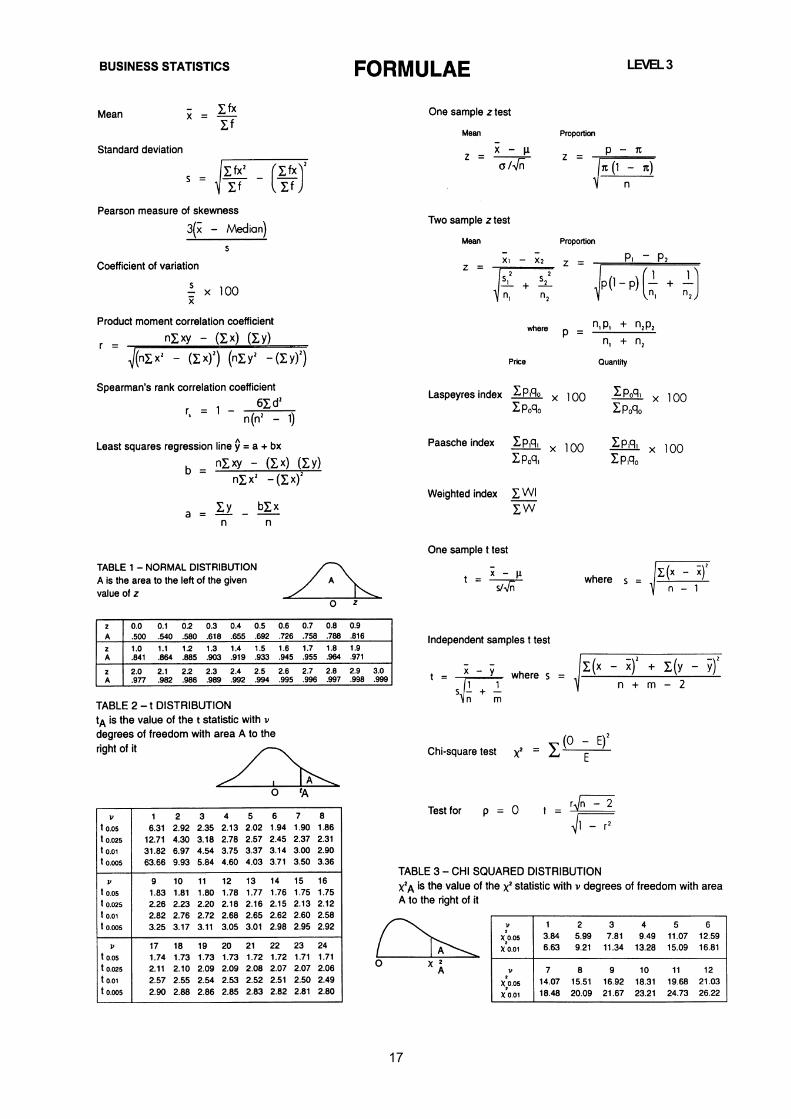
A list of formulae for use with Business Statistics Level 3 is printed at the rear of this syllabus. This formulae list is available to candidates of the appropriate examination. The list contains the principal formulae appropriate to the level, but is are not intended to be exhaustive. Centres and candidates should pay careful attention and note those syllabus items where the relevant formulae are not given in the list.

5
How to offer this Qualification
To offer this qualification you must be an LCCI IQ registered examination centre. To gain centre approval please contact Customer Support on 08700 818008 between the hours of 0830 and 1700 (GMT) Monday to Friday or by email on [email protected]. Alternatively you may contact your Regional LCCI Office or Co-ordinating Authority.

6
Syllabus Topic Items Covered
1 Quantitative Information Candidates must be able to:
1.1 Graphical presentation 1.1.1 Differentiate alternative forms of data
e.g. discrete and continuous 1.1.2 Know the circumstances in which the
various graphs/diagrams/ charts should be used.
1.1.3 Construct the various types of bar
charts, pie charts, pictograms, Z charts, Lorenz curve and graphs.
1.1.4 Construct a semi-log graph. 1.1.5 Draw neat and tidy
graphs/diagrams/charts. 1.1.6 Label axes; give titles of diagrams;
when given, state source of data. 1.1.7 Use shading, where appropriate. 1.1.8 Comment on graphs/diagrams/charts. 1.2 Survey methodology 1.2.1 Understand the difference between
primary and secondary data. 1.2.2 Know the difference between a census
and a survey and their relative advantages and disadvantages.
1.2.3 Understand the nature of a sampling
frame. 1.2.4 Understand the term sampling fraction. 1.2.5 Know the various methods of sampling
and their advantages and disadvantages.
1.2.6 Know the advantages and
disadvantages of the interview and the postal questionnaire as methods of collecting data.
1.2.7 Understand the problem of interviewer
bias.

7
1.2.8 Understand the principles of questionnaire design.
1.2.9 Design a questionnaire. 1.2.10 Recognise the problem of non-
response and know the methods of attempting to overcome the problem.
1.2.11 Understand the need for a pilot survey
before conducting a large-scale survey
1.3 Use of Computers in 1.3.1 Recognise that most businesses store Business Statistics data on computers 1.3.2 Understand that some computer-
stored data can be processed statistically.
1.3.3 Understand that graphics packages
and spreadsheet packages enable charts, diagrams and graphs to be produced.
1.3.4 Understand that spreadsheet
packages and special statistics packages allow statistical calculations to be carried out accurately and speedily.
2 Descriptive Statistics Candidates must be able to: 2.1 Measures of location 2.1.1 Construct a cumulative frequency
and dispersion - table. grouped data
2.1.2 Draw a cumulative frequency curve (ogive).
2.1.3 Draw a histogram, and be able to deal
with unequal class intervals. 2.1.4 Calculate mean, median and quartiles
(the relevant formula for the mean is given in the formulae list but not the formula for the median).
2.1.5 Obtain the median and quartiles from
the cumulative frequency curve.

8
2.1.6 Obtain the mode from either a histogram or from a formula (the relevant formula is not given in the
formulae list). 2.1.7 Calculate standard and quartile
deviations (the relevant formula for the standard deviation is given in the formulae list but not the formular for the quartile deviation).
2.1.8 Know that the variance is the square of
the standard deviation. 2.1.9 Understand what measures of location
and dispersion represent. 2.2 Measures of location 2.2.1 Calculate the mean, median, mode, and dispersion - quartiles and geometric mean (the ungrouped data formulae are not given in the formulae
list). 2.2.2 Calculate the standard deviation (the
relevant formula is given in the section marked "one sample t test").
2.2.3 Calculate the quartile deviation (the
formula is not given).
2.2.4 Calculate the mean deviation (the
formula is not given in the formula list). 2.3 Measures of skewness 2.3.1 Find Pearson's measure of skewness
(the relevant formula is given in the formulae list). 2.3.2 Find a quartile measure of skewness
(the relevant formula is not given in the
formulae list). 2.3.3 From a histogram, relate positive or
negative skewness found from the skewness formula to the shape of the histogram.

9
2.4 Coefficient of variation 2.4.1 Calculate a coefficient of variation (the
relevant formula is given in the formula list).
2.4.2 Understand the use of the coefficient
of variation. 2.5 Index Numbers 2.5.1 Calculate Laspeyres and Paasche
index numbers (both price and quantity
formulae for these index numbers are given in the formulae list). 2.5.2 Find Laspeyres or Paasche index
numbers if value or cost is given instead of price/quantity.
2.5.3 Understand the advantages and
disadvantages of Laspeyres and Paasche index numbers.
2.5.4 Calculate a weighted index number
(the relevant formula is given in the formulae list).
2.5.5 "Splice" index numbers (the relevant
formula is not given in the formulae list)
2.5.6 Rebase 2 sets of index numbers to a
common base, so that comparisons can be made.
2.5.7 Use an index of retail prices and an
index of earnings to find an index of "real" earnings.
2.5.8 Use an index of retail prices for "index
linking" e.g. of pensions. 2.5.9 Understand the construction and use
of at least one major index e.g. the index of retail prices or the index of industrial production.

10
3 Forecasting Candidates must be able to:
3.1 Correlation and 3.1.1 Draw a scatter diagram, know how to regression place the dependent variable on the
vertical axis and the explanatory variable on the horizontal axis.
3.1.2 Comment on the data from a scatter
diagram whether the data lies on a line or a curve and the presence of outliers.
3.1.3 Calculate a least squares regression
line (the relevant formulae are given in the formulae list).
3.1.4 Plot regression line on scatter diagram. 3.1.5 Use regression line for forecasting
purposes and be able to comment on the likely accuracy of forecasts.
3.1.6 Calculate the product moment
correlation coefficient (the relevant formula is given in the formulae list).
3.1.7 Test whether the product moment
correlation coefficient is significantly different from (or greater or less than) zero (the relevant formula is given in the formulae list, but the number of degrees of freedom is not given in the formulae list).
3.1.8 Rank a set of data and be able to deal
with ties. 3.1.9 Calculate Spearman's rank correlation
coefficient (the relevant formula is given in the formulae list).
3.1.10 Obtain the coefficient of determination
(the relevant formula is given in the formulae list) and understand what this coefficient measures.

11
3.2 Time Series 3.2.1 Plot a time series - time along the
horizontal axis. 3.2.2 Understand the difference between the
additive and multiplicative models. 3.2.3 From a time series plot or other
procedures, recognise which model to use in finding seasonal factors.
3.2.4 Use a moving average to calculate the
trend and to know when the trend needs to be centred.
3.2.5 Plot trend on time series graph. 3.2.6 Calculate the seasonal factors for
either the additive or multiplicative model. The appropriate model should be used.
3.2.7 Calculate seasonally adjusted values. 3.2.8 Understand why seasonally adjusted
values are found. 3.2.9 Find likely future values of the trend
either graphically or by a simple method (fitting a least squares regression line is not expected, as this is too time consuming).
3.2.10 Use the future trend to forecast future
values. 3.2.11 Discuss the likely accuracy of any
forecast. 4 Uncertainty Candidates must be able to:
4.1 Probability 4.1.1 Understand the classical and the
empirical definitions of probability. 4.1.2 Understand the concept of "mutually
exclusive events." 4.1.3 Understand the addition and
multiplication rules of probability.

12
4.1.4 Draw a Venn diagram. 4.1.5 Draw a tree diagram. 4.1.6 Use Venn and tree diagrams to solve
probability problems. 4.1.7 Recognise and solve problems
involving conditional probability. 4.1.8 Understand the simple applications of
Bayes theorem. 4.1.9 Understand simple problems involving
mathematical expectation and know that the expected monetary value is the product of the probability and the money value.
Note: Probability questions will not be set
which require a knowledge of Binomial or Poisson distributions.
4.2 Normal distribution 4.2.1 Use the normal distribution tables (a
limited version of the normal tables as given in the formulae list)
Examination questions are constructed So that, in general, the tables can be Used without interpolation. Interpolation is not expected. 4.2.2 Use the formula z = (the relevant formula is not given in
the formulae list). 4.2.3 Understand that for a linear
combination of 2 or more independent normal distributions, the sum if normally distributed with a mean which is the sum of the individual means and a variance which is the algebraic sum of the individual variances.
4.2.4 Understand the uses of the normal
distribution.
x

13
5 Statistical Inference Candidates must be able to:
5.1 Procedure for significance 5.1.1 Understand the concept of a sampling tests distribution. 5.1.2 Understand that for all significance
tests 5 steps are required whether listed or implied.
Step 1 Statement of null and
alternative hypothesis. Step 2 State, where appropriate,
the degrees of freedom, and the critical value.
Step 3 Calculate the test value from
data supplied or found from the data given.
Step 4 Compare the calculated test
value with the critical value found at Step 2. If the test value is numerically larger, state significant and reject null hypothesis. If the test value is numerically smaller, state not significant and accept null hypothesis.
Step 5 Draw conclusion - this must relate to the subject of the
examination question. The 5 steps need not be in the order Shown, but for full marks in Examination questions all 5 steps must be given or implied. The use of a confidence interval for solving a significance test question needs to be carefully considered particularly in a one tailed test situation.

14
5.2 Type I and Type II errors 5.2.1 Understand the principles involved
in Type I and Type II errors 5.2.2 Indicate the type of error that may be
involved in the results of a significance test.
5.3 Significance tests and 5.3.1 Recognise that for a large sample test confidence intervals the critical values are found from the (n>30) normal distribution table. 5.3.2 Find a confidence interval for a mean
(the relevant formula is not given in the
formulae list). 5.3.3 Find a confidence interval for a
proportion (the relevant formula is not given in the formulae list).
5.3.4 Understand the concept of a
confidence interval. 5.3.5 Find the sample number required to
obtain a confidence interval of a given size for a stated probability.
5.3.6 Differentiate between a one tailed and
two tailed test. 5.3.7 Conduct a single mean test (the
relevant formula is given in the formulae list).
5.3.8 Conduct a single proportion test (the
relevant formula is given in the formulae list).
5.3.9 Conduct a two mean test (the relevant
formula is given in the formulae list). 5.3.10 Conduct a two proportion test (the
relevant formula is given in the formulae list).
Note: The formulae show that a pooled
estimate of p is expected.

15
5.4 Significance tests and 5.4.1 Recognise that for small sample tests confidence intervals the critical values are found from the (n < 30) t distribution tables.
5.4.2 Recognise that when mean and
variance are estimated from the data the t distribution is required.
5.4.3 Find a confidence interval for a mean
(the relevant formula is not given in the formulae list, nor are the degrees of freedom given).
5.4.4 Conduct a single mean t test (the
relevant formulae are given in the formulae list, but not the formula for
degrees of freedom). 5.4.5 Differentiate the circumstances when a
paired comparison t test and a two means t test should be employed.
5.4.6 Conduct a paired comparison test (the
relevant formula are not given in the formulae list, but the formulae for a single mean t test can easily be adapted for a paired comparison t test).
5.4.7 Conduct an independent samples t test
- a two mean t test (the relevant formulae are given in the list, but not
the formula for degrees of freedom). 5.5 Chi-square tests 5.5.1 Recognise when a chi-squared test
is needed. 5.5.2 Conduct a test of a contingency table
(the relevant formula for the chi-squared test is given in the formulae list, but not the formula for degrees of freedom).
5.5.3 Test for randomness (the relevant
formula for the chi-squared test is given in the formulae list, but not the
formula for degrees of freedom).

16
5.5.4 Test for the goodness of fit when previous percentages are given (the relevant formula for the chi-squared test is given in the formulae list, but not the formula for degrees of freedom). Goodness of fit test of normal or other distributions is not expected.
5.6 Quality Control 5.6.1 Understand the advantages to
management of setting up a quality control procedure. 5.6.2 Understand the uses of control charts
for mean and range. Note: The construction of a range chart is
not expected.
5.6.3 Construct a mean chart using the
normal distribution 0.025 point for the warning line and 0.001 point for the action line.
Note: The formulae list does not provide the
A numbers; candidates will be expected to use the normal tables provided.
5.6.4 Plot sample means on a control chart
and interpret the results. 5.6.5 Use the normal distribution to evaluate
the probability of a single observation lying outside warning/action limits.
5.6.6 Use the normal distribution to evaluate
the probability of the mean of a sample lying outside the warning/action limits, if the mean is set incorrectly.
17
LEVEL 3

LEVEL 3
EDI
International House
Siskin Parkway East
Middlemarch Business Park
Coventry CV3 4PE
UK
Tel. +44 (0) 8707 202909
Fax. +44 (0) 2476 516505
Email. [email protected]
www.ediplc.com
© Education Development International Plc 2008. All rights reserved. This publication in its entirety is the copyright of Education Development
International Plc. Reproduction either in whole or in part is forbidden without the written permission from Education Development International Plc.