letter - w. m. keck observatory · letter a massive, quiescent galaxy at ... now been explained by...
TRANSCRIPT

LETTERA massive, quiescent galaxy at redshift of z=3.717Karl Glazebrook1, Corentin Schreiber2, Ivo Labbe2, Themiya Nanayakkara1,
Glenn G. Kacprzak1 Pascal A. Oesch3, Casey Papovich4,Lee R Spitler5,6, Caroline M. S. Straatman7, Kim-Vy H. Tran4, Tiantian Yuan8
1Centre for Astrophysics and Supercomputing, Swinburne University of Tech-nology, P.O. Box 218, Hawthorn, VIC 3122, Australia 2Leiden Observatory,Leiden University, PO Box 9513, 2300 RA Leiden, Netherlands. 3Geneva Ob-servatory, University of Geneva, Ch. des Maillettes 51, 1290 Versoix, Switzer-land 4George P. and Cynthia W. Mitchell Institute for Fundamental Physicsand Astronomy, Department of Physics and Astronomy, Texas A & M Univer-sity, College Station, TX 77843. 5Macquarie Research Centre for Astronomy,Astrophysics & Astrophotonics, Macquarie University, Sydney, NSW 2109,Australia 6Australian Astronomical Observatory, PO Box 915, North Ryde,NSW 1670, Australia. 7Max Planck Institute for Astronomy, Konigstuhl 17,69117 Heidelberg, Germany 8Research School of Astron. Astrophys., TheAustralian National University, Cotter Road, Weston Creek, ACT 2611, Aus-tralia.In the early Universe finding massive galaxies that have stoppedforming stars present an observational challenge as their rest-frame ultraviolet emission is negligible and they can only be re-liably identified by extremely deep near-infrared surveys. Thesehave revealed the presence of massive, quiescent early-typegalaxies1–6 appearing in the universe as early as z∼2, an epoch 3Gyr after the Big Bang. Their age and formation processes havenow been explained by an improved generation of galaxy formationmodels7–9 where they form rapidly at z∼3–4, consistent with thetypical masses and ages derived from their observations. Deepersurveys have now reported evidence for populations of massive,quiescent galaxies at even higher redshifts and earlier times, how-ever the evidence for their existence, and redshift, has relied en-tirely on coarsely sampled photometry. These early massive, qui-escent galaxies are not predicted by the latest generation of theo-retical models.7–10 Here, we report the spectroscopic confirmationof one of these galaxies at redshift z=3.717 with a stellar mass of1.7×1011 M whose absorption line spectrum shows no currentstar-formation and which has a derived age of nearly half the ageof the Universe at this redshift. The observations demonstratesthat the galaxy must have quickly formed the majority of its starswithin the first billion years of cosmic history in an extreme andshort starburst. This ancestral event is similar to those starting tobe found by sub-mm wavelength surveys11–14 pointing to a possi-ble connection between these two populations. Early formation ofsuch massive systems is likely to require significant revisions to ourpicture of early galaxy assembly.
The massive galaxy ZF-COSMOS-20115 was selected from a sam-ple of galaxies15 identified photometrically as having a spectral breakbetween the Hlong (1.7µm) and Ks (2.2µm) bands. This break, identi-fied as the redshifted hydrogen Balmer limit in intermediate age stellarpopulations, together with the full 36 band photometric spectral energydistribution (SED), suggests that these are quiescent at 3.5 < z < 4.1,with strongly suppressed star formation, stellar ages of 0.5–1 Gyr andlarge stellar masses (' 1011 M) driven by their K-band brightness.Alternate redshifts and SED solutions were strongly ruled out by thecombination of medium and narrow band photometry. ZF-COSMOS-
2.0 2.1 2.2 2.3observed wavelength (µm)
0
1
2
3
f λ (
10
−19 e
rg s
−1cm
−2A
−1) Hδ Hγ Hβ
c
telluric correctionmodelspectrum (20A binned)spectrum (70A filtered)
2.0 2.1 2.2 2.3observed wavelength (µm)
0
1
2
3
f λ (
10
−19 e
rg s
−1cm
−2A
−1)
b
a
Figure 1: Spectrum of ZF-COSMOS-20115 in the near-infrared K band. Thewavelength axis is the same in all three panels. The galaxy was also observedin H band, but continuum was not detected, which is consistent with the levelexpected from the photometric break between the H and K bands. a, Origi-nal 2D sky-subtracted K-band spectrum from MOSFIRE at its native resolution(λ/∆λ = 3200). The vertical white lines show where strong night sky residu-als were masked. b, Same 2D spectrum optimally smoothed with a boxcar filterto a lower resolution of 70A, to enhance visibility of the continuum and broadabsorption lines. c, The optimally-extracted 1D spectrum, both binned at 20Aresolution and smoothed by a boxcar filter of 70A to enhance the main absorp-tion features, as in b. Three strong Hydrogen Balmer absorption lines (Hβ, Hγand Hδ) are clearly seen, characteristic of a post-starburst spectrum. Balmeremission lines are not seen, confirming the lack of current star-formation. Anexample post-starburst template fit is overlaid. The grey band indicates the 1σnoise level, and the regions most affected by telluric corrections are also indi-cated by the labelled shading.
20115 is the brightest of this sample with KAB = 22.4 and has atypical SED for this population. It is very compact and red with aneffective radius16 of only 0.5 kpc. We obtained a K-band spectrum(Figure 1) which shows a significant continuum and clear Balmer ab-sorption lines of Hβ, Hγ and Hδ at z = 3.717. This is a significantlyearlier epoch (1.65 Gyr after the Big Bang) than previous spectroscopyof massive quiescent galaxies.1–6 The most distant prior example5 atz = 2.99 had spectrophotometry that required formation at z > 4,however the grism spectrum was too low resolution to show absorp-tion lines to confirm the nature of the stellar population. Balmer linesare a quintessential feature of a ‘post-starburst’ type-spectrum becausethey arise from A-type stars with lifetimes of 200–1000 Myr. Spec-troscopic absorption lines can provide robust age constraints as theyidentify specific time-sensitive stellar populations, whereas estimatesbased on multi-band photometry for red galaxies are very degeneratewith the dust attenuation and can be subject to systematic errors be-tween different instruments at different wavelengths17. The absenceof strong emission lines implies the previous SED-fitting and mass-estimate were robust.
In Figure 2 we show how the strength of the absorption lines by
1

themselves strongly constrain the age of the galaxy. We use the inte-grated equivalent width of the combined Hβγδ absorption lines, whichare the most robust measurement we can make from the spectra, andcompare with stellar population models where there is initial period ofintense star-formation, followed by a period of quiescence (full detailsare given in the Supplementary Section). It takes at least 100–200 Myrof quiescence to reach the line strengths needed and the quiescent star-formation rate has to be at least a 100× less than during the formationperiod. The youngest possible spectroscopic age is 200–700 Myr andis obtained from near-instantaneous formation (∼< 50 Myr) and solarabundances in the stellar population. Younger ages, while potentiallymore compatible with cosmological constraints (as discussed below),require short formation times and very high early star-formation rates(> 2000M yr−1). If star formation is more extended in time, or thegalaxy is metal-poor, the the implied age of this galaxy would be sig-nificantly older (see Figure 2).
With a firmly established spectroscopic redshift the photometry it-self is also now much more constraining on the formation history andwe can rule out degeneracies with dusty SEDs and contamination fromemission lines. We ran a large grid of our star-formation history models(see Supplementary Section) to optimally combine the spectroscopicand photometric information. This gives a combined constraint on thestellar age of' 700 Myr and a much tighter constraint on the formationtime with rapid formation in a period of ∼< 250 Myr. Full results anderror ranges are given in Table 1, the age uncertainty is only 16% theage of the Universe at z = 3.717 which is a significant improvementon lower redshift results1–6 and in particular does not include z < 4solutions. The stellar mass we see is relatively unobscured. Since thereare degeneracies between star-formation history parameters the mostrobust way to present the mass assembly history of this galaxy is tomarginalise across this grid of models to calculate bounds on the stellarmass as a function of cosmic time and redshift (Figure 3). Marginal-ising the rest-frame optical SED modelling also shows that <0.1% ofthe observed stellar mass formed within the last 200 Myr. Current star-formation is either negligible (< 4 M yr−1 from Hβ emission, con-sistent with the SED), or so extremely obscured that it is not visible atrest-frame 1–2 µm mimicking the purely passive SED. Longer wave-length data (see Methods) reveals a faint nearby ALMA source ('6effective radii distant), if part of a more extended system this wouldgive an obscured star-formation limit of ∼< 50–200 M yr−1 whichcorresponds to at most 4–15% of the stellar mass forming within theprevious 200 Myr. However this does not change the formation historyderived for the massive stellar population revealed by the MOSFIREspectrum.
There are a number of significant implications from this spectro-scopic confirmation of the existence of a quiescent galaxy population15
at z ∼ 4 with stellar masses of ∼ 1011M and a space density of1.8 ± 0.7 × 10⁻⁵ Mpc−3. These are not seen in modern hydrody-namical (i.e. dark matter and baryon physics) simulations of galaxyformation7, 9, 10 whose volumes now approach ∼ 106 Mpc3. In thesesimulations galaxies do exist at z ∼ 4 with similar stellar massesand abundances but they are still actively forming stars due to cosmicaccretion18. They do not exist in either mode at z > 5. The age andrapid formation time of ZF-COSMOS-20115 points to the formation ofthe the majority of the stellar mass in a single starburst event at z > 5,perhaps triggered by a single major merger, as opposed to a series ofmergers of galaxies with different star-formation histories. Such rapidformation is not ruled out by dynamical arguments, the compact sizeimplies a freefall timescale (Gρ)−1/2 of only a few Myr.
Where are the ancestors of galaxies like ZF-COSMOS-20115which must have had a star-formation rate of ∼> 1000 M yr−1 atz > 5? Such galaxies are not seen in rest-frame ultraviolet censuses19, 20. We make a plausible connection to dust-obscured star-forming
Table 1: Physical parameters of ZF-COSMOS-20115.
Parameter Value∗ CommentPhotometric redshift 3.55 ± 0.06 from Ref [15]Spectroscopic redshift 3.717 ± 0.001Stellar Mass (1.46 − 1.82) × 1011 M From equivalent
width constrainedSED fit at spectro-scopic redshift
Effective Radius 0.49 ± 0.12 kpc radius enclosinghalf the stellarmass, from Ref [16]
Current star formation rate < 0.2 M yr−1 Hβ emission lineflux limit gives < 4M yr−1
Age (tobs) 500 − 1050 MyrFormation timescale (tsf ) < 250 MyrPeak star formation rate > 990 M yr−1 (and > 350 M
yr−1 at 95% confi-dence)
Truncation amount fdrop < 10−4
Metallicity — no significant con-straint
Extinction 0.4–0.6 mags (AV )
*Error ranges from SED fits (+ spectrum constraint) are based on 16, 84 percentiles(two-sided) and 68 percentiles (one-sided). tobs, tsf and fdrop are parameters of our
general star-formation history models and are defined in the Supplementary Information.
0 200 400 600 800 1,000 1,200Star-formation time (Myr)
0
200
400
600
800
1000
1200
1400
1600
Age
of G
alax
y (M
yr)
Z=0.004 (total truncation)
Z=0.008
Z=0.02+100x SFR drop
Z=0.05
100 Myr quiescence400 Myr quiescence700 Myr quiescence2,000 1,000 500 200
Formation SFR (Msun yr -1)
10
8
6
5
4
2015
Red
shift
of f
orm
atio
n
Figure 2: Allowed age and formation timescales of ZF-COSMOS-20115.These constraints are derived purely from the strength of the absorption linesin the spectrum. To accomodate an age even as young as 200–700 Myr, thegalaxy must have solar metallicity and an early star-formation rate> 1000 Myr−1. More extended formation times require a much older age. The shadedareas (labelled by metallicity, with the solar metallicity case Z = 0.02 plottedon top for clarity) show the age and star-formation time values (tobs and tsf asdefined in the Methods section) allowed within 1σ by the equivalent width mea-surement, for models where star-formation is totally shut off during quiescence.For solar metallicity we also show the more limited range allowed if the star-formation rate truncation is only a factor of 100. (Smaller truncation factors areinconsistent with the line strengths). The top and right axes relate the age andstar-formation time to redshift and early star-formation rate respectively. Theblue dashed lines show lines of constant quiescence time.
2

galaxies11, a handful have been spectroscopically confirmed12–14 atz > 5 due to their intense sub-mm emission corresponding to simi-lar star formation rates > 1000 M yr−1. In one well-characterisedcase13 at z = 6.3 the stellar mass would have to increase five-fold tomatch ZF-COSMOS-20115 but given the object’s star-formation ratethis would only take 50 Myr. Compact sub-mm galaxies at 3 < z < 5have been similarly identified21, 22 as likely ancestors of similar com-pact quiescent galaxies at z ∼ 2. Recent deep sub-mm surveys23 finda space density of 3 × 10⁻⁶ Mpc−3 for 5 < z < 6 galaxies withstar-formation rates of ∼> 300 M yr−1 (noting most redshifts wereapproximately estimated from the position of the sub-mm SED peak).The ratio of space densities would imply a short star-formation duty cy-cle of∼40 Myr. However none of these z > 5 objects, in a survey vol-ume of∼ 20×106 Mpc3, has the necessary star-formation rate∼> 1000
M yr−1 and the reported stellar mass density growth contributed bythe sub-mm sources is only a third of that required to make the quies-cent galaxies15. Deeper and wider sub-mm surveys with more completespectroscopic confirmation are required to further investigate this. Re-gardless our spectroscopic confirmation establishes that there must bea number of such extreme early events, which have a significant spacedensity at 5 < z < 8 (we strongly rule out redshifts z > 10 not yetprobed by optical/IR surveys) and are not seen in simulations7, 9, 10.
The space density of massive galaxies at high-redshift is an im-portant constraint on cosmological models8, 24 as dark matter halos aregrowing rapidly and have to be massive and abundant enough to hostthem. Our quiescent galaxy space density at z ∼ 4 corresponds to adark matter halo mass25 of ∼ 3 × 10¹² M. Thus, given the stellarmass of ZF-COSMOS-20115 and a cosmic baryon fraction26 of 16%,this requires 35% of all the halo baryons to form into stars. If thegalaxy formed at z ∼ 5 then it would require 80% of the halo baryons.If we plot the bound on mass growth of such halos (Figure 3) it in-creases very similarly with redshift to the best fit stellar mass growthfrom the SED implying the galaxy could not have formed significantmass prior to z ∼ 7. We require a very rapid and efficient conversionof halo baryons in to stellar mass at 5 < z < 6, which is why theyare not produced in current theoretical models. Conversely after z ∼ 4this must then quickly become much less efficient. The most massivegalaxies at z ∼ 0 have substantially lower stellar baryon fractions27
of only 5–10% (a constraint current theoretical models tune their star-formation efficiencies to match), thus the halo must continue to grow atz < 4 without significant further conversion of baryons to stellar mass.Rest-frame ultraviolet surveys24, 28, 29 of lower star-formation rate z > 5galaxies have also found stellar baryon fractions of ∼30% at z > 5,these are lower than needed for our ancestral population but still signif-icantly higher than in the local Universe.
What is clear is that either significant revisions of the physical in-gredients of galaxy formation and possibly our standard model of colddark matter halo assembly are needed to explain the rapid formation,and sudden and deep quenching, of massive galaxies in the very earlyUniverse in a manner reminiscent of pre-cold dark matter pictures ofgalaxy formation30. Stellar mass is not a transitory phenomenon andso this observation suggests that extreme star-formation events in theearly Universe are not just rare events, they play a significant role inearly mass assembly and there must be a substantial population thatwill be systematically uncovered by future surveys. We note that thisis just the first spectroscopic confirmation of a bright, massive exam-ple of the z ∼ 4 quiescent galaxy population. Future spectroscopicstudies of the fainter quiescent population will reveal if ZF-COSMOS-20115 is typical. When launched, the James Webb Space Telescopewill be able to get high signal-to-noise rest-frame optical spectroscopyof these galaxies and will enable detailed elemental abundances andstar-formation histories to be measured for this dim red population.
456789Redshift
0.0
0.5
1.0
1.5
2.0
2.5
3.0
Ste
llar M
ass
(1011
Msu
n)
95%
68%
SFR=600M
sun yr
-1
SFR=
700M
sun y
r -1
SFR
=900
Msu
n y
r -1
SFR
=1,4
00M
sun y
r -1
Max baryons in halo
500 700 1,000 1,500Cosmic time (Myr)
Figure 3: Stellar mass assembly history of ZF-COSMOS-20115. These con-straints are derived from the full spectroscopic and photometric data, andmarginalised across the grid of star-formation history models with rapid for-mation, followed by deep quiescence. The red line shows the median stellarmass content as a function of redshift in the model grid, with the arrow denotingthe epoch of observation. The colored bands show the 68% and 95% confidencelimits on the stellar mass at each redshift. For comparison the mass growth ofa set of constant star-formation rate models, starting at different arbitrary red-shifts, are shown as blue dashed lines. The green line shows the maximummass of baryons allowed in dark matter halos with the same number densityas the z ∼ 4 quiescent galaxies population. ZF-COSMOS-20115 is robustlyconstrained to have been quiescent since z ∼ 5 with a rapid earlier assembly.The slow decline in stellar mass at late times is caused by mass loss from stellarevolution.
1. Dunlop, J. et al. A 3.5-Gyr-old galaxy at redshift 1.55. Nature 381, 581–584 (1996).
2. Cimatti, A. et al. Old galaxies in the young Universe. Nature 430, 184–187 (2004).
3. McCarthy, P. J. et al. Evolved Galaxies at z > 1.5 from the Gemini DeepDeep Survey: The Formation Epoch of Massive Stellar Systems. Astro-phys. J. 614, L9–L12 (2004).
4. Cimatti, A. et al. GMASS ultradeep spectroscopy of galaxies at z ∼ 2.II. Superdense passive galaxies: how did they form and evolve? As-tron. Astrophys. 482, 21–42 (2008).
5. Gobat, R. et al. The Early Early Type: Discovery of a Passive Galaxy atzspec ∼ 3. Astrophys. J. Lett. 759, L44 (2012).
6. Belli, S., Newman, A. B. & Ellis, R. S. Stellar Populations from Spec-troscopy of a Large Sample of Quiescent Galaxies at Z > 1: Measuringthe Contribution of Progenitor Bias to Early Size Growth. Astrophys. J.799, 206 (2015).
7. Wellons, S. et al. The formation of massive, compact galaxies at z = 2 inthe Illustris simulation. Mon. Not. R. Astron. Soc. 449, 361–372 (2015).
8. Behroozi, P. & Silk, J. The Most Massive Galaxies and Black Holes Al-lowed by ΛCDM. Preprint at https://arxiv.org/abs/1609.04402(2016).
9. Dave, R., Thompson, R. & Hopkins, P. F. MUFASA: galaxy formationsimulations with meshless hydrodynamics. Mon. Not. R. Astron. Soc.462, 3265–3284 (2016).
10. Park, K. et al. Luminosity function of [O II] emission-line galaxies in theMassiveBlack-II simulation. Mon. Not. R. Astron. Soc. 454, 269–279(2015).
11. Blain, A. W., Smail, I., Ivison, R. J., Kneib, J.-P. & Frayer, D. T. Submil-limeter galaxies. Phys. Rep. 369, 111–176 (2002).
12. Capak, P. L. et al. A massive proto-cluster of galaxies at a redshift of z ∼5.3. Nature 470, 233–235 (2011).
13. Riechers, D. A. et al. A dust-obscured massive maximum-starburstgalaxy at a redshift of 6.34. Nature 496, 329–333 (2013).
14. Ma, J. et al. SPT0346-52: Negligible AGN Activity in a Compact, Hyper-starburst Galaxy at z = 5.7. Astrophys. J. 832, 114 (2016).
15. Straatman, C. M. S. et al. A Substantial Population of Massive QuiescentGalaxies at z ∼ 4 from ZFOURGE. Astrophys. J. Lett. 783, L14 (2014).
3
16. Straatman, C. M. S. et al. The Sizes of Massive Quiescent and Star-forming Galaxies at z ∼ 4 with ZFOURGE and CANDELS. Astro-phys. J. Lett. 808, L29 (2015).
17. Papovich, C. et al. Spitzer Observations of Massive, Red Galaxies atHigh Redshift. Astrophys. J. 640, 92–113 (2006).
18. Rodriguez-Gomez, V. et al. The stellar mass assembly of galaxies inthe Illustris simulation: growth by mergers and the spatial distribution ofaccreted stars. Mon. Not. R. Astron. Soc. 458, 2371–2390 (2016).
19. Smit, R. et al. The Star Formation Rate Function for Redshift z ∼ 4-7Galaxies: Evidence for a Uniform Buildup of Star-forming Galaxies duringthe First 3 Gyr of Cosmic Time. Astrophys. J. 756, 14 (2012).
20. Salmon, B. et al. The Relation between Star Formation Rate and StellarMass for Galaxies at 3.5 ≤ z ≤ 6.5 in CANDELS. Astrophys. J. 799, 183(2015).
21. Ikarashi, S. et al. Compact Starbursts in z ∼ 3-6 Submillimeter GalaxiesRevealed by ALMA. Astrophys. J. 810, 133 (2015).
22. Simpson, J. M. et al. The SCUBA-2 Cosmology Legacy Survey: ALMAResolves the Rest-frame Far-infrared Emission of Sub-millimeter Galax-ies. Astrophys. J. 799, 81 (2015).
23. Michałowski, M. J. et al. The SCUBA-2 Cosmology Legacy Survey: thenature of bright submm galaxies from 2 deg2 of 850-um imaging. Preprintat https://arxiv.org/abs/1610.02409 (2016).
24. Steinhardt, C. L., Capak, P., Masters, D. & Speagle, J. S. The ImpossiblyEarly Galaxy Problem. Astrophys. J. 824, 21 (2016).
25. Murray, S. G., Power, C. & Robotham, A. S. G. HMFcalc: An onlinetool for calculating dark matter halo mass functions. Astron. Comput. 3,23–34 (2013).
26. Collaboration, P. et al. Planck 2015 results. XIII. Cosmological parame-ters. Astron. Astrophys. 594, A13 (2016).
27. Baldry, I. K., Glazebrook, K. & Driver, S. P. On the galaxy stellar massfunction, the mass-metallicity relation and the implied baryonic massfunction. Mon. Not. R. Astron. Soc. 388, 945–959 (2008).
28. Finkelstein, S. L. et al. An Increasing Stellar Baryon Fraction in BrightGalaxies at High Redshift. Astrophys. J. 814, 95 (2015).
29. Sun, G. & Furlanetto, S. R. Constraints on the star formation efficiencyof galaxies during the epoch of reionization. Mon. Not. R. Astron. Soc.460, 417–433 (2016).
30. Eggen, O. J., Lynden-Bell, D. & Sandage, A. R. Evidence from themotions of old stars that the Galaxy collapsed. Astrophys. J. 136, 748(1962).
Acknowledgements KG acknowledges support from Australian Re-search Council (ARC) Discovery Program (DP) grant DP130101460 andDP160102235. GGK acknowledges the support of the Australian ResearchCouncil through the award of a Future Fellowship (FT140100933). This paperis based primarily on observations taken at the W.M. Keck Observatory andthe authors wish to recognize and acknowledge the very significant culturalrole and reverence that the summit of Mauna Kea has always had within theindigenous Hawaiian community. We are most fortunate to have the opportu-nity to conduct observations from this mountain and we hope we will be ableto continue to do so.
Author Roles K.G. led the project, directed the observations, measured theequivalent width, performed the star-formation history modelling analysis andwrote the paper. C. Schreiber (C.S.) T.N. and T.Y. reduced the MOSFIRE data.C.S. did the optimal 1D stacking and extraction of the spectra assisted by I.L.G.K. did the mask design and assisted with the observing. Other authorsassisted with the observations and commented on the paper.
Competing Interests The authors declare that they have no competing fi-nancial interests.
Correspondence Correspondence and requests for materials should beaddressed to K.G. (email: [email protected]).
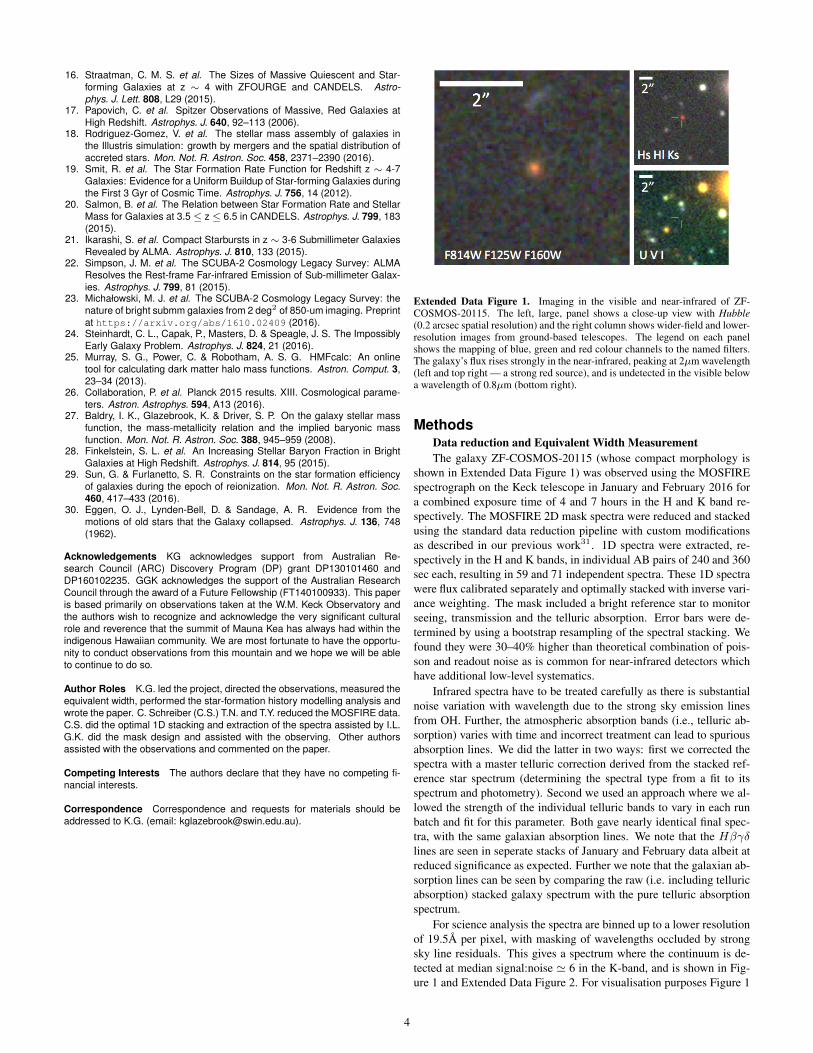
Extended Data Figure 1. Imaging in the visible and near-infrared of ZF-COSMOS-20115. The left, large, panel shows a close-up view with Hubble(0.2 arcsec spatial resolution) and the right column shows wider-field and lower-resolution images from ground-based telescopes. The legend on each panelshows the mapping of blue, green and red colour channels to the named filters.The galaxy’s flux rises strongly in the near-infrared, peaking at 2µm wavelength(left and top right — a strong red source), and is undetected in the visible belowa wavelength of 0.8µm (bottom right).
MethodsData reduction and Equivalent Width MeasurementThe galaxy ZF-COSMOS-20115 (whose compact morphology is
shown in Extended Data Figure 1) was observed using the MOSFIREspectrograph on the Keck telescope in January and February 2016 fora combined exposure time of 4 and 7 hours in the H and K band re-spectively. The MOSFIRE 2D mask spectra were reduced and stackedusing the standard data reduction pipeline with custom modificationsas described in our previous work31. 1D spectra were extracted, re-spectively in the H and K bands, in individual AB pairs of 240 and 360sec each, resulting in 59 and 71 independent spectra. These 1D spectrawere flux calibrated separately and optimally stacked with inverse vari-ance weighting. The mask included a bright reference star to monitorseeing, transmission and the telluric absorption. Error bars were de-termined by using a bootstrap resampling of the spectral stacking. Wefound they were 30–40% higher than theoretical combination of pois-son and readout noise as is common for near-infrared detectors whichhave additional low-level systematics.
Infrared spectra have to be treated carefully as there is substantialnoise variation with wavelength due to the strong sky emission linesfrom OH. Further, the atmospheric absorption bands (i.e., telluric ab-sorption) varies with time and incorrect treatment can lead to spuriousabsorption lines. We did the latter in two ways: first we corrected thespectra with a master telluric correction derived from the stacked ref-erence star spectrum (determining the spectral type from a fit to itsspectrum and photometry). Second we used an approach where we al-lowed the strength of the individual telluric bands to vary in each runbatch and fit for this parameter. Both gave nearly identical final spec-tra, with the same galaxian absorption lines. We note that the Hβγδlines are seen in seperate stacks of January and February data albeit atreduced significance as expected. Further we note that the galaxian ab-sorption lines can be seen by comparing the raw (i.e. including telluricabsorption) stacked galaxy spectrum with the pure telluric absorptionspectrum.
For science analysis the spectra are binned up to a lower resolutionof 19.5A per pixel, with masking of wavelengths occluded by strongsky line residuals. This gives a spectrum where the continuum is de-tected at median signal:noise ' 6 in the K-band, and is shown in Fig-ure 1 and Extended Data Figure 2. For visualisation purposes Figure 1
4

Extended Data Figure 2. Illustration of the equivalent width measurement.The red line shows the 19.5A (observed frame) spectral bins, the blue pointsare the clean regions of the spectrum used for continuum fitting, the blue line isthe continuum fit, and the yellow shaded areas represent the Balmer line regionssummed for the equivalent width measurement.
also shows this smoothed with a 70A gaussian filter, but all scienceanalysis is done on the binned spectrum where the noise of each pixelis statistically independent.
We choose to measure the combined equivalent width of all threelines, to maximise the signal:noise robustly on a single measurement.We prefer here not to do full-spectrum fitting due to the complex resid-uals from skylines and imperfect telluric corrections that are typicallypresent in near-infrared spectra, and because equivalent width doesnot change with velocity dispersion and is robust against exact lineshape. We measure this equivalent width by integrating with uniformweighting across all three lines to maximise the signal-to-noise ratio.These are rest frame bandpasses we define as 4081–4119A (Hδ), 4324–4374A (Hγ), 4777–4900A (Hβ), i.e. a custom equivalent width index.The continuum level is interpolated at each wavelength from a jointlinear fit to the bandpasses 4175–4236A, 4416–4777A, 4900–4950A,these were selected to define regions near the lines but to avoid regionsaffected by strong telluric corrections or potential emission lines. Wemeasure an equivalent width of 37.6± 5.6A in this index, i.e. accurateto 15%. Extended Data Figure 2 illustrates our equivalent width def-inition and measurement. To avoid any systematic bias, we apply thesame procedure to the model spectra to derive their predicted equiva-lent widths.
Star-formation history modelsWe define our star-formation model as:
1. The galaxy forms its stars at a constant rate C, for a period tsf
2. It then truncates to form stars at a reduced rate Cfdrop for quies-cent period tqu. For total truncation fdrop = 0.
3. The galaxy is observed at an age tobs = tsf + tqu and tobs mustbe less than 1.65 Gyr, which is the age of the Universe at z =3.717 (adopting a flat cosmology26 with Ωm = 0.3, Ωλ = 0.7,h = 0.7).
We used the PEGASE.2 spectral evolution of stellar populationmodels32 using default parameters and the Chabrier Initial Mass Func-tion. In our model grid we allow tsf to vary between 10 and 1000Myr and fdrop to vary with a logarithmic spacing between unity and
Extended Data Figure 3. Spectral energy distribution (SED) and model fits ofZF-COSMOS-20115. The fit is performed with PEGASE.2, and is constrainedby the spectroscopic redshift and equivalent widths obtained from the MOS-FIRE spectrum. a, The SED in AB magnitude (equivalent to log fν ). b, Thesame SED in fλ. In both plots the SED is shown as a function of log λ, and thepoints with error bars show the photometry measurements and their respective1σ uncertainty. The black line is the best fit model, which has tsf = 50 Myrand tobs = 700 ± 255 Myr (i.e. effectively forming in a near-instantaneousburst at z = 5.8). The age is strongly constrained by the peak at 2µm in fλ andthe decline redwards. We also note the galaxy is a well detected source in theSpitzer/IRAC 3-6µm images, and though the PSF there is coarse and does notallow us to resolved the galaxy, the fluxes suffer negligible flux contaminationfrom neighboring galaxies.
10−10 (i.e., essentially zero). The value of C is determined from thenormalisation of the stellar template when fitted to the photometry andspectrum, and the equivalent width does not depend on it. The metal-licity of the models is allowed to vary between 0.004 and 0.05 (i.e 2.5solar) and dust extinction is free to vary over 0 < AV < 2 mags.The models include emission lines of intensity proportional to the star-formation rate; strong emission lines can reduce the equivalent widthor even make it go negative. For each model and time step we computethe photometric fluxes through our filters, and the equivalent width,evaluated at the spectroscopic redshift.
The photometry33 of ZF-COSMOS-20115 covers wavelengths0.4–8.0µm using a combination of ground-based optical and near-infrared imaging, Hubble Space Telescope optical/near-infrared imag-ing and Spitzer/IRAC space-based imaging with careful matching be-tween bands to generate accurate SED. We note that this source waspreviously attributed the ID #13172 in earlier papers15,16, which werebased on a preliminary version of the photometric catalog.
While the photometry consists of 36 photometric data points, weonly have one spectroscopic measurement — the equivalent width. To
5

200 400 600 800 1,000 1,200tsf (Myr)
400
600
800
1,000
1,200
1,400
1,600
t obs (
Myr)
t qu= 2
00 M
yrt qu
= 5
00 M
yrt qu
= 8
00 M
yr
0
0.5
1
Rela
tive P
robabili
tyExtended Data Figure 4. Illustration of the most significant parameter degen-eracy in the model fitting, between tobs and tsf . The image color scale showsthe distribution of Monte-Carlo models that fall in each bin. Very short tsf ispreferred though there is a tail of probability towards longer tsf and tobs. Thedashed blue lines show lines of constant quiescence time tqu = tobs − tsf .This figure shows the same degeneracy trend as in Figure 2, this is becausethe photometric age constraints have a similar sensitivity to the Balmer lines asthe spectrum, via the strong Balmer break between the Hlong (1.7µm) and Ks
(2.2µm) bands.
give the latter maximum leverage, we fit the data by minimising theχ2 across the grid with respect to the photometry, with the strong con-straint that all allowed models must match the equivalent width obser-vation within 2σ. To estimate errors we run a gaussian Monte-Carloperturbation of the photometric errors around the best fit model. Thebest such ‘joint fit’ is shown in Extended Data Figure 3. The Monte-Carlo run allows us to estimate the parameter distributions. Typicalfitting metallicities are 0.4–1.0 solar; super-solar models do not fit asthey only produce suitably high equivalent widths for a shorter timepost-burst which then becomes inconsistent with the photometry. Wefind low extinctions (AV ∼ 0.4–0.6), tsf ∼< 250 Myr (with effec-tively instantaneous bursts with tsf = 10 Myr being allowed), age of700± 255 Myr and a quiescent time tqu ' 400–700 Myr.
To test the robustness of the fit we performed a jackknife test wherewe were deleted each point in the SED in turn. We found consistentages and errors in all cases showing the fit is not driven by any partic-ular point. However if we delete both K-band measurements (whichcome from independent telescopes) the age errors increase ∼ 50%.This is expected as it is the Balmer break, peaking in the K band, thatmost strongly constrains the age.
To double check these results we also used an independent code,with different underlying spectral evolution models, FAST34 to fit thespectrum and SED using simple SFR(t) ∝ t e−t/τ models. We findconsistent results with PEGASE.2, i.e. (τ = 20 ± 40 Myr) and aconsistent age (∼ 630 ± 240 Myr). Dust extinction values are similarand metallicity is poorly constrained. In both cases we find a best fitstellar mass of 1.7× 10¹¹ M.
The fits cover a complex parameter space of bursts lasting for dif-ferent periods and observed at different ages, many of which give ac-ceptable fits. It is therefore not particularly illuminating to quote asingle best-fitting age and peak star-formation rate. Extended DataFigure 4 shows the parameter space of tsf and tobs, which shows theprinciple degeneracy where longer formation times drive older ages.To present the constraints in the most meaningful way, we marginalise
over the fits and calculate mass assembly histories by integrating eachstar-formation history in the Monte-Carlo run. This integration is per-formed by PEGASE.2, hence accounts for recycling and other second-order processes. As mass is an integral, this is the most robust way ofpresenting the results, which are presented and discussed in the maintext and shown in Figure 3.
Halo Mass calculationsWe use the online tool of [25] and compute halo mass functions for
our fiducial cosmology and evaluate the mass for which the number ofhalos with mass greater than this is 1.8 × 10⁻⁵ Mpc−3. We checkedseveral different expressions for the ‘f(σ)’ term in the fitting formula(Table 3 in [25]) and find the halo results do not vary significantly.For our final calculations we adopt the f(σ) given in their ‘Reed et al.2007’ table row35, which is optimal for our redshift range.
Long-Wavelength dataTo place limits on obscured star-formation we checked far-infrared
and sub-mm surveys of the COSMOS field15, 36. The galaxy is unde-tected in Spitzer/MIPS and Herschel PACS/SPIRE. The 3σ upper lim-its from Herschel are 5.7, 7.2, 9.0 mJy at 250, 350, 500µm respectively.ALMA detects a very faint 1.52± 0.25 mJy point source at 345 Ghz adistance 0.5 ± 0.1 arcsec from the optical centre. There is no ALMAemission from the optical location. The ALMA astrometry is alignedwith accurate radio data from the Very Large Array in this field anda cross-check with our optical/near-IR catalogs show that any system-atic errors are < 0.05 arcsec. For a source at z = 3.7 the ALMAand Herschel fluxes would be consistent with maximum obscured star-formation rates∼< 50–200 M yr−1 and an associated dust temperatureof <35K. Further observations and analysis are in progress to deter-mine if the ALMA source is at the same redshift, whether it is poweredby star-formation, and if is a companion galaxy or part of the samesystem.
31. Nanayakkara, T. et al. ZFIRE: A KECK/MOSFIRE Spectroscopic Surveyof Galaxies in Rich Environments at z ∼ 2. Astrophys. J. 828, 21 (2016).
32. Fioc, M. & Rocca-Volmerange, B. PEGASE.2, a metallicity-consistentspectral evolution model of galaxies: the documentation and the code.Preprint at https://arxiv.org/abs/astro-ph/9912179 (1999).
33. Straatman, C. M. S. et al. The FourStar Galaxy Evolution Survey(ZFOURGE): Ultraviolet to Far-infrared Catalogs, Medium-bandwidth Pho-tometric Redshifts with Improved Accuracy, Stellar Masses, and Confirma-tion of Quiescent Galaxies to z 3.5. Astrophys. J. 830, 51 (2016).
34. Kriek, M. et al. An Ultra-Deep Near-Infrared Spectrum of a CompactQuiescent Galaxy at z = 2.2. Astrophys. J. 700, 221–231 (2009).
35. Reed, D. S., Bower, R., Frenk, C. S., Jenkins, A. & Theuns, T.The halo mass function from the dark ages through the present day.Mon. Not. R. Astron. Soc. 374, 2–15 (2007).
36. Schreiber, C., Panella, M., Leiton, R., Elbaz, D., Wang, T., Okamura, K.,& Labbe, I. The ALMA Redshift 4 Survey (AR4S): I. The massive end ofthe z=4 main sequence of galaxies. Astron. & Astrophys. in press (2016).
Code availability The spectrophotometric codes (PEGASE.2 and FAST)are publicly available. The high-level Perl Data Language scripts which usePEGASE.2 to model our custom star-formation histories are available on re-quest, noting this is a standard technique and is easily reproduced.
Data availability The spectrum (Figure 1) and best fit mass-assembly his-tories (Figure 3) of ZF-COSMOS-20115 are made available along with thismanuscript as Source Data. The other data that support the plots within thispaper and other findings of this study are available from the correspondingauthor upon reasonable request.
6