letter to the editor a risk prediction model for ischemic
TRANSCRIPT

Letter to the Editor
A Risk Prediction Model for Ischemic Stroke in SouthernChinese Population: Impact of Multiple Genetic Variants andClinical/Lifestyle Factors*
YE Cheng Yin1,&, LI Jin Mei1,&, WU Jing Hua1, LI Zheng1, XIAO Juan1, YIN Xiao Yu1,
WANG Da Hui1, XU Guo Zhang2,#, and YANG Lei1,#
With a global prevalence of 7.7 million,ischemic stroke (IS) is one of the leading causes ofdeath and disability worldwide. In China, IS alonecontributed to 69.6% of stroke events andaccounted for 37.1% of the mortality/disabilityrate[1]. IS is a complex disease that is known to beassociated with various genetic variants and clinicaland lifestyle risk factors[2]. Genome ‐wideassociation studies (GWAS) provided evidence forthe occurrence of more than 160 IS‐associated singlenucleotide polymorphisms (SNPs). In terms of clinicalrisk factors, patients with a history of chronicdiseases like hypertension, dyslipidemia, anddiabetes mellitus, display a higher risk of developingIS. Among the various lifestyle components, leadinga sedentary lifestyle, smoking, and having anunhealthy diet are known to be associated with therisk of IS. Thus, integration of various genetic,clinical, and lifestyle variables might prove to behighly beneficial in the prediction and prevention ofIS at the individual level[3].
The present study aimed to construct a riskprediction model for IS by simultaneousincorporation of both genetic variants andclinical/lifestyle indicators. The study involved aprospective cohort of the Southern Chinesepopulation. It is expected that the proposed modelcould be validated externally, and the obtainedsignificant features would assist in the interpretationof IS risk in the Chinese population, with a particularfocus on IS risk prediction at the individual level.
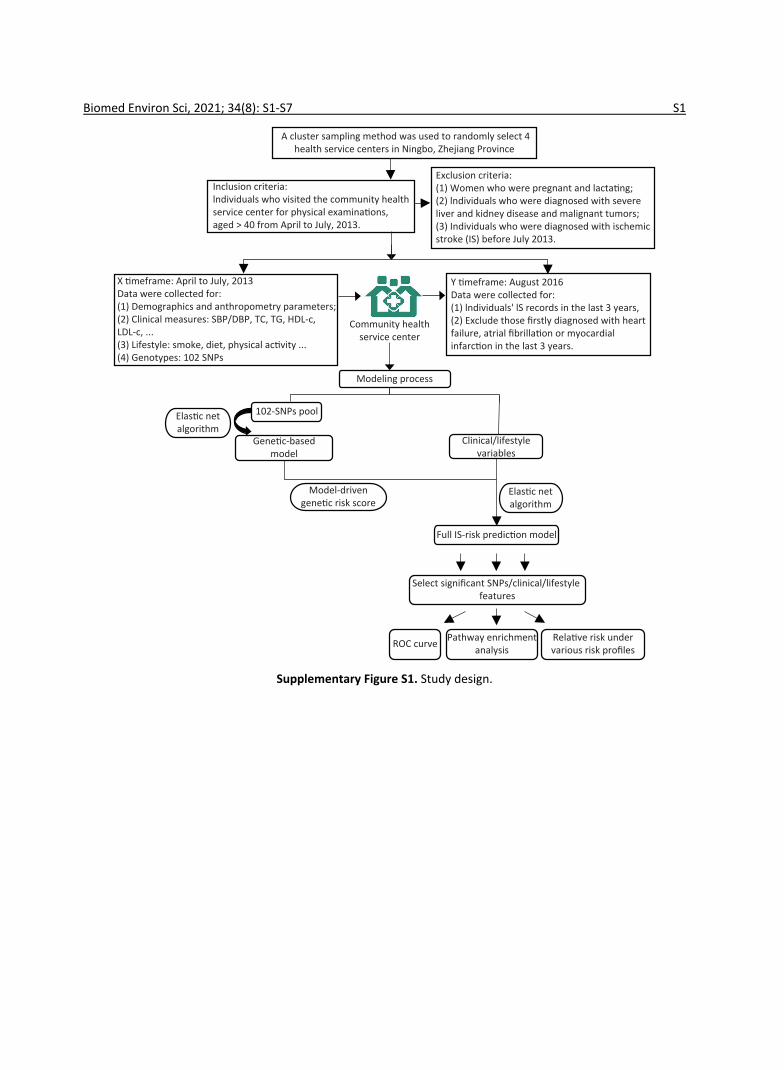
The study was conducted on subjects belongingto four community health service centers in theNingbo City of Zhejiang Province. Initially, a total of2,349 participants aged ≥ 40 years without any
history of IS were recruited from April–July 2013.Detailed inclusion and exclusion criteria followed inthe present study are described in SupplementaryFigure S1 (available in www.besjournal.com). Theclinical and physical parameters included in thepresent study were strictly defined. The informationregarding the demographic and lifestylecharacteristics of the subjects was collected using astandard questionnaire. The salient features of thequestionnaire are demonstrated in SupplementaryTable S1 (available in www.besjournal.com). After afollow up period of three years, the updated recordsfor each participant containing informationregarding the occurrence of any IS incidence wereobtained from the electronic health record database.During this 3‐year follow up, the individuals thatwere first diagnosed with heart failure, atrialfibrillation, or myocardial infarction were excludedfrom the study as such diagnoses might lead tosignificant changes in their lifestyles, which mightfurther act as confounding factors in the presentstudy. Consequently, 236 participants wereexcluded, and a total of 2,113 individuals wereincluded in the study.
Initially, the target SNPs were identified andselected from IS‐related genetic studies usingcommon databases. A standard SNP selectionprocess was implemented, which was previouslyestablished by Li et al.[4]. For genotyping, a total of102 SNPs were selected (Supplementary Table S2available in www.besjournal.com). For blood samplecollection, the participants were subjected toovernight fasting, and samples were drawn byvenipuncture, collected in vials containinganticoagulant EDTA, and preserved at −80 °C. DNA
doi: 10.3967/bes2021.089*This work was supported by the Program for Zhejiang Leading Team of Science and Technology Innovation [grant
number: No. 2011R50021]; Zhejiang Provincial Natural Science Foundation of China [grant number: No. LQ16H260002]; andit was also supported by the National Natural Science Foundation of China [grant number: No.81402762].
1. Medical School, Hangzhou Normal University, Hangzhou 310000, Zhejiang, China; 2. Ningbo Municipal Center forDisease Control and Prevention, Ningbo 315000, Zhejiang, China
Biomed Environ Sci, 2021; 34(8): 641‐645 641

was extracted using Tiangen Blood Genomic DNAextraction kits. For genotyping, the polymerase chainreaction (PCR)/ligase detection reaction (LDR) wereadopted. The PCR reactions contained 1 μL genomicDNA, 1.5 μL 10× PCR buffer, 1.5 μL MgCl2, 0.3 μLdNTPs, 0.15 μL each primer, and 0.2 μL Taq DNApolymerase in a total volume of 15 μL, and wereperformed in an ABI Prism 7000 Sequence DetectionSystem with an initial melting at 94 °C for 3 min, 35cycles of denaturation at 94 °C for 15 s, annealing at55 °C for 15 s, extension at 72 °C for 30 s, and finalextension at 72 °C for 3 min. Each ligation reactionincluded 3 μL PCR product, 1 μL 10× Taq DNA ligasebuffer, 5 U Taq DNA ligase, and 0.01 μL eachdiscriminating probe in a total volume of 10 μL, andwas carried out in 30 cycles at 94 °C for 30 s and56 °C for 3 min. Re‐sequencing results for 10% of thesamples showed that the concordance rates were >95% for all target SNPs.
β̂Elastic
In the present study, elastic net regression wasadopted for the modeling process[5]. In particular,this method introduces ℓ2 ‐norm and ℓ1 ‐normpenalties into the regularization term to deal withhigh correlation variables and estimates a series ofcoefficients as per the following Equation:
β̂Elastic = argminβ [− n
∑i=1
{yilog (π i) + (1 − yi) log (1 − π i)}+λ1
p
∑j=1
∣βj∣ + λ2p
∑j=1
β2j ]
yi ∈ {0,1}π i = p(yi = 1 ∣xi) = exp (xT
i β)1 + exp (xT
i β) , i = 1,2,⋯, n.
Here, denotes the response variable
and The
tuning parameters λ1 and λ2 determine theregularized logistic regression solution andcoefficient estimates. In this study, 102 SNPs and 27clinical/lifestyle covariates were used in theconstruction of IS risk prediction model. Individuals’final risk scores were obtained, and they werefurther classified into three IS risk categories(high/intermediate/low). In particular, positivepredictive values (PPVs), sensitivity, and specificitywere calculated. The discriminative ability of theconstructed models was measured in terms of thearea under curves (AUC). In terms of the givencaptured predictors, the impact of various riskprofiles on IS was evaluated, and R software, version3.6.1, was used for analysis. Further, for theidentification of KEGG/Reactome pathways and geneontology (GO) function interpretations, the
enrichment analysis tool g:Profiler was adopted[6].Among 2,113 participants recruited in this study,
3.17% were newly diagnosed with IS by August 2016.Supplementary Table S3 (available in www.besjournal.com) summarizes the baseline features,which were statistically compared between casesand controls. Interestingly, age, height, SBP, clinicalhistory of hypertension, and dietary habits involvingthe consumption of egg, red meat, chicken, and fishshowed significant differences between cases andcontrols, with P < 0.05.
At the initial genetic ‐based modeling stage,elastic net regression was applied on 102 SNPsselected from common databases. Further, theperformance of all candidate models was evaluatedusing 10‐fold cross ‐validation, and the model withthe highest fitted AUC value was recognized as thebest model. As shown in Figure 1, thederived/resulting genetic model captured 15 SNPsand was characterized by a fitted AUC of 0.691 (95%CI: 0.627–0.755). Following this, the model ‐drivengenetic risk scores were calculated for eachindividual and utilized for the construction of the fullmodel. In the next stage, 27 clinical/lifestylecovariates, including three demographic features,four anthropometric parameters, six clinicalmeasurements, clinical history of two diseases, and12 lifestyle variables, were used along with themodel ‐driven genetic risk scores for furthermodeling. Finally, a complete model for IS riskprediction was generated, with a fitted AUC of 0.846(95% CI: 0.803–0.89). This model identified fourparameters, including age, model‐driven genetic riskscore, SBP, and fish intake, as important predictorsof IS risk (Figure 1 and Supplementary Table S4available in www.besjournal.com).
The resulting full model was further used tocalculate the IS‐risk scores for each participant.Subsequently, the participants were classified intothree risk categories (Supplementary Table S5
Ture
pos
i�ve
rate
False posi�ve rate
Full model: AUC = 0.846(age, gene�c risk score,
SBP and fish intake)
1.0
0.8
0.6
0.4
0.2
00 0.2 0.4 0.6 0.8 1.0
Gene�c-based model: AUC = 0.691 (15 SNPs)
Figure 1. The ROC Curves of the genetic‐basedmodel and the full IS risk prediction model.
642 Biomed Environ Sci, 2021; 34(8): 641‐645

available in www.besjournal.com). Eventually,68.34% of 2,113 participants corresponded to thelow‐risk group, with only 0.76% of these participantsdeveloping IS during a 3‐year follow up period. Incomparison to this, the intermediate and high ‐riskgroups included 27.64% and 4.02% of theparticipants. Importantly, 5.82% and 25.88% of thesubjects belonging to intermediate and high ‐riskgroups, respectively, developed IS within threeyears. Interestingly, the risk of developing IS wasfound to be 34‐times higher in participantsbelonging to the high‐risk category as compared withthose categorized into the low ‐risk group. Theseresults further highlighted that the generated modeldisplayed a good discriminatory ability to identifypatients with a high risk of IS.
Further, the results of the univariate analysisrevealed that the four recognized features wereindependently associated with IS (Supplementary TableS6 available in www.besjournal.com). In particular,individuals aged ≥ 60 years (OR: 2.39, 95% CI:1.39–4.95), having elevated SBP (regression coefficient:11.30, 95% CI: 6.66–15.93), or those with increasedgenetic risk (regression coefficient: 0.71, 95% CI:0.51–0.91) displayed inflated IS risk. On the contrary,the dietary intake of fish reduced the risk of IS (OR:0.70, 95% CI: 0.57–0.86). In order to investigate therelative risk of IS, individuals were further classifiedinto various risk profiles. For three captured features ofage, SBP, and fish intake, the individuals were definedas “healthy” for clinical/lifestyle exposures if theindividual were aged < 60 years, had < 140 mmHgSBP, and consumed fish at least once a week,whereas the subjects were categorized as“intermediate” healthy ones if they fulfilled only twoof the three criteria defined for “healthy” exposures.In cases where the subjects fulfilled either one ornone of the aforementioned criteria, these werecategorized as “unhealthy”. Additionally, the derivedgenetic risk scores were used to generate threegenetic risk strata, wherein the top third weretreated as high genetic risk and the bottom third aslow risk. As shown in Table 1, the relative risk of IS
gradually increased as individuals’ clinical/lifestyleexposures changed from healthy to unhealthy statusand genetic susceptibility changed from low to high.Thus, the subjects with “unhealthy” clinical/lifestylestatus and “high” genetic risk displayed the highestrelative risk of IS (RR: 15.60, 95% CI: 3.75–64.96) ascompared to the reference group. Interestingly, theparticipants with “low” genetic risk but “unhealthy”clinical/lifestyle status displayed higher IS risk thanthe individuals with “high” genetic risk but “healthy”non ‐genetic status (RR: 5.50, 95% CI: 1.20–25.20).These results highlighted a stronger cumulativeimpact of the non‐genetic exposures on IS risk thanthe genetic profiles.
Among the 15 captured SNPs, 6 SNPs or theirgenes, including rs1800961, rs2954029, rs17321515,rs2575876, rs7493, and rs693, were shown to bedirectly associated with IS, whereas the remaining 9recognized SNPs or genes affected IS ‐relatedconditions (Supplementary Table S4). In particular,rs4939883 was reported to be associated with HDL‐clevel, rs10889353 contributed to variations in TGlevels, and rs4299376, PCSK9 (rs11583680), andSLC12A3 (rs11643718) were LDL‐associated variants.Besides these, rs1229984 was a risk factorassociated with alcohol dependence that mayincrease the risk of IS via alcohol ‐inducedsympathetic activation, whereas ADCY3(rs10187348) was a risk factor linked to obesity.
For the identification of KEGG/Reactomepathways and GO functional interpretations,enrichment analysis was performed for 15 capturedSNPs via g:GOSt module of g:Profiler tool set(Figure 2)[6]. For multiple testing adjustments, g:SCSthreshold was set to 0.001. Consequently, thecaptured SNPs were enriched to signaling pathwayslinked to cholesterol metabolism (KEGG: 04979,adjusted P = 2.471 × 10⁻⁶), fat digestion andabsorption (KEGG:04975, Padjusted = 2.225 × 10⁻⁴),plasma lipoprotein assembly (REAC: R‐HSA‐8963898,Padjusted = 1.821 × 10⁻⁴), and transport of smallmolecules (REAC:R ‐HSA ‐382551, Padjusted = 4.604 ×10⁻⁴). In terms of the biological domain, the captured
Table 1. Relative risk of IS for combined genetic and non‐genetic profiles
Clinical/lifestyle exposureGenetic risk
Low Intermediate High
Healthy − − 1 (reference)
Intermediate − 2.83 (0.55–14.42)P = 0.21
6.74 (1.54–29.56)P = 0.011
Unhealthy 5.50 (1.20–25.20)P = 0.028
6.90 (1.56–30.51)P = 0.011
15.60 (3.75–64.96)P < 0.001
Integrated effect of SNPs and lifestyle on IS risk 643

SNPs aggregated to cholesterol (GO: 0120020,Padjusted = 4.505 × 10⁻⁵), sterol (GO: 0120015,Padjusted = 5.298 × 10⁻⁵), and lipid (GO: 0120013,Padjusted = 5.686 × 10⁻⁴) transfer activities formolecular function (MF) domain. For the biologicalprocess (BP) domain, these SNPs functionallyenriched to the lipid/cholesterol/sterol homeostasis(GO: 0055088, 0042632, 0055092, with Padjusted <6 × 10⁻⁶). According to human phenotype ontology,the identified SNPs were found to be significantlyrelated to certain diseases, including prematurecoronary artery atherosclerosis, myocardialsteatosis, and cerebral artery atherosclerosis.
In research settings, when collinear predictorsgreatly outnumber the available number of samples(P > n), ordinary regression is subjected to overfittingand coefficient instability. Comparatively, the use ofthe elastic net regression model allows us to controlthe total number of involved variables using thepenalty parameter λ and capture groups ofpotentially highly correlated variables to build asparse model that is immune to overfitting[5]. Therobustness of elastic net regression in addressingmulticollinearity and overfitting has been previouslyestablished[7]. To verify the same in this study, thedata were further divided into construction andvalidation sets at a ratio of 9:1, and the validationprocedure was introduced. The newly generatedIS‐risk model achieved a fitted AUC of 0.835 on theconstruction set and a validated AUC of 0.81 on thevalidation set. These values were slightly lower thanthe fitted AUC of the original model (0.846). Thesevariations might be attributed to a certain degree ofoverfitting. Besides this, the occurrence of aninsufficient number of cases (n = 60) and samples inthe construction set after splitting the data couldalso have acted as contributing factor, resulting in aless‐comprehensive prediction model that identifiedonly a subset of important risk factors and hadreduced power of prediction.
Several previous studies attempted the
construction of risk prediction models for both “all‐stroke” and/or “IS‐only”. Similar to the present case,these tools were also developed using commonlifestyles, medical conditions, or genetic variantsinvolved in lipid/cholesterol metabolism, statinpathways, or cerebral artery atherosclerosis[3,8,9].These findings highlighted that different subtypes ofIS could be induced by similar lifestyle and geneticrisk factors[2]. Recently, an atrial substrate model wasproposed by Kamel et al.[10] illustrating that agingand other common vascular risk factors likeunhealthy lifestyles may simultaneously be involvedin distinct etiologies underlying different IS subtypes.In particular, these factors could induce an abnormalatrial tissue substrate to cause AF andthromboembolic stroke, and also trigger large‐arteryatherosclerosis, ventricular systolic dysfunction, or insitu cerebral small ‐vessel occlusion, leading tothrombotic stroke. Nevertheless, different subtypesof IS are still characterized by their unique triggersand pathological mechanisms. Therefore, to revealthe unique etiologies of IS subtypes, it is importantand necessary to build specific predictive tools foreach subtype of IS.
The present study had certain limitations. Theoriginal model derived in this study could not bevalidated owing to the limited number of cases andsample size. Thus, future studies should apply thismodel to an independent dataset to verify itsaccuracy. Additionally, the measurements orclassifications of some lifestyle factors used in thisstudy were not standardized, which might further limitthe application of this model in external settings.
For fatal diseases that affect populations allacross the globe, the development of robust,individualized disease risk assessment tools is thefirst step toward precision medicine and health care.In the present study, a new tool was generated for ISrisk prediction, which involved 15 captured SNPs andthree clinical/lifestyle predictors. The results of thestudy highlighted the suitability of this new tool in IS
≥ 16141210
86420
−log
10 (P
adj)
Cholesterol transfer ac�vity Padj = 4.505 × 10⁻⁵
Sterol transfer ac�vity Padj = 5.298 × 10⁻⁵
Sterol transporter ac�vity Padj = 2.295 × 10⁻⁴
Lipid homeostasis Padj = 5.019 × 10⁻⁷
Lipid transfer ac�vity Padj = 5.686 × 10⁻⁴
Cholesterol homeostasis Padj = 5.387 × 10⁻⁶
Sterol homeostasis Padj = 5.665 × 10⁻⁶
Cholesterol metabolismPadj = 2.471 × 10⁻⁶
Fat diges�on andabsorp�on Padj = 2.225 × 10⁻⁴
Premature coronaryartery atherosclerosis Padj = 1.099 × 10⁻⁵
Cerebral artery atherosclerosis Padj = 1.866 × 10⁻⁴
Myocardial steatosisPadj = 1.866 × 10⁻⁴
Metabolic pathway of LDL, HDL and TG,including diseases Padj = 6.850 × 10⁻⁵
Sta�n PathwayPadj = 4.430 × 10⁻⁴
Transport of small moleculesPadj = 4.604 × 10⁻⁴
Plasma lipoprotein assembly,remodeling, and clearance Padj = 1.260 × 10⁻⁴
Plasma lipoprotein assembly Padj = 1.821 × 10⁻⁴
Values above this threshoid are capped
GO:MF (5)
GO:BP (7)
KEGG (2)
REAC (3)
WP (2)
HP (11)
Figure 2. The P‐value plot of enriched pathways and functional domains for the 15 captured SNPs.
644 Biomed Environ Sci, 2021; 34(8): 641‐645

risk recognition in the Chinese population at theindividual level. Additionally, this tool might assist inproviding valuable information regarding theimplications of various factors in IS etiology.
The authors thank the investigators andparticipants for their contribution to this study.
The authors declare no conflict of interest.The study was approved by the Medical Ethics
Committee of Hangzhou Normal University (No.2013020).
&These authors contributed equally to this work.#Correspondence should be addressed to XU Guo
Zhang, Tel: 86‐574‐ 87274539; E‐mail: [email protected];YANG Lei, PhD, Tel: 86‐571‐28865010; E‐mail:[email protected]
Biographical notes of the first authors: YE Cheng Yin,female, born in 1985, PhD, majoring in electronic medicaldata mining and health risk assessment research; LI JinMei, female, born in 1995, Bachelor, majoring in healthrisk assessment research.
Received: November 7, 2020;Accepted: June 28, 2021
REFERENCES
Neurology CSo, Society CS. Chinese guidelines for diagnosis1.
and treatment of acute ischemic stroke 2018. Chin J Neurol,2018; 51, 666−82. Boehme AK, Esenwa C, Elkind M S V. Stroke Risk Factors,Genetics, and Prevention. Circ Res, 2017; 120, 472−95.
2.
Rutten‐Jacobs L C A, Larsson SC, Malik R, et al. Genetic risk,incident stroke, and the benefits of adhering to a healthylifestyle: Cohort study of 306 473 UK Biobank participants.BMJ (Online), 2018; 363, 1−8.
3.
Li Z, Ye CY, Wang L, et al. Association of genetic andenvironmental factors with non‐alcoholic fatty liver disease ina Chinese han population. Int J Environ Res Public Health,2020; 17, 1−14.
4.
Jerome Friedman TH, Tibshirani and R. Regularization Pathsfor Generalized Linear Models via Coordinate Descent. J StatSoftw, 2010; 89, 1−20.
5.
Raudvere U, Kolberg L, Kuzmin I, et al. G: Profiler: A webserver for functional enrichment analysis and conversions ofgene lists (2019 update). Nucleic Acids Res, 2019.
6.
Liu W, Li Q. An efficient elastic net with regression coefficientsmethod for variable selection of spectrum data. PLoS ONE,2017; 12, 1−13.
7.
Wang TJ, Massaro JM, Levy D. A risk score for predicting strokeor death in individuals with new‐onset atrial fibrillation in thecommunity. The Framingham Heart Study. ACC CurrentJournal Review, 2003; 12, 54.
8.
Assmann G, Schulte H, Cullen P, et al. Assessing risk ofmyocardial infarction and stroke: New data from theProspective Cardiovascular Münster (PROCAM) study. Eur JClin Invest, 2007; 37, 925−32.
9.
Kamel H, Okin P M, Elkind M S V, et al. Atrial Fibrillation andMechanisms of Stroke: Time for a New Model. Stroke, 2016;47, 895−900.
10.
Integrated effect of SNPs and lifestyle on IS risk 645
A cluster sampling method was used to randomly select 4health service centers in Ningbo, Zhejiang Province
Inclusion criteria:lndividuals who visited the community healthservice center for physical examina�ons,aged > 40 from April to July, 2013.
Exclusion criteria:(1) Women who were pregnant and lacta�ng;(2) lndividuals who were diagnosed with severe liver and kidney disease and malignant tumors;(3) Individuals who were diagnosed with ischemicstroke (IS) before July 2013.
X �meframe: April to July, 2013Data were collected for:(1) Demographics and anthropometry parameters;(2) Clinical measures: SBP/DBP, TC, TG, HDL-c,LDL-c, ...(3) Lifestyle: smoke, diet, physical ac�vity ...(4) Genotypes: 102 SNPs
Y �meframe: August 2016Data were collected for:(1) lndividuals' lS records in the last 3 years,(2) Exclude those firstly diagnosed with heartfailure, atrial fibrilla�on or myocardial infarc�on in the last 3 years.
Community healthservice center
Modeling process
Elas�c netalgorithm
102-SNPs pool
Gene�c-basedmodel
Model-drivengene�c risk score
Clinical/lifestylevariables
Elas�c netalgorithm
Full IS-risk predic�on model
Select significant SNPs/clinical/lifestyle features
ROC curve Pathway enrichmentanalysis
Rela�ve risk undervarious risk profiles
Supplementary Figure S1. Study design.
Biomed Environ Sci, 2021; 34(8): S1-S7 S1

Supplementary Table S1. Definition and classification of features collected in our study
Features Definition/ClassificationIschemic Stroke Diagnostic criteria from the American Heart Association/American Stroke Association in 2013; Diagnostic
tools: brain computerized tomography (CT) and/or magnetic resonance imaging (MRI) and clinicalcharacterization.
Anthropometry parameters Height, weight and waist circumference were measured by regular methods during physical examination;Body Mass Index (BMI) = weight (kg)/height square (m2).
Systolic/diastolic bloodpressure (SBP/DBP)
Measured by regular methods during physical examination.
Plasma concentrations ofTC, TG, HDL‐c and LDL‐c
Measured by a Hitachi 7180 biochemistry automatic analyzer.
Dyslipidemia Determined by one of the following four criteria: 1.Low density lipoprotein cholesterol (LDL‐c) ≥3.37mmol/L; 2.High density lipoprotein cholesterol (HDL‐c) ≤ 1.04mmol/L’ 3.Total cholesterol (TC) ≥5.18mmol/L; 4.Triglyceride (TG) ≥ 1.7mmol/L.
Hypertension Systolic blood pressure (SBP) ≥ 140 mmHg or diastolic blood pressure (DBP) ≥ 90 mmHg or having a historyof antihypertensive‐drug consumption.
Smoking “Yes”: Smoke ≥ 1cigarette or more per day in the last 12 months. “No”: Smoke < 1 cigarette per day in thelast 12 months.
Egg intake 3 levels: Eat < 1/week; 1‐4/week; > 5/week in the last 12 months.
Salt intake 3 levels: Intake < 6g/day; 6‐9g/day; > 9g/day in the last 12 months.Fruit/vegetable intake “Seldom”: consuming less than 50g/day in the last 12 months. “Regular”: consuming 50g/day in the last 12
months.Mile/soymilk intake “Seldom”: consuming less than 200ml/day in the last 12 months; “Regular”: consuming 200ml/day in the
last 12 months.Red meat/fish/chicken/dessert intake
“Seldom”: consuming this food less than once a week in the last 12 months. “≥ 1 times/week”: consumingthis food at least once a week in the last 12 months.
Physical activity “Sedentary”: occupations that require little exercise at work, such as office workers; “Light”: occupationsthat need to stand for a relatively long time at work, such as salesmen, waiters and teachers; “Moderate”:occupations that required long hours of walking, pushing or pulling at work, such as cleaning services;“Heavy”: occupations that required strenuous effort and extensive total body movements such asdancers, construction workers.
Supplementary Table S2. The reported association between 102 SNPs or its genes and IS or IS‐relateddiseases/conditions
SNP Associated with IS or IS-relateddiseases/conditions (SNP) Gene Associated with IS or IS-related diseases/
conditions (Gene)rs11646692 — BCO1 Coronary atherosclerosis, dyslipidemia
rs6564851 Carotenoid and tocopherol levelsrs12934922 — BCO1 Coronary atherosclerosis, dyslipidemiars7501331 — BCO1 Coronary atherosclerosis, dyslipidemia
rs671 Coronary artery disease, Body mass index (BMI), triglycerides (TG) — —rs1229984 Cardiovascular disease, systolic blood pressure (SBP), — —rs2479409 Low density lipoprotein cholesterol levels (LDL‐c), et al. — —rs17111503 LDL‐c, total cholesterol levels (TC), at al. — —
rs2483205 — PCSK9 Coronary atherosclerotic lesionextension and calcification
rs662145 — PCSK9 Coronary atherosclerotic lesionextension and calcification
rs11583680 — PCSK9 Coronary atherosclerotic lesionextension and calcification
rs111563724 — PCSK9 Coronary atherosclerotic lesionextension and calcification
rs2738466 — LDLR Coronary heart disease
rs1003723 — LDLR, MIR6886 Coronary artery disease,plasma lipid levels
Biomed Environ Sci, 2021; 34(8): S1-S7 S2

ContinuedSNP Associated with IS or IS-related
diseases/conditions (SNP) Gene Associated with IS or IS-related diseases/conditions (Gene)
rs6413504 — LDLR Coronary artery disease,plasma lipid levels
rs17845226 — ANXA2 LDL‐c, Coronary heart diseasers8025278 — SLC12A1, LOC107984755 Hypertensionrs12438818 — SLC12A1, LOC107984755 Hypertension
rs11643718 — SLC12A3 Coronary atherosclerotic lesionextension and calcification
rs5805 — SLC12A3 Coronary atherosclerotic lesionextension and calcification
rs3812963 — SLC12A3 Coronary atherosclerotic lesionextension and calcification
rs4784733 — SLC12A3 Coronary atherosclerotic lesionextension and calcification
rs3782724 Obesity (early onset extreme)rs2228576 — SCNN1A Insulin resistancers7205273 — SCNN1B strokers7200183 — SCNN1G Hypertensionrs675759 — KCNJ1 Serum Lipid Profilers675388 — KCNJ1 Serum Lipid Profilers2846679 — KCNJ1, LOC107984409 Serum Lipid Profilers1148058 — KCNJ1 Serum Lipid Profilers4299376 Coronary artery disease — —rs964184 Coronary artery disease — —rs693 TC, et al. — —
rs515135 Coronary artery disease, LDL‐c, et al. — —
rs5167 TG, high density lipoproteincholesterol levels (HDL‐c) — —
rs4420638 Coronary artery disease, LDL‐c, et al. — —rs3764261 HDL‐c, TG, et al. — —rs10401969 LDL‐c, et al. — —rs10889353 TG, et al. — —rs174547 HDL‐c, TG, et al. — —rs4846914 HDL‐c, et al. — —rs1260326 Cardiovascular disease risk factors, TG, et al. — —rs12654264 LDL‐c, et al. — —rs1800961 HDL‐c, et al. — —rs16942887 HDL‐c, TG, et al. — —
rs5929 — LDLR Coronary artery disease, plasma lipid levelsrs2650000 LDL‐c — —rs1800588 HDL‐c, TG, et al. — —rs4939883 HDL‐c, TC, et al. — —rs7241918 HDL‐c, TC, et al. — —
rs328 TG, HDL‐c, et al. — —rs17145738 TG, et al. — —rs16996148 LDL‐c, TG — —rs3812316 TG, et al. — —rs12130333 TG, TC — —rs17321515 TG, TC, et al. — —
rs7493 Yu‐Zhi constitution type in type 2 diabetes — —rs629301 LDL‐c, et al. — —
Biomed Environ Sci, 2021; 34(8): S1-S7 S3

ContinuedSNP Associated with IS or IS-related
diseases/conditions (SNP) Gene Associated with IS or IS-related diseases/conditions (Gene)
rs2954029 Coronary artery disease,Coronary artery disease, et al. — —
rs4149269 — ABCA1 Coronary artery diseasers2472433 — ABCA1 Coronary artery diseasers2740486 — ABCA1 Coronary artery diseasers2515616 Waist‐to‐hip ratio adjusted for BMI — —rs2472386 HDL‐c — —rs2740479 C‐reactive protein levels — —rs4149264 — ABCA1 Coronary artery diseasers4149339 — ABCA1 Coronary artery diseasers2515617 — ABCA1 Coronary artery diseasers2254884 — ABCA1 Coronary artery diseasers2065412 — ABCA1 Coronary artery diseasers2472377 — ABCA1 Coronary artery diseasers4149336 — ABCA1 Coronary artery diseasers2297406 — ABCA1 Coronary artery diseasers6479282 — ABCA1 Coronary artery diseasers4743764 — ABCA1 Coronary artery diseasers2740484 — ABCA1 Coronary artery diseasers11789818 — ABCA1 Coronary artery disease
rs2575876 HDL‐c in current drinkers,TG in current drinkers, et al. — —
rs2482433 — ABCA1 Coronary artery diseasers2515614 — ABCA1 Coronary artery diseasers4743763 — ABCA1 Coronary artery diseasers2000069 — ABCA1 Coronary artery diseasers10820743 — ABCA1 Coronary artery diseasers2472510 — ABCA1 Coronary artery diseasers4665273 — ADCY3 Carotid plaque formation, obesityrs1127568 — ADCY3 Carotid plaque formation, obesityrs6751537 — ADCY3 Carotid plaque formation, obesityrs7608976 — ADCY3 Carotid plaque formation, obesityrs11689546 — ADCY3 Carotid plaque formation, obesityrs7604576 — ADCY3 Carotid plaque formation, obesityrs7593130 — ADCY3 Carotid plaque formation, obesityrs2241759 — ADCY3 Carotid plaque formation, obesityrs2278485 — ADCY3, LOC105377626 Carotid plaque formation, obesityrs1344840 — ADCY3 Carotid plaque formation, obesityrs4077678 BMI, Childhood obesity — —rs10187348 — ADCY3 Carotid plaque formation, obesityrs10431036 — BCO2 Ischemic strokers11214109 — BCO2 Ischemic strokers12420476 — BCO2 Ischemic strokers13328843 — BCO2 Ischemic strokers11641677 — BCO1 Coronary atherosclerosisrs6939861 — TFEB, MIR10398 Cardiovascular diseases
rs11759908 Estimated glomerular filtration rate, estimatedglomerular filtration rate in non‐diabetics — —
Biomed Environ Sci, 2021; 34(8): S1-S7 S4

Supplementary Table S3. Comparison of baseline features in individuals with or without IS
Characteristics Case (n = 67) Control (n = 2,046) t/z/χ2 P value
Age, Mean (IQR), y 70.7 (12) 58.6 (17) 8.88 < 0.001
Sex, n (%) 0.16 0.88
Male 30 (44.78) 936 (54.25)
Female 37 (55.22) 1,110 (45.75)
Education level, n (%) −1.92 0.05
≤ Primary school 57 (85.07) 1,456 (71.16)
Middle school 7 (10.45) 517 (25.27)
≥ High school 3 (4.48) 73 (3.57)
Height, Mean (IQR), cm 157.6 (12.5) 160.4 (11) −2.76 0.005
Weight, Mean (IQR), kg 57.94 (12.5) 59.97 (13) −1.65 0.10
Waist, Mean (IQR), cm 82.4 (13) 81.3 (11) 1.13 0.26
BMI, Mean (IQR), kg/m2 23.3 (4.01) 23.3 (3.95) 0.08 0.93
SBP, Mean (IQR), mmHg 145.1 (26.5) 133.9 (28) 4.77 < 0.001
DBP, Mean (IQR), mmHg 83.4 (13) 81.66 (17) 1.14 0.25
TC, Mean (IQR), mmol/L 5 (1.445) 4.9 (1.238) 1.12 0.26
TG, Mean (IQR), mmol/L 1.4 (0.84) 1.4 (0.78) −0.18 0.85
HDL‐c, Mean (IQR), mmol/L 1.2 (0.28) 1.3 (0.37) −1.5 0.13
LDL‐c, Mean (IQR), mmol/L 3.2 (1.19) 3.1 (1.1) 0.91 0.36
Dyslipidemia, n (%) 38 (56.72) 1,163 (56.84) −0.02 0.98
Hypertension, n (%) 46 (68.66) 939 (45.9) 3.56 < 0.001
Smoking, n (%) 0.37 0.71
Yes 18 (26.87) 538 (26.3)
No 49 (73.13) 1,508 (73.7)
Egg intake, n (%) −2.09 0.04
< 1 /week 28 (41.8) 558 (27.3)
1–4 /week 31 (46.3) 1,206 (58.9)
> 5 /week 8 (11.9) 282 (13.8)
Salt intake, n (%) 1.2 0.23
< 6 g/day 39 (58.2) 1,389 (67.9)
6–9 g/day 25 (37.3) 546 (26.7)
> 9 g/day 3 (4.5) 111 (5.4)
Fruit intake, n (%) −1.78 0.07
Seldom (< 50 g/day) 29 (43.3) 671 (32.8)
Regular (≥ 50 g/day) 38 (56.7) 1,375 (67.2)
Vegetable intake, n (%) 0.02 0.99
Seldom (< 50 g/day) 28 (1.4) 0 (0)
Regular (≥ 50 g/day) 2018 (98.6) 67 (100)
Milk intake, n (%) 0.02 0.98
Seldom (< 200 mL/day) 42 (62.69) 1,312 (64.13)
Regular (≥ 200 mL/day) 25 (37.31) 734 (35.87)
Biomed Environ Sci, 2021; 34(8): S1-S7 S5

ContinuedCharacteristics Case (n = 67) Control (n = 2,046) t/z/χ2 P value
Soymilk intake, n (%) −0.62 0.54
Seldom (< 200 mL/day) 50 (74.63) 1,514 (74) Regular (≥ 200 mL/day) 17 (25.37) 532 (26)Red meat intake, n (%) −4.13 < 0.001 Seldom 16 (23.88) 172 (8.4) ≥ 1 times/week 51 (76.12) 1,874 (91.6)Fish intake, n (%) −4.13 < 0.001 Seldom 13 (19.4) 149 (7.28) ≥ 1 times/week 54 (80.6) 1,897 (92.72)Chicken intake, n (%) −2.1 0.04 Seldom 27 (40.3) 581 (28.4) ≥ 1 times/week 40 (59.7) 1,465 (71.6)Dessert intake, n (%) −0.8 0.43 Seldom 24 (35.8) 639 (31.2) ≥ 1 times/week 43 (64.2) 1,407 (68.8)Physical activity, n (%) 0.12 0.90 Sedentary 13 (19.4) 259 (12.66) Light 34 (50.75) 1,182 (57.78) Moderate 9 (13.43) 426 (20.82) Heavy 11 (16.42) 179 (8.74)
Supplementary Table S4. The coefficients of 15 SNPs adopted by the genetic‐based IS‐risk model and 4significant features identified by the full IS‐risk model
Genetic-based IS-risk model
SNP Coefficient Gene Associated with IS or IS-related diseases/ conditions PMID
rs1800961 0.56226531 HNF4A IS 22403240rs4299376 0.39578499 ABCG8 LDL‐c 26043746rs2278485 0.23077208 ADCY3 Cardiovascular disease 28985495rs10889353 0.13749869 DOCK7 TG, LDL‐c 26744084rs2954029 0.10619992 TRIB1 IS 31250580rs17321515 0.08371697 TRIB1 IS 30787327
rs5167 0.08041245 APOC2 Cardiovascular disease 29367937rs10187348 0.02155788 ADCY3 Obesity 30704512rs11583680 0.02063195 PCSK9 LDL‐c 28577571rs1229984 0.01210608 ADH1B Alcohol dependence 30994927rs2575876 0.011446 ABCA1 IS 28865324rs4939883 −0.14570917 LOC105372112 HDL‐c 22174694rs11643718 −0.10686348 SLC12A3 LDL‐c 28166833
rs7493 −0.07784675 PON2 IS 28566152rs693 −0.01463697 APOB IS 29416768
Full IS-risk model
Features Coefficients PMID
Age 0.427610541 30010821
Genetic risk score 0.332308739 ——
SBP 0.00413839 28097354
Fish intake −0.004976849 15155968
Note. “——” Genetic risk score is a combined feature derived from the genetic‐based IS‐risk model, thus itsPMID is not available.
Biomed Environ Sci, 2021; 34(8): S1-S7 S6

Supplementary Table S5. The performance of the full IS‐risk model in the three risk categories(high/intermediate/low)
Risk category Low risk Intermediate risk High risk Total
Number of Observations 1444 584 85 2113
Cases 11 34 22 67
PPV 0.76% 5.82% 25.88% 3.17%
Observation% 68.34% 27.64% 4.02% 100.00%
Sensitivity 16.42% 50.74% 32.84% 100.00%
Specificity 70.04% 26.88% 3.08% 100.00%
Relative Risk 0.23 1.89 10.66 1
Supplementary Table S6. The univariate analysis results for the captured features.
Characteristics Case (N = 67) Control (N = 2,046) OR/Regression coefficient (95% CI) P
Genetic risk score, Mean (IQR) 3.854 (1.161) 3.148 (0.95) 0.71 (0.51–0.91) < 0.001
Age, n (%)
40–49 3 (4.48) 546 (26.69) — —
50–59 3 (4.48) 565 (27.61) 0.97 (0.18–5.24) 0.97
60–69 19 (28.36) 604 (29.52) 2.39 (1.39–4.95) 0.01
> 70 42 (62.68) 331 (16.18) 2.85 (2.03–4.58) < 0.001
SBP, Mean (IQR) 145.1 (26.5) 133.9 (28) 11.30 (6.66–15.93) < 0.001
Fish intake, n (%) 0.70 (0.57–0.86) < 0.001
Never 13 (19.40) 149 (7.28)
> 1 times/week 54 (80.60) 1,897 (92.72)
Biomed Environ Sci, 2021; 34(8): S1-S7 S7