letter to shareholders - equity bank
TRANSCRIPT


2020 Annual Report 04 Letter to Shareholders
It was a rewarding, challenging, and invigorating 2020 for our customers and communities. Through changing times and through a changing environment, our Equity Bank teams, customers, and communities worked together - in drive-throughs, using cell phones, and in lobbies, with masks, with distance, and with entrepreneurial spirit to help one another. We worked with thousands of local business customers to help save their businesses, save jobs in communities, and continue to thrive. Several quotes in our Annual Report come directly from customers. We're proud to serve. We never forget it's your money.
Our Ponca City customer service team was one of Kay County's shining stars for their customer service in 2020.
Equity Bank of Ellis participated in the community – and nationwide – Find a Bear program to encourage reading while kids were home in spring 2020.
Tellers Tammy Martine and Eileen Rhoads in the Kansas City Northland served customers in March during "Branch Light".
Kansas City Equity Bank team members took a break from the Paycheck Protection Program to enjoy a food truck lunch from a customer.
Our Harrison team of all-star tellers helped make sure Equity Bank was open, ready, and safe for all customers in 2020.
“Equity staff went above and beyond, even working over the weekend, to make sure our application was correct and the loan processed quickly.”-Michelle Hannon, The Writers' Colony at Dairy Hollow
“The Equity team was tremendous...very helpful, responsive and sensitive to our needs.”-Mark Justice, Mr. Stax, Inc.
“Without your help, we would have been forced to reduce staff and make cuts. The support you provided saved jobs!”-G.A. Buie, United School Administrators of Kansas
Hindsight2020
Contents
Commercial Lender Michael Doyle and customer Chuck Jeffries of Kansas Asphalt.
Commercial Lender Justin Kelly and customer Darold Stagner of Zeck Ford.

08 Board of Directors, Leadership06 Selected Financial
Highlights 10 Year in Re/View 13 Annual Report
on Form 10-K
Completion and celebration of Equity Bank's Kansas City relocation in Overland Park...just in time for the AFC Playoffs.
Our annual Equity Bank All-Employee Day looked a bit different early in 2021. We hosted socially distant group meetings in all of our markets, with regional and executive hosts introducing livestream content from bank leaders. The hybrid event gave our teams the chance to celebrate locally and focus strategically on their markets. Above (left to right): Matt Brewer, Craig Anderson and Jeremy Allen participated in a panel discussion. Brad Daniel welcomed the Ozark Mountain team with donuts. Patrick Harbert and Randy Graver congratulated Diana Montalvo on her award, and Dale Gottschalk greets Western Kansas team members.
We’re proud to have earned our second straight Diversity and Inclusion Award and our second straight Innovation Award, select honors from the Wichita Business Journal. Equity regularly helps causes and organizations that serve the entire Wichita community. Above, left: Chase Carter led a team of Wichita volunteers to pack sack lunches for students.At right, our innovative systems operations teams helped us devise, build, and deploy efficient online processes for our PPP customers – and they dressed up for Halloween. See all of our 2020 Wichita Business Journal honorees on Page 10.
We proudly welcomed bank locations in Norton and Almena, Kansas, and talented community bankers previously serving the northwest Kansas region as Almena State Bank in October 2020.
“Equity Bank rose to the occasion and met the needs of locally-owned small businesses. Equity is staffed by unrecognized super heroes at all levels.”-Randi Kay Graham, SEVA Beauty
We look back at 2020 now, and everything seems
crystal clear.
Hindsight is always 20/20, but as I reflect
on what Equity Bank helped our customers,
colleagues, and communities accomplish in the
past year – and into the first quarter of 2021 – I’m
proud that we were able to mobilize momentum
for our customers, and step up as only a
community bank can.
We started 2020 with considerable optimism,
which was challenged in early March as our
country faced the spread of COVID-19. I’m proud
of our bankers throughout our regions, who
were resolute in their focus on our customers.
We shifted
our banks to
a temporary
‘Branch Light,
Drive-Through
First’ model,
and we did not
slow down,
delivering service with drive-through, digital,
and inside our banks. No appointments were needed, our teams served customers curbside, in the drive-through, and with a knock on the door as needed.
Our banks remained open throughout the pandemic, with increased distancing and cleaning measures in place. As a team, we are proud that to this day, not one Equity Bank facility has abbreviated its hours. Our customers have appreciated this effort and as I write this, many of our larger, regional competitors are still adjusting their hours, their lobbies, and their services on the fly. We don’t believe this is acceptable to our customers.
Our slogan is: We never forget it’s your money – and we believe that in everything we do. As an essential business, being the backbone of our communities means being there for all of our
customers, no matter the circumstance.
I believe our steadfast commitment will continue
to set us apart, differentiating us for families,
business owners, and entrepreneurs. We’re
calling on customers today as they need it – in
person, video chat by phone, and more. Our
bankers are available 24/7, and I believe our
performance reflects that recognition among
our customer base. In this report, you can see
actual quotes from business customers aided
by our Paycheck Protection Program and
their dedicated bankers. That’s what being a
community bank is all about.
Despite the challenges, our customer service,
operations, credit, mortgage, marketing,
technology and human resources teams banded
together with our frontline employees like never
before. We’re very
proud to have served
more than 3,600
Paycheck Protection
Program customers
during 2020, helping
protect more than
102,000 jobs. We
participated in the
Main Street Lending Program, one of the few
banks in our region who delivered, to the tune
of $282 million in Main Street loans. In 2021, we
have not slowed down, with more than 2,000 PPP loans approved through the SBA.
We’ve been able to build a franchise that’s made up of business people first, bankers second, and that’s the reason our team is proud to be in community banking. Our support, our service, and our products matter. They matter to local businesses, communities, cities, towns, and homeowners everywhere. Throughout the twists and turns of 2020, we’ve been able to continue to execute on our vision and values and build a banking home for entrepreneurs of all shapes
and sizes.
This includes new customers in Almena and
Norton, Kansas, locations we acquired in October
2020 from the FDIC. Julie Huber, Patrick Harbert,
Levi Getz, and many others led the transition for
Almena State Bank team members and customers
To my fellow shareholders,
$4.01BAssets
$2.59BTotal Loans
$3.45BTotal Deposits
$24.68Tangible book value pershare
“Sometimes the path forward is not abundantly clear. The best community banks, however, did not slow down in 2020.”
04Sources: Equity Bank Internal Reports
64,498Online BankingUsersas of 12/31/20
22%OnlineBankingUser GrowthYear over year as of 12/31/20

and the market, and we continue to serve as
a source for primary checking accounts, core
deposits, and increased digital banking use –
hallmarks of the customer experience we’ll build
on throughout 2021.
Sometimes the path forward is not abundantly
clear. The best community banks, however, did
not slow down in 2020. We did not wait for our
environment to be perfect. We relied on our
relationships, our resilience, and our 20/20 vision.
For banks to succeed in the future, we’ll need to
continue to be open – lobbies, doors, minds, and
platforms. We’ll need to continue to be nimble,
responsive, and supportive to teams, customers,
communities and shareholders. Hindsight is
20/20. Our vision begins anew in 2021.
into Equity Bank. Our mission includes continued
stewardship of local economies.
In Kansas City, we relocated our main office, now
positioned at the hotspot of College Boulevard
and Metcalf Avenue in Overland Park. It is home
to our KC customer service, commercial loan,
treasury management, sales, marketing, and
leadership teams, and is built for growth of our
KC Metro franchise.
As 2021 began, we celebrated one of my favorite
days of the year a bit differently than in the past,
with our hybrid, virtual All-Employee Meeting.
It was invigorating to highlight our many award
winners – bank leaders, and locations, achieving
above and beyond in customer service. It was
our chance to thank our Equity Bank team
members and celebrate our Innovation Awards,
our Diversity & Inclusion honor by the Wichita
Business Journal, and graduates of our Equity
University program. We’re pleased to have
achieved the highest tangible book value growth
rate in our Company’s history. Our success in
2020 proved to our teams that when we work
together, devoted to our customers’ success, we’ll
achieve great results for our shareholders and for
each other.
It sounds easy but it's hard work, to execute on
our vision and value proposition. In 2021 we’ll
continue our laser focus on our customers. Our
leadership team has the best level of expertise
in our Company’s history, our credit culture is
proven to stand the test of time, environment,
SPECIAL NOTE CONCERNING FORWARD-LOOKING STATEMENTS
Certain statements contained herein may be considered "forward-looking statements" as defined in the Private Securities Litigation Reform Act of 1995. These statements are based upon the belief of Equity Bancshares, Inc. (“the Company”) management, as well as assumptions made beyond information currently available to the Company's management, and may be, but not necessarily are, identified by such words as “will,” "expect,” "plan,” "anticipate,” "believe,” "forecast" and "goal.” Because such "forward-looking statements" are subject to risks and uncertainties, actual results may differ materially from those expressed or implied by such forward-looking statements. Factors that could cause actual results to differ materially from the Company's expectations include competition from other financial institutions and bank holding companies; the impact of COVID-19; the effects of and changes in trade, monetary and fiscal policies and laws, including interest rate policies of the Federal Reserve Board; changes in the demand for loans; fluctuations in value of collateral and loan reserves; inflation, interest rate, market and monetary fluctuations; changes in consumer spending, borrowing and savings habits; and acquisitions and integration of acquired businesses, and similar variables. The foregoing list of factors is not exhaustive.
For discussion of these and other risks that may cause actual results to differ from expectations, please refer to "Cautionary Note Regarding Forward-Looking Statements" and "Risk Factors" in our most recent Form 10-K, or other SEC filings. If one or more of the factors affecting our forward-looking information and statements proves incorrect, then our actual results, performance or achievements could differ materially from those expressed in, or implied by, forward-looking information and statements contained herein. Accordingly, you should not place undue reliance on any forward-looking statements, which speak only as of the date made. Equity Bancshares, Inc. assumes no obligation to update or revise any forward-looking statements that are made from time to time.
Brad S. ElliottChairman & CEO
Brad S. ElliottChairman & CEO
“We relied on our relationships, our resilience, and our 20/20 vision.”
102,000+Local jobs
Helped to datethrough rounds 1 & 2 of PPP, as of 2/28/21
05Letter to Shareholders
5,356PPP Loans
to datethrough rounds 1 & 2 of PPP, as of 2/28/21
94,409Customer
Households
as of 12/31/20
0Branch Days
closedDuring 2020

Years Ended December 31
2020 2019 2018 2017 2016
Statement of Income Data
Interest and dividend income $ 155,561 $ 175,499 $ 161,556 $ 102,693 $ 61,799
Interest expense 22,909 49,641 36,758 16,691 9,202
Net interest income 132,652 125,858 124,798 86,002 52,597
Provision for loan losses 24,255 18,354 3,961 2,953 2,119
Net gain on acquisition 2,145 — — — —
Other non-interest income 23,878 24,988 19,725 15,440 10,466
Merger expense 299 915 7,462 5,352 5,294
Goodwill impairment 104,831 — — — —
Other non-interest expense 103,860 98,720 86,925 62,111 41,781
Income before income taxes (74,570) 32,857 46,175 31,026 13,869
Provision for income taxes 400 7,278 10,350 10,377 4,495
Net income (74,970) 25,579 35,825 20,649 9,374
Dividends and discount accretion on preferred Stock — — — — (1)
Net income allocable to common stockholders (74,970) 25,579 35,825 20,649 9,373
Basic earnings per share (4.97) 1.64 2.33 1.66 1.09
Diluted earnings per share (4.97) 1.61 2.28 1.62 1.07
Balance Sheet Data (at period end)
Cash and cash equivalents $ 280,698 $ 89,291 $ 192,818 $ 52,195 $ 35,095
Securities available-for-sale 871,827 142,067 168,875 162,272 95,732
Securities held-to-maturity — 769,059 748,356 535,462 465,709
Loans held for sale 12,394 5,933 2,972 2,353 4,830
Gross loans held for investment 2,591,696 2,556,652 2,575,408 2,117,270 1,383,605
Allowance for loan losses 33,709 12,232 11,454 8,498 6,432
Loans held for investment, net of allowance for loan losses 2,557,987 2,544,420 2,563,954 2,108,772 1,377,173
Goodwill and core deposit intangibles, net 47,658 156,339 153,437 115,645 63,589
Total assets 4,013,356 3,949,578 4,061,716 3,170,509 2,192,192
Total deposits 3,447,590 3,063,516 3,123,447 2,382,013 1,630,451
Borrowings 133,857 383,632 464,676 401,652 293,909
Total liabilities 3,605,707 3,471,518 3,605,775 2,796,365 1,934,228
Total stockholders' equity 407,649 478,060 455,941 374,144 257,964
Tangible common equity* 358,861 320,542 301,276 257,222 194,352
Performance Ratios
Return on average assets (ROAA) -1.87% 0.64% 1.00% 0.84% 0.55%
Return on average equity (ROAE) -16.14% 5.52% 8.52% 7.03% 5.55%
Return on average tangible common equity (ROATCE)* -21.51% 9.22% 13.43% 9.81% 6.75%
Yield on loans 5.00% 5.73% 5.74% 5.43% 4.98%
Cost of interest-bearing deposits 0.66% 1.53% 1.15% 0.79% 0.65%
Net interest margin 3.63% 3.48% 3.81% 3.83% 3.30%
Efficiency ratio* 66.36% 65.45% 60.14% 61.39% 66.67%
Non-interest income/average assets 0.65% 0.63% 0.55% 0.63% 0.61%
Non-interest expense/average assets 5.23% 2.50% 2.62% 2.74% 2.74%
Capital Ratios
Tier 1 Leverage Ratio 9.30% 9.02% 8.60% 10.33% 11.81%
Common Equity Tier 1 Captial Ratio 12.82% 11.63% 10.95% 11.53% 13.38%
Tier 1 Risk Based Capital Ratio 13.37% 12.15% 11.45% 12.14% 14.28%
Total Risk Based Capital Ratio 17.35% 12.59% 11.86% 12.51% 14.71%
Equity/Assets 10.16% 12.10% 11.23% 11.80% 11.77%
Book value per share $ 28.04 $ 30.95 $ 28.87 $ 25.62 $ 22.09
Tangible book value per share* $ 24.68 $ 20.75 $ 19.08 $ 17.61 $ 16.64
Tangible common equity to tangible assets* 9.05% 8.45% 7.71% 8.42% 9.13%
SELECTED FINANCIAL HIGHLIGHTS (UNAUDITED)(Dollars in thousands, except per share data)
06

Selected Financial Highlights on Page 6 and 7:*Indicates non-GAAP financial measure. Please see our Annual Report on Form 10-K “Item 7 – Management’s Discussion and Analysis of Financial Condition and Results of Operations – Non-GAAP Financial Measures” for reconciliation to the most directly comparable GAAP measure.
** Adjusted Net Income Allocable to Common Stockholders, plus income tax and provision expense.
TA N G I B L E C O M M O N E Q U I T YT B V P E R S H A R ETANGIBLE BOOK VALUE* AND TANGIBLE COMMON EQUITY*
TAN
GIB
LE C
OM
MO
N E
QU
ITY
($0
00
S)
TBV
PE
R S
HA
RE
($)
$ 5
$ 1 0
$ 1 5
$ 2 0
$ 2 5
$ 5 0 , 0 0 0
$ 1 0 0 , 0 0 0
$ 1 5 0 , 0 0 0
$ 2 0 0 , 0 0 0
$ 2 5 0 , 0 0 0
$ 3 0 0 , 0 0 0
$ 3 5 0 , 0 0 0
2016 2017 2018 2019 2020
$ 1 9 4 , 3 5 2
$ 2 5 7, 2 2 2
$ 3 0 1 , 2 7 6$ 3 2 0 , 5 4 2
$ 1 6 . 6 4$ 1 7. 6 1
$ 1 9 . 0 8
$ 2 0 .7 5
$ 2 4 . 6 8
$ 3 5 8 , 8 6 1
NET INTEREST INCOME & NET INTEREST MARGIN
N E T I N T E R E S T I N C O M E
N E T I N T E R E S T M A R G I N
TOTAL RESERVE RATIO
TOTA
L R
ES
ER
VE
RA
TIO
(%
)
A L LO W A N C E F O R LO A N LO S S E S
P U R C H A S E D I S C O U N TCAPITAL RATIOS
T C E / TA L E V E R A G E R AT I O T I E R 1 R I S K- B A S E D C A P I TA L R AT I O
PRE-TAX, PRE-PROVISION NET REVENUE*,**
AD
JUS
TED
PTP
P (
$00
0S
)
$ 1 0 , 0 0 0
$ 2 0 , 0 0 0
$ 3 0 , 0 0 0
$ 4 0 , 0 0 0
$ 5 0 , 0 0 0
$ 6 0 , 0 0 0
0 . 5 0 %2 . 0 0 %
4 . 0 0 %
6 . 0 0 %
8 . 0 0 %
1 0 . 0 0 %
1 2 . 0 0 %
1 4 . 0 0 %
1 6 . 0 0 %
1 . 0 0 %
1 . 5 0 %
2 . 0 0 %
2 . 5 0 %
2016
12/31/16
2017
12/31/17
2018
12/31/18
2019
12/31/19
2020
12/31/20
$16,
406
0 . 4 6 % 0 . 4 0 % 0 . 4 4 % 0 . 4 8 %
1 . 3 0 %
12/31/16
9.13
%11
.81%
14.2
8%
12/31/17
8.42
% 10.3
3% 12.1
4%
12/31/18
7.71
%8.
60%
11.4
5%
12/31/19
8.45
%9.
02%
12.1
5%
12/31/20
9.05
%9.
30%
13.3
7%
0 . 9 1 % 0 . 8 0 % 0 . 5 8 %0 . 3 7 %
0 . 8 2 %
1 . 3 7 %1 . 2 0 %
1 . 0 2 %0 . 8 5 %
2 .1 2 %
$35,
049
$52,
628
$54,
429
$58,
414
CA
PIT
AL
RA
TIO
S (
%)
NE
T IN
TER
ES
T IN
CO
ME
($0
00
S)
NE
T INTE
RE
ST M
AR
GIN
(%)
$ 2 5 , 0 0 0
$ 5 0 , 0 0 0
$ 7 5 , 0 0 0
$ 1 0 0 , 0 0 0
$ 1 2 5 , 0 0 0
$ 1 5 0 , 0 0 0
0 . 5 0 %
1 . 0 0 %
1 . 5 0 %
2 . 0 0 %
2 . 5 0 %
3 . 0 0 %
3 . 5 0 %
4 . 0 0 %
3 . 3 0 %
3 . 8 3 % 3 . 8 1 %3 . 4 8 %
3 . 6 3 %
$132
,652
12/31/20$1
25,8
5812/31/19
$124
,798
12/31/18
$86,
002
12/31/17
$52,
597
12/31/16
07Selected Financial Highlights

Equity Bancshares, Inc. and Equity Bank Board of Directors
Equity Bank Board of Directors
Brad S. Elliott
Chairman & CEO Equity Bancshares, Inc.
Gary C. Allerheiligen
CPA/Consultant
Junetta M. Everett
Former Vice President of Professional Relations Delta Dental of KS
Gregory L. Gaeddert
Managing Partner B12 Capital Partners, LLC
Benjamen M. Hutton
CEO Hutton Construction
Randee Renee Koger
Attorney & Partner Wise & Reber L.C.
Gregory H. Kossover
Chief Operating Officer Equity Bancshares, Inc.
Shawn D. Penner
Owner Shamrock Development, LLC
Harvey R. Sorensen
Attorney & Partner Foulston Siefkin LLP
Jeffrey A. Bloomer
President & COO Sunrise Oilfield Supply
Dan R. Bowers
AttorneyP. John Eck
Owner AGV Corp., Eck Agency, Inc.
Roger A. Buller
Former SVP & Regional Manager, Benjamin F. Edwards & Co.
Craig L. Anderson
President Equity Bank
Leadership & Board of Directors
“I could not have asked for better service. The help came from all the way at the top with the president to the tellers at the window!”-Laura Hull, Gerald Hull Farms
Our Equity Bancshares, Inc. and Equity Bank Boards of Directors and our leadership team met in person for our annual strategic planning retreat in September, touring a construction site.
08
Jerry P. Maland
Former Chairman & CEO Community First Bancshares, Inc.
James L. Berglund
Former President & CEO Sunflower Bank

Brad S. Elliott
Chairman & Chief Executive Officer
Gregory H. Kossover
Chief Operating Officer
Craig L. Anderson
President, Equity BankEric R. Newell
Chief Financial OfficerJulie A. Huber
EVP, Strategic Initiatives
������������� ������������
���������������� ��������������
�������������������������� �!����
����������"��#��������� ������$�����
$�������� �%���������������
������&����������#��������� ���������'�������������
��������(��)��%�����������������������������
(�������$���������� �*� ���������������
��������+��,�"���)���������������#�������
(���"��$��������� �,��!�����������
(����(��)����,��������������#�������
Equity Bank Leadership Team
Operations, Support & Quality Care
&���+��)����� ,-�.����������#������������� ��(����� ,-�.�*������� �����#��������������� ��&���� ,-�.�������������������������������!����� ,-�.� ��������.�/�� ���*��#��������,��0���&���������� ,-�.���������������������������%�������1������ ,-�.�� ���� ���������������#�������$�!����#�� 2����� *�������/����������3�����������(������(��$����� ,���������3������������(�������0�$��0��� ���3�������������������(��������$������ *��#�������&��������$����� �3�������������������3��������&���&��#��� +�����3��������������$����+��#����� ,���,$ �#�!�����������-������(��#�������� �������3��������������,��3����+��/������ ,������ ���������&�������'��/������� �2������/����������3�����������,������ ��������� �������3��������������(������&��+����������� +������!��0�#���������0����(����4��� ���3������������(����� ��������� ,��������3�������������(����&���������� ,������������������������� �������� $, ����3�������������(���� ���+��,������� #��������� ���2�����,���������,��0� *��,�������� ���������'�������� )��������������������&��%���� ��'����� -�������������Ozark Mountain
(�����$��5$���5�#����� ,-�.�����������������(���$������� ,-�.�����������+�����(������-��)������ ,-�.�,������+�������������$��������&��$����� ������+��������������#��������������� �4����������������(�����#��#�!��� $�����������������&��/������������ ����������+�������4�%����,��&���� ���������.��������,3�����#�������&������ ���������.�$����!�������0�(�������� ����������+������#�!������������ �4���������������&�����$����0%����� �������������������������(�����!��� ������+�������������Kansas City & Topeka
(�������� ��&����� ,-�.�,������+������������������)��#���� ,-�.�����������+������(������������� ,-�.�����������+�����������(��,������ ,-�.�����������������,��(���4�0���� ,-�.�#��������� ���!��������$�����,���������)����� ������������������&��%��+������� ����������+������ �2�+������3������ ����������+������+�����'��)����� ����������+������(�������)�!������ ����������+������(���������&��� ����������+�����,�������+���� ����������+�������%����)�������� ����������+�����(�����+���������� ���������.���3���$�������������� ����������+���������'��,�������� ����������+�����(����� ��������� $���������Northern Oklahoma
,3�������)��������� ���������������#����� ��&������%����� ,-�.�����������+����������'��,����� ,-�.�����������+������������ ������ $���������(�����������&������ ����������+�����
Southeast Kansas
#�!��� ��'����� ����������������������,�������� ���������.������%��
Wichita
#�!��� ��&��� �����������������#������� ������ ,-�.�*������������+�����$�����+������%����� ,-�.�,������+������������#�!������,���� ��� ,-�.�����������+������������ ��������� ������������������ ����0�+��������� ����������+���������������+��+����� $�������� !�������+�����$���� ��6���� ����������+�����
Southwest
������#�����!��� ��������������� �������� !����4� ,-�.�������������������,�����������#������� ,-�.�$���������������(��,����� ,-�.�$����������������(��$����� ����������+����������������/���� ����������+������ �����+��&������ +����������(�����#��+������� ���������.��������������#�������� ��������$������������������� ����������+�����������������7+���� ����������+�����
Tulsa
��������(��+������� ����������������������#������0��� ,-�.�����������+�����(������'��������� ,-�.�����������+��������/��������,��� ,-�.�����������+�����$�����(��'����� ,-�.�����������+������&��%����#����0����� $���������
Western Kansas�+�!��#�����4� �����������������������$������ ,-�.�*���������������,����$���������� ,-�.��,��+������������������+������� ,-�.��������������������,��!���+��,���������� ,-�.�����������+���������+��$������� ���������#���/������������ ���������.�)����(��������������� ����������+������������������ ����������+�������������������� ���������� ���'�%��� ���������.����
Western Missouri
(������(������� ���������������,������+��)��� ,-�.�,������+������������������� ��$������� ���������.�,����������+��#�!��� ���������.������������+��#����� �������������������'��,���)���� ���������.�'������%���,������(������� /�������� �!����(������#��,����� ���������.�'����0����������,����� ���������.�'������������� ��'������ ����������+�����(��&��'������ ����������,���� �������� 09

2003 2005 2007���������� ����� ���� ��� ������������������������� �� ��
��������� ��������������� �� ��������� ��! ��������"�#��������� ���
�������"����� ����$��� ����� ���� ����%�������$����#������ �� ��
2014 20172015 2016���������"������� �"������� �������&�'(������������ ����)�*�"��������� ����������� ������� �! ����+����
���������"������"����� ����$� ���� ������#�������$,�� ��" ��� ���� ��� ������(��� �-�����.��� ���( ������ ������&��� ��.��
�������������$����� ���� �� ���"����� ����/����%�����������-�� ���������������"������%(.��������"!��
�������"����� ����-�""������/����� ���� ����%�������# �������'�����������"������0*1�2�"��������� ���� ��"����
Equity Bancshares, Inc. Timeline
Diversity & Inclusion Honors 2020. Among Equity Bank’s employee base, women make up 67 percent, and black and indigenous persons of color (BIPOC) make up 14 percent. Among officers in leadership positions throughout our communities, 42 percent are women, 9 percent are comprised of BIPOC and 4 percent are veterans. Equity has been recognized three times for its diversity efforts, including 2019 and 2020 honors.
Innovation Awards 2020. Equity earned a nod for its inventive and innovative approach to speeding up the Paycheck Protection Program process for customers. Equity’s support teams worked day and night, and implemented new software to facilitate the customer experience.
Women Who Lead. Tina Call (right), Chief Risk Officer, was part of the Business Journal’s annual class of women leaders in Wichita. Women Who Lead participate in panel and mentorship discussions throughout the calendar year. (Also pictured: Gaylyn McGregor)
Marketing Leaders of 2020. John Hanley, Senior Vice President and Senior Director of Marketing, earned inclusion into the Business Journal’s first class of top marketing pros in various industries.
Top Administrative Professionals. Jodi Vogel, Corporate Administrative Officer, was selected as a top administrative professional in Wichita, based on her dedication, service, skillset, and being a video conference pro.
2020 in reviewEquity Bank community bankers earned numerouslocal awards and recognition from the WichitaBusiness Journal in 2020, including:
10

2008 2009 2011 2012��������� �������# ��� �����������$�� ��������������$� ���� ��,����������3�������! ������4��5��$�""����6.�
������������� ��.��� ���( ����� ���������"������078�"�������� �� �� ����
������� �����������! ������ ���������&��� ���$����"�-���9����� ���:�&����
������� �������/����-�""������� ���� ����%���� ����)1���� ���������� �� ��:�6�������
2018 2019 2020-�"������"����� ����/����� ���� ��� ������4�!� �;#���������� "��< ���� �����������$������6.�� ���-����� ��� ���&�����=��"����.��
>� ��������� �� ���"�!����! ������� ���"�� ����?7��� �������-�"������ ��������������! ������ ���������=��"��� ���-�������.������ ���?������������� ����� "��4 ��������������&����:��� ����6 � ��"����
4� ������( �������(��������� ���6 ���$�����4��������� "���'���� ����� �� ��-����" ����+�������������"�� �$� ���� ���������������-�"������0@1�"���������!���� ������!������ ����
40 Under 40. Blake Yakel, Vice President and Commercial Loan Officer in Wichita, earned the prestigious nod for Wichita professionals and was a member of the class of forty, recognized in summer of 2020.
Executive of the Year. Brad Elliott earned the honors among Wichita-based executives, in part for leading Equity through the pandemic with entrepreneurial spirit and focus on customer experience.
Julie Huber, Executive Vice President of Strategic Initiatives, a 2008 recipient of the 40 Under 40 class earned induction into the 40 Under 40 Hall of Fame.
Watch videos celebrating our award winners and Equity U:
equitybank.com/hindsight
2020 Equity University graduates
Jeremy B. Allen, Wichita
Mark L. Davis, Clinton
James B. "Brad" Daniel, Ozark Mountain
Greg L. Duran, Western Missouri
Kimberly D. Edwards, Tulsa
Randall D. Graver, Southwest
Sarah B. Nienke, Wichita
Kristof P. Slupkowski, Wichita
Adam M. Thompson, Wichita
David A. Wright, Southeast Kansas
11Re/view 2020

CORPORATE HEADQUARTERS
7701 East Kellogg Avenue, Suite 300 Wichita, Kansas 67207 (316) 612-6000
investor.equitybank.com
FORM 10K AND INVESTOR INQUIRIES
Analysts, investors, and others with additional questions about Equity Bancshares, Inc. are encouraged to contact Chris Navratil, SVP of Finance, at (316) 612-6014 or [email protected].
TRANSFER AGENT
Continental Stock Transfer & Trust Company 1 State Street, 30th Floor New York, NY 10004-1561 (212) 509-4000
INVESTOR.EQUITYBANK.COM
K A N S A S
A R K A N S A S
M I S S O U R I
O K L A H O M A
© Equity Bancshares, Inc.
Design: Kayla M. Close, Marketing
12

UNITED STATESSECURITIES AND EXCHANGE COMMISSION
Washington, D.C. 20549
FORM 10-K☒ ANNUAL REPORT PURSUANT TO SECTION 13 OR 15(d) OF THE SECURITIES EXCHANGE ACT OF 1934
For the fiscal year ended December 31, 2020OR
☐ TRANSITION REPORT PURSUANT TO SECTION 13 OR 15(d) OF THE SECURITIES EXCHANGE ACT OF 1934For the transition period from to
Commission File Number 001-37624
EQUITY BANCSHARES, INC.(Exact name of registrant as specified in its charter)
Kansas 72-1532188(State or other jurisdiction ofincorporation or organization)
(I.R.S. EmployerIdentification No.)
7701 East Kellogg Drive, Suite 300Wichita, KS 67207
(Address of principal executive offices) (Zip Code)
Registrant’s telephone number, including area code: 316.612.6000Securities registered pursuant to Section 12(b) of the Act:
Title of each class Trading Symbol(s) Name of exchange on which registeredClass A Common Stock, par value $0.01 per share EQBK NASDAQ Stock Market LLC
Securities registered pursuant to section 12(g) of the Act: None
Indicate by check mark if the registrant is a well-known seasoned issuer, as defined in Rule 405 of the Securities Act. Yes ☐ No ☒Indicate by check mark if the registrant is not required to file reports pursuant to Section 13 or Section 15(d) of the Act. Yes ☐ No ☒Indicate by check mark whether the registrant (1) has filed all reports required to be filed by Section 13 or 15(d) of the Securities Exchange Act of1934 during the preceding 12 months (or for such shorter period that the registrant was required to file such reports), and (2) has been subject to suchfiling requirements for the past 90 days. Yes ☒ No ☐Indicate by check mark whether the registrant has submitted electronically every Interactive Data File required to be submitted pursuant to Rule 405of Regulation S-T (§232.405 of this chapter) during the preceding 12 months (or for such shorter period that the registrant was required to submitsuch files). Yes ☒ No ☐Indicate by check mark whether the registrant is a large accelerated filer, an accelerated filer, a non-accelerated filer, a smaller reporting company oran emerging growth company. See the definitions of “large accelerated filer,” “accelerated filer,” “smaller reporting company,” and “emerginggrowth company” in Rule 12b-2 of the Exchange Act.Large accelerated filer ☐ Accelerated filer ☒Non-accelerated filer ☐ Smaller reporting company ☐
Emerging growth company ☐If an emerging growth company, indicate by check mark if the registrant has elected not to use the extended transition period for complying
with any new or revised financial accounting standards provided pursuant to Section 13(a) of the Exchange Act. ☐Indicate by check mark whether the registrant has filed a report on and attestation to its management’s assessment of the effectiveness of its internalcontrol over financial reporting under Section 404(b) of the Sarbanes-Oxley Act (15 U.S.C. 7262(b)) by the registered public accounting firm thatprepared or issued its audit report. ☒Indicate by check mark whether the registrant is a shell company (as defined in Rule 12b-2 of the Act). Yes ☐ No ☒As of June 30, 2020, the last business day of the registrant’s most recently completed second fiscal quarter, the aggregate market value of theregistrant’s voting and non-voting common stock held by non-affiliates was $250.3 million.Indicate the number of shares outstanding of each of the registrant’s classes of common stock, as of the latest practicable date.
Shares outstanding as of February 28, 2021Class A Common Stock, par value $0.01 per share 14,448,847Class B Non-Voting Common Stock, par value $0.01 per share 0
DOCUMENTS INCORPORATED BY REFERENCE:Portions of the registrant’s Proxy Statement relating to the 2021 Annual Meeting of Stockholders, which will be filed within 120 days afterDecember 31, 2020, are incorporated by reference into Part III of this Annual Report on Form 10-K.

TABLE OF CONTENTS
Part I
Item 1. Business.......................................................................................................................................................................... 3
Item 1A. Risk Factors .................................................................................................................................................................... 22
Item 1B. Unresolved Staff Comments........................................................................................................................................... 48
Item 2. Properties ........................................................................................................................................................................ 48
Item 3. Legal Proceedings .......................................................................................................................................................... 51
Item 4. Mine Safety Disclosures................................................................................................................................................. 51
Part II
Item 5. Market for Registrant’s Common Equity, Related Stockholder Matters and Issuer Purchases of Equity Securities .... 52
Item 6. Selected Financial Data .................................................................................................................................................. 55
Item 7. Management’s Discussion and Analysis of Financial Condition and Results of Operations ........................................ 57
Item 7A. Quantitative and Qualitative Disclosure About Market Risk......................................................................................... 87
Item 8. Financial Statements and Supplementary Data .............................................................................................................. 89
Report of Independent Registered Public Accounting Firm .......................................................................................... F-1
Consolidated Balance Sheets.......................................................................................................................................... F-4
Consolidated Statements of Income ............................................................................................................................... F-5
Consolidated Statements of Comprehensive Income ..................................................................................................... F-6
Consolidated Statements of Stockholders’ Equity ......................................................................................................... F-7
Consolidated Statements of Cash Flows ........................................................................................................................ F-8
Notes to Consolidated Financial Statements .................................................................................................................. F-10
Item 9. Changes in and Disagreements with Accountants on Accounting and Financial Disclosure ........................................ 90
Item 9A. Controls and Procedures................................................................................................................................................. 90
Item 9B. Other Information........................................................................................................................................................... 90
Part III
Item 10. Directors, Executive Officers and Corporate Governance ............................................................................................. 91
Item 11. Executive Compensation ................................................................................................................................................ 91
Item 12. Security Ownership of Certain Beneficial Owners and Management and Related Stockholder Matters ...................... 91
Item 13. Certain Relationships and Related Transactions, and Director Independence............................................................... 91
Item 14. Principal Accounting Fees and Services ........................................................................................................................ 91
Part IV
Item 15. Exhibits, Financial Statement Schedules........................................................................................................................ 92
1
Important Notice about Information in this Annual Report on Form 10-K
Unless we state otherwise or the context otherwise requires, references in this Annual Report on Form 10-K to “we,” “our,”“us,” “the Company” and “Equity” refer to Equity Bancshares, Inc. and its consolidated subsidiaries, including Equity Bank, whichwe sometimes refer to as “Equity Bank,” “the Bank” or “our Bank.”
The information contained in this Annual Report on Form 10-K is accurate only as of the date of this annual report and as of thedates specified herein.
CAUTIONARY NOTE REGARDING FORWARD-LOOKING STATEMENTS
This Annual Report on Form 10-K contains “forward-looking statements within the meaning of Section 27A of the SecuritiesAct of 1933, as amended (the “Securities Act”), and Section 21E of the Securities Exchange Act of 1934, as amended (the “ExchangeAct”).” These forward-looking statements reflect our current views with respect to, among other things, future events and our financialperformance. These statements are often, but not always, made through the use of words or phrases such as “may,” “should,” “could,”“predict,” “potential,” “believe,” “will likely result,” “expect,” “continue,” “will,” “anticipate,” “seek,” “estimate,” “intend,” “plan,”“project,” “forecast,” “goal,” “target,” “would” and “outlook,” or the negative variations of those words or other comparable words ofa future or forward-looking nature. These forward-looking statements are not historical facts and are based on current expectations,estimates and projections about our industry, management’s beliefs and certain assumptions made by management, many of which, bytheir nature, are inherently uncertain and beyond our control. Accordingly, we caution you that any such forward-looking statementsare not guarantees of future performance and are subject to risks, assumptions and uncertainties that are difficult to predict. Althoughwe believe that the expectations reflected in these forward-looking statements are reasonable as of the date made, actual results mayprove to be materially different from the results expressed or implied by the forward-looking statements. When considering forward-looking statements, you should keep in mind the risk factors and other cautionary statements described in “Item 1A – Risk Factors” ofthis Annual Report on Form 10-K.
There are or will be important factors that could cause our actual results to differ materially from those indicated in theseforward-looking statements, including, but not limited to, the following:
• external economic and/or market factors, such as changes in monetary and fiscal policies and laws, including the interestrate policies of the Board of Governors of the Federal Reserve System, or the Federal Reserve, inflation or deflation,changes in the demand for loans, and fluctuations in consumer spending, borrowing and savings habits which may have anadverse impact on our financial condition;
• losses resulting from a decline in the credit quality of the assets that we hold;
• the occurrence of various events that negatively impact the real estate market, since a significant portion of our loanportfolio is secured by real estate;
• inaccuracies or changes in the appraised value of real estate securing the loans we originate that could lead to losses if thereal estate collateral is later foreclosed upon and sold at a price lower than the appraised value;
• the loss of our largest loan and depositor relationships;
• limitations on our ability to lend and to mitigate the risks associated with our lending activities as a result of our size andcapital position;
• differences in our qualitative factors used in our calculation of the allowance for loan losses from actual results;
• the adoption of ASU 2016-13, Financial Instruments � Credit Losses, and its impact on our allowance for loan losses andcapital;
• inadequacies in our allowance for loan losses which could require us to take a charge to earnings and thereby adverselyaffect our financial condition;
• interest rate fluctuations which could have an adverse effect on our profitability;
• the impact of the transition from London Interbank Offered Rate (“LIBOR”) and our ability to adequately manage suchtransition;
• a continued economic downturn related to the COVID-19 pandemic, especially one affecting our core market areas;
• inability of borrowers on deferral to make payments on their loans following the end of the deferral period;
2
• potential fraud related to Small Business Administration (“SBA”) loan applications through the Paycheck ProtectionProgram (“PPP”) as part of the U.S. Coronavirus Aid, Relief and Economic Security Act (“CARES Act”);
• the effects of pandemic and widespread public health emergencies;
• the costs of integrating the businesses we acquire, which may be greater than expected;
• the departure of key members of our management personnel or our inability to hire qualified management personnel;
• generally difficult or unfavorable conditions in the market for financial products and services;
• challenges arising from unsuccessful attempts to expand into new geographic markets, products, or services;
• a lack of liquidity resulting from decreased loan repayment rates, lower deposit balances, or other factors;
• inaccuracies in our assumptions about future events which could result in material differences between our financialprojections and actual financial performance;
• an inability to keep pace with the rate of technological advances due to a lack of resources to invest in new technologies;
• disruptions, security breaches, or other adverse events, failures or interruptions in, or attacks on, our informationtechnology systems;
• unauthorized access to nonpublic personal information of our customers, which could expose us to litigation orreputational harm;
• disruptions, security breaches, or other adverse events affecting the third-party vendors who perform several of our criticalprocessing functions;
• required implementation of new accounting standards that significantly change our existing recognition practices;
• additional regulatory requirements and restrictions on our business, which could impose additional costs on us;
• an increase in FDIC deposit insurance assessments, which could adversely affect our earnings;
• increased capital requirements imposed by banking regulators, which may require us to raise capital at a time when capitalis not available on favorable terms or at all;
• restraints on the ability of Equity Bank to pay dividends to us, which could limit our liquidity;
• a failure in the internal controls we have implemented to address the risks inherent to the banking industry;
• continued or increasing competition from other financial institutions, credit unions, and non-bank financial servicescompanies, many of which are subject to different regulations than we are;
• costs arising from the environmental risks associated with making loans secured by real estate;
• the occurrence of adverse weather or manmade events, which could negatively affect our core markets or disrupt ouroperations;
• the effects of new federal tax laws, or changes to existing federal tax laws;
• the obligation associated with being a public company requires significant resources and management attention; and
• other factors that are discussed in “Item 1A – Risk Factors.”
The foregoing factors should not be construed as exhaustive and should be read in conjunction with other cautionary statementsthat are included in this Annual Report on Form 10-K. If one or more events related to these or other risks or uncertaintiesmaterialize, or if our underlying assumptions prove to be incorrect, actual results may differ materially from what we anticipate.Accordingly, you should not place undue reliance on any such forward-looking statements. Any forward-looking statement speaksonly as of the date when it is made and we do not undertake any obligation to publicly update or review any forward-lookingstatement, whether as a result of new information, future developments or otherwise. New risks and uncertainties arise from time totime and it is not possible for us to predict those events or how they may affect us. In addition, we cannot assess the impact of eachfactor on our business or the extent to which any factor, or combination of factors, may cause actual results to differ materially fromthose contained in any forward-looking statements. All forward-looking statements, expressed or implied, included in this AnnualReport on Form 10-K are expressly qualified in their entirety by this cautionary statement. This cautionary statement should also beconsidered in connection with any subsequent written or oral forward-looking statements that we or persons acting on our behalf mayissue.

3
Part I
Item 1: Business
Our Company
We are a bank holding company headquartered in Wichita, Kansas. Our wholly-owned banking subsidiary, Equity Bank, provides abroad range of financial services primarily to businesses and business owners as well as individuals through our network of 51branches located in Arkansas, Kansas, Missouri and Oklahoma, as of December 31, 2020. As of December 31, 2020, we had, on aconsolidated basis, total assets of $4.01 billion, total deposits of $3.45 billion, total loans (net of allowances) of $2.56 billion and totalstockholders’ equity of $407.6 million.
Our principal objective is to increase stockholder value and generate consistent earnings growth by expanding our commercialbanking franchise both organically and through strategic acquisitions. We strive to provide an enhanced banking experience for ourcustomers by providing them with a comprehensive suite of sophisticated banking products and services tailored to meet their needswhile delivering the high-quality relationship-based customer service of a community bank.
Our History and Growth
We were founded in November 2002 by our Chairman and CEO, Brad S. Elliott. Mr. Elliott believed that, as a result of in-marketconsolidation, there existed an opportunity to build an attractive commercial banking franchise and create long-term value for ourstockholders. Following thirteen years’ experience as a finance executive, including serving as a Regional President for a Kansasbank with over $1.0 billion in assets, Mr. Elliott implemented his banking vision of developing a strategic consolidator of communitybanks and a destination for seasoned bankers and businesspersons who share our entrepreneurial spirit. In 2003, we raised capitalfrom 23 local investors to finance the acquisition of National Bank of Andover in Andover, Kansas.
We believe we have a successful track record of selectively acquiring, integrating and consolidating community banks and branchnetworks. Our acquisition activity includes the following transactions.
• June 2003 – Acquired National Bank of Andover in Andover, Kansas for $3 million. At the time of our acquisition,National Bank of Andover had $32 million in total assets.
• February 2005 – Acquired two branches of Hillcrest Bank, N.A. in Wichita, Kansas, which increased our deposits by $66million. In conjunction with this acquisition, we relocated our headquarters to our current principal executive offices inWichita.
• June 2006 – Acquired the Mortgage Centre of Wichita and integrated it into our Bank as a department to expand ourmortgage loan platform.
• October 2006 – Acquired a Missouri charter from First National Bank in Sarcoxie, Missouri, which allowed us tosubsequently open a full-service branch in Lee’s Summit, Missouri in 2007.
• November 2007 – Acquired Signature Bancshares, Inc. in Spring Hill, Kansas, which provided us entry into the OverlandPark, Kansas market.
• August 2008 – Acquired Ellis State Bank with locations in Ellis and Hays, Kansas.
• December 2011 – Acquired four branches of Citizens Bank and Trust in Topeka, Kansas, which increased our deposits by$110 million.
• October 2012 – Acquired First Community Bancshares, Inc. in Overland Park, Kansas, which increased our deposits byapproximately $515 million. At the time of acquisition, First Community had total assets of approximately $595 million,which significantly increased our total asset size and provided us with ten additional branches in Western Missouri andfive additional branches in Kansas City.
• October 2015 – Acquired First Independence Corporation of Independence, the registered savings and loan holdingcompany for First Federal Savings & Loan of Independence, based in Independence, Kansas. First Independenceoperated four full-service branches in Southeastern Kansas. At the time of acquisition, First Independence hadconsolidated total assets of $135.0 million, total deposits of $87.1 million and total loans of $89.9 million.
• November 2016 – Acquired Community First Bancshares, Inc. in Harrison, Arkansas, which increased our deposits by$375.4 million. At the time of acquisition, Community First had total assets of $462.9 million and five locations inArkansas.
• March 2017 – Acquired Prairie State Bancshares, Inc. (“Prairie”) in Hoxie, Kansas, which increased our deposits by$125.4 million and our total assets by $153.1 million. The merger added three locations in western Kansas.

4
• November 2017 – Acquired Eastman National Bancshares, Inc. (“Eastman”), which had a total of four branches in PoncaCity and Newkirk, Oklahoma. The acquisition increased our deposits by $224.1 million, our loans by $177.9 million andour total assets by $281.5 million. In addition, at the same time, we acquired Cache Holdings, Inc. (“Cache”) in Tulsa,Oklahoma. Cache was the holding company for Patriot Bank and had one branch in Tulsa. The acquisition of Cacheadded $278.7 million in deposits, $300.7 million in loans and $343.4 in total assets.
• May 2018 – Acquired Kansas Bank Corporation (“KBC”), which had a total of five branches in Liberal and Hugoton,Kansas. The acquisition increased our deposits by $288.4 million, our loans by $159.4 million and our total assets by$336.1 million. On the same day we acquired Adams Dairy Bancshares, Inc. (“Adams”), which had one branch located inBlue Springs, Missouri. The acquisition of Adams added $97.1 million in deposits, $82.7 million in loans and $119.8million in total assets.
• August 2018 – Acquired City Bank and Trust Company (“City Bank”), with one branch in Guymon, Oklahoma, fromDocking Bancshares, Inc. This acquisition increased our deposits by $126.9 million, our loans by $77.1 million and ourtotal assets by $163.3 million.
• February 2019 – Acquired the assets and assumed the deposits and certain other liabilities of two branch locations inGuymon, Oklahoma and one branch location in Cordell, Oklahoma, from MidFirst Bank based in Oklahoma City,Oklahoma. This acquisition increased our deposits by $98.5 million, our loans by $6.5 million and our total assets by$98.6 million.
• October 2020 – Purchased the assets and assumed the deposits of one branch location in Norton, Kansas, and one branchlocation in Almena, Kansas, from Almena State Bank (“Almena”) facilitated by the Federal Deposit InsuranceCorporation (“FDIC”). This purchase increased our deposits by $62.5 million, our loans by $31.4 million and our totalassets by $66.9 million.
In conjunction with our strategic acquisition growth, we strive to reposition and improve the loan portfolio and deposit mix of thebanks we acquire. Following our acquisitions, we focus on identifying and disposing of problematic loans and replacing them withhigher quality loans generated organically. In addition, we focus on growth in our commercial loan portfolio primarily by hiringadditional talented bankers, particularly in our metropolitan markets, and incentivizing our bankers to expand their commercialbanking relationships. We also seek to increase our most attractive deposit accounts, primarily by growing deposits in our communitymarkets and cross selling our depository products to our loan customers.
As a result of these strategic and organic growth efforts, we have expanded our team of full-time equivalent employees from 19 to 623and our network of branches from two to 51. We believe that we are well positioned to continue to be a strategic consolidator ofcommunity banks while maintaining our history of attracting experienced and entrepreneurial bankers and organically growing ourloans and deposits.
Our Strategies
We believe we are a leading provider of commercial and personal banking services to businesses and business owners as well asindividuals in our targeted Midwestern markets. Our strategy is to continue strategically consolidating community banks within suchmarkets and maintaining our organic growth, while preserving our asset quality through disciplined lending practices.
• Strategic Consolidation of Community Banks. We believe our strategy of selectively acquiring and integratingcommunity banks has provided us with economies of scale and improved our overall franchise efficiency. We expect tocontinue to pursue strategic acquisitions and believe our targeted market areas present us with many and variedacquisition opportunities. The following map illustrates the headquarters of potential acquisition opportunities broken outby asset size between $50.0 million and $1.5 billion within our target footprint.

5
We believe many of these banks will continue to be burdened by new and more complex banking regulations, resource constraints,competitive limitations, rising technological and other business costs, management succession issues and liquidity concerns.
Despite the significant number of opportunities, we intend to continue to employ a disciplined approach to our acquisition strategy andonly seek to identify and partner with financial institutions that possess attractive market share, low-cost deposit funding andcompelling noninterest income-generating businesses. We believe consolidation will lead to organic growth opportunities for usfollowing the integration of businesses we acquire. We also expect to continue to manage our branch network in order to ensureeffective coverage for customers while minimizing any geographic overlap and driving corporate efficiency.
• Enhance the Performance of the Banks We Acquire. We strive to successfully integrate the banks we acquire into ourexisting operational platform and enhance stockholder value through the creation of efficiencies within the combinedoperations. As a result of our acquisition history, we believe we have developed an experienced approach to integrationthat seeks to identify and execute on such synergies, particularly in the areas of technology, data processing, complianceand human resources, while generating earnings growth. We believe that our experience and reputation as a successfulintegrator and acquirer will allow us to continue to capitalize on additional opportunities within our markets in the future.
• Focus on Lending Growth in Our Metropolitan Markets While Increasing Deposits in Our Community Markets. Weare focused on continuing to grow organically and believe the markets in which we operate currently provide meaningfulopportunities to expand our commercial customer base and increase our current market share. We believe our branchnetwork is strategically split between growing metropolitan markets, such as Kansas City, Wichita and Tulsa, and stablecommunity markets within Western Kansas, Western Missouri, Topeka, Northern Arkansas and Northern Oklahoma. Webelieve this diverse geographic footprint provides us with access to low cost, stable core deposits in community marketsthat we can use to fund commercial loan growth in our metropolitan markets. The following table shows our totaldeposits and loans (net of allowances) in our community markets and our metropolitan markets as of December 31, 2020,which we believe illustrates our execution of this strategy.
6
Deposits Loans
Amount(1) Overall % Amount(1) Overall %Metropolitan markets(2) $ 1,073,897 31% $ 1,559,629 60%Community markets(3) $ 2,373,693 69% $ 1,032,067 40%
(1)Amounts in thousands.(2)Represents 12 branches located in the Wichita, Kansas City and Tulsa metropolitan statistical areas (“MSAs”).(3)Represents 39 branches located outside of the Wichita, Kansas City and Tulsa MSAs.
Our team of seasoned bankers represents an important driver of our organic growth by expanding banking relationshipswith current and potential customers. We expect to continue to make opportunistic hires of talented and entrepreneurialbankers, particularly in our metropolitan markets, to further augment our growth. Our bankers are incentivized toincrease the size of their loan and deposit portfolios and generate fee income while maintaining strong credit quality. Wealso seek to cross-sell our various banking products, including our deposit and treasury wealth management products, toour commercial loan customers, which we believe provides a basis for expanding our banking relationships as well as astable, low-cost deposit base. We have built a scalable platform that will support this continued organic growth.
• Preserve Our Asset Quality Through Disciplined Lending Practices. Our approach to credit management uses well-defined policies and procedures, disciplined underwriting criteria and ongoing risk management. We are a competitiveand effective commercial and industrial lender, supplementing ongoing and active loan servicing with early-stage creditreview provided by our bankers. This approach has allowed us to maintain loan growth with a diversified portfolio ofhigh-quality assets. We believe our credit culture supports accountable bankers who maintain an ability to expand ourcustomer base as well as make sound decisions for our Company. We believe our success in managing asset quality isillustrated by our aggregate net charge-off history.
Our Competitive Strengths
We believe the following competitive strengths will allow us to continue to achieve our principal objective of increasing stockholdervalue and generating consistent earnings growth through the organic and strategic expansion of our commercial banking franchise.
• Experienced Leadership and Management Team. Our seasoned and experienced executive management team, seniorleaders and board of directors have exhibited the ability to deliver stockholder value by consistently growing profitablywhile expanding our commercial banking franchise through acquisition and integration. Our executive management teamhas, on average, more than twenty years of experience working for large, up to ten billion-dollar financial institutions inour markets during various economic cycles along with significant merger and acquisition experience in the financialservices industry. Our executive management team has instilled a transparent and entrepreneurial culture that rewardsleadership, innovation and problem solving.
• Focus on Commercial Banking. We are primarily a commercial bank. As measured by outstanding balances atDecember 31, 2020, commercial loans composed over 74.2% of our loan portfolio and within our commercial loanportfolio, 61.8% of such loans were commercial real estate loans and 38.2% were commercial and industrial loans. Wehave developed strong commercial relationships in our markets across a diversified range of sectors including key areassupporting regional and local economic activity and growth, such as manufacturing, freight/transportation, consumerservices, franchising and commercial real estate. We have also been successful in attracting customers from largercompetitors because of our flexible and responsive approach in providing banking solutions tailored to meet ourcustomers’ needs while maintaining disciplined underwriting standards. Our relationship-based approach seeks to growlending relationships with our customers as they expand their businesses, including geographically and through cross-selling our various other banking products, such as our deposit and treasury management products. We have a growingpresence in attractive commercial banking markets, such as Wichita, Kansas City and Tulsa, which we believe presentsignificant opportunities to continue to increase our business banking activities.
• Our Ability to Consolidate. Our branches are strategically located within metropolitan markets, Kansas City, Tulsa andWichita, as well as stable community markets that present opportunities to expand our market share. Our executivemanagement team has identified significant acquisition and consolidation opportunities ranging from small to largecommunity banking institutions. These opportunities can include branch-only acquisitions as well. We believe our trackrecord of strategic acquisitions and effective integrations, combined with our expertise in our markets and scalableplatform, will allow us to capitalize on these growth opportunities.
• Disciplined Acquisition Approach. Our disciplined approach to acquisitions, consolidations and integrations includes thefollowing: (i) selectively acquiring community banking franchises only at appropriate valuations, after taking into accountrisks that we perceive with respect to the targeted bank; (ii) completing comprehensive due diligence and developing anappropriate plan to address any legacy credit problems of the targeted institution; (iii) identifying an achievable cost
7
savings estimate and holding our management accountable for achieving such estimates; (iv) executing definitiveacquisition agreements that we believe provide adequate protections to us; (v) installing our credit procedures, audit andrisk management policies and procedures and compliance standards upon consummation of the acquisition;(vi) collaborating with the target’s management team to execute on synergies and cost saving opportunities related to theacquisition; (vii) involving a broader management team across multiple departments in order to help ensure the successfulintegration of all business functions; and (viii) scheduling the acquisition closing date to occur simultaneously with theplatform conversion date. We believe this approach allows us to realize the benefits of the acquisition and createstockholder value while appropriately managing risk.
• Efficient and Scalable Platform with Capacity to Support Our Growth. Through significant investments in technologyand staff, our management team has built an efficient and scalable corporate infrastructure within our commercial bankingfranchise, including in the areas of banking processes, technology, data processing, underwriting, risk management andinternal audit, which we believe will support our continued growth. While expanding our infrastructure, severaldepartmental functions have been outsourced to gain the experience of outside professionals while at the same timeachieving more favorable economics and cost-effective solutions. Such outsourced areas include specific internal auditfunctions and select loan review. This outsourcing strategy has proven to control costs while adding enhanced controlsand/or service levels. We believe that this scalable infrastructure will continue to allow us to efficiently and effectivelymanage our anticipated growth.
• Culture Committed to Talent Development, Transparency and Accountability. We have invested in professional talentsince our inception by building a team of “businesspersons first and bankers second” and economically aligned them withour stockholders, primarily through our stock purchase opportunities. In our efforts to become a destination for seasonedbankers with an entrepreneurial spirit, we have developed numerous leadership development programs. For example,“Equity University” is a year-long program we designed for our promising company-wide leaders. We believe our well-trained and motivated professionals work most effectively in a corporate environment that emphasizes transparency,respect, innovation and accountability. Our culture provides our professionals with the empowerment to better serve ourclients and our communities.
• Sophisticated and Customized Banking Products with High-Quality Customer Service. We strive to offer our customersthe sophisticated commercial banking products of large financial institutions with the personalized service of a communitybank. Our management team’s significant banking and lending experience in our markets has provided us with anunderstanding of the commercial banking needs of our customers that allows us to tailor our products and services to meetour customers’ needs. In addition to offering a diverse array of banking products and services, we offer our customers thehigh-touch, relationship-based customer service experience of a community bank. For example, we utilize EquityConnect, a customized customer relationship management system, to assign relationship officers to enhance relationshipswith our customers and identify and meet their particular needs.
• Strong Risk Management Practices. We place significant emphasis on risk management as an integral component of ourorganizational culture without sacrificing growth. We believe our comprehensive risk management system is designed tomake sure that we have sound policies, procedures and practices for the management of key risks under our riskframework (which includes market, operational, liquidity, interest rate sensitivity, credit, insurance, regulatory, legal andreputational risk) and that any exceptions are reported by senior management to our board of directors or audit committee.Our risk management practices are overseen by the Chairmen of our audit and risk committees, who have many years ofcombined banking experience, and our Chief Risk Officer, who has more than 30 years of banking experience. Webelieve that our enterprise risk management philosophy has been important in gaining and maintaining the confidence ofour various constituencies and growing our business and footprint within our markets. We also believe our strong riskmanagement practices are manifested in our asset quality statistics.
2020 Acquisitions
On October 23, 2020, we completed our purchase of two bank locations from Almena State Bank, facilitated by the FDIC. Pursuantto the purchase, Equity Bank assumed the deposits and acquired the loans and certain other assets associated with the two banklocations.
8
Our Banking Services
A general description of the range of commercial banking products and other services we offer follows.
Lending Activities
We offer a variety of loans, including commercial and industrial, commercial real estate-backed loans (including loans secured byowner occupied commercial properties), commercial lines of credit, working capital loans, term loans, equipment financing,acquisition, expansion and development loans, borrowing base loans, real estate construction loans, homebuilder loans, agricultural,government guaranteed loans, letters of credit and other loan products to national and regional companies, restaurant franchisees,hoteliers, real estate developers, manufacturing and industrial companies, agribusiness companies and other businesses. We also offervarious consumer loans to individuals and professionals including residential real estate loans, home equity loans, home equity lines ofcredit (“HELOCs”), installment loans, unsecured and secured personal lines of credit, overdraft protection and letters of credit.Lending activities originate from the relationships and efforts of our bankers, with an emphasis on providing banking solutionstailored to meet our customers’ needs while maintaining our underwriting standards.
At December 31, 2020, we had total loans of $2.56 billion (net of allowances), representing 63.7% of our total assets. For additionalinformation concerning our loan portfolio, see “Item 7 – Management’s Discussion and Analysis of Financial Condition and Resultsof Operations – Financial Condition – Loan Portfolio.”
Concentrations of Credit Risk. Most of our lending activity is conducted with businesses and individuals in metropolitan Kansas City,Tulsa and Wichita. Our loan portfolio consists primarily of commercial real estate loans, which were $1.19 billion and constituted45.9% of our total loans as of December 31, 2020, commercial and industrial loans, which were $734.5 million and constituted 28.3%of our total loans as of December 31, 2020, and residential real estate loans, which were $382.0 million and constituted 14.7% of ourtotal loans as of December 31, 2020. Our commercial real estate loans are generally secured by first liens on real property. Theremaining commercial and industrial loans are typically secured by general business assets, accounts receivable, inventory and/or thecorporate guaranty of the borrower and/or personal guaranty of its principals. The geographic concentration subjects the loanportfolio to the general economic conditions within Arkansas, Kansas, Missouri and Oklahoma. The risks created by suchconcentrations have been considered by management in the determination of the adequacy of the allowance for loan losses.Management believes the allowance for loan losses is adequate to cover incurred losses in our loan portfolio as of December 31, 2020.
Sound risk management practices and appropriate levels of capital are essential elements of a sound commercial real estate lendingprogram. Concentrations of commercial real estate exposures add a dimension of risk that compounds the risk inherent in individualloans. Interagency guidance on commercial real estate concentrations describe sound risk management practices which include boardand management oversight, portfolio management, management information systems, market analysis, portfolio stress testing andsensitivity analysis, credit underwriting standards and credit risk review functions. Management believes these practices allow us toappropriately monitor concentrations in commercial real estate in our loan portfolio.
Large Credit Relationships. As of December 31, 2020, the aggregate amount of loans to our ten largest borrowers (including relatedentities) amounted to approximately $241.3 million, or 9.3% of total loans. See “Item 1A – Risk Factors – Risks Related to OurBusiness – Our largest loan relationships currently make up a material percentage of our total loan portfolio.”
Loan Underwriting and Approval. Historically, we believe we have made sound, high quality loans while recognizing that lendingmoney involves a degree of business risk. We have loan policies designed to assist us in managing this business risk. These policiesprovide a general framework for our loan origination, monitoring and funding activities, while recognizing that not all risks can beanticipated. Our board of directors delegates loan authority up to board-approved hold limits collectively to our Directors’ creditcommittee, which is comprised of members of our board of directors. Our board of directors also delegates limited lending authorityto our internal loan committee, which is comprised of members of our executive management team. In addition, our board of directorsalso delegates more limited lending authority to our Chief Executive Officer, Chief Operating Officer, Chief Credit Officer, credit riskpersonnel and, on a further limited basis, to selected lending managers in each of our target markets. Lending officers and relationshipmanagers, including our bankers, have further limited individual loan authority. When the total relationship exceeds an individual’sloan authority, a higher authority or credit committee approval is required. The objective of our approval process is to provide adisciplined, collaborative approach to larger credits while maintaining responsiveness to client needs.
Loan decisions are documented as to the borrower’s business, purpose of the loan, evaluation of the repayment source and associatedrisks, evaluation of collateral, covenants and monitoring requirements and the risk rating rationale. Our strategy for approving ordisapproving loans is to follow conservative loan policies and consistent underwriting practices which include:
• maintaining close relationships among our customers and their designated banker to ensure ongoing credit monitoring andloan servicing;

9
• granting credit on a sound basis with full knowledge of the purpose and source of repayment for such credit;
• ensuring that primary and secondary sources of repayment are adequate in relation to the amount of the loan;
• developing and maintaining targeted levels of diversification for our loan portfolio as a whole and for loans within eachcategory; and
• ensuring that each loan is properly documented and that any insurance coverage requirements are satisfied.
Managing credit risk is a Company-wide process. Our strategy for credit risk management includes well-defined, centralized creditpolicies, uniform underwriting criteria and ongoing risk monitoring and review processes for all credit exposures. Our processesemphasize early-stage review of loans, regular credit evaluations and management reviews of loans, which supplement the ongoingand proactive credit monitoring and loan servicing provided by our bankers. Our Chief Credit Officer provides Company-wide creditoversight and periodically reviews all credit risk portfolios to ensure that the risk identification processes are functioning properly andthat our credit standards are followed. In addition, a third-party loan review is performed to assist in the identification of problemassets and to confirm our internal risk rating of loans. We attempt to identify potential problem loans early in an effort to seekaggressive resolution of these situations before the loans become a loss, record any necessary charge-offs promptly and maintainadequate allowance levels for probable loan losses incurred in the loan portfolio.
Our loan policies generally include other underwriting guidelines for loans collateralized by real estate. These underwriting standardsare designed to determine the maximum loan amount that a borrower has the capacity to repay based upon the type of collateralsecuring the loan and the borrower’s income. Such loan policies include maximum amortization schedules and loan terms for eachcategory of loans collateralized by liens on real estate.
In addition, our loan policies provide guidelines for personal guarantees; an environmental review; loans to employees, executiveofficers and directors; problem loan identification; maintenance of an adequate allowance for loan losses and other matters relating tolending practices.
Lending Limits. Our lending activities are subject to a variety of lending limits imposed by federal and state law. In general, the Bankis subject to a legal lending limit on loans to a single borrower based on the Bank’s capital level. The dollar amounts of the Bank’slending limit increases or decreases as the Bank’s capital increases or decreases. The Bank is able to sell participations in its largerloans to other financial institutions, which allows it to manage the risk involved in these loans and to meet the lending needs of itscustomers requiring extensions of credit in excess of these limits.
The Bank’s legal lending limit as of December 31, 2020, on loans to a single borrower was $104.7 million. However, we typicallymaintain an in-house limit of $25.0 million for loans to a single borrower. We have strict policies and procedures in place for theestablishment of hold limits with respect to specific products and businesses and evaluating exceptions to the hold limits for individualrelationships.
Our loan policies provide general guidelines for loan-to-value ratios that restrict the size of loans to a maximum percentage of thevalue of the collateral securing the loans, which percentage varies by the type of collateral. Our internal loan-to-value limitationsfollow limits established by applicable law.
Loan Types. We provide a variety of loans to meet our customers’ needs. The section below discusses our general loan categories.
Commercial and Industrial Loans. We make commercial and industrial loans, including commercial lines of credit, working capitalloans, term loans, equipment financing, aircraft financing, acquisition, expansion and development loans, borrowing base loans,government guaranteed loans, letters of credit and other loan products, primarily in our target markets that are underwritten on thebasis of the borrower’s ability to service the debt from income. We take as collateral a lien on general business assets including,among other things, available real estate, accounts receivable, inventory and equipment and generally obtain a personal guaranty ofthe borrower or principal. Our commercial and industrial loans generally have variable interest rates and terms that typically rangefrom one to five years depending on factors such as the type and size of the loan, the financial strength of the borrower/guarantor andthe age, type and value of the collateral. Fixed rate commercial and industrial loan maturities are generally short-term, with three tofive-year maturities, or include periodic interest rate resets. Terms greater than five years may be appropriate in some circumstancesbased upon the useful life of the underlying asset being financed or if some form of credit enhancement, such as a governmentguarantee is obtained.
10
We also participate in syndicated loans (loans made by a group of lenders, including us, who share or participate in a specific loan)with a larger regional financial institution as the lead lender. Syndicated loans are typically made to large businesses (which arereferred to as shared national credits) or middle market companies (which do not meet the regulatory definition of shared nationalcredits), both of which are secured by business assets or equipment, and also commercial real estate. The syndicate group for bothtypes of loans usually consists of two to three other financial institutions. In particular, we frequently work with a large regionalfinancial institution, which is often the lead lender with respect to these loans. We have developed this portfolio to diversify ourbalance sheet, increase our yield and mitigate interest rate risk due to the variable rate pricing structure of the loans. We have adefined set of credit guidelines that we use when evaluating these credits. Although other large financial institutions are the leadlenders on these loans, our credit department does its own independent review of these loans and the approval process of these loans isconsistent with our underwriting of loans and our lending policies. We expect to continue our syndicated lending program for theforeseeable future.
In general, commercial and industrial loans may involve increased credit risk and, therefore, typically yield a higher return. Theincreased risk in commercial and industrial loans derives from the expectation that such loans generally are serviced principally fromthe operations of the business and those operations may not be successful. Any interruption or discontinuance of operating cash flowsfrom the business, which may be influenced by events not under the control of the borrower such as economic events and changes ingovernmental regulations, could materially affect the ability of the borrower to repay the loan. In addition, the collateral securingcommercial and industrial loans generally includes moveable property such as equipment and inventory, which may decline in valuemore rapidly than we anticipate exposing us to increased credit risk. As a result of these additional complexities, variables and risks,commercial and industrial loans require extensive underwriting and servicing.
Commercial Real Estate Loans. We make commercial mortgage loans collateralized by real estate, which may be owner occupied ornon-owner-occupied real estate. Commercial real estate lending typically involves higher loan principal amounts and the repayment isdependent, in large part, on sufficient income from the properties securing the loans to cover operating expenses and debt service. Werequire our commercial real estate loans to be secured by well-managed property with adequate margins and generally obtain aguarantee from responsible parties. Our commercial mortgage loans generally are collateralized by first liens on real estate, havevariable or fixed interest rates and amortize over a 10 to 20-year period with balloon payments or rate adjustments due at the end ofthree to seven years. Periodically, we will utilize an interest rate swap to hedge against long term fixed rate exposures. Commercialmortgage loans considered for interest rate swap hedging typically have terms of greater than five years.
Payments on loans secured by such properties are often dependent on the successful operation (in the case of owner-occupied realestate) or management (in the case of non-owner-occupied real estate) of the properties. Accordingly, repayment of these loans maybe subject to adverse conditions in the real estate market or the economy to a greater extent than other types of loans. In underwritingcommercial real estate loans, we seek to minimize these risks in a variety of ways, including giving careful consideration to theproperty’s age, condition, operating history, future operating projections, current and projected market rental rates, vacancy rates,location and physical condition. The underwriting analysis also may include credit verification, reviews of appraisals, environmentalhazards or reports, the borrower’s liquidity and leverage, management experience of the owners or principals, economic condition andindustry trends.
Real Estate Construction Loans. We make loans to finance the construction of residential and non-residential properties.Construction loans generally are collateralized by first liens on real estate and have floating interest rates. We conduct periodicinspections, either directly or through an agent, prior to approval of periodic draws on these loans. Underwriting guidelines similar tothose described above are also used in our construction lending activities. Our construction loans have terms that typically range fromsix months to two years depending on factors such as the type and size of the development and the financial strength of theborrower/guarantor. Loans are typically structured with an interest only construction period. Loans are underwritten to either matureat the completion of construction, or transition to a traditional amortizing commercial real estate facility at the completion ofconstruction, in line with other commercial real estate loans held at the bank.

11
Construction loans generally involve additional risks attributable to the fact that loan funds are advanced upon the security of a projectunder construction, and the project is of uncertain value prior to its completion. Because of uncertainties inherent in estimatingconstruction costs, the market value of the completed project and the effects of governmental regulation on real property, it can bedifficult to accurately evaluate the total funds required to complete a project and the related loan-to-value ratio. As a result of theseuncertainties, construction lending often involves the disbursement of substantial funds with repayment dependent, in part, on thesuccess of the ultimate project rather than the ability of a borrower or guarantor to repay the loan. If we are forced to foreclose on aproject prior to completion, there is no assurance that we will be able to recover the entire unpaid portion of the loan. In addition, wemay be required to fund additional amounts to complete a project and it may be necessary to hold the property for an indeterminateperiod of time subject to the regulatory limitations imposed by local, state or federal laws.
1 – 4 Family Residential Mortgages. We make residential real estate loans collateralized by owner-occupied properties located in ourmarket areas. We offer a variety of mortgage loan products with amortization periods up to 30 years including traditional 30-yearfixed loans and various adjustable rate mortgages. Typically, loans with a fixed interest rate of greater than 10 years are held for saleand sold on the secondary market and adjustable rate mortgages are held for investment. Loans collateralized by one-to-four familyresidential real estate generally are originated in amounts of no more than 80% of appraised value. Home equity loans and HELOCsare generally limited to a combined loan-to-value ratio of 80%, including the subordinate lien. We retain a valid lien on real estate,obtain a title insurance policy that insures that the property is free from encumbrances and require hazard insurance.
From time to time we have purchased pools of residential mortgages originated by other financial institutions to hold for investmentwith the intent to diversify our residential mortgage loan portfolio and increase our yield. These loans purchased typically have anadjustable rate with a fixed period of no more than 10 years and are collateralized by one-to-four family residential real estate. Wehave a defined set of credit guidelines that we use when evaluating these credits. Although these loans were originated andunderwritten by another institution, our mortgage and credit departments do their own independent review of these loans. These loanstypically are secured by collateral outside of our branch footprint.
Agricultural Loans. We offer both fixed-rate and adjustable-rate agricultural real estate loans to our customers. We also make loansto finance the purchase of machinery, equipment and breeding stock, seasonal crop operating loans used to fund the borrower’s cropproduction operating expenses, livestock operating, and revolving loans used to purchase livestock for resale and related livestockproduction expense.
Generally, our agricultural real estate loans amortize over periods not in excess of 20 years and have a loan-to-value ratio of 80%. Wealso originate agricultural real estate loans directly and through programs sponsored by the Farm Service Agency (“FSA”), an agencyof the United States Department of Agriculture, which provides a partial guarantee on loans underwritten to FSA standards.Agricultural real estate loans generally carry higher interest rates and have shorter terms than 1-4 family residential real estate loans.Agricultural real estate loans, however, entail additional credit risks compared to one- to four-family residential real estate loans, asthey typically involve larger loan balances concentrated with single borrowers or groups of related borrowers. We generally requirefarmers to obtain multi-peril crop insurance coverage through a program partially subsidized by the Federal government to helpmitigate the risk of crop failures.
Agricultural operating loans may be originated at an adjustable or fixed rate of interest and generally for a term of up to 7 years. Inthe case of agricultural operating loans secured by breeding livestock and/or farm equipment, such loans are originated at fixed ratesof interest for a term of up to 5 years. We typically originate agricultural operating loans based on the borrower’s ability to makerepayment from the cash flow of the borrower’s agricultural business. As a result, the availability of funds for the repayment ofagricultural operating loans may be substantially dependent on the success of the business itself and the general economicenvironment. A significant number of agricultural borrowers with these types of loans may qualify for relief under a chapter of theU.S. Bankruptcy Code that is designed specifically for the reorganization of financial obligations of family farmers and whichprovides certain preferential procedures to agricultural borrowers compared to traditional bankruptcy proceedings pursuant to otherchapters of the U.S. Bankruptcy Code.
Consumer Loans. We make a variety of loans to individuals for personal and household purposes, including secured and unsecuredterm loans and home improvement loans. Consumer loans are underwritten based on the individual borrower’s income, current debtlevel, past credit history and the value of any available collateral. The terms of consumer loans vary considerably based upon the loantype, nature of collateral and size of the loan. Consumer loans entail greater risk than do residential real estate loans because they maybe unsecured or, if secured, the value of the collateral, such as an automobile or boat, may be more difficult to assess and more likelyto decrease in value than real estate. In such cases, any repossessed collateral for a defaulted consumer loan may not provide anadequate source of repayment for the outstanding loan balance. The remaining deficiency often will not warrant further substantialcollection efforts against the borrower beyond obtaining a deficiency judgment. In addition, consumer loan collections are dependenton the borrower’s continuing financial stability, and thus are more likely to be adversely affected by job loss, divorce, illness orpersonal bankruptcy. Furthermore, the application of various federal and state laws may limit the amount which can be recovered onsuch loans.
12
Deposit Products
Our lending and investing activities are primarily funded by deposits. We offer a variety of deposit accounts with a wide range ofinterest rates and terms including demand, savings, money market and time deposits with the goal of attracting a wide variety ofcustomers, including small to medium-sized businesses. We employ customer acquisition strategies to generate new account anddeposit growth, such as customer referral incentives, search engine optimization, targeted direct mail and email campaigns, in additionto conventional marketing initiatives and advertising. Our goal is to emphasize our core deposits and cross-sell our deposit productsto our loan customers.
We design our consumer deposit products specifically for the lifestyles of clients in the communities we serve. Some accountsemphasize and reward debit card usage, while others appeal to higher deposit customers. We also utilize Equity Connect, which is ourcustomer relationship management system, to assist our personnel in deepening and expanding current relationships by providingtimely identification of potential needs. It also serves as a methodical tool to track customer onboarding and retention actions byaccount officers. We do participate in the Certificate of Deposit Registry Services (“CDARS”) via Promontory Interfinancial Networkas an option for our customers to place funds and occasionally as a funding source.
We also bid for, and accept, deposits from public entities in our markets.
Other Products and Services
We offer banking products and services that are competitively priced with a focus on convenience and accessibility. We offer a fullsuite of online banking solutions including access to account balances, online transfers, online bill payment and electronic delivery ofcustomer statements, mobile banking solutions for iPhone and Android phones, including remote check deposit with mobile bill pay.We offer extended drive-through hours, ATMs and banking by telephone, mail and personal appointment. We offer debit cards withno ATM surcharges or foreign ATM fees for checking customers, plus night depository, direct deposit, cashier’s and travelers checksand letters of credit, as well as treasury management services, wire transfer services and automated clearing house (“ACH”) services.
We offer a full array of commercial treasury management services designed to be competitive with banks of all sizes. Treasurymanagement services include balance reporting (including current day and previous day activity), transfers between accounts, wiretransfer initiation, ACH origination and stop payments. Cash management deposit products consist of lockbox, remote depositcapture, positive pay, reverse positive pay, account reconciliation services, zero balance accounts and sweep accounts, including loansweep.
In addition, we offer a full comprehensive suite of products and offerings for trust and wealth management customers. Trust andwealth management services include private banking, investment management, trust services and estate and financial planning.
Our Markets
As of December 31, 2020, we conducted banking operations through our 51 branches located in Arkansas, Kansas, Missouri andOklahoma. We believe that an important factor contributing to our historical performance and our ability to execute our strategy is theattractiveness and specific characteristics of our existing and target markets. In particular, we believe our markets provide us withaccess to low cost, stable core deposits in smaller community markets that we can use to fund commercial loan growth in metropolitanareas.
We believe our existing and target markets are among some of the most attractive in the Midwestern United States. Our markets arehome to thousands of manufacturing and trade jobs, and have experienced recent growth in the healthcare, consumer services andtechnology sectors. We believe the central geographic footprint of our markets provides numerous industrial plants, facilities andmanufacturing businesses with a central shipping location from which they can distribute their products. Our markets also serve as thecorporate headquarters for Koch Industries Inc., Hallmark Cards, Inc., H&R Block, Inc., Sprint Corporation, Cerner Corporation,American Century Investments, Garmin International, Inc., Cessna Aircraft Company, Seaboard Corporation, Cargill Meat Solutions,Spirit AeroSystems, Dairy Farmers of America, Quick Trip, ONEOK, and Williams Companies and host a major presence forcompanies across a variety of industries, including Bombardier Learjet, Collective Brands, Inc., FedEx, Flexsteel, Hills Pet Nutrition,Inc., Textron Aviation Services, Tyson Foods, Phillips 66, Rib Crib, Honeywell and Bayer Corporation. We understand thecommunity banking needs of the businesses and individuals within our markets and have focused on developing a commercial andpersonal banking platform to service such needs.
13
The markets in which we operate have generally experienced stable population growth over the past five years, with modestpopulation growth expected over the next five years. Wichita is the largest metropolitan statistical authority (“MSA”) located fully inKansas and the No. 94 MSA in the U.S. with a population of over 640,000. Kansas City, Missouri and Kansas is the No. 31 largestMSA in the U.S. with a population of 2.2 million, and Tulsa, Oklahoma, is No. 51 with a MSA population of nearly 1 million.
In addition, we believe our markets are stable and have weathered various economic cycles relatively well. Household income isexpected to increase from 2021 through 2026 by 5.71%, while population growth is expected largely to hold from 2021 through 2026.In Kansas City, households are expected to grow by 3.5%, Tulsa by 3.25% and Wichita by 1.5%, according to Claritas data providedby S&P Global.
We compete for loans, deposits and financial services in our markets against many other bank and nonbank institutions, includingcommunity banks, regional banks, national banks, Internet-based banks, money market and mutual funds, brokerage houses, creditunions, mortgage companies and insurance companies. We believe that our comprehensive suite of sophisticated banking productsprovides us with a competitive advantage over smaller community banks within our markets while our high-quality, relationship-based customer service will allow us to take market share from larger regional and national banks. In addition, our markets presentsignificant acquisition, integration and consolidation opportunities, and we expect to continue to pursue strategic acquisitions in ourmarkets. We believe that many small to mid-sized banking organizations that currently serve our markets are acquisitionopportunities for us, either because of scale and operational challenges, regulatory pressures, management succession issues orstockholder liquidity needs. We think we offer an attractive solution for such banks because we retain the community banking feeland services upon which their customers expect and rely.
Information Technology Systems
We continue to make significant investments in our information technology systems and staff for our banking and lending operationsand treasury management activities. We believe this investment will support our continued growth, permit us to enhance ourcapabilities to offer new products and overall customer experience and enable us to provide scale for future growth and acquisitions.We use nationally recognized software vendors and their support allows us to operate our data processing and core systems in-house.Our internal network and e-mail systems are maintained in-house and we have enhanced our back-up site at a decentralized location.This back-up site provides for redundancy and disaster recovery capabilities.
The majority of our other systems, including our electronic funds transfer, transaction processing and online banking services arehosted by third-party service providers. The scalability of this infrastructure will support our growth strategy. In addition, the testedcapability of these vendors to automatically switch over to standby systems should allow us to recover our systems and providebusiness continuity quickly in case of a disaster.
Due to our heavy reliance on the strength and capability of our technology systems, which we use both to interface with our customersand to manage our internal financial reporting and other systems, we utilize a layered cyber security model designed to protect allsystems and sensitive data. This layered model is composed of a variety of different components from a range of security vendors.The various components are centrally managed and monitored creating a multi-layered, interlocking, cybersecurity defense system.We believe this defense system is dynamic and designed to adjust to protect against the latest cyber threats and attack vectors.
Competition
The financial services industry is highly competitive. We compete for loans, deposits, and financial services in all of our principalmarkets. We compete directly with other bank and nonbank institutions located within our markets, Internet-based banks, out-of-market banks, and bank holding companies that advertise in or otherwise serve our markets, along with money market and mutualfunds, brokerage houses, mortgage companies, and insurance companies or other commercial entities that offer financial servicesproducts. Competition involves efforts to retain current customers, obtain new loans and deposits, increase the scope and type ofservices offered and offer competitive interest rates paid on deposits and charged on loans. Many of our competitors enjoycompetitive advantages, including greater financial resources, a wider geographic presence, more accessible branch office locations,the ability to offer additional services, more favorable pricing alternatives and lower origination and operating costs. Some of ourcompetitors have been in business for a long time and have an established customer base and name recognition. We believe that ourcompetitive pricing, personalized service and community involvement enable us to effectively compete in the communities in whichwe operate.
Human Capital
The Company’s success depends on its ability to attract and retain highly qualified senior and middle management and other skilledemployees. Competition for qualified employees can be intense and it may be difficult to locate personnel with the necessarycombination of skills, attributes and business relationships.

14
The Company believes that its employees are the primary key to the Company’s success as a financial institution. The Company iscommitted to attracting, retaining and promoting top quality talent regardless of sex, sexual orientation, gender identity, race, color,national origin, age, religion and physical ability. The Company strives to identify and select the best candidates for all open positionsbased on qualifying factors for each job. The Company is dedicated to providing a workplace for its employees that is inclusive,supportive and free of any form of discrimination or harassment; rewarding and recognizing its employees based on their individualresults and performance; and recognizing and respecting all of the characteristics and differences that make each of the Company’semployees unique.
Additionally, the Company is committed to employee development through a combination of in-house and external training programs.Further, the Company has two staff development programs with formal in-house training programs for junior bankers includingguidance from senior banking team members.
As of December 31, 2020, the Company employed 623 full-time equivalent employees. None of our employees are represented byany collective bargaining unit or is a party to a collective bargaining agreement.
Available Information
The Company files reports, proxy statements and other information with the Securities and Exchange Commission (“SEC”) under theSecurities Exchange Act of 1934, as amended (the “Exchange Act”). The Company makes available, free of charge, on its website athttp://investor.equitybank.com its annual report on Form 10-K, quarterly reports on Form 10-Q, current reports on Form 8-K andamendments to those reports filed or furnished pursuant to Section 13(a) or 15(d) of the Exchange Act as soon as reasonablypracticable after the Company electronically files, or furnishes, such materials to the SEC. The SEC also maintains a website athttp://www.sec.gov that contains reports, proxy and information statements and other information regarding issuers that fileelectronically with the SEC. The information contained on or accessible from our website does not constitute a part of this AnnualReport on Form 10-K and is not incorporated by reference herein.
Supervision and Regulation
Banking is a complex, highly regulated industry. Consequently, our growth and earnings performance can be affected, not only bymanagement decisions and general and local economic conditions, but also by the statutes administered by and the regulations andpolicies of, various governmental regulatory authorities. These authorities include, but are not limited to, the Federal Reserve, theFDIC, the OCC, the Kansas Office of State Bank Commissioner (“OSBC”), the Consumer Financial Protection Bureau (“CFPB”), theInternal Revenue Service (“IRS”) and state taxing authorities. The effect of these statutes, regulations and policies and any changes toany of them can be significant and cannot be predicted.
The primary goals of the bank regulatory scheme are to maintain a safe and sound banking system and to facilitate the conduct ofsound monetary policy. In furtherance of those goals, the U.S. Congress and the individual states have created several regulatoryagencies and enacted numerous laws, such as the Dodd-Frank Wall Street Reform and Consumer Protection Act (the “Dodd-FrankAct”), that govern banks and the banking industry. The system of supervision and regulation applicable to us establishes acomprehensive framework for our operations and is intended primarily for the protection of the FDIC’s deposit insurance funds, ourdepositors and the public, rather than the stockholders and creditors.
New regulations and statutes are regularly proposed that contain wide-ranging proposals for altering the structures, regulations andcompetitive relationships of financial institutions operating in the United States. We cannot predict whether or in what form anyproposed regulation or statute will be adopted or the extent to which our businesses may be affected by any new regulation or statute.
The following is an attempt to summarize some of the relevant laws, rules and regulations governing banks and bank holdingcompanies, but does not purport to be a complete summary of all applicable laws, rules and regulations governing banks. Thedescriptions are qualified in their entirety by reference to the specific statutes and regulations discussed.
The laws, rules and regulations add significantly to the cost of operating the Company and Equity Bank and thus have a negativeimpact on profitability. In recent years, financial service providers that are not subject to the same regulations as the Company andEquity Bank have expanded significantly. Less regulation may give these institutions a competitive advantage over the Company andEquity Bank. Such institutions may continue to draw large amounts of funds away from banking institutions, with a continuingadverse effect on the banking industry in general.
Bank Holding Company Regulation
We are a bank holding company registered under the Bank Holding Company Act of 1956 (“BHC Act”), as amended, and are subjectto supervision and regulation by the Federal Reserve. Federal laws subject bank holding companies to particular restrictions on thetypes of activities in which they may engage and to a range of supervisory requirements and activities, including regulatoryenforcement actions, for violation of laws and policies.
15
Activities Closely Related to Banking
The BHC Act prohibits a bank holding company, with certain limited exceptions, from acquiring direct or indirect ownership orcontrol of more than five percent of the voting shares of any company that is not a bank or from engaging in any activities other thanthose of banking, managing or controlling banks and certain other subsidiaries or furnishing services to or performing services for itssubsidiaries. Bank holding companies also may engage in or acquire interests in companies that engage in a limited set of activitiesthat are so closely related to banking as to be a proper incident thereto. If a bank holding company has become a financial holdingcompany (“FHC”), it may engage in a broader set of activities, including insurance underwriting and broker-dealer services as well asactivities that are jointly determined by the Federal Reserve and the U.S. Treasury to be financial in nature or incidental to suchfinancial activity. FHCs may also engage in activities that are determined by the Federal Reserve to be complementary to financialactivities. To maintain FHC status, the bank holding company and all subsidiary depository institutions must be “well managed” and“well capitalized.” Additionally, all subsidiary depository institutions must have received at least a “Satisfactory” rating on its mostrecent Community Reinvestment Act (“CRA”) examination. Failure to meet these requirements may result in limitations on activitiesand acquisitions. We have not elected to be an FHC at this time.
Safe and Sound Banking Practices
Bank holding companies are not permitted to engage in unsafe and unsound banking practices. The Federal Reserve may order a bankholding company to terminate an activity or control of a non-bank subsidiary if such activity or control constitutes a significant risk tothe financial safety, soundness or stability of a subsidiary bank and is inconsistent with sound banking principles. Regulation Y alsorequires a holding company to give the Federal Reserve prior notice of any redemption or repurchase of its own equity securities if theconsideration to be paid, together with the consideration paid for any repurchases or redemptions in the preceding year, is equal to10% or more of the company’s consolidated net worth.
Consistent with the Dodd-Frank Act codification of the Federal Reserve’s policy that bank holding companies must serve as a sourceof financial strength for their subsidiary banks, the Federal Reserve has stated that, as a matter of prudence, a bank holding companygenerally should not maintain a rate of distributions to stockholders unless its available net income has been sufficient to fully fund thedistributions and the prospective rate of earnings retention appears consistent with a bank holding company’s capital needs, assetquality and overall financial condition.
In addition, the Federal Reserve Supervisory Letter SR 09-4 provides guidance on the declaration and payment of dividends, capitalredemptions and capital repurchases by a bank holding company. Supervisory Letter SR 09-4 provides that, as a general matter, abank holding company should eliminate, defer or significantly reduce its dividends if: (i) the bank holding company’s net incomeavailable to stockholders for the past four quarters, net of dividends previously paid during that period, is not sufficient to fully fundthe dividends, (ii) the bank holding company’s prospective rate of earnings retention is not consistent with the bank holdingcompany’s capital needs and overall current and prospective financial condition or (iii) the bank holding company will not meet, or isin danger of not meeting, its minimum regulatory capital adequacy ratios. Failure to do so could result in a supervisory finding thatthe bank holding company is operating in an unsafe and unsound manner.
Limitations on Equity Bank’s ability to pay dividends could, in turn, affect our ability to pay dividends to our stockholders. For moreinformation concerning Equity Bank’s ability to pay dividends, see “Bank Regulation” below.
The Federal Reserve has broad authority to prohibit activities of bank holding companies and their non-banking subsidiaries whichrepresent unsafe and unsound banking practices, or which constitute violations of laws or regulations. Notably, the FinancialInstitutions Reform, Recovery and Enforcement Act of 1989 (“FIRREA”), provides that the Board of Governors of the FederalReserve can assess civil money penalties for such practices or violations which can be as high as $1 million per day. FIRREAcontains expansive provisions regarding the scope of individuals and entities against which such penalties may be assessed.
Annual Reporting and Examinations
We are required to file annual and quarterly reports with the Federal Reserve and such additional information as the Federal Reservemay require pursuant to the BHC Act. The Federal Reserve may examine a bank holding company or any of its subsidiaries andcharge the company for the cost of such an examination. We are also subject to reporting and disclosure requirements under state andfederal securities laws.

16
Rules on Regulatory Capital
Regulatory capital rules released in July 2013 pursuant to the Basel III requirements (“Basel III rules”), implemented higher minimumcapital requirements for bank holding companies and banks. The Basel III rules included a common equity Tier 1 capital requirementand established criteria that instruments must meet to be considered common equity Tier 1 capital, additional Tier 1 capital or Tier 2capital. These enhancements were designed to both improve the quality and increase the quantity of capital required to be held bybanking organizations, better equipping the U.S. banking system to deal with adverse economic conditions. The Basel III rulesrequire banks and bank holding companies to maintain a minimum common equity Tier 1 (“CET1”) risk-based capital ratio of 4.5%, aTier 1 risk-based capital ratio of 6%, a total risk-based capital ratio of 8% and a leverage ratio of 4%. Under the Basel III rules, banksand bank holding companies must maintain a CET1 risk-based capital ratio of 6.5%, a Tier 1 risk-based capital ratio of 8%, a totalrisk-based capital ratio of 10% and a leverage ratio of 5% to be deemed “well capitalized” for purposes of certain rules andrequirements. Banks and bank holding companies are also required to maintain a “capital conservation buffer” in excess of theminimum risk-based capital ratios. The buffer is intended to help ensure that banking organizations conserve capital when it is mostneeded, allowing them to better weather periods of economic stress. The minimum 2.5% buffer is composed solely of CET1 capital.If an institution’s capital conservation buffer is less than or equal to 2.5%, then the institution is subject to limitations on certainactivities, including payment of dividends, share repurchases and discretionary bonuses to executive officers.
The Basel III rules also attempted to improve the quality of capital by implementing changes to the definition of capital. Among themost important changes are stricter eligibility criteria for regulatory capital instruments that disallow the inclusion of certaininstruments, such as trust preferred securities, in Tier 1 capital going forward and new constraints on the inclusion of minorityinterests, mortgage-servicing assets, deferred tax assets and certain investments in the capital of unconsolidated financial institutions.In addition, the Basel III rules require that most regulatory capital deductions be made from CET1 capital.
The federal bank regulatory agencies may also set higher capital requirements for banks and bank holding companies whosecircumstances warrant it. For example, holding companies experiencing internal growth or making acquisitions are expected tomaintain strong capital positions substantially above the minimum supervisory levels, without significant reliance on intangible assets.At this time, the bank regulatory agencies are more inclined to impose higher capital requirements to meet well capitalized standardsand future regulatory change could impose higher capital standards as a routine matter. Our regulatory capital ratios and those ofEquity Bank are in excess of the levels established for well capitalized institutions under the Basel III rules.
The Basel III rules also set forth certain changes in the methods of calculating certain risk-weighted assets, which in turn affect thecalculation of risk-based capital ratios. Under the Basel III rules, higher or more sensitive risk weights are assigned to variouscategories of assets, including certain credit facilities that finance the acquisition, development or construction of real property, certainexposures or credits that are 90 days past due or on non-accrual, foreign exposures and certain corporate exposures. In addition, theBasel III rules include (i) alternative standards of credit worthiness consistent with the Dodd-Frank Act, (ii) greater recognition ofcollateral and guarantees and (iii) revised capital treatment for derivatives and repo-style transactions.
In addition, the Basel III rules include certain exemptions to address concerns about the regulatory burden on community banks. Forexample, banking organizations with less than $15 billion in consolidated assets as of December 31, 2009, are permitted to include inTier 1 capital trust preferred securities and cumulative perpetual preferred stock issued and included in Tier 1 capital prior to May 19,2010, on a permanent basis without phase out. Community banks were also permitted to make a one-time election in their March 31,2015, quarterly filings to opt-out of the requirement to include most accumulated other comprehensive income (“AOCI”) componentsin the calculation of CET1 capital and, in effect, retain the AOCI treatment under the prior capital rules. Under the Basel III rules, wemade the one-time, permanent election to continue to exclude AOCI from capital.
In accordance with the Economic Growth, Regulatory Relief and Consumer Protection Act, which was enacted on May 24, 2018, thefederal banking agencies published final rules implementing the community bank leverage ratio in November 2019. Under the finalrules, which went into effect on January 1, 2020, depository institutions and depository institution holding companies that have lessthan $10 billion in total consolidated assets and meet other qualifying criteria, including a leverage ratio of greater than 9%, off-balance-sheet exposures of 25% or less of total consolidated assets and trading assets plus trading liabilities of 5% or less of totalconsolidated assets, are deemed “qualifying community banking organizations” and are eligible to opt into the community bankleverage ratio framework. A qualifying community banking organization that elects to use the community bank leverage ratioframework and that maintains a leverage ratio of greater than 9% is considered to have satisfied the generally applicable risk-basedand leverage capital requirements under the Basel III rules and, if applicable, is considered to have met the “well capitalized” ratiorequirements for purposes of its primary federal regulator’s prompt corrective action rules, discussed below. The final rules include atwo-quarter grace period during which a qualifying community banking organization that temporarily fails to meet any of thequalifying criteria, including the greater-than-9% leverage ratio requirement, is generally still deemed “well capitalized” so long as thebanking organization maintains a leverage ratio greater than 8%. A banking organization that fails to maintain a leverage ratio greaterthan 8% is not permitted to use the grace period and must comply with the generally applicable requirements under the Basel IIICapital rules and file the appropriate regulatory reports. The Company and Equity Bank have not made an election to use thecommunity bank leverage ratio framework but may make such an election in the future if eligible and doing so is advantageous.
17
Imposition of Liability for Undercapitalized Subsidiaries
The Federal Deposit Insurance Corporation Improvement Act of 1991 (“FDICIA”) required each federal banking agency to revise itsrisk-based capital standards to ensure that those standards take adequate account of interest rate risk, concentration of credit risk andthe risks of nontraditional activities, as well as reflect the actual performance and expected risk of loss on multifamily mortgages.
Pursuant to FDICIA, each federal banking agency has specified, by regulation, the levels at which an insured institution would beconsidered well capitalized, adequately capitalized, undercapitalized, significantly undercapitalized and critically undercapitalized. Asof December 31, 2020, Equity Bank exceeded the capital levels required to be deemed well capitalized.
Additionally, FDICIA requires bank regulators to take prompt corrective action to resolve problems associated with insureddepository institutions. Under these prompt corrective action provisions of FDICIA, if a controlled bank is undercapitalized, then theregulators could require the bank to submit a capital restoration plan. If an institution becomes significantly undercapitalized orcritically undercapitalized, additional and significant limitations are placed on the institution. The capital restoration plan of anundercapitalized institution will not be accepted by the regulators unless each company having control of the undercapitalizedinstitution guarantees the subsidiary’s compliance with the capital restoration plan, until it becomes adequately capitalized. We havecontrol of Equity Bank for the purpose of this statute.
Further, by statute and regulation, a bank holding company must serve as a source of financial and managerial strength to each bankthat it controls and, under appropriate circumstances, may be required to commit resources to support each such controlled bank. Thissupport may be required at times when the bank holding company may not have the resources to provide the support. In addition, ifthe Federal Reserve believes that a bank holding company’s activities, assets or affiliates represent a significant risk to the financialsafety, soundness or stability of a controlled bank, then the Federal Reserve could require the bank holding company to terminate theactivities, liquidate the assets or divest the affiliates. The regulators may require these and other actions in support of controlled bankseven if such actions are not in the best interests of the bank holding company or its stockholders.
Acquisitions by Bank Holding Companies
The BHC Act requires every bank holding company to obtain the prior approval of the Federal Reserve before it may acquire all orsubstantially all of the assets of any bank or ownership or control of any voting shares of any bank if after such acquisition it wouldown or control, directly or indirectly, more than 5% of the voting shares of such bank. In approving bank acquisitions by bankholding companies, the Federal Reserve is required to consider the financial and managerial resources and future prospects of the bankholding company and banks concerned, the convenience and needs of the communities to be served, the effect on competition as wellas the financial stability of the United States. The Attorney General of the United States may, within 30 days after approval of anacquisition by the Federal Reserve, bring an action challenging such acquisition under the federal antitrust laws, in which case theeffectiveness of such approval is stayed pending a final ruling by the courts. Under certain circumstances, the 30-day period may beshortened to 15 days.
Control Acquisitions
The Change in Bank Control Act (“CBCA”) prohibits a person or group of persons from acquiring “control” of a bank holdingcompany unless the Federal Reserve has been notified and has not objected to the transaction. Under a rebuttable presumptionestablished by the Federal Reserve, the acquisition of 10% or more of a class of voting stock of a bank holding company with a classof securities registered under Section 12 of the Exchange Act, such as ourselves, would, under the circumstances set forth in thepresumption, constitute acquisition of control of us.
In addition, the BHC Act prohibits any entity from acquiring 25%, or more (the BHC Act has a lower limit for acquirers that areexisting bank holding companies), of a bank holding company’s or bank’s voting securities, or otherwise obtaining control or thepower to exercise a “controlling influence” over a bank holding company or bank, without the prior approval of the Federal Reserve.On January 30, 2020, the Board of Governors of the Federal Reserve System adopted a final rule revising the Federal Reserve’sregulations related to determinations of whether a company has the ability to exercise a controlling influence over another company,including a bank holding company or a bank, for purposes of the BHC Act. The final rule establishes a comprehensive frameworkthat employs several factors to determine if a company has control over another company, including the first company’s total votingand non-voting equity investment in the second company; director, officer and employee overlaps between the first company and thesecond company; and the scope of business relationships between the first company and the second company. The final rule went intoeffect on April 1, 2020.
Interstate Branching
The Dodd-Frank Act permits a national or state bank, with the approval of its regulator, to open a branch in any state if the law of thestate in which the branch is located would permit the establishment of the branch if the bank were a bank chartered in that state.
18
Anti-Tying Restrictions
Bank holding companies and their affiliates are prohibited from tying the provision of certain services, such as extensions of credit, toother services offered by a holding company or its affiliates.
Bank Regulation
Equity Bank operates under a Kansas state bank charter and is subject to regulation by the OSBC and the Federal Reserve. The OSBCand the Federal Reserve regulate or monitor all areas of Equity Bank’s operations, including capital requirements, issuance of stock,declaration of dividends, interest rates, deposits, loans, investments, borrowings, record keeping, establishment of branches,acquisitions, mergers, information technology and employee responsibility and conduct. The OSBC places limitations on activities ofEquity Bank, including the issuance of capital notes or debentures and the holding of real estate and personal property and requiresEquity Bank to maintain a certain ratio of reserves against deposits. The OSBC requires Equity Bank to file a report annually, inaddition to any periodic report requested.
The Federal Reserve and the OSBC regularly examine Equity Bank and its records. The FDIC may also periodically examine andevaluate insured banks.
Standards for Safety and Soundness
As part of FDICIA’s efforts to promote the safety and soundness of depository institutions and their holding companies, appropriatefederal banking regulators are required to have in place regulations specifying operational and management standards (addressinginternal controls, loan documentation, credit underwriting and interest rate risk), asset quality and earnings. As discussed above, theFederal Reserve and the FDIC have extensive authority to police unsafe or unsound practices and violations of applicable laws andregulations by depository institutions and their holding companies. For example, the FDIC may terminate the deposit insurance of anyinstitution that it determines has engaged in an unsafe or unsound practice. The agencies can also assess civil money penalties of up to$1 million per day, issue cease-and-desist or removal orders, seek injunctions and publicly disclose such actions.
The ability of Equity Bank, as a Kansas state bank, to pay dividends is restricted under the Kansas Banking Code. Pursuant to theKansas Banking Code, a Kansas state bank may declare and pay a dividend out of undivided profits after deducting losses to theholders of record of the stock outstanding on the date the dividend is declared. However, prior to the declaration of any dividend, aKansas state bank must transfer 25% of its net profits since the last preceding dividend to its surplus fund until the surplus fund isequal to its total capital stock. In addition, no dividend may be declared without the approval of the OSBC, if such dividend wouldreduce the surplus fund to an amount less than 30% of the resulting total capital of the bank.
Equity Bank is also subject to certain restrictions on the payment of dividends as a result of the requirement that it maintain anadequate level of capital in accordance with guidelines promulgated from time to time by the federal regulators.
The present and future dividend policy of Equity Bank is subject to the discretion of its boards of directors. In determining whether topay dividends to us and, if paid, the amount of the dividends, the board of directors of Equity Bank considers many of the same factorsdiscussed above. Equity Bank cannot guarantee that it will have the financial ability to pay dividends to us, or if dividends are paid,that they will be sufficient for us to make distributions to our stockholders. Equity Bank is not obligated to pay dividends.
Insider Transactions
A bank is subject to certain restrictions on extensions of credit to insiders of the bank or of any affiliate. Insiders include executiveofficers, directors, certain principal stockholders and their related interests. Extensions of credit include derivative transactions,repurchase and reverse repurchase agreements and securities borrowing and lending transactions to the extent that such transactionscause a bank to have credit exposure to an insider. Any extension of credit to an insider must:
• Be made on substantially the same terms, including interest rates and collateral, as those prevailing at the time forcomparable transactions with third parties; and
• Involve no more than the normal risk of repayment or present other unfavorable features.
For loans above certain threshold amounts, board approval is required, and the interested insider may not be involved. In addition, abank may purchase an asset from or sell an asset to an insider only if the transaction is on market terms and, if representing more than10% of capital, is approved in advance by the majority of disinterested directors.
Additional and more stringent limits apply to a bank’s transactions with its own executive officers and certain directors. These limitsdo not apply to transactions with all directors or to insiders of the bank’s affiliates.
19
Restrictions on Transactions with Affiliates
Section 23A of the Federal Reserve Act imposes quantitative and qualitative limits on transactions between a bank and any affiliateand requires certain levels of collateral for any such loans. It also limits the amount of advances to third parties which arecollateralized by the securities or obligations of a holding company. Section 23B of the Federal Reserve Act requires that certaintransactions between Equity Bank and its affiliates must be on terms substantially the same, or at least as favorable, as those prevailingat the time for comparable transactions with or involving other nonaffiliated companies. In the absence of such comparabletransactions, any transaction between Equity Bank and its affiliates must be on terms and under circumstances, including creditstandards, which in good faith would be offered to or would apply to nonaffiliated companies.
Capital Adequacy
In addition to the capital rules applicable to both banks and bank holding companies discussed above, under the prompt correctiveaction regulations, the federal bank regulators are required and authorized to take supervisory actions against undercapitalized banks.For this purpose, a bank is placed in one of the following five categories based on the bank’s capital:
• well capitalized (at least 5% leverage ratio, 6.5% CET1 risk-based capital ratio, 8% Tier 1 risk-based capital ratio and10% total risk-based capital ratio);
• adequately capitalized (at least 4% leverage ratio, 4.5% CET1 risk-based capital ratio, 6% Tier 1 risk-based capital ratioand 8% total risk-based capital ratio);
• undercapitalized (less than 4% leverage ratio, 4.5% CET1 risk-based capital ratio, 6% Tier 1 risk-based capital ratio or 8%total risk-based capital ratio);
• significantly undercapitalized (less than 3% leverage ratio, 3% CET1 risk-based capital ratio, 4% Tier 1 risk-based capitalratio or 6% total risk-based capital ratio); and
• critically undercapitalized (less than 2% tangible capital to total assets).
Federal banking regulators are required to take various mandatory supervisory actions and are authorized to take other discretionaryactions with respect to institutions in the three undercapitalized categories. The severity of the action depends upon the capitalcategory in which the institution is placed. The regulators have the discretion to downgrade a bank from one category to a lowercategory. Generally, subject to a narrow exception, banking regulators must appoint a receiver or conservator for an institution that is“critically undercapitalized.” An institution that is categorized as “undercapitalized,” “significantly undercapitalized,” or “criticallyundercapitalized” is required to submit an acceptable capital restoration plan to its appropriate federal banking agency.
Failure to meet capital guidelines could subject Equity Bank to a variety of enforcement remedies, including issuance of a capitaldirective, the termination of deposit insurance by the FDIC, a prohibition on accepting brokered deposits and other restrictions on ourbusiness.
As of December 31, 2020, Equity Bank exceeded the capital levels required to be deemed well capitalized.
Deposit Insurance
The FDIC insures the deposits of federally insured banks up to prescribed statutory limits for each depositor, through the DepositInsurance Fund (“DIF”) and safeguards the safety and soundness of the banking and thrift industries. The Dodd-Frank Actpermanently raised the standard maximum deposit insurance amount to $250,000. The amount of FDIC assessments paid by eachinsured depository institution is based on its relative risk of default as measured by financial ratios and supervisory factors derivedfrom a statistical model that estimates a bank’s probability of failure within three years.
In connection with the Dodd Frank Act’s requirement that insurance assessments be based on assets, the FDIC has redefined itsdeposit insurance premium assessment base to be an institution’s average consolidated total assets minus average tangible equity. TheFDIC also has revised its deposit insurance assessment rate schedule in light of this change to the assessment base. The revised rateschedule and other revisions to the assessment rules became effective July 1, 2016.
We are generally unable to control the amount of premiums that we are required to pay for FDIC insurance. At least semi-annually,the FDIC will update its loss and income projections for the DIF and, if needed, will increase or decrease assessment rates, followingnotice-and-comment rulemaking, if required. If there are additional bank or financial institution failures or if the FDIC otherwisedetermines to increase assessment rates, Equity Bank may be required to pay higher FDIC insurance premiums. Any future increasesin FDIC insurance premiums may have a material and adverse effect on our earnings.
20
Consumer Financial Protection Bureau
The Dodd-Frank Act created the CFPB which is granted broad rulemaking, supervisory and enforcement powers under various federalconsumer financial protection laws, including the Equal Credit Opportunity Act, Truth in Lending Act, Real Estate SettlementProcedures Act, Fair Credit Reporting Act, Fair Debt Collection Act, the Consumer Financial Privacy provisions of the Gramm-Leach-Bliley Act and certain other statutes. The CFPB has examination and primary enforcement authority with respect to depositoryinstitutions with $10 billion or more in assets. Depository institutions with less than $10 billion in assets, such as Equity Bank, aresubject to rules promulgated by the CFPB, which may increase their compliance risk and the costs associated with their complianceefforts, but such banks will continue to be examined and supervised by federal banking regulators for consumer compliance purposes.The CFPB has authority to prevent unfair, deceptive or abusive practices in connection with the offering of consumer financialproducts.
The Dodd-Frank Act authorizes the CFPB to establish certain minimum standards for the origination of residential mortgages,including a determination of the borrower’s ability to repay. In addition, the Dodd-Frank Act allows borrowers to raise certaindefenses to foreclosure if they receive any loan other than a “qualified mortgage” as defined by the CFPB.
The CFPB has issued a number of regulations related to the origination of mortgages, foreclosure and overdrafts as well as many otherconsumer issues. Additionally, the CFPB has proposed, or will be proposing, additional regulations on issues that directly relate toour business. Although it is difficult to predict at this time the extent to which the CFPB’s final rules impact the operations andfinancial condition of Equity Bank, such rules may have a material impact on Equity Bank’s compliance costs, compliance risk andfee income.
Privacy
Under the Right to Financial Privacy Act, which imposes a duty to maintain confidentiality of consumer financial records andprescribes procedures for complying with administrative subpoenas of financial records, financial institutions are required to disclosetheir policies for collecting and protecting confidential information. Customers generally may prevent financial institutions fromsharing personal financial information with nonaffiliated third parties except for third parties that market the institutions’ ownproducts and services. Additionally, financial institutions generally may not disclose consumer account numbers to any nonaffiliatedthird party for use in telemarketing, direct mail marketing or other marketing through electronic mail to consumers.
Recent cyber-attacks against bank and other institutions that resulted in unauthorized access to confidential customer information haveprompted the federal banking agencies to issue extensive guidance on cyber security. The regulatory agencies may devote moreresources to this part of their safety and soundness examination than they may have in the past.
Like other lending institutions, our subsidiary bank uses credit bureau data in its underwriting activities. Use of that data is regulatedunder the Federal Credit Reporting Act on a uniform, nationwide basis. The act and its implementing regulation, Regulation V, covercredit reporting, prescreening, sharing of information between affiliates and the use of credit data. The Fair and Accurate CreditTransactions Act of 2003 allows states to enact identity theft laws that are not inconsistent with the conduct required by the provisionsof the act.
The Patriot Act, International Money Laundering Abatement and Financial Anti-Terrorism Act and Bank Secrecy Act
A major focus of governmental policy on financial institutions has been aimed at combating money laundering and terrorist financing.The Patriot Act and the International Money Laundering and Financial Anti-Terrorism Act of 2001 substantially broadened the scopeof U.S. anti-money laundering laws and penalties, specifically related to the Bank Secrecy Act and expanded the extra-territorialjurisdiction of the United States. The U.S. Treasury has issued a number of implementing regulations that apply various requirementsof the Patriot Act to financial institutions, such as Equity Bank. These regulations impose obligations on financial institutions tomaintain appropriate policies, procedures and controls to detect, prevent and report money laundering and terrorist financing and toverify the identity of their customers.
Failure of a financial institution and its holding company to maintain and implement adequate programs to combat money launderingand terrorist financing, or to comply with relevant laws and regulations, could have serious legal, reputational and financialconsequences for the institution. Because of the significance of regulatory emphasis on these requirements, Equity Bank will continueto expend significant staffing, technology and financial resources to maintain programs designed to ensure compliance with applicablelaws and regulations and an effective audit function for testing of Equity Bank’s compliance with the Bank Secrecy Act, on anongoing basis.
21
Community Reinvestment Act
The CRA requires that, in connection with examinations of financial institutions within its jurisdiction, the federal and the statebanking regulators, as applicable, evaluate the record of each financial institution in meeting the credit needs of its local community,including low and moderate-income neighborhoods. These facts are also considered in evaluating mergers, acquisitions andapplications to open a branch or facility. Failure to adequately meet these criteria could impose additional requirements andlimitations on us. Additionally, we must publicly disclose the terms of various CRA-related agreements.
Other Regulations
Interest and other charges that Equity Bank collects or contracts for are subject to state usury laws and federal laws concerning interestrates. Equity Bank’s loan operations are also subject to federal laws applicable to credit transactions, such as:
• the Federal Truth-In-Lending Act, governing disclosures of credit terms to consumer borrowers;
• the Home Mortgage Disclosure Act, requiring financial institutions to provide information to enable the public and publicofficials to determine whether a financial institution is fulfilling its obligation to help meet the housing needs of thecommunity it serves;
• the Equal Credit Opportunity Act, prohibiting discrimination on the basis of race, creed or other prohibited factors inextending credit;
• the Fair Credit Reporting Act, governing the use and provision of information to credit reporting agencies;
• the Fair Debt Collection Act, governing the manner in which consumer debts may be collected by collection agencies; and
• the rules and regulations of the various governmental agencies charged with the responsibility of implementing thesefederal laws.
In addition, Equity Bank’s deposit operations are subject to the Electronic Funds Transfer Act and Regulation E issued by the FederalReserve to implement such act, which govern automatic deposits to and withdrawals from deposit accounts and customers’ rights andliabilities arising from the use of automated teller machines and other electronic banking services.
Concentrated Commercial Real Estate Lending Regulations
The Federal Reserve and other federal banking regulatory agencies have promulgated guidance governing financial institutions withconcentrations in commercial real estate lending. The guidance provides that a bank may be exposed to heightened commercial realestate lending concentration risk and subject to further supervisory analysis if (i) total reported loans for construction, landdevelopment and other land represent 100% or more of total capital or (ii) total reported loans secured by multifamily residentialproperties, non-farm non-residential properties and loans for construction, land development and other land, together with loans tofinance commercial real estate, construction and land development activities that are not secured by real estate, represent 300% ormore of total capital and the bank’s commercial real estate loan portfolio has increased 50% or more during the prior 36 months. If aconcentration is present, management is expected to employ heightened risk management practices including board and managementoversight and strategic planning, development of underwriting standards, risk assessment and monitoring through market analysis andstress testing and increasing capital requirements.
Effect of Governmental Monetary Policies
The commercial banking business is affected not only by general economic conditions but also by both U.S. fiscal policy and themonetary policies of the Federal Reserve. Some of the instruments of fiscal and monetary policy available to the Federal Reserveinclude changes in the discount rate on member bank borrowings, the fluctuating availability of borrowings at the “discount window,”open market operations, the imposition of and changes in reserve requirements against member banks’ deposits and assets of foreignbranches, the imposition of and changes in reserve requirements against certain borrowings by banks and their affiliates and theplacing of limits on interest rates that member banks may pay on time and savings deposits. Such policies influence, to a significantextent, the overall growth of bank loans, investments and deposits and the interest rates charged on loans or paid on time and savingsdeposits. We cannot predict the nature of future fiscal and monetary policies and the effect of such policies on the future business andour earnings.
22
Item 1A: Risk Factors
Our business and results of operations are subject to numerous risks and uncertainties, many of which are beyond our control. Thematerial risks and uncertainties that management believes affect the Company are described below. Additional risks and uncertaintiesthat management is not aware of, or that management currently deems immaterial, may also impair the Company’s businessoperations. This report is qualified in its entirety by these risk factors. If any of the following risks actually occur, our business,financial condition and results of operations could be materially and adversely affected. If this were to happen, the value of oursecurities could decline significantly, and you could lose all or part of your investment. Some statements in the following risk factorsconstitute forward-looking statements. Please refer to “Cautionary Note Regarding Forward-Looking Statements” elsewhere in thisAnnual Report on Form 10-K.
Summary of Risk Factors
Our risk factors can be broadly summarized by the following categories:
• Economic Risks• Credit and Interest Rate Risks• Strategic Risks• Risks Relating to the Regulation of Our Industry• Risks Relating to the Company’s Common Stock• General Risks
While not an exhaustive list, our risk factors are generally composed of the following items:
• a change in economic conditions or a return to recessionary conditions could result in increases in our level of nonperformingloans and/or reduced demand for our products and services;
• the value of real estate collateral may fluctuate significantly resulting in an under-collateralized loan portfolio;• external economic factors, such as changes in monetary policy and inflation and deflation, may have an adverse effect on our
business, financial condition and results of operations;• inability to effectively manage or adequately measure credit risk;• we could suffer losses from a decline in the credit quality of the assets that we hold;• a significant portion of our loan portfolio is secured by real estate, and events that negatively impact the real estate market
could negatively impact our business;• a large portion of our loan portfolio is comprised of commercial loans that are secured by accounts receivable, inventory,
equipment or other asset-based collateral, and deterioration in the value of such collateral could increase our exposure tofuture probable losses;
• our largest lending relationships currently make up a material percentage of our total loan portfolio;• a new accounting standard will result in a significant change in how we recognize credit losses and may have a material
impact on our financial condition or results of operations;• our profitability is vulnerable to interest rate fluctuations;• market interest rates for loans, investments and deposits are highly sensitive to many factors beyond our control;• we may be adversely impacted by the transition from LIBOR as a reference rate;• the outbreak of COVID-19, or other epidemic, pandemic or highly contagious disease occurring in the United States or in the
geographies in which we conduct operations;• our financial performance will be negatively impacted if we are unable to execute our growth strategy;• our strategy of pursuing acquisitions exposes us to financial, execution, compliance and operational risks;• acquisitions may disrupt our business, dilute stockholder value and be costly to integrate;• we rely heavily on our management team and could be adversely affected by the unexpected loss of key officers;• our business is concentrated in, and largely dependent upon, the continued growth and welfare of the general geographic
markets in which we operate;• our ability to grow our loan portfolio may be limited;• our future profitability levels are dependent on our ability to grow and maintain deposits at competitive costs;• our ability to retain bankers and recruit additional successful bankers is critical to the success of our business strategy;• a lack of liquidity could adversely affect our financial condition and results of operations;

23
• our financial projections are based upon numerous assumptions about future events and our actual financial performance maydiffer materially from our projections if our assumptions are inaccurate;
• we continually encounter technological change and may have fewer resources than our competitors;• our information systems may experience a failure or interruption;• we use information technology in our operations and offer online banking services to our customers, and unauthorized access
to our or our customers’ confidential or proprietary information as a result of a cyber-attack or otherwise;• we are dependent upon outside third parties for the processing and handling of our records and data;• if our enterprise risk management framework is not effective at mitigating risk and loss to us;• changes in accounting standards could materially impact our financial statements;• if the goodwill that we have recorded or may record in connection with a business acquisition becomes impaired, it could
require charges to earnings, which would adversely affect our business, financial condition and results of operations;• we may be required to repurchase mortgage loans or indemnify buyers against losses in some circumstances, which could
harm liquidity, results of operations and financial condition;• we are subject to extensive regulations in the conduct of our business, which imposes additional costs on us;• changes in laws, government regulation and monetary policy may have a material effect on our results of operations;• our banking subsidiary may be required to pay higher FDIC insurance premiums or special assessments;• we are subject to certain capital requirements by regulators;• we are subject to stringent capital requirements, which may adversely impact our return on equity or constrain us from paying
dividends or repurchasing shares;• we may need to raise additional capital in the future and the capital may not be available when it is needed or may be dilutive
to stockholders;• we are subject to the Bank Secrecy Act and other anti-money laundering statutes and regulations, and any deemed deficiency
by us with respect to these laws could result in significant liability;• the laws that regulate our operations are designed for the protection of depositors and the public, not our stockholders;• as a bank holding company, the sources of funds available to us are limited;• the market price of our Class A common stock may be subject to substantial fluctuations which may make it difficult for you
to sell your shares at the volumes, prices and times desired;• the obligations associated with being a public company requires significant resources and management attention;• we have not historically declared or paid cash dividends on our common stock and we do not expect to pay dividends on our
common stock in the foreseeable future;• securities analysts may not initiate or continue coverage on our Class A common stock, which could adversely affect the
market for our Class A common stock;• use of our common stock for future acquisitions or to raise capital may be dilutive to existing stockholders;• a future issuance of stock could dilute the value of our Class A common stock;• we have significant institutional investors whose interests may differ from yours;• our directors and executive officers beneficially own a significant portion of our Class A common stock and have substantial
influence over us;• shares of our Class A common stock are not insured deposits and may lose value;• we have the ability to incur debt and pledge our assets, including our stock in Equity Bank, to secure that debt, and holders of
any such debt obligations will generally have priority over holders of our Class A common stock with respect to certainpayment obligations;
• if we fail to maintain an effective system of disclosure controls and procedures and internal control over financial reporting,we may not be able to accurately report our financial results or prevent fraud;
• our board of directors may issue shares of preferred stock that would adversely affect the rights of our Class A commonstockholders;
• the return on your investment in our Class A common stock is uncertain;• we operate in a highly competitive industry and face significant competition from other banking organizations;• as a community bank, our ability to maintain our reputation is critical to the success of our business, and the failure to do so
may materially adversely affect our performance;• we are subject to environmental risk in our lending activities;• we are subject to claims and litigation pertaining to intellectual property;• we have pledged all of the stock of Equity Bank as collateral for a loan, and if the lender forecloses, you could lose your
investment; and• we have outstanding subordinated debt obligations, and if the Company defaults on those obligations, the debt holders could
lose their investment.
24
The foregoing factors should not be construed as exhaustive. This summary of risk factors should be read in conjunction with themore detailed risk factors below.
Economic Risks
Recessionary conditions could result in increases in our level of nonperforming loans and/or reduced demand for ourproducts and services, which could have an adverse effect on our results of operations.
Economic recession or other economic problems, including those affecting our markets and regions, but also those affecting the U.S.or world economies, could have a material adverse impact on the demand for our products and services. If economic conditionsdeteriorate, or if there are negative developments affecting the domestic and international credit markets, the value of our loans andinvestments may be harmed, which in turn would have an adverse effect on our financial performance and our financial condition maybe adversely affected. In addition, although deteriorating market conditions could adversely affect our financial condition, results ofoperations and cash flows, we may not benefit from any market growth or favorable economic conditions, either in our primarymarket areas or nationally, even if they do occur.
Changes in economic conditions could cause an increase in delinquencies and nonperforming assets, including loan charge-offs, which could depress our net income and growth.
Our loan portfolio includes many real estate secured loans, demand for which may decrease during economic downturns as aresult of, among other things, an increase in unemployment, a decrease in real estate values and a slowdown in housing. If we seenegative economic conditions develop in the United States as a whole or our Arkansas, Kansas, Missouri and Oklahoma markets, wecould experience higher delinquencies and loan charge-offs, which would reduce our net income and adversely affect our financialcondition. Furthermore, to the extent that real estate collateral is obtained through foreclosure, the costs of holding and marketing thereal estate collateral, as well as the ultimate values obtained from disposition, could reduce our earnings and adversely affect ourfinancial condition.
The value of real estate collateral may fluctuate significantly resulting in an under-collateralized loan portfolio.
The market value of real estate, particularly real estate held for investment, can fluctuate significantly in a short period of timeas a result of market conditions in the geographic area in which the real estate is located. If the value of the real estate serving ascollateral for our loan portfolio were to decline materially, a significant part of our loan portfolio could become under-collateralized.If the loans that are collateralized by real estate become troubled during a time when market conditions are declining or have declined,then, in the event of foreclosure, we may not be able to realize the amount of collateral that we anticipated at the time of originatingthe loan. This could have a material adverse effect on our provision for loan losses and our operating results and financial condition.
External economic factors, such as changes in monetary policy and inflation and deflation, may have an adverse effect onour business, financial condition and results of operations.
Our financial condition and results of operations are affected by credit policies of monetary authorities, particularly the Board ofGovernors of the Federal Reserve System or the Federal Reserve. Actions by monetary and fiscal authorities, including the FederalReserve, could lead to inflation, deflation or other economic phenomena that could adversely affect our financial performance. Theprimary impact of inflation on our operations most likely will be reflected in increased operating costs. Conversely, deflationgenerally will tend to erode collateral values and diminish loan quality. Virtually all of our assets and liabilities are monetary innature. As a result, interest rates have a more significant impact on our performance than general levels of inflation or deflation.Interest rates do not necessarily move in the same direction or by the same magnitude as the prices of goods and services.
Volatility in commodity prices may adversely affect our financial condition and results of operations.
In addition to the geographic concentration of our markets, certain industry-specific economic factors also affect us. Forexample, while we do not have a concentration in energy lending, the industry is cyclical and recently has experienced a significantdrop in crude oil and natural gas prices. In addition, we make loans to customers involved in the agricultural industry, many of whomare also impacted by fluctuations in commodity prices. Volatility in commodity prices could adversely impact the ability of borrowersin these industries to perform under the terms of their borrowing arrangements with us and, as a result, a severe and prolonged declinein commodity prices may adversely affect our financial condition and results of operations. It is also difficult to project futurecommodity prices as they are dependent upon many different factors beyond our control.
25
Credit and Interest Rate Risks
Inability to effectively manage credit risk.
As a lender, we are exposed to the risk that our loan customers may not repay their loans according to the terms of these loansand the collateral securing the payment of these loans may be insufficient to fully compensate us for the outstanding balance of theloan plus the costs to dispose of the collateral. We may experience significant loan losses, which could have a material adverse effecton our operating results and financial condition. Management makes various assumptions and judgments about the collectability ofour loan portfolio, including the diversification by industry of our commercial loan portfolio, the amount of nonperforming loans andrelated collateral, the volume, growth and composition of our loan portfolio, the effects on the loan portfolio of current economicindicators and their probable impact on borrowers and the evaluation of our loan portfolio through our internal loan review processand other relevant factors.
We maintain an allowance for loan losses, which is an allowance established through a provision for loan losses charged toexpense that represents management’s best estimate of probable incurred losses in our loan portfolio. Additional credit losses willlikely occur in the future and may occur at a rate greater than we have experienced to date. In determining the amount of theallowance, we rely on an analysis of our loan portfolio, our experience and our evaluation of general economic conditions. If ourassumptions, including our qualitative factors or the implementation of ASC Topic 326 Current Expected Credit Loss (“CECL”) in2021 and for future periods, prove to be incorrect, our current allowance may not be sufficient and adjustments may be necessary toallow for different economic conditions or adverse developments in our loan portfolio. In addition, as an acquirer of other banks, ourallowance for loan losses may not be sufficient when coupled with purchase discounts on acquired portfolios. Material additions tothe allowance could materially decrease our net income.
In addition, banking regulators periodically review our allowance for loan losses and may require us to increase our provisionfor loan losses or recognize further charge-offs, based on judgments different than those of our management. Any increase in ourallowance for loan losses or charge-offs as required by these regulatory agencies could have a material negative effect on ouroperating results, financial condition and liquidity.
We could suffer losses from a decline in the credit quality of the assets that we hold.
We could sustain losses if borrowers, guarantors, and related parties fail to perform in accordance with the terms of their loans.We have adopted underwriting and credit monitoring procedures and policies that we believe are appropriate to minimize this risk,including the establishment and review of the allowance for credit losses, periodic assessment of the likelihood of nonperformance,tracking loan performance and diversifying our credit portfolio. These policies and procedures, however, may not prevent unexpectedlosses that could have a material adverse effect on our financial condition and results of operations. In particular, we face creditquality risks presented by past, current and potential economic and real estate market conditions.
A significant portion of our loan portfolio is secured by real estate, and events that negatively impact the real estate marketcould negatively impact our business.
There are significant risks associated with real estate-based lending. Real estate collateral may deteriorate in value during thetime that credit is extended, in which case we might not be able to sell such collateral for an amount necessary to satisfy a defaultingborrower’s obligation to us. In that event, there could be a material adverse effect on our financial condition and results of operations.Additionally, commercial real estate loans are subject to unique risks. These types of loans are often viewed as having more risks thanresidential real estate or other consumer loans, primarily because relatively large amounts are loans to a relatively small number ofborrowers. Thus, the deterioration of even a small number of these loans could cause a significant increase in the loan loss allowanceor loan charge-offs, which in turn could have a material adverse effect on our financial condition and results of operations.Furthermore, commercial real estate loans depend on cash flows from the property securing the debt. Cash flows may be affectedsignificantly by general economic conditions and a downturn in a local economy in one of our markets or in occupancy rates where aproperty is located could increase the likelihood of default.
The foregoing risks are enhanced as a result of the limited geographic scope of our principal markets. Most of the real estatesecuring our loans is located in our Arkansas, Kansas, Missouri and Oklahoma markets. Because the value of this collateral dependsupon local real estate market conditions and is affected by, among other things, neighborhood characteristics, real estate tax rates, thecost of operating the properties and local governmental regulation, adverse changes in any of these factors in our markets could causea decline in the value of the collateral securing a significant portion of our loan portfolio. Further, the concentration of real estatecollateral in these four markets limits our ability to diversify the risk of such occurrences.

26
A large portion of our loan portfolio is comprised of commercial loans that are secured by accounts receivable, inventory,equipment or other asset-based collateral, and deterioration in the value of such collateral could increase our exposure to futureprobable losses.
These commercial loans are typically larger in amount than loans to individuals and therefore, have the potential for largerlosses on a single loan basis. Additionally, asset-based borrowers are often highly leveraged and have inconsistent historical earningsand cash flows. Historically, losses in our commercial credits have been higher than losses in other classes of our loan portfolio.Significant adverse changes in our borrowers’ industries and businesses could cause rapid declines in values of, and collectabilityassociated with, those business assets, which could result in inadequate collateral coverage for our commercial loans and expose us tofuture losses. An increase in specific reserves and charge-offs related to our commercial loan portfolio could have a material adverseeffect on our business, financial condition, results of operations and future prospects.
Our use of appraisals in deciding whether to make a loan secured by real property does not ensure the value of the realproperty collateral.
In considering whether to make a loan secured by real property, we generally require an appraisal. However, an appraisal isonly an estimate of the value of the property at the time the appraisal is made. If the appraisal does not reflect the amount that may beobtained upon any sale or foreclosure of the property, we may not realize an amount equal to the indebtedness secured by the property.
A portion of our loan portfolio is comprised of participation and syndicated transaction interests, which could have anadverse effect on our ability to monitor the lending relationships and lead to an increased risk of loss.
We participate in loans originated by other institutions and in syndicated transactions (including shared national credits) inwhich other lenders serve as the agent bank. Our reduced control over the monitoring and management of these relationships,particularly participations in large bank groups, could lead to increased risk of loss, which could have a material adverse effect on ourbusiness, financial condition, results of operations and future prospects.
Our largest loan relationships currently make up a material percentage of our total loan portfolio.
As of December 31, 2020, our ten largest loan relationships totaled over $241.3 million in loan exposure, or 9.3% of the totalloan portfolio. The concentration risk associated with having a small number of large loan relationships is that, if one or more of theserelationships were to become delinquent or suffer default, we could be at serious risk of material losses. The allowance for loan lossesmay not be adequate to cover losses associated with any of these relationships and any loss or increase in the allowance wouldnegatively affect our earnings and capital. Even if the loans are collateralized, the large increase in classified assets could harm ourreputation with our regulators, investors and potential investors and inhibit our ability to execute our business plan.
We may not be able to adequately measure and limit the credit risk associated with our loan portfolio, which could adverselyaffect our profitability.
As a part of the products and services that we offer, we make commercial and commercial real estate loans. The principaleconomic risk associated with each class of loans is the creditworthiness of the borrower, which is affected by the strength of therelevant business market segment, local market conditions and general economic conditions. Additional factors related to the creditquality of commercial loans include the quality of the management of the business and the borrower’s ability both to properly evaluatechanges in the supply and demand characteristics affecting our market for products and services and to effectively respond to thosechanges. Additional factors related to the credit quality of commercial real estate loans include tenant vacancy rates and the quality ofmanagement of the property. A failure to effectively measure and limit the credit risk associated with our loan portfolio could have anadverse effect on our business, financial condition and results of operations.
We could be adversely affected by the soundness of other financial institutions.
Financial services institutions are interrelated as a result of trading, clearing, counterparty or other relationships. We haveexposure to many different industries and counterparties, and routinely execute transactions with counterparties in the financialservices industry, including commercial banks, brokers and dealers, investment banks and other institutional clients. Many of thesetransactions expose us to credit risk in the event of a default by a counterparty or client. In addition, our credit risk may beexacerbated when our collateral cannot be foreclosed upon or is liquidated at prices not sufficient to recover the full amount of thecredit or derivative exposure due. Any such losses could adversely affect our business, financial condition and results of operations.
27
A new accounting standard will result in a significant change in how we recognize credit losses and may have a materialimpact on our financial condition or results of operations.
In June 2016, the Financial Accounting Standards Board (“FASB”) issued an accounting standard update, “FinancialInstruments-Credit Losses (Topic 326), Measurement of Credit Losses on Financial Instruments,” which replaces the current “incurredloss” model for recognizing credit losses with an “expected loss” model referred to as the Current Expected Credit Loss (“CECL”)model. Under the CECL model, we will be required to present certain financial assets carried at amortized cost, such as loans held forinvestment and held-to-maturity debt securities, at the net amount expected to be collected. The measurement of expected creditlosses is to be based on information about past events, including historical experience, current conditions and reasonable andsupportable forecasts that affect the collectability of the reported amount. This measurement will take place at the time the financialasset is first added to the balance sheet and periodically thereafter. This differs significantly from the “incurred loss” model requiredunder current general accepted accounting principles (“GAAP”), which delays recognition until it is probable a loss has been incurred.Accordingly, we expect that the adoption of the CECL model will materially affect how we determine our allowance for loan lossesand could require us to significantly increase our allowance. Moreover, the CECL model may create more volatility in the level of ourallowance for loan losses. If we are required to materially increase our level of allowance for loan losses for any reason, such increasecould adversely affect our business, financial condition and results of operations.
The new CECL standard will become effective for us on January 1, 2021, and for interim periods beginning March 31, 2021.For additional information about the Company’s adoption of CECL and the projected impact from adoption see “NOTE 1 – NATUREOF OPERATIONS AND SUMMARY OF SIGNIFICANT ACCOUNTING POLICIES” in Notes to Consolidated FinancialStatements and “Item 7 – Management’s Discussion and Analysis of Financial Condition and Results of Operations – FinancialCondition – Allowance for loan losses”.
Our profitability is vulnerable to interest rate fluctuations.
Our profitability depends substantially upon our net interest income. Net interest income is the difference between the interestearned on assets (such as loans and securities held in our investment portfolio) and the interest paid for liabilities (such as interest paidon savings and money market accounts and time deposits). Income associated with interest-earning assets and costs associated withinterest-bearing liabilities may not be affected uniformly by fluctuations in interest rates. The magnitude and duration of changes ininterest rates are events over which we have no control and such changes may have an adverse effect on our net interest income.Prepayment and early withdrawal levels, which are also impacted by changes in interest rates, can significantly affect our assets andliabilities. For example, an increase in interest rates could, among other things, reduce the demand for loans and decrease loanrepayment rates. Such an increase could also adversely affect the ability of our floating-rate borrowers to meet their higher paymentobligations, which could in turn lead to an increase in nonperforming assets and net charge-offs. Conversely, a decrease in the generallevel of interest rates could affect us by, among other things, leading to greater competition for deposits and incentivizing borrowers toprepay or refinance their loans more quickly or frequently than they otherwise would. The primary tool that management uses tomeasure interest rate risk is a simulation model that evaluates the impact of varying levels of prevailing interest rates and the impacton net interest income and the economic value of equity. Generally, the interest rates on our interest-earning assets and interest-bearing liabilities do not change at the same rate, to the same extent or on the same basis. Even assets and liabilities with similarmaturities or re-pricing periods may react in different degrees to changes in market interest rates. Interest rates on certain types ofassets and liabilities may fluctuate in advance of changes in general market interest rates, while interest rates on other types of assetsand liabilities may lag behind changes in general market rates. Certain assets, such as fixed and adjustable rate mortgage loans, havefeatures that limit changes in interest rates on a short-term basis and over the life of the asset. Changes in interest rates couldmaterially and adversely affect our financial condition and results of operations. See “Item 7A – Quantitative and QualitativeDisclosure About Market Risk” for a discussion of interest rate risk modeling and the inherent risks in modeling assumptions.
Market interest rates for loans, investments and deposits are highly sensitive to many factors beyond our control.
Generally, interest rate spreads (the difference between interest rates earned on assets and interest rates paid on liabilities) havenarrowed in recent years as a result of changing market conditions, policies of various government and regulatory authorities andcompetitive pricing pressures and we cannot predict whether these rate spreads will narrow even further. This narrowing of interestrate spreads could adversely affect our financial condition and results of operations. In addition, we cannot predict whether interestrates will continue to remain at present levels. Changes in interest rates may cause significant changes, up or down, in our net interestincome.
We attempt to minimize the adverse effects of changes in interest rates by structuring our asset-liability composition in order toobtain the maximum spread between interest income and interest expense. However, there can be no assurance that we will besuccessful in minimizing the adverse effects of changes in interest rates. Depending on our portfolio of loans and investments, ourfinancial condition and results of operations may be adversely affected by changes in interest rates.
28
We may be adversely impacted by the transition from LIBOR as a reference rate.
In 2017, the United Kingdom’s Financial Conduct Authority announced that after 2021 it would no longer compel banks tosubmit the rates required to calculate LIBOR. This announcement indicates that the continuation of LIBOR on the current basiscannot and will not be guaranteed after 2021. It remains unclear what rate or rates may develop as accepted alternatives to LIBOR, orwhat the effect of such changes will be on the markets for LIBOR-based financial instruments. The Secured Overnight FinancingRate (“SOFR”) has been recommended by the Alternative Reference Rates Committee (a group of private-market participantsconvened by the Federal Reserve Board and the Federal Reserve Bank of New York) as an alternative for USD LIBOR, butuncertainty as to the adoption, market acceptance or availability of SOFR or other alternative reference rates may adversely affect thevalue of LIBOR or SOFR-based assets and liabilities held or issued by the Company.
We occasionally have loans, derivative contracts, borrowings and other financial instruments with attributes that are eitherdirectly or indirectly dependent on LIBOR. The transition from LIBOR could create considerable costs and additional risk. Sinceproposed alternative rates are calculated differently, payments under contracts referencing new rates will differ from those referencingLIBOR. The transition will change our market risk profiles, requiring changes to risk and pricing models, valuation tools, productdesign and hedging strategies. Furthermore, failure to adequately manage this transition process with our customers could adverselyimpact our reputation.
The language in our contracts and financial instruments that define and use LIBOR have developed over time and have variousevents that trigger when a successor rate to the designated rate would be selected. If a trigger is satisfied, contracts and financialinstruments often give the calculation agent (which may be us) discretion over the successor rate or benchmark to be selected. As aresult, there is considerable uncertainty as to how the financial services industry will address the discontinuance of designated rates incontracts and financial instruments or such designated rates ceasing to be acceptable reference rates. This uncertainty could ultimatelyresult in client disputes and litigation surrounding the proper interpretation of our LIBOR-based contracts and financial instruments.
Although we are currently unable to assess what the ultimate impact of the transition from LIBOR will be, failure to adequatelymanage the transition could have a material adverse effect on our business, financial condition and results of operations.
Strategic Risks
The outbreak of COVID-19, or other such epidemic, pandemic, or highly contagious disease occurring in the United States or inthe geographies in which we conduct operations, could adversely affect the Company�s business operations, asset valuations,financial condition and results of operations.
The Company’s business is dependent upon the willingness and ability of our customers to conduct banking and other financialtransactions. The COVID-19 outbreak, or other highly contagious or infectious disease, could negatively impact the ability of ouremployees and customers to conduct such transactions and disrupt the business activities and operations of our customers in thegeographic areas in which we operate. The spread of the COVID-19 virus had an impact on our operations during 2020, and theCompany expects that the virus will continue to have an impact on the business, financial condition, and results of operations of theCompany and its customers during 2021. The COVID-19 pandemic has caused changes in the behavior of customers, businesses, andtheir employees, including illness, quarantines, social distancing practices, cancellation of events and travel, business and schoolshutdowns, reduction in commercial activity and financial transactions, supply chain interruptions, increased unemployment, andoverall economic and financial market instability. Future effects, including additional actions taken by federal, state, and localgovernments to contain COVID-19 or treat its impact, are unknown. Any sustained disruption to our operations is likely to negativelyimpact the Company’s financial condition and results of operations. Notwithstanding our contingency plans and other safeguardsagainst pandemics or another contagious disease, the spread of COVID-19 could also negatively impact the availability of EquityBank staff who are necessary to conduct our business operations, as well as potentially impact the business and operations third partyservice providers who perform critical services for us. If the response to contain COVID-19, or another highly infectious or contagiousdisease, is unsuccessful, the Company could experience a material adverse effect on our business operations, asset valuations,financial condition, and results of operations. Material adverse impacts may include all or a combination of valuation impairments onthe Company’s intangible assets, investments, loans, loan servicing rights, deferred tax assets, or counter-party risk derivatives.
Our financial performance will be negatively impacted if we are unable to execute our growth strategy.
Our current growth strategy is to grow organically and supplement that growth with select acquisitions. Our ability to groworganically depends primarily on generating loans and deposits of acceptable risk and expense and we may not be successful incontinuing this organic growth. Our ability to identify appropriate markets for expansion, recruit and retain qualified personnel andfund growth at a reasonable cost depends upon prevailing economic conditions, maintenance of sufficient capital, competitive factors,and changes in banking laws, among other factors. Conversely, if we grow too quickly and are unable to control costs and maintain

29
asset quality, such growth, whether organic or through select acquisitions, could materially and adversely affect our financialcondition and results of operations.
We may not be able to identify and acquire other financial institutions, which could hinder our ability to continue to grow.
A substantial part of our historical growth has been a result of acquisitions of other financial institutions. We intend to continueour strategy of evaluating and selectively acquiring other financial institutions that serve customers or markets we find desirable.However, the market for acquisitions remains highly competitive and we may be unable to find satisfactory acquisition candidates inthe future that fit our acquisition strategy. To the extent that we are unable to find suitable acquisition candidates, an importantcomponent of our strategy may be lost. If we are able to identify attractive acquisition opportunities, we must generally satisfy anumber of conditions prior to completing any such transaction, including certain bank regulatory approval, which has becomesubstantially more difficult, time-consuming and unpredictable as a result of the recent financial crisis. Additionally, any futureacquisitions may not produce the revenue, earnings or synergies that we anticipated.
Our strategy of pursuing acquisitions exposes us to financial, execution, compliance and operational risks that could have amaterial adverse effect on our business, financial condition, results of operations and growth prospects.
We intend to continue pursuing a strategy that includes acquisitions. An acquisition strategy involves significant risks,including the following:
• finding suitable candidates for acquisition;
• attracting funding to support additional growth within acceptable risk tolerances;
• maintaining asset quality;
• retaining customers and key personnel, including bankers;
• obtaining necessary regulatory approvals, which we may have difficulty obtaining or be unable to obtain;
• conducting adequate due diligence and managing known and unknown risks and uncertainties;
• integrating acquired businesses; and
• maintaining adequate regulatory capital.
The market for acquisition targets is highly competitive, which may adversely affect our ability to find acquisition candidatesthat fit our strategy and standards. We face significant competition in pursuing acquisition targets from other banks and financialinstitutions, many of which possess greater financial, human, technical and other resources than we do. Our ability to compete inacquiring target institutions will depend on our available financial resources to fund the acquisitions, including the amount of cash andcash equivalents we have and the liquidity and market price of our Class A common stock. In addition, increased competition mayalso drive up the acquisition consideration that we will be required to pay in order to successfully capitalize on attractive acquisitionopportunities. To the extent that we are unable to find suitable acquisition targets, an important component of our growth strategymay not be realized.
Acquisitions of financial institutions and branches also involve operational risks and uncertainties, such as unknown orcontingent liabilities with no available manner of recourse, exposure to unexpected problems such as asset quality, the retention of keyemployees and customers and other issues that could negatively affect our business. We may not be able to complete futureacquisitions or, if completed, we may not be able to successfully integrate the operations, technology platforms, management,products and services of the entities that we acquire or to realize our attempts to eliminate redundancies. The integration process mayalso require significant time and attention from our management that would otherwise be directed toward servicing existing businessand developing new business. Failure to successfully integrate the entities we acquire into our existing operations in a timely mannermay increase our operating costs significantly and adversely affect our business, financial condition and results of operations. Further,acquisitions typically involve the payment of a premium over book and market values and therefore, some dilution of our tangiblebook value and net income per common share may occur in connection with any future acquisition and the carrying amount of anygoodwill that we currently maintain or may acquire may be subject to impairment in future periods.
If we continue to grow, we will face risks arising from our increased size. If we do not manage such growth effectively, we maybe unable to realize the benefit from the investments in technology, infrastructure and personnel that we have made to support ourexpansion. In addition, we may incur higher costs and realize less revenue growth than we expect, which would reduce our earningsand diminish our future prospects and we may not be able to continue to implement our business strategy and successfully conduct ouroperations. Risks associated with failing to maintain effective financial and operational controls as we grow, such as maintainingappropriate loan underwriting procedures, information technology systems, determining adequate allowances for loan losses and

30
complying with regulatory accounting requirements, including increased loan losses, reduced earnings and potential regulatorypenalties and restrictions on growth, all could have a negative effect on our business, financial condition and results of operations.
Acquisitions may disrupt our business and dilute stockholder value and integrating acquired companies may be moredifficult, costly or time-consuming than we expect.
Our pursuit of acquisitions may disrupt our business and any equity that we issue as merger consideration may have the effect ofdiluting the value of common stockholders. In addition, we may fail to realize some or all of the anticipated benefits of completedacquisitions. We anticipate that the integration of businesses that we may acquire in the future will be a time-consuming andexpensive process, even if the integration process is effectively planned and implemented.
In addition, our acquisition activities could be material to our business and involve a number of significant risks, including thefollowing:
• incurring time and expense associated with identifying and evaluating potential acquisitions and negotiating potentialtransactions, resulting in our attention being diverted from the operation of our existing business;
• using inaccurate estimates and judgments to evaluate credit, operations, management and market risks with respect to thetarget company or the assets and liabilities that we seek to acquire;
• exposure to potential asset quality issues of the target company;
• intense competition from other banking organizations and other potential acquirers, many of which have substantiallygreater resources than we do;
• potential exposure to unknown or contingent liabilities of banks and businesses we acquire, including, without limitation,liabilities for regulatory and compliance issues;
• inability to realize the expected revenue increases, cost savings, increases in geographic or product presence and otherprojected benefits of the acquisition;
• incurring time and expense required to integrate the operations and personnel of the combined businesses;
• inconsistencies in standards, procedures and policies that would adversely affect our ability to maintain relationships withcustomers and employees;
• experiencing higher operating expenses relative to operating income from the new operations;
• creating an adverse short-term effect on our results of operations;
• losing key employees and customers;
• significant problems relating to the conversion of the financial and customer data of the entity;
• integration of acquired customers into our financial and customer product systems;
• potential changes in banking or tax laws or regulations that may affect the target company; or
• risks of impairment to goodwill.
If difficulties arise with respect to the integration process, the economic benefits expected to result from acquisitions might notoccur. As with any merger of financial institutions, there also may be business disruptions that cause us to lose customers or causecustomers to move their business to other financial institutions. Failure to successfully integrate businesses that we acquire could havean adverse effect on our profitability, return on equity, return on assets or our ability to implement our strategy, any of which in turncould have a material adverse effect on our business, financial condition and results of operations.
31
Operational Risks
We rely heavily on our management team and could be adversely affected by the unexpected loss of key officers.
We are led by an experienced management team with substantial experience in the markets that we serve and the financialproducts that we offer. Our operating strategy focuses on providing products and services through long-term relationship managers.Accordingly, our success depends in large part on the performance of our key personnel, as well as on our ability to attract, motivateand retain highly qualified senior and middle management. Competition for employees is intense and the process of locating keypersonnel with the combination of skills and attributes required to execute our business plan may be lengthy. We may not besuccessful in retaining our key employees and the unexpected loss of services of one or more of our key personnel could have amaterial adverse effect on our business because of their skills, knowledge of our market and financial products, years of industryexperience, long-term customer relationships and the difficulty of promptly finding qualified replacement personnel. If the services ofany of our key personnel should become unavailable for any reason, we may not be able to identify and hire qualified persons onterms acceptable to us, which could have an adverse effect on our business, financial condition and results of operations.
Our business is concentrated in, and largely dependent upon, the continued growth and welfare of the general geographicmarkets in which we operate.
Our banking operations are concentrated in Arkansas, Kansas, Missouri and Oklahoma. As a result, our financial condition andresults of operations and cash flows are affected by changes in the economic conditions of our markets. Our success depends to asignificant extent upon the business activity, population, income levels, deposits and real estate activity in these markets. Althoughour customers’ business and financial interests may extend well beyond these market areas, adverse conditions that affect these marketareas could reduce our growth rate, affect the ability of our customers to repay their loans, affect the value of collateral underlyingloans, impact our ability to attract deposits and generally affect our financial conditions and results of operations. Because of ourgeographic concentration, we may be less able than other regional or national financial institutions to diversify our credit risks acrossmultiple markets.
Difficult conditions in the market for financial products and services may materially and adversely affect our business andresults of operations.
Recessionary periods historically have brought about increased foreclosures and unemployment which have resulted insignificant write-downs of asset values by financial institutions, including government-sponsored entities and major commercial andinvestment banks. These write-downs, initially of mortgage-backed securities but spreading to credit default swaps and otherderivative securities, have historically caused many financial institutions to seek additional capital, to merge with larger and strongerinstitutions and, in some cases, to fail. This market turmoil and tightening of credit have led to an increased level of commercial andconsumer delinquencies, lack of consumer confidence, increased market volatility and widespread reduction of business activitygenerally. Although conditions have improved, a return of these trends could have a material adverse effect on our business andoperations. Negative market developments may affect consumer confidence levels and may cause adverse changes in paymentpatterns, causing increases in delinquencies and default rates, which may impact our charge-offs and provisions for loan and creditlosses. Economic deterioration that affects household and/or corporate incomes could also result in reduced demand for credit or fee-based products and services. These conditions would have adverse effects on us and others in the financial services industry.
Our ability to grow our loan portfolio may be limited by, among other things, economic conditions, competition within ourmarket areas, the timing of loan repayments and seasonality.
Our ability to continue to improve our operating results is dependent upon, among other things, growing our loan portfolio.While we believe that our strategy to grow our loan portfolio is sound and our growth targets are achievable over an extended periodof time, competition within our market areas is significant, particularly for high credit quality borrowers. We compete with both largeregional and national financial institutions, who are sometimes able to offer more attractive interest rates and other financial termsthan we choose to offer, as well as other community-based banks who seek to offer a similar level of service to that which we offer.This competition can make loan growth challenging, particularly if we are unwilling to price loans at levels that would causeunacceptable levels of compression of our net interest margin or if we are unwilling to structure a loan in a manner that we believeresults in a level of risk to us that we are not willing to accept. Moreover, loan growth throughout the year can fluctuate due in part toseasonality of the businesses of our borrowers and potential borrowers and the timing on loan repayments, particularly those of ourborrowers with significant relationships with us, resulting from, among other things, excess levels of liquidity. To the extent that weare unable to increase loans, we may be unable to successfully implement our growth strategy, which could materially and adverselyaffect us.
32
Several of our large depositors have relationships with each other, which creates a higher risk that one customer�swithdrawal of its deposit could lead to a loss of other deposits from customers within the relationship, which, in turn, could forceus to fund our business through more expensive and less stable sources.
As of December 31, 2020, our ten largest non-brokered depositors accounted for $279.3 million in deposits, or approximately8.1% of our total deposits. Further, our non-brokered deposit account balance was $3.41 billion, or approximately 98.9% of our totaldeposits, as of December 31, 2020. Several of our large depositors have business, family or other relationships with each other, whichcreates a risk that any one customer’s withdrawal of its deposit could lead to a loss of other deposits from customers within therelationship.
Withdrawals of deposits by any one of our largest depositors or by one of our related customer groups could force us to relymore heavily on borrowings and other sources of funding for our business and withdrawal demands, adversely affecting our netinterest margin and results of operations. We may also be forced, as a result of any withdrawal of deposits, to rely more heavily onother, potentially more expensive and less stable funding sources. Consequently, the occurrence of any of these events could have amaterial adverse effect on our business, results of operations, financial condition and future prospects.
Our future profitability levels are dependent on our ability to grow and maintain deposits at competitive costs.
Our ability to fund our lending and investing activities at a reasonable cost depends on our ability to maintain adequate depositlevels at an economically competitive cost structure. The following risks could impact the cost structures of deposits:
• Increased competition over transactional and time deposit accounts could increase the costs of these deposits byincreasing the rate of change and velocity of change in deposit rates, as overall market rates change;
• Migration of transactional deposit accounts to time deposit accounts could increase the overall costs of deposits; and• Changes in the mix of retail and public funds deposit customers could increase the costs of deposits. Public funds
deposits are more rate sensitive than retail deposits and if we are forced to rely more heavily on those types of depositsoverall funding cost could increase.
Our ability to retain bankers and recruit additional successful bankers is critical to the success of our business strategy andany failure to do so could adversely affect our business, financial condition, results of operations and growth prospects.
Our ability to retain and grow our loans, deposits and fee income depends upon the business generation capabilities, reputationand relationship management skills of our bankers. If we were to lose the services of any of our bankers, including successful bankersemployed by banks that we may acquire, to a new or existing competitor or otherwise, we may not be able to retain valuablerelationships and some of our customers could choose to use the services of a competitor instead of our services.
Our growth strategy also relies on our ability to attract and retain additional profitable bankers. We may face difficulties inrecruiting and retaining bankers of our desired caliber, including as a result of competition from other financial institutions. Inparticular, many of our competitors are significantly larger with greater financial resources and may be able to offer more attractivecompensation packages and broader career opportunities. Additionally, we may incur significant expenses and expend significanttime and resources on training, integration and business development before we are able to determine whether a new banker will beprofitable or effective. If we are unable to attract and retain successful bankers, or if our bankers fail to meet our expectations in termsof customer relationships and profitability, we may be unable to execute our business strategy and our business, financial condition,results of operations and growth prospects may be adversely affected.
Any expansion into new markets or new lines of business might not be successful.
As part of our ongoing strategic plan, we may consider expansion into new geographic markets. Such expansion might take theform of the establishment of de novo branches or the acquisition of existing banks or bank branches. There are considerable costsassociated with opening new branches and new branches generally do not generate sufficient revenues to offset costs until they havebeen in operation for some time. Additionally, we may consider expansion into new lines of business through the acquisition of thirdparties or organic growth and development. There are substantial risks associated with such efforts, including risks that (i) revenuesfrom such activities might not be sufficient to offset the development, compliance and other implementation costs, (ii) competingproducts and services and shifting market preferences might affect the profitability of such activities and (iii) our internal controlsmight be inadequate to manage the risks associated with new activities. Furthermore, it is possible that our unfamiliarity with newmarkets or lines of business might adversely affect the success of such actions. If any such expansions into new geographic or productmarkets are not successful, there could be an adverse effect on our financial condition and results of operations.

33
Our small to medium-sized business and entrepreneurial customers may have fewer financial resources than larger entitiesto weather a downturn in the economy that might impair a borrower�s ability to repay a loan and could adversely affect ourfinancial condition and results of operations.
We focus our business development and marketing strategy primarily to serve the banking and financial services needs of smallto medium-sized businesses and entrepreneurs. These small to medium-sized businesses and entrepreneurs may have fewer financialresources in terms of capital or borrowing capacity than larger entities. If economic conditions negatively impact our marketsgenerally, and small to medium-sized businesses are adversely affected, our financial condition and results of operations may benegatively affected.
A lack of liquidity could adversely affect our financial condition and results of operations.
Liquidity is essential to our business. We rely on our ability to generate deposits and effectively manage the repayment andmaturity schedules of our loans to ensure that we have adequate liquidity to fund our operations. An inability to raise funds throughdeposits, borrowings, the sale of loans and other sources could have a substantial negative effect on our liquidity. Our most importantsource of funds is deposits. Deposit balances can decrease when customers perceive alternative investments as providing a betterrisk/return tradeoff. If customers move money out of bank deposits and into other investments such as money market funds, we wouldlose a relatively low-cost source of funds, increasing our funding costs and reducing our net interest income and net income.
Other primary sources of funds consist of cash flows from operations, maturities and sales of investment securities and proceedsfrom the issuance and sale of our equity securities to investors. Additional liquidity is provided by the ability to borrow from theFederal Home Loan Bank of Topeka. We also may borrow funds from third-party lenders, such as other financial institutions. Ouraccess to funding sources in amounts adequate to finance or capitalize our activities, or on terms that are acceptable to us, could beimpaired by factors that affect us directly or the financial services industry or economy in general, such as disruptions in the financialmarkets or negative views and expectations about the prospects for the financial services industry. Our access to funding sourcescould also be affected by a decrease in the level of our business activity as a result of a downturn in our markets or by one or moreadverse regulatory actions against us.
Any decline in available funding could adversely impact our ability to originate loans, invest in securities, meet our expenses orto fulfill obligations such as repaying our borrowings or meeting deposit withdrawal demands, any of which could have a materialadverse impact on our liquidity, business, financial condition and results of operations.
As a community banking institution, we have lower lending limits and different lending risks than certain of our larger,more diversified competitors.
We are a community banking institution that provides banking services to the local communities in the market areas in whichwe operate. Our ability to diversify our economic risks is limited by our own local markets and economies. We lend primarily toindividuals and small to medium-sized businesses, which may expose us to greater lending risks than those of banks that lend tolarger, better-capitalized businesses with longer operating histories. In addition, our legally mandated lending limits are lower thanthose of certain of our competitors that have more capital than we do. These lower lending limits may discourage borrowers withlending needs that exceed our limits from doing business with us. We may try to serve such borrowers by selling loan participationsto other financial institutions; however, this strategy may not succeed.
Our financial projections are based upon numerous assumptions about future events and our actual financial performancemay differ materially from our projections if our assumptions are inaccurate.
If the communities in which we operate do not grow, or if the prevailing economic conditions locally or nationally are lessfavorable than we have assumed, then our ability to reduce our nonperforming loans and other real estate owned portfolios and toimplement our business strategies may be adversely affected and our actual financial performance may be materially different fromour projections.
Moreover, we cannot give any assurance that we will benefit from any market growth or favorable economic conditions in ourmarket areas even if they do occur. If our senior management team is unable to provide the effective leadership necessary toimplement our strategic plan our actual financial performance may be materially adversely different from our projections.Additionally, to the extent that any component of our strategic plan requires regulatory approval, if we are unable to obtain necessaryapproval, we will be unable to completely implement our strategy, which may adversely affect our actual financial results. Ourinability to successfully implement our strategic plan could adversely affect the price of our Class A common stock.
34
We depend on the accuracy and completeness of information about customers and counterparties.
In deciding whether to extend credit or enter into other transactions with customers and counterparties, we may rely oninformation furnished to us by or on behalf of customers and counterparties, including financial statements and other financialinformation. We also may rely on representations of customers and counterparties as to the accuracy and completeness of thatinformation and, with respect to financial statements, on reports of independent auditors. In deciding whether to extend credit, we mayrely upon our customers’ representations that their financial statements conform to GAAP and present fairly, in all material respects,the financial condition, results of operations and cash flows of the customer. We also may rely on customer representations andcertifications or other audit or accountants’ reports, with respect to the business and financial condition of our clients. Our financialcondition, results of operations, financial reporting and reputation could be negatively affected if we rely on materially misleading,false, inaccurate or fraudulent information.
We are subject to possible claims and litigation pertaining to fiduciary responsibility.
From time to time, customers could make claims and take legal action pertaining to our performance of our fiduciaryresponsibilities. Whether customer claims and legal action related to our performance of our fiduciary responsibilities are founded orunfounded, if such claims and legal actions are not resolved in a manner favorable to us, they may result in significant financialliability and/or adversely affect our market perception of our products and services as well as impact customer demand for thoseproducts and services. Any financial liability or reputation damage could have a material adverse effect on our business, which, inturn, could have a material adverse effect on our financial condition and results of operations.
We continually encounter technological change and may have fewer resources than our competitors to continue to invest intechnological improvements.
The banking and financial services industries are undergoing rapid technological changes with frequent introductions of newtechnology-driven products and services. In addition to enhancing the level of service provided to customers, the effective use oftechnology increases efficiency and enables financial institutions to reduce costs. Our future success will depend, in part, upon ourability to address the needs of our customers by using technology to provide products and services that enhance customer convenienceand create additional efficiencies in operations. Many of our competitors have greater resources to invest in technologicalimprovements and we may not be able to effectively implement new technology-driven products and services, which could reduce ourability to effectively compete.
Our information systems may experience a failure or interruption.
We rely heavily on communications and information systems to conduct our business. Any failure or interruption in theoperation of these systems could impair or prevent the effective operation of our customer relationship management, general ledger,deposit, lending or other functions. While we have policies and procedures designed to prevent or limit the effect of a failure orinterruption in the operation of our information systems, there can be no assurance that any such failures or interruptions will notoccur or, if they do occur, that they will be adequately addressed. The occurrence of any failures or interruptions impacting ourinformation systems could damage our reputation, result in a loss of customer business and expose us to additional regulatory scrutiny,civil litigation and possible financial liability, any of which could have a material adverse effect on our financial condition and resultsof operations.
We use information technology in our operations and offer online banking services to our customers, and unauthorizedaccess to our or our customers� confidential or proprietary information as a result of a cyber-attack or otherwise could expose usto reputational harm and litigation and adversely affect our ability to attract and retain customers.
Information security risks for financial institutions have generally increased in recent years, in part because of the proliferationof new technologies, the use of the internet and telecommunications technologies to conduct financial transactions and the increasedsophistication and activities of organized crime, hackers, terrorists, activists and other external parties. The financial services industryhas seen increases in electronic fraudulent activity, hacking, security breaches, sophisticated social engineering and cyber-attacks,including in the commercial banking sector, as cyber criminals have been targeting commercial bank and brokerage accounts on anincreasing basis. We are under continuous threat of loss due to fraudulent activity, hacking and cyber-attacks, especially as wecontinue to expand customer capabilities to utilize internet and other remote channels to transact business. Our risk and exposure tothese matters remains heightened because of the evolving nature and complexity of these threats from cyber criminals and hackers, ourplans to continue to provide internet banking and mobile banking channels and our plans to develop additional remote connectivitysolutions to serve our customers. Therefore, the secure processing, transmission and storage of information in connection with ouronline banking services are critical elements of our operations. However, our network could be vulnerable to unauthorized access,computer viruses and other malware, phishing schemes or other security failures. In addition, our customers may use personalsmartphones, tablet PCs or other mobile devices that are beyond our control systems in order to access our products and services. Our
35
technologies, systems and networks and our customers’ devices, may become the target of cyber-attacks, electronic fraud orinformation security breaches that could result in the unauthorized release, gathering, monitoring, misuse, loss or destruction of our orour customers’ confidential, proprietary and other information, or otherwise disrupt our or our customers’ or other third parties’business operations. As cyber threats continue to evolve, we may be required to spend significant capital and other resources toprotect against these threats or to alleviate or investigate problems caused by such threats. Our business relies on the secureprocessing, storage, transmission and retrieval of confidential customer information in our computer and data management systemsand networks, and in the computer and data management systems and networks of third parties, and any breaches or unauthorizedaccess to such information could present significant regulatory costs and expose us to litigation and other possible liabilities. Anyinability to prevent these types of security threats could also cause existing customers to lose confidence in our systems and couldadversely affect our reputation and ability to generate deposits. While we have not experienced any material losses relating to cyber-attacks or other information security breaches to date, we may suffer such losses in the future. The occurrence of any cyber-attack orinformation security breach could result in financial losses or increased costs to us or our clients, disclosure or misuse of confidentialinformation belonging to us or personal or confidential information belonging to our clients, misappropriation of assets, reputationaldamage, damage to our competitive position and the disruption of our operations, all of which could adversely affect our financialcondition or results of operations.
In addition to well-known risks related to fraudulent activity, which take many forms, such as check “kiting” or fraud, wirefraud and other dishonest acts, information security breaches and cybersecurity-related incidents have become a material risk in thefinancial services industry. These threats may include fraudulent or unauthorized access to data processing or data storage systemsused by us or by our clients, electronic identity theft, “phishing”, account takeover, denial or degradation of service attacks andmalware or other cyber-attacks. These electronic viruses or malicious code are typically designed to, among other things:
• obtain unauthorized access to confidential information belonging to us or our clients and customers;• manipulate or destroy data;• disrupt, sabotage or degrade service on a financial institution’s systems; or• steal money.
In recent periods, several governmental agencies and large corporations, including financial service organizations and retailcompanies, have suffered major data breaches, in some cases exposing not only their confidential and proprietary corporateinformation, but also sensitive financial and other personal information of their clients or clients and their employees or other thirdparties and subjecting those agencies and corporations to potential fraudulent activity and their clients, clients and other third parties toidentity theft and fraudulent activity in their credit card and banking accounts. Therefore, security breaches and cyber-attacks cancause significant increases in operating costs, including the costs and capital expenditures required to correct the deficiencies in andstrengthen the security of data processing and storage systems.
Unfortunately, it is not always possible to anticipate, detect, or recognize these threats to our systems, or to implement effectivepreventative measures against all breaches, whether those breaches are malicious or accidental. Cybersecurity risks for bankingorganizations have significantly increased in recent years and have been difficult to detect before they occur because, among otherreasons:
• the proliferation of new technologies and the use of the Internet and telecommunications technologies to conductfinancial transactions;
• these threats arise from numerous sources, not all of which are in our control, including among others, human error,fraud or malice on the part of employees or third parties, accidental technological failure, electrical ortelecommunication outages, failures of computer servers or other damage to our property or assets, natural disasters orsevere weather conditions, health emergencies or pandemics, or outbreaks of hostilities or terrorist acts;
• the techniques used in cyber-attacks change frequently and may not be recognized until launched or until well after thebreach has occurred;
• the increased sophistication and activities of organized crime groups, hackers, terrorist organizations, hostile foreigngovernments, disgruntled employees or vendors, activists and other external parties, including those involved incorporate espionage;
• the vulnerability of systems to third parties seeking to gain access to such systems either directly or using equipment orsecurity passwords belonging to employees, customers, third-party service providers or other users of our systems; and
• our frequent transmission of sensitive information to, and storage of such information by, third parties, including ourvendors and regulators, and possible weaknesses that go undetected in our data systems notwithstanding the testing weconduct of those systems.
Although to date we have not experienced any losses or other material consequences relating to technology failure, cyber-attacks or other information, we may suffer such losses or other consequences in the future. While we invest in systems and processesthat are designed to detect and prevent security breaches and cyber-attacks and we conduct periodic tests of our security systems andprocesses, we may not succeed in anticipating or adequately protecting against or preventing all security breaches and cyber-attacksfrom occurring. Even the most advanced internal control environment may be vulnerable to compromise. Targeted social engineering

36
attacks are becoming more sophisticated and are extremely difficult to prevent. Additionally, the existence of cyber-attacks orsecurity breaches at third parties with access to our data, such as vendors, may not be disclosed to us in a timely manner. Further, wemay not be able to insure against losses related to cyber threats. As cyber threats continue to evolve, we may be required to expendsignificant additional resources to continue to modify or enhance our protective measures or to investigate and remediate anyinformation security vulnerabilities or incidents.
As is the case with non-electronic fraudulent activity, cyber-attacks or other information or security breaches, whether directedat us or third parties, may result in a material loss or have material consequences. Furthermore, the public perception that a cyber-attack on our systems has been successful, whether or not this perception is correct, may damage our reputation with customers andthird parties with whom we do business. A successful penetration or circumvention of system security could cause us negativeconsequences, including loss of customers and business opportunities, disruption to our operations and business, misappropriation ordestruction of our confidential information and/or that of our customers, or damage to our customers’ and/or third parties’ computersor systems, and could expose us to additional regulatory scrutiny and result in a violation of applicable privacy laws and other laws,litigation exposure, regulatory fines, penalties or intervention, loss of confidence in our security measures, reputational damage,reimbursement or other compensatory costs, additional compliance costs, and could adversely impact our results of operations,liquidity and financial condition.
We are dependent upon outside third parties for the processing and handling of our records and data.
We rely on software developed by third-party vendors to process various transactions. In some cases, we have contracted withthird parties to run their proprietary software on our behalf. These systems include, but are not limited to, general ledger, payroll,employee benefits, loan and deposit processing and securities portfolio accounting. While we perform a review of controls institutedby the applicable vendors over these programs in accordance with industry standards and perform our own testing of user controls, wemust rely on the continued maintenance of controls by these third-party vendors, including safeguards over the security of customerdata. In addition, we maintain, or contract with third parties to maintain, daily backups of key processing outputs in the event of afailure on the part of any of these systems. Nonetheless, we may incur a temporary disruption in our ability to conduct business orprocess transactions, or incur damage to our reputation, if the third-party vendor fails to adequately maintain internal controls orinstitute necessary changes to systems. Such a disruption or breach of security may have a material adverse effect on our business.
We are subject to losses due to the errors or fraudulent behavior of employees or third parties.
We are exposed to many types of operational risk, including the risk of fraud by employees and outsiders, clerical record-keeping errors and transactional errors. Our business is dependent on our employees as well as third-party service providers toprocess a large number of increasingly complex transactions. We could be materially adversely affected if someone causes asignificant operational breakdown or failure, either as a result of human error or where an individual purposefully sabotages orfraudulently manipulates our operations or systems. When we originate loans, we rely upon information supplied by loan applicantsand third parties, including the information contained in the loan application, property appraisal and title information, if applicable,and employment and income documentation provided by third parties. If any of this information is misrepresented and suchmisrepresentation is not detected prior to loan funding, we generally bear the risk of loss associated with the misrepresentation. Anyof these occurrences could result in a diminished ability of us to operate our business, potential liability to customers, reputationaldamage and regulatory intervention, which could negatively impact our business, financial condition and results of operations.
If our enterprise risk management framework is not effective at mitigating risk and loss to us, we could suffer unexpectedlosses and our results of operations could be materially adversely affected.
Our enterprise risk management framework seeks to achieve an appropriate balance between risk and return, which is critical tooptimizing stockholder value. We have established processes and procedures intended to identify, measure, monitor, report andanalyze the types of risk to which we are subject, including credit, liquidity, operational, regulatory compliance and reputational.However, as with any risk management framework, there are inherent limitations to our risk management strategies as there may exist,or develop in the future, risks that we have not appropriately anticipated or identified. For example, the recent financial and creditcrisis and resulting regulatory reform highlighted both the importance and some of the limitations of managing unanticipated risks. Ifour risk management framework proves ineffective, we could suffer unexpected losses and our business and results of operationscould be materially adversely affected.
Changes in accounting standards could materially impact our financial statements.
From time to time, the Financial Accounting Standards Board or the SEC may change the financial accounting and reportingstandards that govern the preparation of our financial statements. Such changes may result in us being subject to new or changingaccounting and reporting standards. In addition, the bodies that interpret the accounting standards (such as banking regulators, outsideauditors or management) may change their interpretations or positions on how these standards should be applied. These changes may
37
be beyond our control, can be hard to predict and can materially impact how we record and report our financial condition and resultsof operations. In some cases, we could be required to apply a new or revised standard retrospectively or apply an existing standarddifferently, also retrospectively, in each case resulting in our needing to revise or restate prior period financial statements.
If the goodwill that we have recorded or may record in connection with a business acquisition becomes impaired, it couldrequire charges to earnings, which would adversely affect our business, financial condition and results of operations.
Goodwill represents the amount by which the cost of an acquisition exceeded the fair value of net assets we acquired inconnection with the purchase of another financial institution. We review goodwill for impairment at least annually, or morefrequently if a triggering event occurs which indicates that the carrying value of the asset might be impaired. There can be noassurance that our future evaluations of our existing goodwill or goodwill we may acquire in the future will not result in findings ofimpairment and related write-downs, which could adversely affect our business, financial condition and results of operations. Foradditional information about the Company’s impairment assessment process and results see “NOTE 7 – GOODWILL AND COREDEPOSIT INTANGIBLES” in Notes to Consolidated Financial Statements.
We may be required to repurchase mortgage loans or indemnify buyers against losses in some circumstances, which couldharm liquidity, results of operations and financial condition.
When mortgage loans are sold, whether as whole loans or pursuant to a securitization, we are required to make customaryrepresentations and warranties to purchasers, guarantors and insurers, including government-sponsored enterprises, about themortgage loans and the manner in which they were originated. We may be required to repurchase or substitute mortgage loans, orindemnify buyers against losses, in the event we breach these representations or warranties. In addition, we may be required torepurchase mortgage loans as a result of early payment default of the borrower on a mortgage loan. With respect to loans that areoriginated through Equity Bank or correspondent channels, the remedies available against the originating broker or correspondent, ifany, may not be as broad as the remedies available to purchasers, guarantors and insurers of mortgage loans against us. We facefurther risk that the originating broker or correspondent, if any, may not have financial capacity to perform remedies that otherwisemay be available. Therefore, if a purchaser, guarantor or insurer enforces its remedies against us, we may not be able to recover lossesfrom the originating broker or correspondent. If repurchase and indemnity demands increase and such demands are valid claims andare in excess of our provision for potential losses, our liquidity, results of operations and financial condition may be adverselyaffected.
Risks Relating to the Regulation of Our Industry
We are subject to extensive regulation in the conduct of our business, which imposes additional costs on us and adverselyaffects our profitability.
As a bank holding company, we are subject to federal regulation under the Bank Holding Company Act of 1956, as amended, orthe BHC Act, and the examination and reporting requirements of the Federal Reserve. Federal regulation of the banking industry,along with tax and accounting laws, regulations, rules and standards, may limit our operations significantly and control the methods bywhich we conduct business, as they limit those of other banking organizations. Banking regulations are primarily intended to protectdepositors, deposit insurance funds and the banking system as a whole and not stockholders or other creditors. These regulationsaffect lending practices, capital structure, investment practices, dividend policy and overall growth, among other things. For example,federal and state consumer protection laws and regulations limit the manner in which we may offer and extend credit. In addition, thelaws governing bankruptcy generally favor debtors, making it more expensive and more difficult to collect from customers whobecome subject to bankruptcy proceedings.
We also may be required to invest significant management attention and resources to evaluate and make any changes necessaryto comply with applicable laws and regulations, particularly as a result of regulations adopted under the Dodd-Frank Act. Thisallocation of resources, as well as any failure to comply with applicable requirements, may negatively impact our financial conditionand results of operations.
38
Changes in laws, government regulation and monetary policy may have a material effect on our results of operations.
Financial institutions have been the subject of significant legislative and regulatory changes and may be the subject of furthersignificant legislation or regulation in the future, none of which is within our control. New proposals for legislation continue to beintroduced in the United States Congress that could further substantially increase regulation of the bank and non-bank financialservices industries, impose restrictions on the operations and general ability of firms within the industry to conduct business consistentwith historical practices, including in the areas of compensation, interest rates, financial product offerings and disclosures and have aneffect on bankruptcy proceedings with respect to consumer residential real estate mortgages, among other things. Federal and stateregulatory agencies also frequently adopt changes to their regulations or change the manner in which existing regulations are applied.Changes to statutes, regulations or regulatory policies, including changes in their interpretation or implementation by regulators, couldaffect us in substantial and unpredictable ways. Such changes could, among other things, subject us to additional costs and lowerrevenues, limit the types of financial services and products that we may offer, ease restrictions on non-banks and thereby enhance theirability to offer competing financial services and products, increase compliance costs and require a significant amount ofmanagement’s time and attention. Failure to comply with statutes, regulations or policies could result in sanctions by regulatoryagencies, civil monetary penalties or reputational damage, each of which could have a material adverse effect on our business,financial condition and results of operations.
Banking agencies periodically conduct examinations of our business, including compliance with laws and regulations, andour failure to comply with any supervisory actions to which we become subject as a result of such examinations could materiallyand adversely affect us.
We are subject to supervision and regulation by federal and state banking agencies that periodically conduct examinations of ourbusiness, including compliance with laws and regulations – specifically, our subsidiary, Equity Bank, is subject to examination by theFederal Reserve and the OSBC and we are subject to examination by the Federal Reserve. Accommodating such examinations mayrequire management to reallocate resources, which would otherwise be used in the day-to-day operation of other aspects of ourbusiness. If, as a result of an examination, any such banking agency was to determine that the financial condition, capital resources,allowance for loan losses, asset quality, earnings prospects, management, liquidity or other aspects of our operations had becomeunsatisfactory, or that we or our management were in violation of any law or regulation, such banking agency may take a number ofdifferent remedial actions as it deems appropriate. These actions include the power to enjoin “unsafe or unsound” practices, to requireaffirmative actions to correct any conditions resulting from any violation or practice, to issue an administrative order that can bejudicially enforced, to direct an increase in our capital, to restrict our growth, to assess civil monetary penalties against us, our officers,or directors, to remove officers and directors and, if it is concluded that such conditions cannot be corrected or there is an imminentrisk of loss to depositors, to terminate our deposit insurance. If we become subject to such a regulatory action, it could have a materialadverse effect on our business, financial condition and results of operations.
Our banking subsidiary may be required to pay higher FDIC insurance premiums or special assessments which mayadversely affect our earnings.
As a member institution of the FDIC, our banking subsidiary, Equity Bank, is assessed a quarterly deposit insurance premium.We are generally unable to control the amount of premiums or special assessments that Equity Bank is required to pay, future bankfailures may stress the Deposit Insurance Fund and prompt the FDIC to increase its premiums or to issue special assessments. Anyfuture changes in the calculation or assessment of FDIC insurance premiums may have a material adverse effect on our results ofoperations, financial condition and our ability to continue to pay dividends on our common stock at the current rate or at all.
We are subject to certain capital requirements by regulators.
Applicable regulations require us to maintain specific capital standards in relation to the respective credit risks of our assets andoff-balance sheet exposures. Various components of these requirements are subject to qualitative judgments by regulators. Wemaintain a “well capitalized” status under the current regulatory framework. Our failure to maintain a “well capitalized” status couldaffect our customers’ confidence in us, which could adversely affect our ability to do business. In addition, failure to maintain suchstatus could also result in restrictions imposed by our regulators on our growth and other activities. Any such effect on customers orrestrictions by our regulators could have a material adverse effect on our financial condition and results of operations.
39
We are subject to stringent capital requirements, which may adversely impact our return on equity or constrain us frompaying dividends or repurchasing shares.
Banking institutions are required to hold more capital as a percentage of assets than most industries. Holding high amounts ofcapital compresses our earnings and constrains growth. In addition, the failure to meet applicable regulatory capital requirementscould result in one or more of our regulators placing limitations or conditions on our activities, including our growth initiatives, orrestricting the commencement of new activities, and could affect client and investor confidence, our costs of funds and FDICinsurance costs and our ability to make acquisitions and result in a material adverse effect on our business, financial condition, resultsof operations and growth prospects.
We may need to raise additional capital in the future, including as a result of potential increased minimum capital thresholdsestablished by regulators, but that capital may not be available when it is needed or may be dilutive to stockholders.
We are required by federal and state regulatory authorities to maintain adequate capital levels to support our operations. Newregulations implementing minimum capital standards could require financial institutions to maintain higher minimum capital ratiosand may place a greater emphasis on common equity as a component of “Tier 1 capital,” which consists generally of stockholders’equity and qualifying preferred stock, less certain goodwill items and other intangible assets. In order to support our operations andcomply with regulatory standards, we may need to raise capital in the future. Our ability to raise additional capital will depend onconditions in the capital markets at that time, which are outside of our control, and on our financial performance. Accordingly, wecannot assure you of our ability to raise additional capital, if needed, on favorable terms. The capital and credit markets haveexperienced significant volatility in recent years. In some cases, the markets have produced downward pressure on stock prices andcredit availability for certain issuers without regard to those issuers’ underlying financial strength. If we cannot raise additionalcapital when needed, our financial condition and results of operations may be adversely affected and our banking regulators maysubject us to regulatory enforcement action, including receivership. Furthermore, our issuance of additional shares of our Class Acommon stock could dilute the economic ownership interest of our Class A stockholders.
Stockholders may be deemed to be acting in concert or otherwise in control of us and our bank subsidiary, which couldimpose prior approval requirements and result in adverse regulatory consequences for such holders.
We are a bank holding company regulated by the Federal Reserve. Any entity (including a “group” composed of naturalpersons) owning 25% or more of a class of our outstanding shares of voting stock, or a lesser percentage if such holder or groupotherwise exercises a “controlling influence” over us, may be subject to regulation as a “bank holding company” in accordance withthe Bank Holding Company Act of 1956, as amended. In addition, (i) any bank holding company or foreign bank with a U.S.presence is required to obtain the approval of the Federal Reserve under the Bank Holding Company Act to acquire or retain 5% ormore of a class of our outstanding shares of voting stock, and (ii) any person other than a bank holding company may be required toobtain prior regulatory approval under the Change in Bank Control Act to acquire or retain 10% or more of our outstanding shares ofvoting stock. Any stockholder that is deemed to “control” the Company for bank regulatory purposes would become subject to priorapproval requirements and ongoing regulation and supervision. Such a holder may be required to divest amounts equal to orexceeding 5% of the voting shares of investments that may be deemed incompatible with bank holding company status, such as aninvestment in a company engaged in non-financial activities. Regulatory determination of “control” of a depository institution orholding company is based on all of the relevant facts and circumstances. Potential investors are advised to consult with their legalcounsel regarding the applicable regulations and requirements.
Shares of our common stock owned by holders determined by a bank regulatory agency to be acting in concert would beaggregated for purposes of determining whether those holders have control of a bank or bank holding company. Each stockholderobtaining control that is a “company” would be required to register as a bank holding company. “Acting in concert” generally meansknowing participation in a joint activity or parallel action towards the common goal of acquiring control of a bank or a parentcompany, whether or not pursuant to an express agreement. The manner in which this definition is applied in individualcircumstances can vary and cannot always be predicted with certainty. Many factors can lead to a finding of acting in concert,including where: (i) the stockholders are commonly controlled or managed; (ii) the stockholders are parties to an oral or writtenagreement or understanding regarding the acquisition, voting or transfer of control of voting securities of a bank or bank holdingcompany; (iii) the stockholders are immediate family members; or (iv) both a stockholder and a controlling stockholder, partner,trustee or management official of such stockholder own equity in the bank or bank holding company.

40
We are subject to numerous laws designed to protect consumers, including the Community Reinvestment Act and fairlending laws, and failure to comply with these laws could lead to a wide variety of sanctions.
The Community Reinvestment Act, or CRA, the Equal Credit Opportunity Act, the Fair Housing Act and other fair lending lawsand regulations impose nondiscriminatory lending requirements on financial institutions. The U.S. Department of Justice and otherfederal agencies are responsible for enforcing these laws and regulations. A successful regulatory challenge to an institution’sperformance under the CRA or fair lending laws and regulations could result in a wide variety of sanctions, including damages andcivil money penalties, injunctive relief, restrictions on mergers and acquisitions activity, restrictions on expansion and restrictions onentering new business lines. Private parties may also have the ability to challenge an institution’s performance under fair lending lawsin private class action litigation. Such actions could have a material adverse effect on our business, financial condition, results ofoperations and future prospects.
We are subject to the Bank Secrecy Act and other anti-money laundering statutes and regulations, and any deemeddeficiency by us with respect to these laws could result in significant liability.
The Bank Secrecy Act, the USA PATRIOT Act of 2001, or the Patriot Act, and other laws and regulations require financialinstitutions, among other duties, to institute and maintain an effective anti-money laundering program and file suspicious activity andcurrency transaction reports, when appropriate. In addition to other bank regulatory agencies, the federal Financial CrimesEnforcement Network of the U.S. Treasury, is authorized to impose significant civil money penalties for violations of thoserequirements and has recently engaged in coordinated enforcement efforts with the state and federal banking regulators, as well as theU.S. Department of Justice, Consumer Financial Protection Bureau, Drug Enforcement Administration and Internal Revenue Service,or the IRS. We are also subject to increased scrutiny of compliance with the rules enforced by the Office of Foreign Assets Control ofthe U.S. Treasury regarding, among other things, the prohibition of transacting business with and the need to freeze assets of, certainpersons and organizations identified as a threat to the national security, foreign policy or economy of the United States. If ourpolicies, procedures and systems are deemed deficient, we would be subject to liability, including fines and regulatory actions, whichmay include restrictions on our ability to pay dividends and the necessity to obtain regulatory approvals to proceed with certainaspects of our business plan, including our acquisition plans. Failure to maintain and implement adequate programs to combat moneylaundering and terrorist financing could also have serious reputational consequences for us. Any of these results could have a materialadverse effect on our business, financial condition, results of operations and future prospects.
Many of our new activities and expansion plans require regulatory approvals and failure to obtain them may restrict ourgrowth.
We intend to complement and expand our business by pursuing strategic acquisitions of financial institutions and othercomplementary businesses. Generally, we must receive state and federal regulatory approval before we can acquire an FDIC-insureddepository institution or related business. In determining whether to approve a proposed acquisition, federal banking regulators willconsider, among other factors, the effect of the acquisition on competition, our financial condition, our future prospects and the impactof the proposal on U.S. financial stability. The regulators also review current and projected capital ratios and levels, the competence,experience and integrity of management and its record of compliance with laws and regulations, the convenience and needs of thecommunities to be served (including the acquiring institution’s record of compliance under the CRA) and the effectiveness of theacquiring institution in combating money laundering activities. Such regulatory approvals may not be granted on terms that areacceptable to us, or at all. We may also be required to sell branches as a condition to receiving regulatory approval, which may not beacceptable to us or, if acceptable to us, may reduce the benefit of any acquisition.
The Federal Reserve may require us to commit capital resources to support our subsidiary, Equity Bank.
The Federal Reserve requires a bank holding company to act as a source of financial and managerial strength to its subsidiarybanks and to commit resources to support its subsidiary banks. Under the “source of strength” doctrine, the Federal Reserve mayrequire a bank holding company to make capital injections into a troubled subsidiary bank at times when the bank holding companymay not be inclined to do so and may charge the bank holding company with engaging in unsafe and unsound practices for failure tocommit resources to such a subsidiary bank. Accordingly, we could be required to provide financial assistance to our subsidiary,Equity Bank, if it experiences financial distress.
Such a capital injection may be required at a time when our resources are limited, and we may be required to borrow the fundsto make the required capital injection. In the event of a bank holding company’s bankruptcy, the bankruptcy trustee will assume anycommitment by the holding company to a federal bank regulatory agency to maintain the capital of a subsidiary bank. Moreover,bankruptcy law provides that claims based on any such commitment will be entitled to a priority of payment over the claims of theholding company’s general unsecured creditors, including the holders of any note obligations.
41
The laws that regulate our operations are designed for the protection of depositors and the public, not our stockholders.
The federal and state laws and regulations applicable to our operations give regulatory authorities extensive discretion inconnection with their supervisory and enforcement responsibilities and generally have been promulgated to protect depositors and theFDIC’s DIF and not for the purpose of protecting stockholders. These laws and regulations can materially affect our future business.Laws and regulations now affecting us may be changed at any time and the interpretation of such laws and regulations by bankregulatory authorities is also subject to change.
As a bank holding company, the sources of funds available to us are limited.
Any future constraints on liquidity at the holding company level could impair our ability to declare and pay dividends on ourClass A common stock. In some instances, notice to, or approval from, the Federal Reserve may be required prior to our declarationor payment of dividends. Further, our operations are primarily conducted by our subsidiary, Equity Bank, which is subject tosignificant regulation. Federal and state banking laws restrict the payment of dividends by banks to their holding companies andEquity Bank will be subject to these restrictions in paying dividends to us. Because our ability to receive dividends or loans fromEquity Bank is restricted, our ability to pay dividends to our stockholders is also restricted.
Additionally, the right of a bank holding company to participate in the assets of its subsidiary bank in the event of a bank-levelliquidation or reorganization is subject to the claims of the bank’s creditors, including depositors, which take priority, except to theextent that the holding company may be a creditor with a recognized claim.
Risks Relating to the Company’s Common Stock
The market price of our Class A common stock may be subject to substantial fluctuations which may make it difficult for youto sell your shares at the volumes, prices and times desired.
The trading price of our Class A common stock may be volatile, which may make it difficult for you to resell your shares at thevolume, prices and times desired. There are many factors that may impact the market price and trading volume of our Class Acommon stock, including:
• actual or anticipated fluctuations in our operating results, financial condition or asset quality;
• market conditions in the broader stock market in general or in our industry in particular;
• publication of research reports about us, our competitors or the bank and non-bank financial services industries generally,or changes in, or failure to meet, securities analysts’ estimates of our financial and operating performance, or lack ofresearch reports by industry analysts or ceasing of coverage;
• future issuances of our Class A common stock or other securities;
• significant acquisitions or business combinations, strategic partnerships, joint ventures or capital commitments by orinvolving our competitors or us;
• additions or departures of key personnel;
• trades of large blocks of our Class A common stock;
• economic and political conditions or events;
• regulatory developments; and
• other news, announcements or disclosures (whether by us or others) related to us, our competitors, our core markets or thebank and non-bank financial services industries.
The stock market and, in particular, the market for financial institution stocks, have experienced substantial fluctuations inrecent years, which in many cases have been unrelated to the operating performance and prospects of particular companies. Inaddition, significant fluctuations in the trading volume in our Class A common stock may cause significant price variations to occur.Increased market volatility may materially and adversely affect the market price of our Class A common stock, which could make itdifficult to sell your shares at the volume, prices and times desired.
In the past, following periods of volatility in the market price of our common stock, securities class action litigation has beeninstituted. Pending or future securities class action suits against us could result in significant liabilities and, regardless of the outcome,could result in substantial costs and the diversion of our management’s attention and resources.
42
The obligations associated with being a public company require significant resources and management attention.
As a public company, we face increased legal, accounting, administrative and other costs and expenses that are not incurred byprivate companies, particularly now that we are no longer an emerging growth company. We are subject to the reporting requirementsof the Exchange Act, which requires that we file annual, quarterly and current reports with respect to our business and financialcondition and proxy and other information statements, and the rules and regulations implemented by the SEC, the Sarbanes-OxleyAct, the Dodd-Frank Act, the PCAOB and the NASDAQ Stock Market LLC, each of which imposes additional reporting and otherobligations on public companies. As a public company, we are required to:
• prepare and distribute periodic reports, proxy statements and other stockholder communications in compliance with thefederal securities laws and rules;
• expand the roles and duties of our board of directors and committees thereof;
• maintain an enhanced internal audit function;
• institute more comprehensive financial reporting and disclosure compliance procedures;
• involve and retain to a greater degree outside counsel and accountants in the activities listed above;
• enhance our investor relations function;
• establish new internal policies, including those relating to trading in our securities and disclosure controls and procedures;
• retain additional personnel;
• comply with the NASDAQ Global Select Market listing standards; and
• comply with the Sarbanes-Oxley Act.
We expect these rules and regulations and changes in laws, regulations and standards relating to corporate governance andpublic disclosure, which have created uncertainty for public companies, to increase legal and financial compliance costs and makesome activities more time consuming and costly. These laws, regulations and standards are subject to varying interpretations, in manycases due to their lack of specificity and, as a result, their application in practice may evolve over time as new guidance is provided byregulatory and governing bodies. This could result in continuing uncertainty regarding compliance matters and higher costsnecessitated by ongoing revisions to disclosure and governance practices. Our investment in compliance with existing and evolvingregulatory requirements will result in increased administrative expenses and a diversion of management’s time and attention fromrevenue-generating activities to compliance activities, which could have a material adverse effect on our business, financial conditionand results of operations. These increased costs may require us to divert a significant amount of money that we could otherwise use toexpand our business and achieve our strategic objectives
We have not historically declared or paid cash dividends on our common stock and we do not expect to pay dividends on ourcommon stock in the foreseeable future. Consequently, your only opportunity to achieve a return on your investment is if the priceof our Class A common stock appreciates.
The holders of our common stock will receive dividends if and when declared by our board of directors out of legally availablefunds. Our board of directors has not declared a dividend on our common stock since our inception. Any future determinationrelating to our dividend policy will be made at the discretion of our board of directors and will depend on a number of factors,including our future earnings, capital requirements, financial condition, future prospects, regulatory restrictions and other factors thatour board of directors may deem relevant.
Our principal business operations are conducted through our subsidiary, Equity Bank. Cash available to pay dividends to ourstockholders is derived primarily, if not entirely, from dividends paid by Equity Bank to us. The ability of Equity Bank to paydividends to us, as well as our ability to pay dividends to our stockholders, will continue to be subject to and limited by, certain legaland regulatory restrictions. Further, any lenders making loans to us may impose financial covenants that may be more restrictive withrespect to dividend payments than the regulatory requirements.
If a substantial number of shares become available for sale and are sold in a short period of time, the market price of ourClass A common stock could decline.
If our existing stockholders sell substantial amounts of our Class A common stock in the public market, the market price of ourClass A common stock could decrease significantly. The perception in the public market that our existing stockholders might sellshares of Class A common stock could also depress our market price. A decline in the price of shares of our Class A common stock
43
might impede our ability to raise capital through the issuance of additional shares of our Class A common stock or other equitysecurities and could result in a decline in the value of the shares of our Class A common stock.
Securities analysts may not initiate or continue coverage on our Class A common stock, which could adversely affect themarket for our Class A common stock.
The trading market for our Class A common stock may depend in part on the research and reports that securities analystspublish about us and our business. We do not have any control over these securities analysts, and they may not cover our Class Acommon stock. If securities analysts do not cover our Class A common stock, the lack of research coverage may adversely affect ourmarket price. If we are covered by securities analysts and our Class A common stock is the subject of an unfavorable report, the priceof our Class A common stock may decline. If one or more of these analysts cease to cover us or fail to publish regular reports on us,we could lose visibility in the financial markets, which could cause the price or trading volume of our Class A common stock todecline.
The trading volume in our common stock is less than other larger financial institutions.
Although our Class A common stock is listed for trading on the Nasdaq Global Select Market, the trading volume in ourcommon stock is less than that of other, larger financial services companies. A public trading market having the desiredcharacteristics of depth, liquidity and orderliness depends on the presence in the marketplace of willing buyers and sellers of ourClass A common stock at any given time. This presence depends on the individual decisions of investors and general economic andmarket conditions over which we have no control. Given the lower trading volume of our Class A common stock, significant sales ofour Class A common stock or the expectation of these sales, could cause the price of our Class A common stock to decline.
Use of our common stock for future acquisitions or to raise capital may be dilutive to existing stockholders.
When we determine that appropriate strategic opportunities exist, we may acquire other financial institutions and relatedbusinesses, subject to applicable regulatory requirements. We may use our common stock for such acquisitions. We may also seek toraise capital for such acquisitions through selling additional common stock. It is possible that the issuance of additional commonstock in such acquisitions or capital transactions may be dilutive to the interests of our existing stockholders.
A future issuance of stock could dilute the value of our Class A common stock.
We may sell additional shares of Class A common stock, or securities convertible into or exchangeable for such shares, insubsequent public or private offerings. Future issuance of any new shares could cause further dilution in the value of our outstandingshares of Class A common stock. We cannot predict the size of future issuances of our Class A common stock, or securitiesconvertible into or exchangeable for such shares, or the effect, if any, that future issuances and sales of shares of our Class A commonstock will have on the market price of our Class A common stock. Sales of substantial amounts of our Class A common stock(including shares issued in connection with an acquisition), or the perception that such sales could occur, may adversely affectprevailing market prices of our Class A common stock.
We have significant institutional investors whose interests may differ from yours.
A significant portion of our outstanding equity is currently held by various investment funds. These funds could have asignificant level of influence because of their level of ownership and representation on our board of directors, including a greaterability than you and our other stockholders to influence the election of directors and the potential outcome of other matters submittedto a vote of our stockholders, such as mergers, the sale of substantially all of our assets and other extraordinary corporate matters andaffect the votes of our board of directors. These funds also have certain rights, such as access rights and registration rights that ourother stockholders do not have. The interests of these funds could conflict with the interests of our other stockholders, including you,and any future transfer by these funds of their shares of Class A common stock to other investors who have different businessobjectives could have a material adverse effect on our business, financial condition, results of operations and future prospects, and themarket value of our Class A common stock.
Our directors and executive officers beneficially own a significant portion of our Class A common stock and have substantialinfluence over us.
Our directors and executive officers, as a group, beneficially own a significant portion of our Class A common stock. As aresult of this beneficial ownership, our directors and executive officers have the ability, by taking coordinated action, to exercisesignificant influence over our affairs and policies. The interests of our directors and executive officers may not be consistent withyour interests as a stockholder. This influence may also have the effect of delaying or preventing changes of control, or changes in
44
management or limiting the ability of our other stockholders to approve transactions that they may deem to be in the best interests ofour Company.
Shares of our Class A common stock are not insured deposits and may lose value.
Shares of our Class A common stock are not savings or deposit accounts and are not insured by the FDIC’s DIF or any otheragency or private entity. Such shares are subject to investment risk, including the possible loss of some or all of the value of yourinvestment.
We have the ability to incur debt and pledge our assets, including our stock in Equity Bank, to secure that debt, and holdersof any such debt obligations will generally have priority over holders of our Class A common stock with respect to certain paymentobligations.
We have the ability to incur debt and pledge our assets to secure that debt. Absent special and unusual circumstances, a holderof indebtedness for borrowed money has rights that are superior to those of holders of Class A common stock. For example, interestmust be paid to the lender before dividends can be paid to stockholders and loans must be paid off before any assets can be distributedto stockholders if we were to liquidate. Furthermore, we would have to make principal and interest payments on our indebtedness,which could reduce our profitability or result in net losses on a consolidated basis.
If we fail to maintain an effective system of disclosure controls and procedures and internal control over financial reporting,we may not be able to accurately report our financial results or prevent fraud.
Our management is responsible for establishing and maintaining adequate internal control over financial reporting and forevaluating and reporting on that system of internal control. Our internal control over financial reporting is a process designed toprovide reasonable assurance regarding the reliability of financial reporting and the preparation of financial statements for externalpurposes in accordance with generally accepted accounting principles. Ensuring that we have adequate disclosure controls andprocedures in place, including internal control over financial reporting, so that we can produce accurate financial statements on atimely basis is costly and time-consuming and needs to be reevaluated frequently. As a public company, we are required to complywith the Sarbanes-Oxley Act and other rules that govern public companies. Our management is required to certify our compliancewith Section 404 of the Sarbanes-Oxley Act and to make annual assessments of the effectiveness of our internal control over financialreporting. In addition, our independent registered public accounting firm is required to report on the effectiveness of our internalcontrol over financial reporting.
Our management may conclude that our internal control over financial reporting is not effective due to our failure to cure anyidentified material weakness or otherwise. Moreover, even if our management concludes that our internal control over financialreporting is effective, our independent registered public accounting firm may not conclude that our internal control over financialreporting is effective. In the future, our independent registered public accounting firm may not be satisfied with our internal controlover financial reporting or the level at which our controls are documented, designed, operated or reviewed, or it may interpret therelevant requirements differently from us. In addition, during the course of the evaluation, documentation and testing of our internalcontrol over financial reporting, we may identify deficiencies in our internal control over financial reporting or disclosure controls.Any such deficiencies may also subject us to adverse regulatory consequences. If we fail to achieve and maintain the adequacy of ourinternal control over financial reporting or disclosure controls, as these standards are modified, supplemented or amended from time totime, we may be unable to report our financial information on a timely basis, we may not be able to conclude on an ongoing basis thatwe have effective internal control over financial reporting or disclosure controls and we may suffer adverse regulatory consequencesor violations of listing standards. There could also be a negative reaction in the financial markets due to a loss of investor confidencein the reliability of our financial statements.
Our corporate governance documents and certain corporate and banking laws applicable to us could make a takeover moredifficult.
Certain provisions of our Articles of Incorporation and our Bylaws and applicable corporate and federal banking laws, couldmake it more difficult for a third party to acquire control of us or conduct a proxy contest, even if those events were perceived bymany of our stockholders as beneficial to their interests. These provisions and the corporate and banking laws and regulationsapplicable to us, among others:
• empower our board of directors, without stockholder approval, to issue preferred stock, the terms of which, includingvoting power, are set by our board of directors;
• only permit stockholder action to be taken at an annual or special meeting of stockholders and not by written consent inlieu of such a meeting;
• provide for a classified board of directors, so that only approximately one-third of our directors are elected each year;

45
• prohibit us from engaging in certain business combinations with “interested stockholders” (generally defined as a holderof 15% or more of the corporation’s outstanding voting stock);
• require at least 120 days’ advance notice of nominations for the election of directors and the presentation of stockholderproposals at meetings of stockholders; and
• require prior regulatory application and approval of any transaction involving control of our organization.
These provisions may discourage potential acquisition proposals and could delay or prevent a change in control, including undercircumstances in which our stockholders might otherwise receive a premium over the market price of our shares.
Our board of directors may issue shares of preferred stock that would adversely affect the rights of our Class A commonstockholders.
Our authorized capital stock includes 10,000,000 shares of preferred stock of which none were issued and outstanding as ofMarch 9, 2021. Our board of directors, in its sole discretion, may designate and issue one or more series of preferred stock from theauthorized and unissued shares of preferred stock. Subject to limitations imposed by law or our Articles of Incorporation, our board ofdirectors is empowered to determine:
• the designation of, and the number of, shares constituting each series of preferred stock;
• the dividend rate for each series;
• the terms and conditions of any voting, conversion and exchange rights for each series;
• the amounts payable on each series on redemption or our liquidation, dissolution or winding-up;
• the provisions of any sinking fund for the redemption or purchase of shares of any series; and
• the preferences and the relative rights among the series of preferred stock.
We could issue preferred stock with voting and conversion rights that could adversely affect the voting power of the shares ofour Class A common stock and with preferences over our Class A common stock with respect to dividends and in liquidation.
The return on your investment in our Class A common stock is uncertain.
We cannot provide any assurance that an investor in our Class A common stock will realize a substantial return on his or herinvestment, or any return at all. Further, as a result of the uncertainty and risks associated with our operations, many of which aredescribed in this “Item 1A—Risk Factors” section, it is possible that an investor could lose his or her entire investment.
General Risks
We operate in a highly competitive industry and face significant competition from other financial institutions and financialservices providers that could decrease our growth or profits.
Consumer and commercial banking are highly competitive industries. Our market areas contain not only a large number ofcommunity and regional banks, but also a significant presence of the country’s largest commercial banks. We compete with otherstate and national financial institutions, as well as savings and loan associations, savings banks and credit unions, for deposits andloans. In addition, we compete with financial intermediaries, such as consumer finance companies, commercial finance companies,mortgage banking companies, insurance companies, securities firms, mutual funds and several government agencies, as well as majorretailers, all actively engaged in providing various types of loans and other financial services. Some of these competitors may have along history of successful operations in our market areas and greater ties to local businesses and more expansive banking relationships,as well as more established depositor bases, fewer regulatory constraints and lower cost structures than we do. Competitors withgreater resources may possess an advantage through their ability to maintain numerous banking locations in more convenient sites, toconduct more extensive promotional and advertising campaigns or to operate a more developed technology platform. Due to theirsize, many competitors may offer a broader range of products and services, as well as better pricing for certain products and servicesthan we can offer. For example, in the current low interest rate environment, competitors with lower costs of capital may solicit ourcustomers to refinance their loans with a lower interest rate. Further, increased competition among financial services companies dueto the recent consolidation of certain competing financial institutions may adversely affect our ability to market our products andservices. Technology has lowered barriers to entry and made it possible for banks to compete in our market areas without a retailfootprint by offering competitive rates and for non-banks to offer products and services traditionally provided by banks.
46
The financial services industry could become even more competitive as a result of legislative, regulatory and technologicalchanges and continued consolidation. Banks, securities firms and insurance companies can merge under the umbrella of a financialholding company, which can offer virtually any type of financial service, including banking, securities underwriting, insurance (bothagency and underwriting) and merchant banking.
Our ability to compete successfully depends on a number of factors, including:
• our ability to develop, maintain and build upon long-term customer relationships based on quality service and high ethicalstandards;
• our ability to attract and retain qualified employees to operate our business effectively;
• our ability to expand our market position;
• the scope, relevance and pricing of products and services that we offer to meet customer needs and demands;
• the rate at which we introduce new products and services relative to our competitors;
• customer satisfaction with our level of service; and
• industry and general economic trends.
Failure to perform in any of these areas could significantly weaken our competitive position, which could adversely affect ourgrowth and profitability, which, in turn, could harm our business, financial condition and results of operations.
As a community bank, our ability to maintain our reputation is critical to the success of our business, and the failure to do somay materially adversely affect our performance.
We are a community bank and our reputation is one of the most valuable components of our business. As such, we strive toconduct our business in a manner that enhances our reputation. This is done, in part, by recruiting, hiring and retaining employeeswho share our core values of being an integral part of the communities we serve, delivering superior service to our customers andcaring about our customers and associates. If our reputation is negatively affected by the actions of our employees or otherwise, ourbusiness and therefore, our operating results may be materially adversely affected. Further, negative public opinion can expose us tolitigation and regulatory action as we seek to implement our growth strategy.
We are subject to environmental risk in our lending activities.
Because a significant portion of our loan portfolio is secured by real property, we may foreclose upon and take title to suchproperty in the ordinary course of business. If hazardous substances are found on such property, we could be liable for remediationcosts, as well as for personal injury and property damage. Environmental laws might require us to incur substantial expenses,materially reduce the property’s value or limit our ability to use or sell the property. Although management has policies requiringenvironmental reviews before loans secured by real property are made and before foreclosure is commenced, it is still possible thatenvironmental risks might not be detected and that the associated costs might have a material adverse effect on our financial conditionand results of operations.
Adverse weather or man-made events could negatively affect our markets or disrupt our operations, which could have anadverse effect upon our business and results of operations.
A significant portion of our business is generated in our Arkansas, Kansas, Missouri and Oklahoma markets, which have been,and may continue to be, susceptible to natural disasters, such as tornadoes, droughts, floods and other severe weather events. Thesenatural disasters could negatively impact regional economic conditions, cause a decline in the value or destruction of mortgagedproperties and increase the risk of delinquencies, foreclosures or loss on loans originated by us, damage our banking facilities andoffices and negatively impact our growth strategy. Such weather events could disrupt operations, result in damage to properties andnegatively affect the local economies in the markets where we operate. We cannot predict whether, or to what extent, damage thatmay be caused by future weather or man-made events will affect our operations or the economies in our current or future market areas,but such events could negatively impact economic conditions in these regions and result in a decline in local loan demand and loanoriginations, a decline in the value or destruction of properties securing our loans and an increase in delinquencies, foreclosures orloan losses. Our business or results of operations may be adversely affected by these and other negative effects of natural or man-made disasters. Further, severe weather, natural disasters, acts of war or terrorism and other external events could adversely affect usin a number of ways, including an increase in delinquencies, bankruptcies or defaults that could result in a higher level ofnonperforming assets, net charge-offs and provision for loan losses. Such risks could also impair the value of collateral securing loansand hurt our deposit base.
47
We are or may become involved from time to time in suits, legal proceedings, information-gathering requests, investigationsand proceedings by governmental and self-regulatory agencies that may lead to adverse consequences.
Many aspects of our business involve substantial risk of legal liability. We have been named or threatened to be named asdefendants in various lawsuits arising from our business activities (and in some cases from the activities of companies that we haveacquired) including, but not limited to, consumer residential real estate mortgages. In addition, from time to time, we are, or maybecome, the subject of governmental and self-regulatory agency information-gathering requests, reviews, investigations andproceedings and other forms of regulatory inquiry, including by bank regulatory agencies, the Consumer Financial Protection Bureau,the SEC and law enforcement authorities. The results of such proceedings could lead to significant civil or criminal penalties,including monetary penalties, damages, adverse judgments, settlements, fines, injunctions, restrictions on the way in which weconduct our business or reputational harm.
We are subject to claims and litigation pertaining to intellectual property.
We rely on technology companies to provide information technology products and services necessary to support our day-to-dayoperations. Technology companies frequently enter into litigation based on allegations of patent infringement or other violations ofintellectual property rights. In addition, patent holding companies seek to monetize patents they have purchased or otherwiseobtained. Competitors of our vendors, or other individuals or companies, have from time to time claimed to hold intellectual propertysold to us by its vendors. Such claims may increase in the future as the financial services sector becomes more reliant on informationtechnology vendors. The plaintiffs in these actions frequently seek injunctions and substantial damages.
Regardless of the scope or validity of such patents or other intellectual property rights, or the merits of any claims by potentialor actual litigants, we may have to engage in litigation that could be expensive, time-consuming, disruptive to our operations anddistracting to management. If we are found to infringe one or more patents or other intellectual property rights, we may be required topay substantial damages or royalties to a third-party. In certain cases, we may consider entering into licensing agreements for disputedintellectual property, although no assurance can be given that such licenses can be obtained on acceptable terms or that litigation willnot occur. These licenses may also significantly increase our operating expenses. If legal matters related to intellectual propertyclaims were resolved against us or settled, we could be required to make payments in amounts that could have a material adverseeffect on our business, financial condition and results of operations.
We have pledged all of the stock of Equity Bank as collateral for a loan, and if the lender forecloses, you could lose yourinvestment.
We have pledged all of the stock of Equity Bank as collateral for a third-party loan, which had no balance as of December 31,2020. This loan has a maximum lending commitment of $40.0 million. If we were to default on this indebtedness, the lender of suchloan could foreclose on Equity Bank’s stock and we would lose our principal asset. In that event, if the value of Equity Bank’s stockis less than the amount of the indebtedness, you would lose the entire amount of your investment.
We have outstanding subordinated debt obligations, and if the Company defaults on those obligations, the debt holders couldlose their investment.
In the event of default, the Company’s senior debt holders will be entitled to receive payment in full prior to payment ofsubordinated debt holders. If the company’s distributable assets in the event of default can only repay the senior debt holders thesubordinated debt holders could lose their investment.
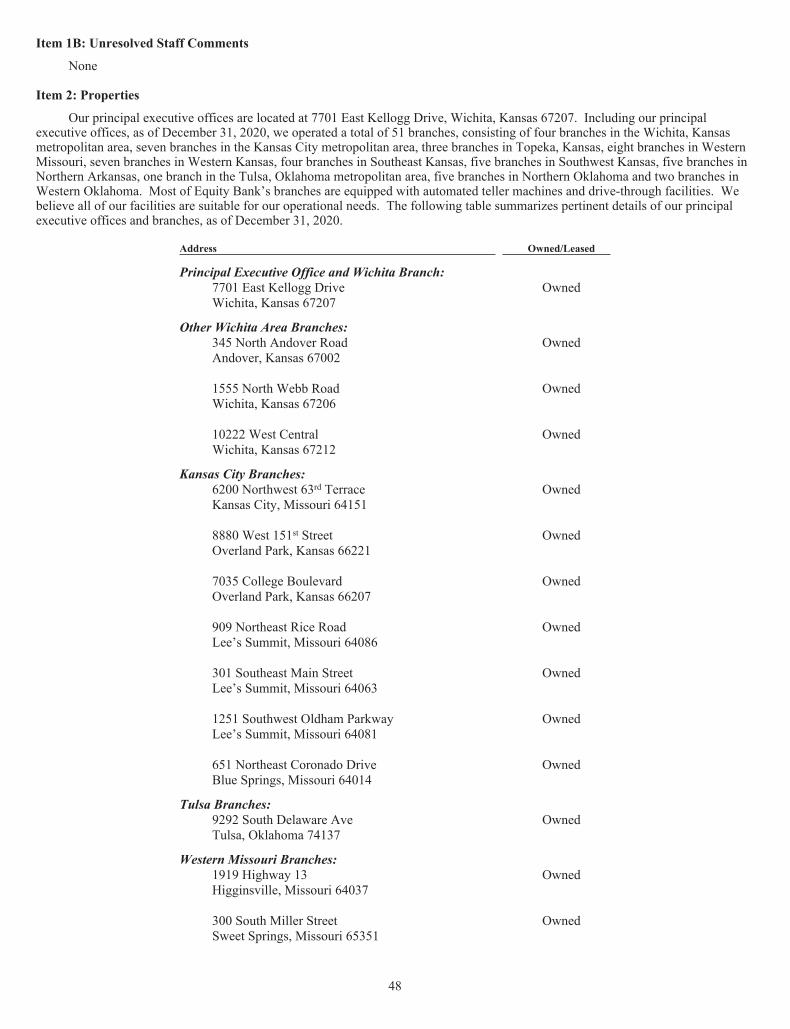
48
Item 1B: Unresolved Staff Comments
None
Item 2: Properties
Our principal executive offices are located at 7701 East Kellogg Drive, Wichita, Kansas 67207. Including our principalexecutive offices, as of December 31, 2020, we operated a total of 51 branches, consisting of four branches in the Wichita, Kansasmetropolitan area, seven branches in the Kansas City metropolitan area, three branches in Topeka, Kansas, eight branches in WesternMissouri, seven branches in Western Kansas, four branches in Southeast Kansas, five branches in Southwest Kansas, five branches inNorthern Arkansas, one branch in the Tulsa, Oklahoma metropolitan area, five branches in Northern Oklahoma and two branches inWestern Oklahoma. Most of Equity Bank’s branches are equipped with automated teller machines and drive-through facilities. Webelieve all of our facilities are suitable for our operational needs. The following table summarizes pertinent details of our principalexecutive offices and branches, as of December 31, 2020.
Address Owned/Leased
Principal Executive Office and Wichita Branch:7701 East Kellogg DriveWichita, Kansas 67207
Owned
Other Wichita Area Branches:345 North Andover RoadAndover, Kansas 67002
Owned
1555 North Webb RoadWichita, Kansas 67206
Owned
10222 West CentralWichita, Kansas 67212
Owned
Kansas City Branches:6200 Northwest 63rd TerraceKansas City, Missouri 64151
Owned
8880 West 151st StreetOverland Park, Kansas 66221
Owned
7035 College BoulevardOverland Park, Kansas 66207
Owned
909 Northeast Rice RoadLee’s Summit, Missouri 64086
Owned
301 Southeast Main StreetLee’s Summit, Missouri 64063
Owned
1251 Southwest Oldham ParkwayLee’s Summit, Missouri 64081
Owned
651 Northeast Coronado DriveBlue Springs, Missouri 64014
Owned
Tulsa Branches:9292 South Delaware AveTulsa, Oklahoma 74137
Owned
Western Missouri Branches:1919 Highway 13Higginsville, Missouri 64037
Owned
300 South Miller StreetSweet Springs, Missouri 65351
Owned
49
Address Owned/Leased
612 North MaguireWarrensburg, Missouri 64093
Owned
200 North State StreetKnob Noster, Missouri 65336
Owned
920 Thompson BoulevardSedalia, Missouri 65301
Owned
504 West Benton StreetWindsor, Missouri 65360
Owned
615 East Ohio StreetClinton, Missouri 64735
Owned
100 East Main StreetWarsaw, Missouri 65355
Owned
Topeka Branches:701 South Kansas AvenueTopeka, Kansas 66603
Owned
507 West 8th StreetTopeka, Kansas 66603
Owned
3825 Southwest 29th StreetTopeka, Kansas 66614
Owned
Western Kansas Branches:2428 Vine StreetHays, Kansas 67601
Owned
916 Washington StreetEllis, Kansas 67637
Owned
745 Main StreetHoxie, Kansas 67740
Owned
300 Highway 212Quinter, Kansas 67752
Owned
106 South Adams StreetGrinnell, Kansas 67738
Owned
302 East HolmeNorton, Kansas 67654
Owned
500 Main StreetAlmena, Kansas 67622
Owned
Southeast Kansas Branches:902 McArthur RdCoffeyville, Kansas 67337
Owned
112 East Myrtle StreetIndependence, Kansas 67301
Owned
801 MainNeodesha, Kansas 66757
Owned

50
Address Owned/Leased
102 North Broadway StreetPittsburg, Kansas 66762
Owned
Southwest Kansas Branches:502 South Jackson StreetHugoton, Kansas 67951
Owned
1700 North Lincoln AvenueLiberal, Kansas 67901
Owned
23 West 4th StreetLiberal, Kansas 67901
Owned
930 South Kansas AvenueLiberal, Kansas 67901
Owned
250 East Tucker RoadLiberal, Kansas 67901
Leased
Northern Arkansas Branches:200 East Ridge AvenueHarrison, Arkansas 72601
Owned
1304 Highway 62/65 North(1)Harrison, Arkansas 72601
Leased
911 West Trimble AvenueBerryville, Arkansas 72616
Owned
107 West Van BurenEureka Springs, Arkansas 72632
Leased
198 Slack StreetPea Ridge, Arkansas 72751
Owned
Northern Oklahoma Branches:222 East Grand AvenuePonca City, Oklahoma 74601
Leased
802 East Prospect AvenuePonca City, Oklahoma 74601
Owned
1417 East Hartford AvenuePonca City, Oklahoma 74604
Leased
102 South Main StreetNewkirk, Oklahoma 74647
Owned
110 East 1st StreetCordell, Oklahoma 73632
Owned
Western Oklahoma Branches:601 North Main StreetGuymon, Oklahoma 73942
Owned
2602 North Highway 64Guymon, Oklahoma 73942
Leased
(1)The building at this location is owned but the land is on a long term lease expiring in January 2030.

51
Item 3: Legal Proceedings
From time to time we are party to various litigation matters incidental to the conduct of our business. See “NOTE 23 – LEGALMATTERS” of the Notes to Consolidated Financial Statements under Item 8 to this Annual Report on Form 10-K for a completediscussion of litigation matters.
Item 4: Mine Safety Disclosures
Not applicable.
52
Part II
Item 5: Market for Registrant’s Common Equity, Related Stockholder Matters and Issuer Purchases of Equity Securities
Market Information and Common Equity Holders
Our common stock is listed on the NASDAQ Global Select Markets under the symbol “EQBK”. At February 28, 2021, therewere 14,448,847 shares of our Class A common stock, outstanding and 237 stockholders of record for the Company’s Class Acommon stock. At February 28, 2021, no shares of our Class B common stock were outstanding.
Dividend Policy
We have not historically declared or paid cash dividends on our common stock. Instead, we anticipate that all of our futureearnings will be retained to support our operations and to finance the growth and development of our business. Any futuredetermination to pay dividends on our common stock will be made by our board of directors and will depend on a number of factors,including:
• our historical and projected financial condition, liquidity and results of operations;
• our capital levels and requirements;
• statutory and regulatory prohibitions and other limitations;
• any contractual restriction on our ability to pay cash dividends, including pursuant to the terms of any of our creditagreements or other borrowing arrangements;
• our business strategy;
• tax considerations;
• any acquisitions or potential acquisitions that we may examine;
• general economic conditions; and
• other factors deemed relevant by our board of directors.
We are not obligated to pay dividends on our common stock.
As a Kansas corporation, we are subject to certain restrictions on dividends under the Kansas General Corporation Code.Generally, a Kansas corporation may pay dividends to its stockholders out of its surplus or, if there is no surplus, out of its net profitsfor the fiscal year in which the dividend is declared or the preceding fiscal year, or both. In addition, if the capital of a Kansascorporation is diminished by depreciation in the value of its property, or by losses or otherwise, to an amount less than the aggregateamount of the capital represented by the issued and outstanding stock of all classes having a preference upon the distribution of assets,the directors of such corporation cannot declare and pay out of such net profits any dividends upon any shares of any classes of itscapital stock until the deficiency in the amount of capital represented by the issued and outstanding stock of all classes having apreference upon the distribution of assets is repaired. We are also subject to certain restrictions on the payment of cash dividends as aresult of banking laws, regulations and policies. For more information, see “Item 1 – Supervision and Regulation – BankingRegulation – Standards for Safety and Soundness.”
Since we are a bank holding company and do not engage directly in business activities of a material nature, our ability to paydividends to our stockholders depends, in large part, upon our receipt of dividends from Equity Bank, which is also subject tonumerous limitations on the payment of dividends under federal and state banking laws, regulations and policies. The present andfuture dividend policy of Equity Bank is subject to the discretion of its board of directors. Equity Bank is not obligated to paydividends. At December 31, 2020, Equity Bank has a negative retained earnings balance, primarily due to a goodwill impairmentcharge recorded during 2020, which would require Equity Bank to obtain regulatory approval to pay a dividend up to the bank holdingcompany.

53
If Equity Bank is “significantly undercapitalized” under the applicable federal bank capital standards, or if Equity Bank is“undercapitalized” and has failed to submit an acceptable capital restoration plan or has materially failed to implement such a plan, theFDIC may choose to require Equity Bank to receive prior approval from the Federal Reserve for any capital distribution. In addition,Equity Bank generally is prohibited from making a capital distribution if such distribution would cause Equity Bank to be“undercapitalized” under applicable federal bank capital standards. For more information, see “Item 7 – Supervision and Regulation –Banking Regulation – Standards for Safety and Soundness.”
Securities Authorized for Issuance Under Equity Compensation Plans
The following table presents shares of our common stock that may be issued with respect to compensation plans atDecember 31, 2020.
Plan category
Number ofsecurities to beissued uponexercise ofoutstanding
options, warrantsand rights
(a)
Weighted averageexercise priceof outstanding
options, warrantsand rights
(b)
Number ofsecurities remainingavailable for futureissuance under
equity compensationplans (excludingsecurities reflected
in column a)(c)
Equity compensation plans approved by securityholders - stock options 601,333 $ 25.61 *
Equity compensation plans approved by securityholders - restricted stock units 261,078 — *
Total Equity compensation plans available underthe Amended and Restated 2013 Stock IncentivePlan 862,411 497,501
Equity compensation plans approved by securityholders - employee stock purchase plan — — 446,186
Total Equity compensation plans approved bysecurity holders 862,411 943,687
Equity compensation plans not approved bysecurity holders(1) 150,000 12.00 —
Total 1,012,411 $ 22.89 943,687
* All securities remaining available for future issuance were available under our Amended and Restated 2013 Stock IncentivePlan as of December 31, 2020.
(1) Includes 150,000 options to purchase common stock outstanding under our 2006 Non-Qualified Stock Option Plan. Nosecurities remained available for future issuance under our 2006 Non-Qualified Stock Option Plan.

54
Performance Graph
The following performance graph compares total stockholders’ return on the Company’s common stock for the period beginningat the close of trading November 11, 2015 to December 31, 2020, with the cumulative total return of the NASDAQ Composite Indexand the NASDAQ Bank Index for the same period. Cumulative total return is computed by dividing the difference between theCompany’s share price at the end and the beginning of the measurement period by the share price at the beginning of the measurementperiod. The performance graph assumes $100 is invested on November 11, 2015, in the Company’s common stock, the NASDAQComposite Index and the NASDAQ Bank Index. Historical stock price performance is not necessarily indicative of future stock priceperformance.
Recent Sales of Unregistered Equity Securities
None
Purchases of equity securities by the issuer and affiliated purchasers
Repurchase of Common Stock
On October 22, 2020, the Federal Reserve Bank of Kansas City advised the Company that it had no objection to the Company’sauthorization of its repurchase of up to an additional 800,000 shares of the Company’s Class A Voting Common Stock, par value$0.01 per share, from time to time, beginning October 30, 2020, and concluding October 29, 2021.
The following table presents shares that were repurchased under this program.
Period
Total Numberof SharesPurchased
Average PricePaid perShare
Total Numberof Shares
Purchased asPart of
RepurchasePlan
MaximumNumber ofShares ThatMay Yet BePurchasedUnder the
PlanOctober 1, 2020 through October 31, 2020 — $ — — 800,000November 1, 2020 through November 30, 2020 131,786 20.26 131,786 668,214December 1, 2020 through December 31, 2020 181,445 21.23 181,445 486,769Total 313,231 $ 20.82 313,231 486,769

55
Item 6: Selected Financial Data
The following table sets forth selected historical consolidated financial and other data as of and for the years endedDecember 31, 2020, 2019, 2018, 2017 and 2016. Our historical results are not necessarily indicative of any future period. Theperformance and certain capital ratios are unaudited and derived from our audited and unaudited financial statements as of and for theperiods presented. Average balances have been calculated using daily averages, unless otherwise denoted.
You should read the selected consolidated financial data set forth below in conjunction with “Item 7 – Management’sDiscussion and Analysis of Financial Condition and Results of Operations” and our consolidated financial statements and the relatednotes included elsewhere in this Annual Report on Form 10-K.
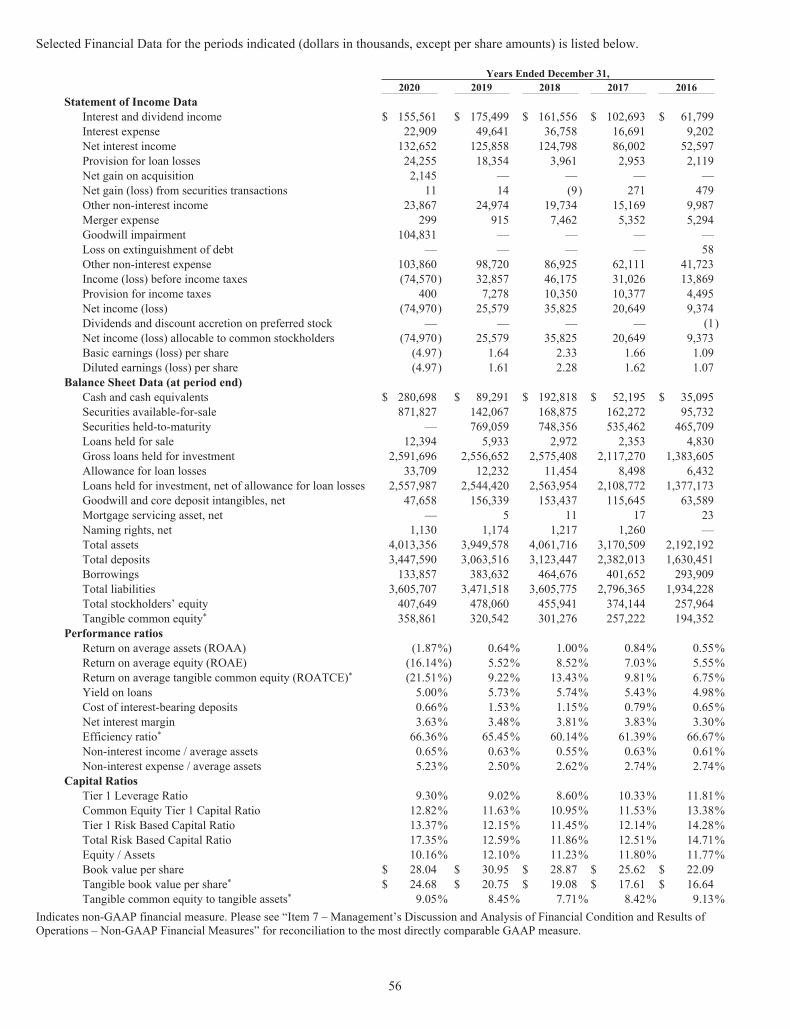
56
Selected Financial Data for the periods indicated (dollars in thousands, except per share amounts) is listed below.
Years Ended December 31,2020 2019 2018 2017 2016
Statement of Income DataInterest and dividend income $ 155,561 $ 175,499 $ 161,556 $ 102,693 $ 61,799Interest expense 22,909 49,641 36,758 16,691 9,202Net interest income 132,652 125,858 124,798 86,002 52,597Provision for loan losses 24,255 18,354 3,961 2,953 2,119Net gain on acquisition 2,145 — — — —Net gain (loss) from securities transactions 11 14 (9) 271 479Other non-interest income 23,867 24,974 19,734 15,169 9,987Merger expense 299 915 7,462 5,352 5,294Goodwill impairment 104,831 — — — —Loss on extinguishment of debt — — — — 58Other non-interest expense 103,860 98,720 86,925 62,111 41,723Income (loss) before income taxes (74,570) 32,857 46,175 31,026 13,869Provision for income taxes 400 7,278 10,350 10,377 4,495Net income (loss) (74,970) 25,579 35,825 20,649 9,374Dividends and discount accretion on preferred stock — — — — (1)Net income (loss) allocable to common stockholders (74,970) 25,579 35,825 20,649 9,373Basic earnings (loss) per share (4.97) 1.64 2.33 1.66 1.09Diluted earnings (loss) per share (4.97) 1.61 2.28 1.62 1.07
Balance Sheet Data (at period end)Cash and cash equivalents $ 280,698 $ 89,291 $ 192,818 $ 52,195 $ 35,095Securities available-for-sale 871,827 142,067 168,875 162,272 95,732Securities held-to-maturity — 769,059 748,356 535,462 465,709Loans held for sale 12,394 5,933 2,972 2,353 4,830Gross loans held for investment 2,591,696 2,556,652 2,575,408 2,117,270 1,383,605Allowance for loan losses 33,709 12,232 11,454 8,498 6,432Loans held for investment, net of allowance for loan losses 2,557,987 2,544,420 2,563,954 2,108,772 1,377,173Goodwill and core deposit intangibles, net 47,658 156,339 153,437 115,645 63,589Mortgage servicing asset, net — 5 11 17 23Naming rights, net 1,130 1,174 1,217 1,260 —Total assets 4,013,356 3,949,578 4,061,716 3,170,509 2,192,192Total deposits 3,447,590 3,063,516 3,123,447 2,382,013 1,630,451Borrowings 133,857 383,632 464,676 401,652 293,909Total liabilities 3,605,707 3,471,518 3,605,775 2,796,365 1,934,228Total stockholders’ equity 407,649 478,060 455,941 374,144 257,964Tangible common equity* 358,861 320,542 301,276 257,222 194,352
Performance ratiosReturn on average assets (ROAA) (1.87%) 0.64% 1.00% 0.84% 0.55%Return on average equity (ROAE) (16.14%) 5.52% 8.52% 7.03% 5.55%Return on average tangible common equity (ROATCE)* (21.51%) 9.22% 13.43% 9.81% 6.75%Yield on loans 5.00% 5.73% 5.74% 5.43% 4.98%Cost of interest-bearing deposits 0.66% 1.53% 1.15% 0.79% 0.65%Net interest margin 3.63% 3.48% 3.81% 3.83% 3.30%Efficiency ratio* 66.36% 65.45% 60.14% 61.39% 66.67%Non-interest income / average assets 0.65% 0.63% 0.55% 0.63% 0.61%Non-interest expense / average assets 5.23% 2.50% 2.62% 2.74% 2.74%
Capital RatiosTier 1 Leverage Ratio 9.30% 9.02% 8.60% 10.33% 11.81%Common Equity Tier 1 Capital Ratio 12.82% 11.63% 10.95% 11.53% 13.38%Tier 1 Risk Based Capital Ratio 13.37% 12.15% 11.45% 12.14% 14.28%Total Risk Based Capital Ratio 17.35% 12.59% 11.86% 12.51% 14.71%Equity / Assets 10.16% 12.10% 11.23% 11.80% 11.77%Book value per share $ 28.04 $ 30.95 $ 28.87 $ 25.62 $ 22.09Tangible book value per share* $ 24.68 $ 20.75 $ 19.08 $ 17.61 $ 16.64Tangible common equity to tangible assets* 9.05% 8.45% 7.71% 8.42% 9.13%
Indicates non-GAAP financial measure. Please see “Item 7 – Management’s Discussion and Analysis of Financial Condition and Results ofOperations – Non-GAAP Financial Measures” for reconciliation to the most directly comparable GAAP measure.

57
Item 7: Management’s Discussion and Analysis of Financial Condition and Results of Operations
The following discussion and analysis of our financial condition and results of operations should be read in conjunction withour audited consolidated financial statements and the accompanying notes included elsewhere in this Annual Report on Form 10-K.The following discussion contains �forward-looking statements� that reflect our future plans, estimates, beliefs and expectedperformance. We caution that assumptions, expectations, projections, intentions or beliefs about future events may, and often do, varyfrom actual results and the differences can be material. See �Cautionary Statement Regarding Forward-Looking Statements.� Also,see the risk factors and other cautionary statements described under the heading �Item 1A � Risk Factors� included in Item 1A of thisAnnual Report on Form 10-K. We do not undertake any obligation to publicly update any forward-looking statements except asotherwise required by applicable law.
This discussion and analysis of our financial condition and results of operation includes the following sections:
• Overview
• Critical Accounting Policies – a discussion of accounting policies that require critical estimates and assumptions;
• Results of Operations – an analysis of our operating results, including disclosures about the sustainability of our earnings;
• Financial Condition – an analysis of our financial position;
• Liquidity and Capital Resources – an analysis of our cash flows and capital position; and
• Non-GAAP Financial Measures – reconciliation of non-GAAP measures.
Overview
We are a bank holding company headquartered in Wichita, Kansas. Our wholly-owned banking subsidiary, Equity Bank,provides a broad range of financial services primarily to businesses and business owners as well as individuals through our network of51 full-service branches located in Arkansas, Kansas, Missouri and Oklahoma. As of December 31, 2020, we had, on a consolidatedbasis, total assets of $4.01 billion, total deposits of $3.45 billion, total loans held for investment, net of allowances, of $2.56 billionand total stockholders’ equity of $407.6 million. Primarily due to a goodwill impairment charge of $104.8 million during the thirdquarter of 2020, net loss for the year ended December 31, 2020, was $75.0 million compared to net income of $25.6 million for theprior year ended December 31, 2019.
History and Background
From 2003 through 2020, we completed a series of eighteen acquisitions and two charter consolidations. We seek to integratethe banks we acquire into our existing operational platform and enhance stockholder value through the creation of efficiencies withinthe combined operations. In conjunction with our strategic acquisition growth, we strive to reposition and improve the loan portfolioand deposit mix of the banks we acquire. Following our acquisitions, we focus on identifying and disposing of problematic loans andreplacing them with higher quality loans generated organically. In addition, we concentrate on growth in our commercial loanportfolio, which we believe generally offers higher return opportunities than our consumer loan portfolio, primarily by hiringadditional talented bankers, particularly in our metropolitan markets, and incentivizing our bankers to expand their commercialbanking relationships. We also seek to increase our most attractive deposit accounts primarily by growing deposits in our communitymarkets and cross selling our depository products to our loan customers.
Our principal objective is to continually increase stockholder value and generate consistent earnings growth by expanding ourcommercial banking franchise both organically and through strategic acquisitions. We believe our strategy of selectively acquiringand integrating community banks has provided us with economies of scale and improved our overall franchise efficiency. We expectto continue to pursue strategic acquisitions and believe our targeted market areas present us with many and varied acquisitionopportunities. We are also focused on continuing to grow organically and believe the markets in which we operate currently providemeaningful opportunities to expand our commercial customer base and increase our current market share. We believe our geographicfootprint, which is strategically split between growing metropolitan markets, such as Kansas City, Tulsa and Wichita, and stablecommunity markets within Western Kansas, Western Missouri, Topeka, Northern Arkansas and Northern Oklahoma, provides us withaccess to low cost stable core deposits in community markets that we can use to fund commercial loan growth in our metropolitanmarkets. We strive to provide an enhanced banking experience for our customers by providing them with a comprehensive suite ofsophisticated banking products and services tailored to meet their needs, while delivering the high-quality relationship-based customerservice of a community bank.

58
Highlights for the Year Ended December 31, 2020
• Net interest income of $132.7 million for the year ended December 31, 2020, compared to net interest income of $125.9million for the year ended December 31, 2019, an increase of $6.8 million, or 5.4%.
• Total loans held for investment of $2.59 billion at December 31, 2020, compared to $2.56 billion at December 31, 2019,an increase of $35.0 million, or 1.4%.
• Total deposits of $3.45 billion at December 31, 2020, compared to $3.06 billion at December 31, 2019, an increase of$384.1 million, or 12.5%.
• Total assets of $4.01 billion at December 31, 2020, compared to $3.95 billion at December 31, 2019, an increase of $63.8million, or 1.6%.
• Tangible book value per common share of $24.68 at December 31, 2020, compared to $20.75 at December 31, 2019, anincrease of $3.93, or 18.9%.
We completed our purchase of assets and assumption of deposits of Almena State Bank (“Almena”), facilitated by the FDIC,consisting of one branch location in Norton, Kansas, and one branch location in Almena, Kansas, on October 23, 2020. At closing,this transaction included total assets of $66.9 million, net loans of $31.4 million and total deposits of $62.5 million.
The COVID-19 pandemic has caused economic and social disruption on an unprecedented scale. While some industries havebeen impacted more severely than others, all businesses have been impacted to some degree. This disruption has resulted in theshuttering of businesses across the country, significant job loss and aggressive measures by federal, state and local government.
Congress, the President and the Federal Reserve have taken several actions designed to cushion the economic fallout. Mostnotably, the Coronavirus Aid, Relief and Economic Security Act (“CARES Act”) was signed into law on March 27, 2020, as a $2trillion legislative package. The goal of the CARES Act is to prevent a severe economic downturn through various measures,including direct financial aid to American families and economic stimulus to significantly impacted industry sectors. The packagealso included extensive emergency funding for hospitals and medical providers. In addition to the general impact of COVID-19,certain provisions of the CARES Act as well as other recent legislative and regulatory relief efforts have had or are expected to have amaterial impact on the Company’s operations. As a result of the COVID-19 pandemic and the related adverse local and nationaleconomic consequences, the Company is subject to many risks, including but not limited to:
• credit losses resulting from financial stress being experienced by the Company’s borrowers as a result of the pandemicand related governmental actions (including risks related to the Paycheck Protection Program or PPP, under theCARES Act and related credit risks resulting from PPP lending due to forbearance or failure of customers to qualify forloan forgiveness);
• collateral for loans, such as real estate, may continue to decline in value, which could cause credit losses to increase;• increased demands on capital and liquidity;• the risk that the Company’s net interest income, lending activities, deposits, swap activities, and profitability may be
negatively affected by volatility of interest rates caused by uncertainties stemming from the pandemic; and• cybersecurity and information security risks as the result of an increase in the number of employees working remotely.
Financial Position and Results of Operations: COVID-19 has had a material impact on the Company’s allowance for loanlosses. While to date there have been no significant charge-offs related to COVID-19, the allowance for loan losses calculation andresulting provision for loan losses have been significantly impacted by changes in economic conditions. Given that economicscenarios have become less certain since the pandemic was declared in early March, management believes the need for additionalallowance for loan losses has increased significantly. For additional information see “NOTE 4 – LOANS AND ALLOWANCE FORLOAN LOSSES” in the Notes to Consolidated Financial Statements. Should economic conditions worsen, the Company couldexperience further increases in the required allowance for loan losses and record additional provision for loan losses expense. Theexecution of the payment deferral program discussed in the following commentary improved the ratio of past due loans to total loans.It is possible that asset quality measures could worsen at future measurement periods if the effects of COVID-19 are prolonged.
The Company’s interest and fee income could be reduced due to COVID-19. In keeping with guidance from regulators, theCompany is actively working with COVID-19 affected borrowers to defer their payments, interest and fees. While interest and feeswill still accrue to income, through normal GAAP accounting, should eventual credit losses on these deferred payments emerge,interest income and fees accrued would need to be reversed. In such a scenario, interest income in future periods could be negativelyimpacted. At this time, the Company is unable to project the materiality of such an impact but recognizes the breadth of the economicimpact may affect borrowers’ ability to repay in future periods.

59
Capital and Liquidity: As of December 31, 2020, all the Company’s capital ratios and Equity Bank’s capital ratios were inexcess of all regulatory requirements. While currently classified as well capitalized, an extended economic recession brought about byCOVID-19 could adversely impact reported and regulatory capital ratios by further credit losses. The Company relies on cash onhand as well as dividends from Equity Bank to service our debt. If Equity Bank’s capital deteriorates such that it is unable to paydividends to the Company for an extended period, the Company may not be able service its debt.
The Company maintains access to multiple sources of liquidity. Wholesale funding markets have remained open to theCompany, but rates for short term funding may be volatile. If funding costs are elevated for an extended period, it could have anadverse effect on net interest margin. If an extended recession caused large numbers of deposit customers to withdraw their funds, theCompany might become more reliant on volatile or more expensive sources of funding.
Our Processes, Controls and Business Continuity Plan: In early March 2020, management successfully deployed a modifiedworking strategy, including emphasis on social distancing and remote work as necessary to emphasize the safety of the Company’steams and continuity of business processes. The Company and its leaders provided timely communications to team members andcustomers, implemented protocols for team member safety and initiated strategies for monitoring and responding to local COVID-19impacts – including customer relief efforts. The Company’s preparedness efforts, coupled with quick and decisive planimplementation, resulted in minimal impacts to operations as a result of COVID-19. Prior technology planning resulted in thesuccessful deployment of a portion of the operational team to a remote environment, while the remainder of the team continued towork on location in a workspace emphasizing social distancing. To achieve implementation of the working strategy, during the firstquarter of 2020, the Company incurred a minimal amount of technology spending to provide additional laptops to team members whorequired them to work remotely. Since early May 2020, all the Company’s bank locations have been open to customers with socialdistancing measures in place. The Company continues to serve customers curbside and drive-through but offers full lobby accessduring normal hours. No material operational or internal control challenges or risks have been identified to date. The Companycontinues to anticipate and respond to any future COVID-19 interruptions or developments. As of December 31, 2020, the Companydoes not anticipate significant challenges to our ability to maintain systems and controls considering the measures we have taken toprevent the spread of COVID-19. The Company does not currently face any material resource constraint through the implementationof the business continuity plans.
Lending Operations and Accommodations to Borrowers: In keeping with regulatory guidance to work with borrowers duringthis unprecedented situation, the Company executed a payment deferral program for our commercial lending clients that wereadversely affected by the pandemic. Depending on the demonstrated need of the client, the Company originally deferred either thefull loan payment or the principal component of the loan payment for 90 or 180 days. Loans originally deferred for 90 days may,dependent on specific qualifications, be approved for an additional 90-day deferral. In accordance with interagency guidance issued inMarch 2020, these short-term deferrals are not automatically considered troubled debt restructurings, are not reflected in past due loanbalances and have not been reported as a classified loan solely due to a deferral. Subsequent loan deferrals were assessed for troubleddebt restructuring classification in accordance with section 4013 of the CARES Act, or in accordance with interagency guidance, andif certain criteria were met the deferred loan was not classified as a troubled debt restructuring. The Company has made subsequentloan deferrals that have qualified under section 4013 of the CARES Act and these deferred loans were not classified as troubled debtrestructurings. Deferred loans are subject to ongoing monitoring and will be downgraded or placed on nonaccrual if noted repaymentweaknesses exist. As of December 31, 2020, the Company had 28 loans, totaling $60.9 million, that have been granted a paymentdeferral, and remain on deferral, as part of our COVID-19 response.
We have been an active participant in all phases of the Paycheck Protection Program (“PPP”), administered by the SmallBusiness Administration (“SBA”), and we helped many of our customers obtain loans through the program. PPP loans generally havea two-year term and earn interest at 1.0%. As of December 31, 2020, the Company has 1,612 loans, with an outstanding balance of$253.7 million that were originated under this program. It is the Company’s understanding that loans funded through the PPPprogram are fully guaranteed by the U.S. government. Should those circumstances change, the Company could be required toestablish additional allowance for loan losses through additional provision for loan losses expense charged to earnings.
The Company also participates in the Main Street Lending Program (“MSL Program”), created by the Federal Reserve tosupport lending to small and medium-sized businesses and nonprofit organizations that were in sound financial condition before theonset of the COVID-19 pandemic. There was a total of $14.1 million outstanding under the MSL Program for the period endedDecember 31, 2020.
Credit: While all industries have and will continue to experience adverse impacts as a result of COVID-19, the Company hadexposures (on balance sheet loans and commitments to lend) in the following loan categories that are considered to be most at-risk of asignificant impact as of December 31, 2020.

60
Hospitality Lending – The Company’s exposure to the hospitality sector at December 31, 2020, approximated $264.9 million, or11.3%, of total loans excluding PPP loans. As of December 31, 2020, $14.1 million of these loans were actively participating in adeferral program.
The top 20 loans within our hospitality portfolio comprise $216.6 million, or 81.8%, of the total exposure. These loans aregeographically diversified and well secured. The borrowers are well known to the Company and experienced hoteliers who haveevidenced efforts to enhance profitability in the current economic environment by driving down costs and creatively occupying theirproperties, including arrangements with medical professionals and others on the front line of this pandemic. Historically, the portfoliohas exhibited strong operational cash flows. The remainder of the portfolio is comprised of many smaller balance loans.
Aircraft Manufacturing – The Company’s exposure to the aircraft manufacturing category at December 31, 2020, approximated$41.7 million, or 1.8%, of total loans excluding PPP loans. As of December 31, 2020, none of these loans were actively participatingin a deferral program. The portfolio is comprised of experienced industry operators who have historically performed withoutexception.
The Company has worked with customers directly affected by COVID-19 and is prepared to offer short-term assistance inaccordance with regulatory guidelines. As a result of the current economic environment caused by the COVID-19 pandemic, theCompany is engaging in frequent communication with borrowers to better understand their situation and the challenges faced,allowing us to respond proactively as needs and issues arise.
While management is optimistic about the performance of the above addressed portions of the portfolio as a whole, theCompany acknowledges the risks associated with the current economic conditions and related unknowns. These risks are believed tohave been addressed and reserved for through our allowance for loan losses and associated provision for loan losses as of and for theperiod ended December 31, 2020.
Retail Operations: The Company is committed to assisting our customers and communities in this time of need. The Companyis serving customers curbside and drive-through but offers full lobby access during normal hours. Temporary changes have beenintroduced to help with the financial hardship caused by COVID-19 for both our customers and non-customers.
The Company continues to monitor the safety of our staff through health stations at each work location. Staffing is adequate toaddress the requests for time off by any of our employees who are impacted by health or childcare issues.
Critical Accounting Policies
Our significant accounting policies are integral to understanding the results reported. Our accounting policies are described in“NOTE 1 – NATURE OF OPERATIONS AND SUMMARY OF SIGNIFICANT ACCOUNTING POLICIES” in the Notes toConsolidated Financial Statements. We believe that of our significant accounting policies, the following may involve a higher degreeof judgment and complexity.
Purchased Credit Impaired Loans: As a part of previous acquisitions, we acquired certain loans for which there was, atacquisition, evidence of deterioration of credit quality since origination. These purchased credit impaired loans were recorded at theacquisition date fair value, such that there is no carryover of the seller’s allowance for loan losses. After acquisition, losses arerecognized by an increase in the allowance for loan losses. Such purchased credit impaired loans are accounted for individually. Weestimate the amount and timing of expected cash flows for each loan, and the expected cash flows in excess of the amount paid arerecorded as interest income over the remaining life of the loan (accretable yield). The excess of the loan’s contractual principal andinterest over expected cash flows is not recorded (non-accretable difference). Over the life of the loan, expected cash flows continueto be estimated. If the present value of the expected cash flows is less than the carrying amount, a loss is recorded. If the presentvalue of the expected cash flows is greater than the carrying amount, it is recognized as part of future interest income.

61
Impaired Loans: A loan is considered impaired when, based on current information and events, it is probable that we will beunable to collect all contractual principal and interest due according to the terms of the loan agreement. All loans are individuallyevaluated for impairment. Impaired loans are measured based on the present value of expected future cash flows discounted at theloan’s effective interest rate or on the value of the underlying collateral if the loan is collateral dependent. We evaluate thecollectability of both principal and interest when assessing the need for a loss accrual.
Factors considered by management in determining impairment include payment status, collateral value, and the probability ofcollecting scheduled principal and interest payments when due. Loans that experience insignificant payment delays and paymentshortfalls generally are not classified as impaired. Management determines the significance of payment delays and payment shortfallson a case-by-case basis, taking into consideration all of the circumstances surrounding the loan and the borrower, including the lengthof the delay, the reasons for the delay, the borrower’s prior payment record, and the amount of the shortfall in relation to the principaland interest owed.
Troubled Debt Restructurings: In cases where a borrower experiences financial difficulty and we make certain concessionarymodifications to contractual terms, the loan is classified as a troubled debt restructured loan and classified as impaired. Generally, anonaccrual loan that is a troubled debt restructuring (“TDR”) remains on nonaccrual until such time that repayment of the remainingprincipal and interest is not in doubt, and the borrower has a period of satisfactory repayment performance.
Allowance for Loan Losses: The allowance for loan losses is a valuation allowance for probable incurred credit losses. Loanlosses are charged against the allowance when management believes the collectability of a loan balance is unlikely. Subsequentrecoveries, if any, are credited to the allowance. Management estimates the allowance balance required using past loan lossexperience, the nature and volume of the portfolio, information about specific borrower situations and estimated collateral values,economic conditions, and other factors. A loan review process, independent of the loan approval process, is utilized by managementto verify loans are being made and administered in accordance with Company policy, to review loan risk grades and potential losses,to verify that potential problem loans are receiving adequate and timely corrective measures to avoid or reduce losses, and to assist inthe verification of the adequacy of the loan loss reserve. Allocations of the allowance may be made for specific loans, but the entireallowance is available for any loan that, in management’s judgment, should be charged-off.
The allowance consists of specific and general components. The specific component relates to loans that are individuallyclassified as impaired. If a loan is impaired, a portion of the allowance is allocated so that the loan is reported net at the present valueof estimated future cash flows using the loan’s existing rate or at the fair value of collateral if repayment is expected solely from thesale of the collateral. TDR’s are separately identified for impairment disclosures and are measured at the present value of estimatedfuture cash flows using the loan’s effective rate at inception. If a TDR is considered to be a collateral dependent loan, the loan isreported, net, at the fair value of the collateral. For TDR’s that subsequently default, we determine the amount of reserve inaccordance with the accounting policy for the allowance for loan losses.
The general component of the allowance for loan losses covers non-impaired loans and is based on historical loss experienceadjusted for current factors. The historical loss experience is determined by portfolio and class and is based on the actual loss historyexperienced by us. This actual loss experience is then adjusted by comparing current conditions to the conditions that existed duringthe loss history. We consider the changes related to (i) lending policies, (ii) economic conditions, (iii) nature and volume of the loanportfolio and class, (iv) lending staff, (v) volume and severity of past due, non-accrual, and risk graded loans, (vi) loan review system,(vii) value of underlying collateral for collateral dependent loans, (viii) concentration levels and (ix) effects of other external factors.
Goodwill: Goodwill results from business acquisitions and represents the excess of the purchase price over the fair value ofacquired tangible assets and liabilities and identifiable intangible assets.
Goodwill is assessed at least annually for impairment and any such impairment is recognized and expensed in the periodidentified. Goodwill will be assessed more frequently if a triggering event occurs which indicates that the carrying value of the assetmight be impaired. We have selected December 31 as the date to perform our annual goodwill impairment test. Goodwill is the onlyintangible asset with an indefinite useful life. At September 30, 2020, the Company determined that goodwill was impaired andsubsequently booked a $104.8 million non-cash impairment charge. For additional information see “NOTE 1 – NATURE OFOPERATIONS AND SUMMARY OF SIGNIFICANT ACCOUNTING POLICIES” and “NOTE 7 – GOODWILL AND COREDEPOSIT INTANGIBLES” in the Notes to Consolidated Financial Statements.
Fair Value: Fair values of assets and liabilities are estimated using relevant market information and other assumptions. Fairvalue estimates involve uncertainties and matters of significant judgment regarding interest rates, credit risk, prepayments, collateralvalues and other factors, especially in the absence of broad markets for particular assets and liabilities. Changes in assumptions or inmarket conditions could materially affect the estimates.
62
Results of Operations
We generate most of our revenue from interest income and fees on loans, interest and dividends on investment securities andnon-interest income, such as service charges and fees, debit card income and mortgage banking income. We incur interest expense ondeposits and other borrowed funds and non-interest expense, such as salaries and employee benefits and occupancy expenses.
Changes in interest rates earned on interest-earning assets or incurred on interest-bearing liabilities, as well as the volume andtypes of interest-earning assets, interest-bearing and non-interest-bearing liabilities and stockholders’ equity, are usually the largestdrivers of periodic change in net interest income. Fluctuations in interest rates are driven by many factors, including governmentalmonetary policies, inflation, deflation, macroeconomic developments, changes in unemployment, the money supply, political andinternational circumstances and domestic and foreign financial markets. Periodic changes in the volume and types of loans in our loanportfolio are affected by, among other factors, economic and competitive conditions in Arkansas, Kansas, Missouri and Oklahoma, aswell as developments affecting the consumer, commercial and real estate sectors within these markets.
For information comparing our results of operations for the year ended December 31, 2019, to year ended December 31, 2018,see “Item 7 – Management’s Discussion and Analysis of Financial Condition and Results of Operations” in our Annual Report onForm 10-K filed with the Securities and Exchange Commission (“SEC”) on March 10, 2020.
Net Income
Year ended December 31, 2020, compared with year ended December 31, 2019
For the year ended December 31, 2020, there was a net loss and net loss allocable to common stockholders of $75.0 million,compared to net income and net income allocable to common stockholders of $25.6 million for the year ended December 31, 2019, adecrease of $100.5 million. During the year ended December 31, 2020, an increase in non-interest expense of $109.4 million,primarily due to a $104.8 million charge to goodwill impairment, and an increase in provision for loan losses of $5.9 million werepartially offset by a decrease in provision for income taxes of $6.9 million and increases in net interest income of $6.8 million andnon-interest income of $1.0 million when compared to the year ended December 31, 2019. The changes in the components of netincome are discussed in more detail below in the following sections of “Results of Operations.”
Net Interest Income and Net Interest Margin Analysis
Net interest income is the difference between interest income on interest-earning assets, including loans and securities, andinterest expense incurred on interest-bearing liabilities, including deposits and other borrowed funds. To evaluate net interest income,management measures and monitors (1) yields on loans and other interest-earning assets, (2) the costs of deposits and other fundingsources, (3) the net interest spread and (4) net interest margin. Net interest spread is the difference between rates earned on interest-earning assets and rates paid on interest-bearing liabilities. Net interest margin is calculated as net interest income divided by averageinterest-earning assets. Because non-interest-bearing sources of funds, such as non-interest-bearing deposits and stockholders’ equityalso fund interest-earning assets, net interest margin includes the benefit of these non-interest-bearing sources of funds. Net interestincome is affected by changes in the amount and mix of interest-earning assets and interest-bearing liabilities, referred to as a “volumechange,” and it is also affected by changes in yields earned on interest-earning assets and rates paid on interest-bearing deposits andother borrowed funds, referred to as a “yield/rate change.”
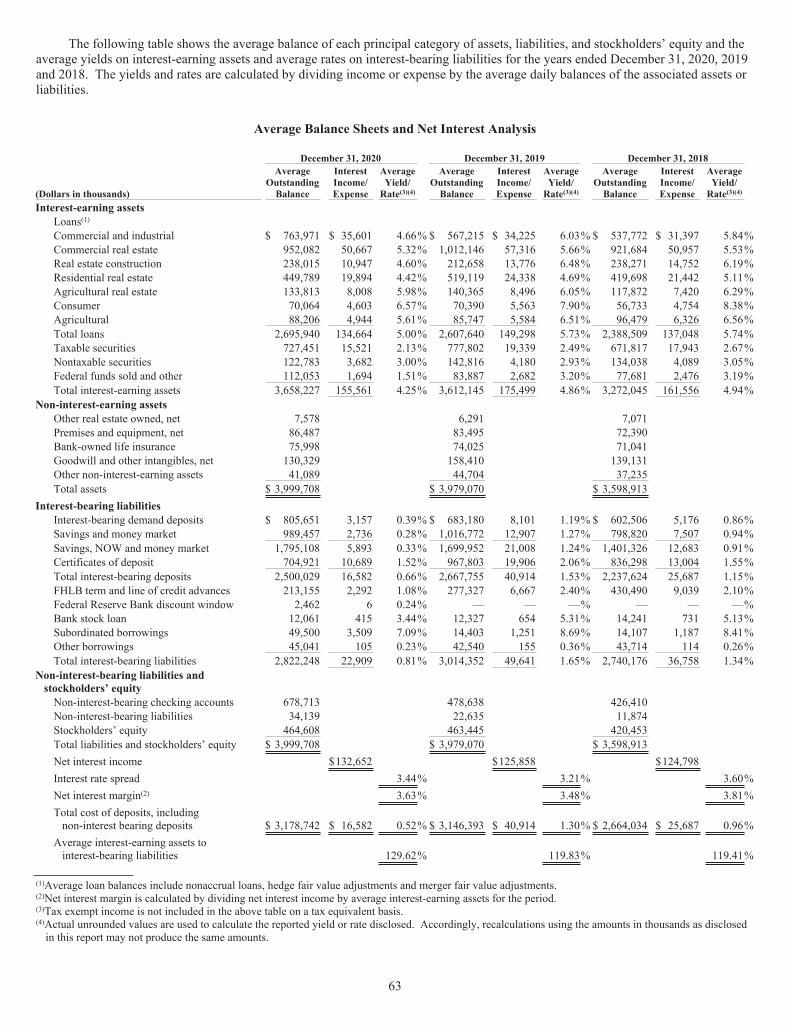
63
The following table shows the average balance of each principal category of assets, liabilities, and stockholders’ equity and theaverage yields on interest-earning assets and average rates on interest-bearing liabilities for the years ended December 31, 2020, 2019and 2018. The yields and rates are calculated by dividing income or expense by the average daily balances of the associated assets orliabilities.
Average Balance Sheets and Net Interest Analysis
December 31, 2020 December 31, 2019 December 31, 2018
(Dollars in thousands)
AverageOutstandingBalance
InterestIncome/Expense
AverageYield/Rate(3)(4)
AverageOutstandingBalance
InterestIncome/Expense
AverageYield/Rate(3)(4)
AverageOutstandingBalance
InterestIncome/Expense
AverageYield/Rate(3)(4)
Interest-earning assetsLoans(1)Commercial and industrial $ 763,971 $ 35,601 4.66% $ 567,215 $ 34,225 6.03% $ 537,772 $ 31,397 5.84%Commercial real estate 952,082 50,667 5.32% 1,012,146 57,316 5.66% 921,684 50,957 5.53%Real estate construction 238,015 10,947 4.60% 212,658 13,776 6.48% 238,271 14,752 6.19%Residential real estate 449,789 19,894 4.42% 519,119 24,338 4.69% 419,698 21,442 5.11%Agricultural real estate 133,813 8,008 5.98% 140,365 8,496 6.05% 117,872 7,420 6.29%Consumer 70,064 4,603 6.57% 70,390 5,563 7.90% 56,733 4,754 8.38%Agricultural 88,206 4,944 5.61% 85,747 5,584 6.51% 96,479 6,326 6.56%Total loans 2,695,940 134,664 5.00% 2,607,640 149,298 5.73% 2,388,509 137,048 5.74%Taxable securities 727,451 15,521 2.13% 777,802 19,339 2.49% 671,817 17,943 2.67%Nontaxable securities 122,783 3,682 3.00% 142,816 4,180 2.93% 134,038 4,089 3.05%Federal funds sold and other 112,053 1,694 1.51% 83,887 2,682 3.20% 77,681 2,476 3.19%Total interest-earning assets 3,658,227 155,561 4.25% 3,612,145 175,499 4.86% 3,272,045 161,556 4.94%
Non-interest-earning assetsOther real estate owned, net 7,578 6,291 7,071Premises and equipment, net 86,487 83,495 72,390Bank-owned life insurance 75,998 74,025 71,041Goodwill and other intangibles, net 130,329 158,410 139,131Other non-interest-earning assets 41,089 44,704 37,235Total assets $ 3,999,708 $ 3,979,070 $ 3,598,913
Interest-bearing liabilitiesInterest-bearing demand deposits $ 805,651 3,157 0.39% $ 683,180 8,101 1.19% $ 602,506 5,176 0.86%Savings and money market 989,457 2,736 0.28% 1,016,772 12,907 1.27% 798,820 7,507 0.94%Savings, NOW and money market 1,795,108 5,893 0.33% 1,699,952 21,008 1.24% 1,401,326 12,683 0.91%Certificates of deposit 704,921 10,689 1.52% 967,803 19,906 2.06% 836,298 13,004 1.55%Total interest-bearing deposits 2,500,029 16,582 0.66% 2,667,755 40,914 1.53% 2,237,624 25,687 1.15%FHLB term and line of credit advances 213,155 2,292 1.08% 277,327 6,667 2.40% 430,490 9,039 2.10%Federal Reserve Bank discount window 2,462 6 0.24% — — —% — — —%Bank stock loan 12,061 415 3.44% 12,327 654 5.31% 14,241 731 5.13%Subordinated borrowings 49,500 3,509 7.09% 14,403 1,251 8.69% 14,107 1,187 8.41%Other borrowings 45,041 105 0.23% 42,540 155 0.36% 43,714 114 0.26%Total interest-bearing liabilities 2,822,248 22,909 0.81% 3,014,352 49,641 1.65% 2,740,176 36,758 1.34%
Non-interest-bearing liabilities andstockholders’ equityNon-interest-bearing checking accounts 678,713 478,638 426,410Non-interest-bearing liabilities 34,139 22,635 11,874Stockholders’ equity 464,608 463,445 420,453Total liabilities and stockholders’ equity $ 3,999,708 $ 3,979,070 $ 3,598,913Net interest income $132,652 $125,858 $124,798Interest rate spread 3.44% 3.21% 3.60%Net interest margin(2) 3.63% 3.48% 3.81%Total cost of deposits, includingnon-interest bearing deposits $ 3,178,742 $ 16,582 0.52% $ 3,146,393 $ 40,914 1.30% $ 2,664,034 $ 25,687 0.96%
Average interest-earning assets tointerest-bearing liabilities 129.62% 119.83% 119.41%
(1)Average loan balances include nonaccrual loans, hedge fair value adjustments and merger fair value adjustments.(2)Net interest margin is calculated by dividing net interest income by average interest-earning assets for the period.(3)Tax exempt income is not included in the above table on a tax equivalent basis.(4)Actual unrounded values are used to calculate the reported yield or rate disclosed. Accordingly, recalculations using the amounts in thousands as disclosedin this report may not produce the same amounts.

64
Increases and decreases in interest income and interest expense result from changes in average balances (volume) of interest-earning assets and interest-bearing liabilities, as well as changes in average interest yields/rates. The following table analyzes thechange in volume variances and yield/rate variances for the year ended December 31, 2020, as compared to the year endedDecember 31, 2019, and the year ended December 31, 2019, as compared to the year ended December 31, 2018.
Analysis of Changes in Net Interest Income
2020 vs. 2019 2019 vs. 2018Increase (Decrease) Due to: Increase (Decrease) Due to:
(Dollars in thousands) Volume(1) Yield/Rate(1) Total Volume(1) Yield/Rate(1) TotalInterest-earning assets
LoansCommercial and industrial $ 10,240 $ (8,864) $ 1,376 $ 1,755 $ 1,073 $ 2,828Commercial real estate (3,300) (3,349) (6,649) 5,099 1,260 6,359Real estate construction 1,504 (4,333) (2,829) (1,637) 661 (976)Residential real estate (3,121) (1,323) (4,444) 4,769 (1,873) 2,896Agricultural real estate (393) (95) (488) 1,371 (295) 1,076Consumer (26) (934) (960) 1,092 (283) 809Agricultural 156 (796) (640) (699) (43) (742)Total loans 5,060 (19,694) (14,634) 11,750 500 12,250Taxable securities (1,196) (2,622) (3,818) 2,694 (1,298) 1,396Nontaxable securities (599) 101 (498) 261 (170) 91Federal funds sold and other 716 (1,704) (988) 198 8 206Total interest-earning assets $ 3,981 $ (23,919) $ (19,938) $ 14,903 $ (960) 13,943
Interest-bearing liabilitiesSavings, NOW and money market $ 909 $ (16,024) $ (15,115) $ 3,125 $ 5,200 $ 8,325Certificates of deposit (4,685) (4,532) (9,217) 2,261 4,641 6,902Total interest-bearing deposits (3,776) (20,556) (24,332) 5,386 9,841 15,227FHLB term and line of credit advances (1,291) (3,084) (4,375) (3,548) 1,176 (2,372)Federal Reserve Bank discount window 6 — 6 — — —Bank stock loan (14) (225) (239) (101) 24 (77)Subordinated borrowings 2,527 (269) 2,258 25 39 64Other borrowings 9 (59) (50) (4) 45 41Total interest-bearing liabilities (2,539) (24,193) (26,732) 1,758 11,125 12,883
Net Interest Income $ 6,520 $ 274 $ 6,794 $ 13,145 $ (12,085) $ 1,060
(1)The effect of changes in volume is determined by multiplying the change in volume by the previous year’s average rate. Similarly,the effect of rate changes is calculated by multiplying the change in average rate by the prior year’s volume. The changesattributable to both volume and rate, which cannot be segregated, have been allocated to the volume variance and the rate variance inproportion to the relationship of the absolute dollar amount of the change in each.
Year ended December 31, 2020, compared with year ended December 31, 2019
The increase in net interest income before the provision for loan losses is primarily due to the increase in the volume of interest-earnings assets, partially offset by a 61 basis point decrease in yields on interest-earning assets. This decrease in yield is largely due tothe 1.00% PPP loans, administered by the SBA, in our portfolio during 2020. The increase in average volume of interest-earningassets was primarily due to increases in loans. The decrease in interest expense was due to an 84 basis point decrease in the averagerates of interest-bearing liabilities and an overall decrease in volume of interest-bearing liabilities.
The increase in loan interest income was driven by the $88.3 million increase in average loan volume. The impact to net interestincome from loan fees for the year ended December 31, 2020, was $10.4 million compared to $4.7 million for the year endedDecember 31, 2019.

65
Average balances of borrowings from the FHLB decreased by $64.2 million from an average balance of $277.3 million for theyear ended December 31, 2019, to an average balance of $213.2 million for the year ended December 31, 2020, coupled with a 132basis point decrease in average borrowing cost resulted in a decrease in interest expense of $4.4 million. Interest expense on the bankstock loan for the year ended December 31, 2020, was $415 thousand compared to $654 thousand for the year ended December 31,2019. Total cost of interest-bearing liabilities decreased 84 basis points to 0.81% for the year ended December 31, 2020, from 1.65%for the year ended December 31, 2019.
The increase in net interest margin is largely due to the cost of interest-bearing liabilities decreasing at a faster rate than interest-earning assets. The decrease in cost of funds is primarily from the overall decrease in rates on interest-bearing liabilities, partially dueto an increase in non-interest-bearing checking accounts and, to a lesser degree, the decrease in volume of borrowings.
Provision for Loan Losses
We maintain an allowance for loan losses for probable incurred credit losses. The allowance for loan losses is increased by aprovision for loan losses, which is a charge to earnings, and subsequent recoveries of amounts previously charged-off, but is decreasedby charge-offs when the collectability of a loan balance is unlikely. Management estimates the allowance balance required using pastloan loss experience, the nature and volume of the loan portfolio, information about specific borrower situations and estimatedcollateral values, discounted cash flows, economic conditions and other factors including regulatory guidance. As these factorschange, the amount of the loan loss provision changes.
Year ended December 31, 2020, compared with year ended December 31, 2019
The provision for loan losses for the period ended December 31, 2020, was $24.3 million compared to $18.4 million for theperiod ended December 31, 2019. The provision was increased significantly during the period ended December 31, 2020, largely asthe result of increases in qualitative loss factors brought on by the projected economic impact of COVID-19. As part of the process toadjust qualitative factors in response to COVID-19, we considered the loss rates we experienced during the last economic downturn,the level of loan deferrals in the loan portfolio and industries we considered at risk to determine the necessary level of probableincurred loss. The loss rate adjustments from the last economic downturn were allocated across all loan segments as projecting lossesto any one loan segment would be difficult given the unique nature of the pandemic and the pandemic was expected to impact all loansegments.
Included in the period ended December 31, 2019, was a first quarter $14.5 million provision against one credit relationshipbelieved to be an isolated incident unique within our portfolio. We charged-off a net of $15.2 million on this credit relationship duringthe year ended December 31, 2019. For additional detail see “Item 7: Management�s Discussion and Analysis of Financial Conditionand Results of Operations � Allowance for Loan Losses.� Net charge-offs for the year ended December 31, 2020, were $2.8 million ascompared to net charge-offs of $17.6 million for the year ended December 31, 2019. For the year ended December 31, 2020, grosscharge-offs were $3.3 million offset by gross recoveries of $544 thousand. In comparison, gross charge-offs were $18.7 million forthe year ended December 31, 2019, offset by gross recoveries of $1.1 million.
Non-Interest Income
The primary sources of non-interest income are service charges and fees, debit card income, mortgage banking income,increases in the value of bank owned life insurance, investment referral income, the recovery of zero-basis purchased loans, net gainson the sale of available-for-sale securities and other securities transactions. Non-interest income does not include loan origination orother loan fees which are recognized as an adjustment to yield using the interest method.

66
The following table provides a comparison of the major components of non-interest income for the years ended December 31,2020, 2019 and 2018.
Non-Interest IncomeFor the Years Ended December 31,
2020 vs. 2019 2019 vs. 2018(Dollars in thousands) 2020 2019 2018 Change % Change %Service charges and fees $ 6,856 $ 8,672 $ 7,250 $ (1,816) (20.9)% $ 1,422 19.6%Debit card income 9,136 8,230 6,178 906 11.0% 2,052 33.2%Mortgage banking 3,153 2,468 1,298 685 27.8% 1,170 90.1%Increase in value of bank-owned lifeinsurance 1,941 1,998 2,199 (57) (2.9)% (201) (9.1)%
OtherInvestment referral income 567 590 395 (23) (3.9)% 195 49.4%Trust income 433 243 81 190 78.2% 162 200.0%Insurance sales commissions 275 177 245 98 55.4% (68) (27.8)%Recovery on zero-basispurchased loans 134 143 420 (9) (6.3)% (277) (66.0)%
Income from equity methodinvestments (210) 26 7 (236) (907.7)% 19 271.4%
Other non-interest income 1,582 2,427 1,661 (845) (34.8)% 766 46.1%Total other 2,781 3,606 2,809 (825) (22.9)% 797 28.4%Sub-Total 23,867 24,974 19,734 (1,107) (4.4)% 5,240 26.6%
Gain on acquisition 2,145 — — 2,145 100.0% — —%Net gain (loss) from securitiestransactions 11 14 (9) (3) (21.4)% 23 (255.6)%
Total non-interest income $ 26,023 $ 24,988 $ 19,725 $ 1,035 4.1% $ 5,263 26.7%
Year ended December 31, 2020, compared with year ended December 31, 2019
The increase in non-interest income was primarily due to gain on acquisition and increases in debit card income, mortgagebanking fees, trust income and insurance sales commissions, partially offset by decreases in service charges and fees, other non-interest income, income from equity method investments and increase in the value of bank-owned life insurance. During the yearended December 31, 2020, there was $2.1 million in gain on acquisition related to the Almena acquisition. Debit card income was$9.1 million for the year ended December 31, 2020, an increase of $906 thousand, or 11.0%, from $8.2 million for the year endedDecember 31, 2019. Mortgage banking increased $685 thousand, or 27.8%, from $2.5 million for the year ended December 31, 2019,to $3.2 million for the year ended December 31, 2020. Service charges and fees decreased $1.8 million during the twelve monthsended December 31, 2020, as compared to the same time period during 2019, primarily due to a decrease in non-sufficient fundcharges. In connection with acquisitions, we received the rights to certain loans that were previously charged-off by the acquiredbank. At acquisition, there was no expectation of future cash flows from these previously charged-off loans and thus they wereassigned a zero basis. Subsequent to the acquisitions, we have received cash payments on several of these loans. No interest has beenaccrued as cash flow payments have not been expected prior to receipt. Cash receipts on these zero-basis loans totaled $134 thousandand $143 thousand for the years ended December 31, 2020 and 2019.
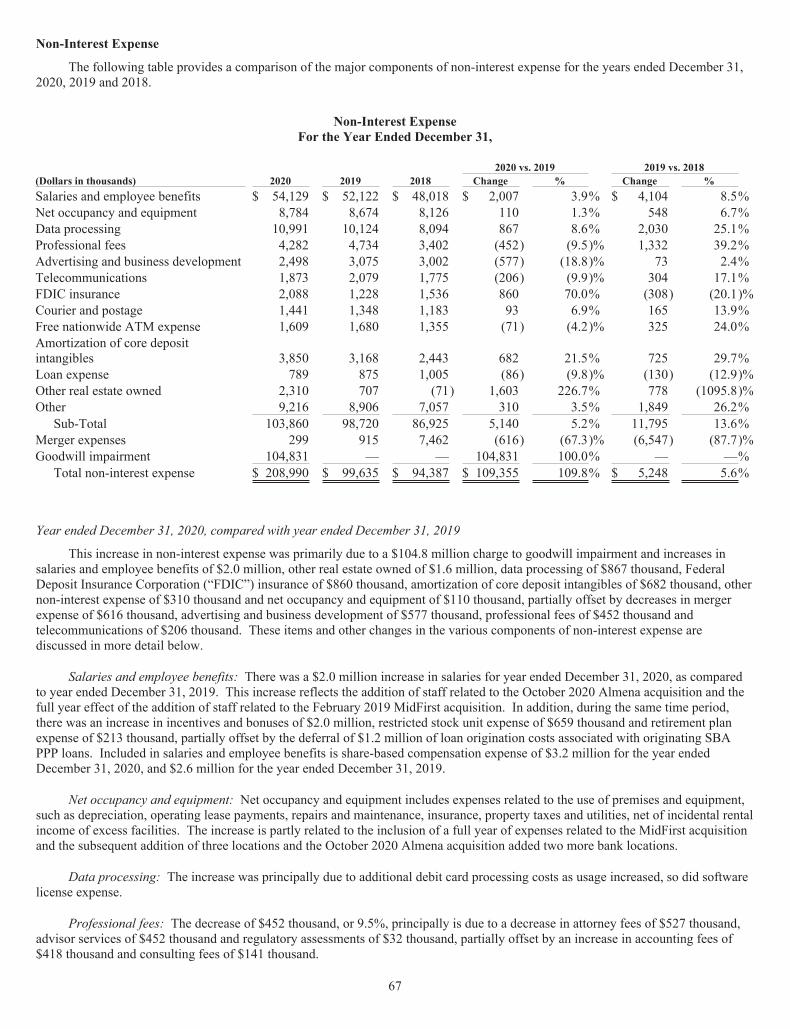
67
Non-Interest Expense
The following table provides a comparison of the major components of non-interest expense for the years ended December 31,2020, 2019 and 2018.
Non-Interest ExpenseFor the Year Ended December 31,
2020 vs. 2019 2019 vs. 2018(Dollars in thousands) 2020 2019 2018 Change % Change %Salaries and employee benefits $ 54,129 $ 52,122 $ 48,018 $ 2,007 3.9% $ 4,104 8.5%Net occupancy and equipment 8,784 8,674 8,126 110 1.3% 548 6.7%Data processing 10,991 10,124 8,094 867 8.6% 2,030 25.1%Professional fees 4,282 4,734 3,402 (452) (9.5)% 1,332 39.2%Advertising and business development 2,498 3,075 3,002 (577) (18.8)% 73 2.4%Telecommunications 1,873 2,079 1,775 (206) (9.9)% 304 17.1%FDIC insurance 2,088 1,228 1,536 860 70.0% (308) (20.1)%Courier and postage 1,441 1,348 1,183 93 6.9% 165 13.9%Free nationwide ATM expense 1,609 1,680 1,355 (71) (4.2)% 325 24.0%Amortization of core depositintangibles 3,850 3,168 2,443 682 21.5% 725 29.7%Loan expense 789 875 1,005 (86) (9.8)% (130) (12.9)%Other real estate owned 2,310 707 (71) 1,603 226.7% 778 (1095.8)%Other 9,216 8,906 7,057 310 3.5% 1,849 26.2%
Sub-Total 103,860 98,720 86,925 5,140 5.2% 11,795 13.6%Merger expenses 299 915 7,462 (616) (67.3)% (6,547) (87.7)%Goodwill impairment 104,831 — — 104,831 100.0% — —%
Total non-interest expense $ 208,990 $ 99,635 $ 94,387 $ 109,355 109.8% $ 5,248 5.6%
Year ended December 31, 2020, compared with year ended December 31, 2019
This increase in non-interest expense was primarily due to a $104.8 million charge to goodwill impairment and increases insalaries and employee benefits of $2.0 million, other real estate owned of $1.6 million, data processing of $867 thousand, FederalDeposit Insurance Corporation (“FDIC”) insurance of $860 thousand, amortization of core deposit intangibles of $682 thousand, othernon-interest expense of $310 thousand and net occupancy and equipment of $110 thousand, partially offset by decreases in mergerexpense of $616 thousand, advertising and business development of $577 thousand, professional fees of $452 thousand andtelecommunications of $206 thousand. These items and other changes in the various components of non-interest expense arediscussed in more detail below.
Salaries and employee benefits: There was a $2.0 million increase in salaries for year ended December 31, 2020, as comparedto year ended December 31, 2019. This increase reflects the addition of staff related to the October 2020 Almena acquisition and thefull year effect of the addition of staff related to the February 2019 MidFirst acquisition. In addition, during the same time period,there was an increase in incentives and bonuses of $2.0 million, restricted stock unit expense of $659 thousand and retirement planexpense of $213 thousand, partially offset by the deferral of $1.2 million of loan origination costs associated with originating SBAPPP loans. Included in salaries and employee benefits is share-based compensation expense of $3.2 million for the year endedDecember 31, 2020, and $2.6 million for the year ended December 31, 2019.
Net occupancy and equipment: Net occupancy and equipment includes expenses related to the use of premises and equipment,such as depreciation, operating lease payments, repairs and maintenance, insurance, property taxes and utilities, net of incidental rentalincome of excess facilities. The increase is partly related to the inclusion of a full year of expenses related to the MidFirst acquisitionand the subsequent addition of three locations and the October 2020 Almena acquisition added two more bank locations.
Data processing: The increase was principally due to additional debit card processing costs as usage increased, so did softwarelicense expense.
Professional fees: The decrease of $452 thousand, or 9.5%, principally is due to a decrease in attorney fees of $527 thousand,advisor services of $452 thousand and regulatory assessments of $32 thousand, partially offset by an increase in accounting fees of$418 thousand and consulting fees of $141 thousand.

68
Other real estate owned: As detailed in “NOTE 5 – OTHER REAL ESTATE OWNED” in the Notes to Consolidated FinancialStatements, other real estate owned expenses, including provision for unrealized losses, were $3.3 million, partially offset by gains onthe sale of other real estate of $835 thousand and gains on the sale of other assets of $201 thousand, for the year ended December 31,2020. For the year ended December 31, 2019, other real estate owned expenses, including provision for unrealized losses, were $904thousand and loss on sale of other real estate owned was $10 thousand, partially offset by gains on initial evaluation of other realestate properties of $191 thousand and gains on the sale of other assets of $15 thousand.
Other: Other non-interest expenses consist of subscriptions, memberships and dues, employee expenses including travel, meals,entertainment and education, supplies, printing, insurance, account related losses, correspondent bank fees, customer programexpenses, losses net of gains on the sale of fixed assets, losses net of gains on the sale of repossessed assets other than real estate andother operating expenses such as settlement of claims.
Merger expenses: Merger expenses include legal, advisory and accounting fees associated with services to facilitate theacquisition of other banks. Merger expenses also include data processing conversion costs and costs associated with the integration ofpersonnel, processes, facilities and employee bonuses. For the year ended December 31, 2020, merger expenses of $299 thousand arerelated to the Almena acquisition. For the year ended December 31, 2019, merger expenses of $915 thousand are related to theMidFirst acquisition.
Efficiency Ratio
The efficiency ratio is a supplemental financial measure utilized in the internal evaluation of our performance and is not definedunder GAAP. Our efficiency ratio is computed by dividing non-interest expense, excluding goodwill impairment, merger expensesand loss on debt extinguishment, by the sum of net interest income and non-interest income, excluding net gains on sales of andsettlement of securities and gain on acquisition. Generally, an increase in the efficiency ratio indicates that more resources are beingutilized to generate the same volume of income, while a decrease would indicate a more efficient allocation of resources. The ratiodefined under GAAP that is most comparable to the efficiency ratio is non-interest expense to net interest income plus non-interestincome which is discussed in “Results of Operations – Non-GAAP Financial Measures.”
The Company’s non-interest expense, less goodwill impairment, to net interest income plus non-interest income decreased fromyear ended December 31, 2019, to December 31, 2020, primarily due to net interest income plus non-interest income increasing at ahigher rate than non-interest expense less goodwill impairment, as discussed in “Results of Operations – Non-GAAP FinancialMeasures.” The efficiency ratio increased slightly during the same time period due to non-interest expense, excluding goodwillimpairment and merger expenses, increasing in a slightly higher proportional rate than net interest income and non-interest income,excluding net gains on security transactions and gain on acquisition, as discussed in “Results of Operations – Net Interest Income andNet Interest Margin Analysis” and “Results of Operations – Non-Interest Income.”
Income Taxes
The amount of income tax expense is influenced by the amount of pre-tax income, the amount of tax-exempt income, theamount of non-deductible expenses and available tax credits.
Year ended December 31, 2020, compared with year ended December 31, 2019
The effective income tax rate for the year ended December 31, 2020, was (0.5)% as compared to the U.S. statutory rate of21.0%. The effective income tax rate for the year ended December 31, 2019, was 22.2% as compared to the U.S. statutory rate of21.0%. As detailed in “NOTE 15 – INCOME TAXES” in the Notes to Consolidated Financial Statements, the income tax ratesdiffered from the U.S. statutory rates primarily due to non-taxable income, non-deductible expenses, non-deductible goodwill and taxcredits.
Impact of Inflation
Our consolidated financial statements and related notes included elsewhere in this annual report have been prepared inaccordance with GAAP. These require the measurement of financial position and operating results in terms of historical dollars,without considering changes in the relative value of money over time due to inflation or recession.
Unlike many industrial companies, substantially all our assets and liabilities are monetary in nature. As a result, interest rateshave a more significant impact on our performance than the effects of general levels of inflation. Interest rates may not necessarilymove in the same direction or in the same magnitude as the prices of goods and services. However, other operating expenses doreflect general levels of inflation.
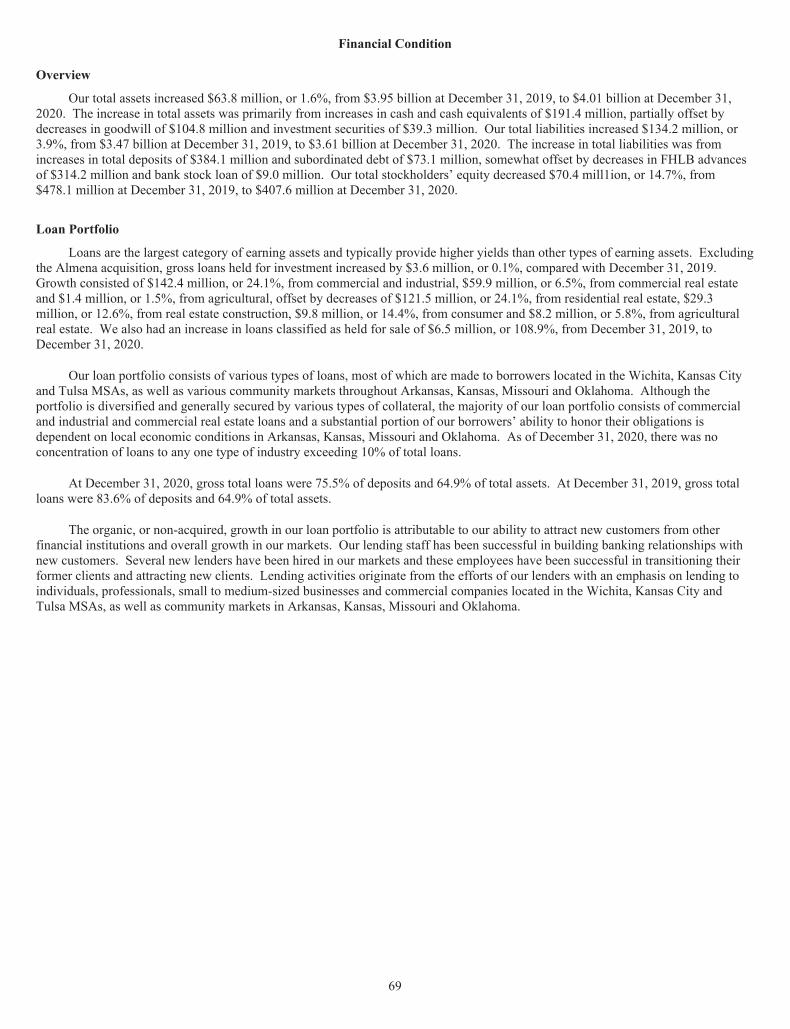
69
Financial Condition
Overview
Our total assets increased $63.8 million, or 1.6%, from $3.95 billion at December 31, 2019, to $4.01 billion at December 31,2020. The increase in total assets was primarily from increases in cash and cash equivalents of $191.4 million, partially offset bydecreases in goodwill of $104.8 million and investment securities of $39.3 million. Our total liabilities increased $134.2 million, or3.9%, from $3.47 billion at December 31, 2019, to $3.61 billion at December 31, 2020. The increase in total liabilities was fromincreases in total deposits of $384.1 million and subordinated debt of $73.1 million, somewhat offset by decreases in FHLB advancesof $314.2 million and bank stock loan of $9.0 million. Our total stockholders’ equity decreased $70.4 mill1ion, or 14.7%, from$478.1 million at December 31, 2019, to $407.6 million at December 31, 2020.
Loan Portfolio
Loans are the largest category of earning assets and typically provide higher yields than other types of earning assets. Excludingthe Almena acquisition, gross loans held for investment increased by $3.6 million, or 0.1%, compared with December 31, 2019.Growth consisted of $142.4 million, or 24.1%, from commercial and industrial, $59.9 million, or 6.5%, from commercial real estateand $1.4 million, or 1.5%, from agricultural, offset by decreases of $121.5 million, or 24.1%, from residential real estate, $29.3million, or 12.6%, from real estate construction, $9.8 million, or 14.4%, from consumer and $8.2 million, or 5.8%, from agriculturalreal estate. We also had an increase in loans classified as held for sale of $6.5 million, or 108.9%, from December 31, 2019, toDecember 31, 2020.
Our loan portfolio consists of various types of loans, most of which are made to borrowers located in the Wichita, Kansas Cityand Tulsa MSAs, as well as various community markets throughout Arkansas, Kansas, Missouri and Oklahoma. Although theportfolio is diversified and generally secured by various types of collateral, the majority of our loan portfolio consists of commercialand industrial and commercial real estate loans and a substantial portion of our borrowers’ ability to honor their obligations isdependent on local economic conditions in Arkansas, Kansas, Missouri and Oklahoma. As of December 31, 2020, there was noconcentration of loans to any one type of industry exceeding 10% of total loans.
At December 31, 2020, gross total loans were 75.5% of deposits and 64.9% of total assets. At December 31, 2019, gross totalloans were 83.6% of deposits and 64.9% of total assets.
The organic, or non-acquired, growth in our loan portfolio is attributable to our ability to attract new customers from otherfinancial institutions and overall growth in our markets. Our lending staff has been successful in building banking relationships withnew customers. Several new lenders have been hired in our markets and these employees have been successful in transitioning theirformer clients and attracting new clients. Lending activities originate from the efforts of our lenders with an emphasis on lending toindividuals, professionals, small to medium-sized businesses and commercial companies located in the Wichita, Kansas City andTulsa MSAs, as well as community markets in Arkansas, Kansas, Missouri and Oklahoma.
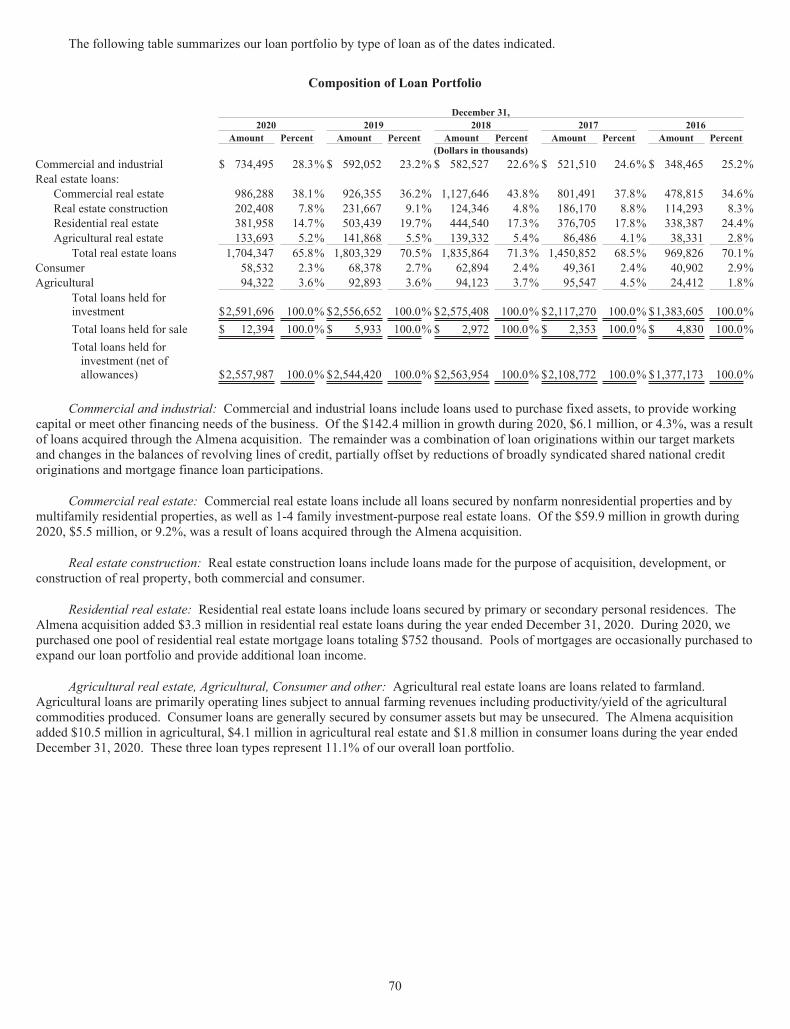
70
The following table summarizes our loan portfolio by type of loan as of the dates indicated.
Composition of Loan Portfolio
December 31,2020 2019 2018 2017 2016
Amount Percent Amount Percent Amount Percent Amount Percent Amount Percent(Dollars in thousands)
Commercial and industrial $ 734,495 28.3% $ 592,052 23.2% $ 582,527 22.6% $ 521,510 24.6% $ 348,465 25.2%Real estate loans:
Commercial real estate 986,288 38.1% 926,355 36.2% 1,127,646 43.8% 801,491 37.8% 478,815 34.6%Real estate construction 202,408 7.8% 231,667 9.1% 124,346 4.8% 186,170 8.8% 114,293 8.3%Residential real estate 381,958 14.7% 503,439 19.7% 444,540 17.3% 376,705 17.8% 338,387 24.4%Agricultural real estate 133,693 5.2% 141,868 5.5% 139,332 5.4% 86,486 4.1% 38,331 2.8%
Total real estate loans 1,704,347 65.8% 1,803,329 70.5% 1,835,864 71.3% 1,450,852 68.5% 969,826 70.1%Consumer 58,532 2.3% 68,378 2.7% 62,894 2.4% 49,361 2.4% 40,902 2.9%Agricultural 94,322 3.6% 92,893 3.6% 94,123 3.7% 95,547 4.5% 24,412 1.8%
Total loans held forinvestment $2,591,696 100.0% $2,556,652 100.0% $2,575,408 100.0% $2,117,270 100.0% $1,383,605 100.0%Total loans held for sale $ 12,394 100.0% $ 5,933 100.0% $ 2,972 100.0% $ 2,353 100.0% $ 4,830 100.0%Total loans held forinvestment (net ofallowances) $2,557,987 100.0% $2,544,420 100.0% $2,563,954 100.0% $2,108,772 100.0% $1,377,173 100.0%
Commercial and industrial: Commercial and industrial loans include loans used to purchase fixed assets, to provide workingcapital or meet other financing needs of the business. Of the $142.4 million in growth during 2020, $6.1 million, or 4.3%, was a resultof loans acquired through the Almena acquisition. The remainder was a combination of loan originations within our target marketsand changes in the balances of revolving lines of credit, partially offset by reductions of broadly syndicated shared national creditoriginations and mortgage finance loan participations.
Commercial real estate: Commercial real estate loans include all loans secured by nonfarm nonresidential properties and bymultifamily residential properties, as well as 1-4 family investment-purpose real estate loans. Of the $59.9 million in growth during2020, $5.5 million, or 9.2%, was a result of loans acquired through the Almena acquisition.
Real estate construction: Real estate construction loans include loans made for the purpose of acquisition, development, orconstruction of real property, both commercial and consumer.
Residential real estate: Residential real estate loans include loans secured by primary or secondary personal residences. TheAlmena acquisition added $3.3 million in residential real estate loans during the year ended December 31, 2020. During 2020, wepurchased one pool of residential real estate mortgage loans totaling $752 thousand. Pools of mortgages are occasionally purchased toexpand our loan portfolio and provide additional loan income.
Agricultural real estate, Agricultural, Consumer and other: Agricultural real estate loans are loans related to farmland.Agricultural loans are primarily operating lines subject to annual farming revenues including productivity/yield of the agriculturalcommodities produced. Consumer loans are generally secured by consumer assets but may be unsecured. The Almena acquisitionadded $10.5 million in agricultural, $4.1 million in agricultural real estate and $1.8 million in consumer loans during the year endedDecember 31, 2020. These three loan types represent 11.1% of our overall loan portfolio.
71
The contractual maturity ranges of loans in our loan portfolio and the amount of such loans with predetermined interest rates andfloating rates in each maturity range as of December 31, 2020, and December 31, 2019, are summarized in the following tables.
Loan Maturity and Sensitivity to Changes in Interest Rates
As of December 31, 2020
One yearor less
After one yearthrough five
yearsAfter fiveyears Total
(Dollars in thousands)Commercial and industrial $ 157,313 $ 487,729 $ 89,453 $ 734,495Real Estate:
Commercial real estate 144,627 569,366 272,295 986,288Real estate construction 75,659 76,295 50,454 202,408Residential real estate 5,048 9,848 367,062 381,958Agricultural real estate 50,527 56,514 26,652 133,693
Total real estate 275,861 712,023 716,463 1,704,347Consumer 13,804 37,599 7,129 58,532Agricultural 62,804 25,911 5,607 94,322
Total $ 509,782 $ 1,263,262 $ 818,652 $ 2,591,696Loans with a predetermined fixed interest rate $ 261,736 $ 896,899 $ 291,649 $ 1,450,284Loans with an adjustable/floating interest rate 248,046 366,363 527,003 1,141,412
Total $ 509,782 $ 1,263,262 $ 818,652 $ 2,591,696
As of December 31, 2019
One yearor less
After one yearthrough five
yearsAfter fiveyears Total
(Dollars in thousands)Commercial and industrial $ 226,524 $ 232,364 $ 133,164 $ 592,052Real Estate:
Commercial real estate 144,787 487,280 294,288 926,355Real estate construction 64,528 114,606 52,533 231,667Residential real estate 7,357 11,885 484,197 503,439Agricultural real estate 56,064 52,324 33,480 141,868
Total real estate 272,736 666,095 864,498 1,803,329Consumer 16,268 43,844 8,266 68,378Agricultural 73,487 17,786 1,620 92,893
Total $ 589,015 $ 960,089 $ 1,007,548 $ 2,556,652Loans with a predetermined fixed interest rate $ 284,218 $ 587,715 $ 326,017 $ 1,197,950Loans with an adjustable/floating interest rate 304,797 372,374 681,531 1,358,702
Total $ 589,015 $ 960,089 $ 1,007,548 $ 2,556,652
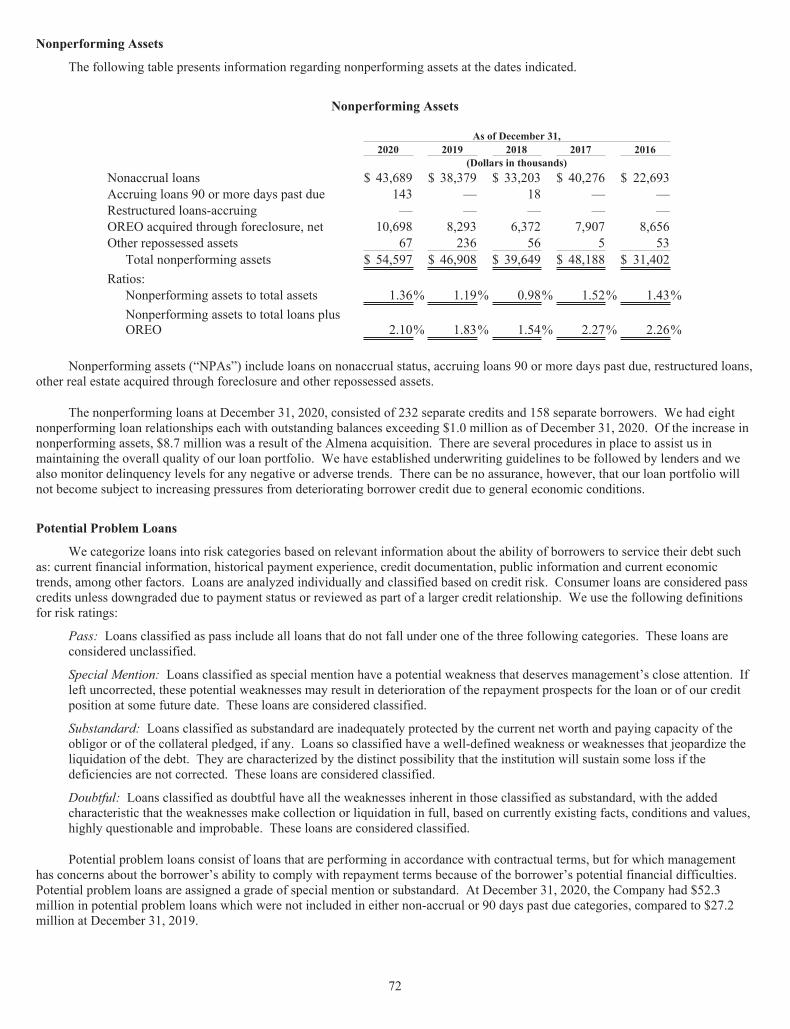
72
Nonperforming Assets
The following table presents information regarding nonperforming assets at the dates indicated.
Nonperforming Assets
As of December 31,2020 2019 2018 2017 2016
(Dollars in thousands)Nonaccrual loans $ 43,689 $ 38,379 $ 33,203 $ 40,276 $ 22,693Accruing loans 90 or more days past due 143 — 18 — —Restructured loans-accruing — — — — —OREO acquired through foreclosure, net 10,698 8,293 6,372 7,907 8,656Other repossessed assets 67 236 56 5 53
Total nonperforming assets $ 54,597 $ 46,908 $ 39,649 $ 48,188 $ 31,402Ratios:
Nonperforming assets to total assets 1.36% 1.19% 0.98% 1.52% 1.43%Nonperforming assets to total loans plusOREO 2.10% 1.83% 1.54% 2.27% 2.26%
Nonperforming assets (“NPAs”) include loans on nonaccrual status, accruing loans 90 or more days past due, restructured loans,other real estate acquired through foreclosure and other repossessed assets.
The nonperforming loans at December 31, 2020, consisted of 232 separate credits and 158 separate borrowers. We had eightnonperforming loan relationships each with outstanding balances exceeding $1.0 million as of December 31, 2020. Of the increase innonperforming assets, $8.7 million was a result of the Almena acquisition. There are several procedures in place to assist us inmaintaining the overall quality of our loan portfolio. We have established underwriting guidelines to be followed by lenders and wealso monitor delinquency levels for any negative or adverse trends. There can be no assurance, however, that our loan portfolio willnot become subject to increasing pressures from deteriorating borrower credit due to general economic conditions.
Potential Problem Loans
We categorize loans into risk categories based on relevant information about the ability of borrowers to service their debt suchas: current financial information, historical payment experience, credit documentation, public information and current economictrends, among other factors. Loans are analyzed individually and classified based on credit risk. Consumer loans are considered passcredits unless downgraded due to payment status or reviewed as part of a larger credit relationship. We use the following definitionsfor risk ratings:
Pass: Loans classified as pass include all loans that do not fall under one of the three following categories. These loans areconsidered unclassified.
Special Mention: Loans classified as special mention have a potential weakness that deserves management’s close attention. Ifleft uncorrected, these potential weaknesses may result in deterioration of the repayment prospects for the loan or of our creditposition at some future date. These loans are considered classified.
Substandard: Loans classified as substandard are inadequately protected by the current net worth and paying capacity of theobligor or of the collateral pledged, if any. Loans so classified have a well-defined weakness or weaknesses that jeopardize theliquidation of the debt. They are characterized by the distinct possibility that the institution will sustain some loss if thedeficiencies are not corrected. These loans are considered classified.
Doubtful: Loans classified as doubtful have all the weaknesses inherent in those classified as substandard, with the addedcharacteristic that the weaknesses make collection or liquidation in full, based on currently existing facts, conditions and values,highly questionable and improbable. These loans are considered classified.
Potential problem loans consist of loans that are performing in accordance with contractual terms, but for which managementhas concerns about the borrower’s ability to comply with repayment terms because of the borrower’s potential financial difficulties.Potential problem loans are assigned a grade of special mention or substandard. At December 31, 2020, the Company had $52.3million in potential problem loans which were not included in either non-accrual or 90 days past due categories, compared to $27.2million at December 31, 2019.
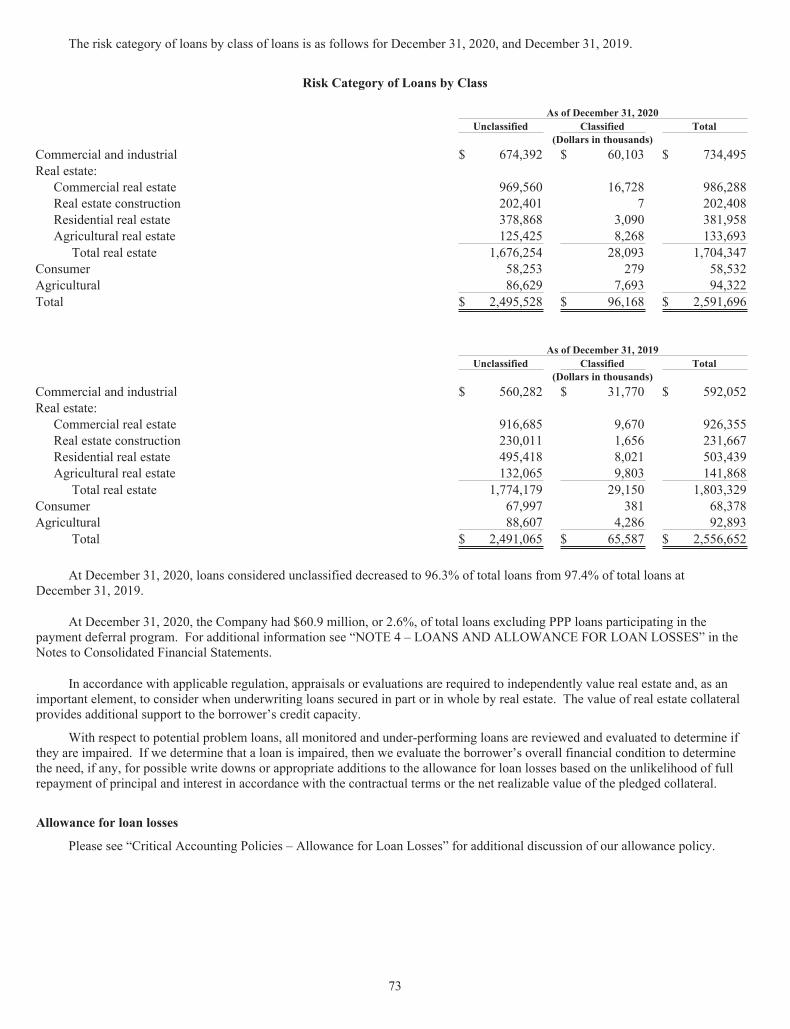
73
The risk category of loans by class of loans is as follows for December 31, 2020, and December 31, 2019.
Risk Category of Loans by Class
As of December 31, 2020Unclassified Classified Total
(Dollars in thousands)Commercial and industrial $ 674,392 $ 60,103 $ 734,495Real estate:
Commercial real estate 969,560 16,728 986,288Real estate construction 202,401 7 202,408Residential real estate 378,868 3,090 381,958Agricultural real estate 125,425 8,268 133,693
Total real estate 1,676,254 28,093 1,704,347Consumer 58,253 279 58,532Agricultural 86,629 7,693 94,322Total $ 2,495,528 $ 96,168 $ 2,591,696
As of December 31, 2019Unclassified Classified Total
(Dollars in thousands)Commercial and industrial $ 560,282 $ 31,770 $ 592,052Real estate:
Commercial real estate 916,685 9,670 926,355Real estate construction 230,011 1,656 231,667Residential real estate 495,418 8,021 503,439Agricultural real estate 132,065 9,803 141,868
Total real estate 1,774,179 29,150 1,803,329Consumer 67,997 381 68,378Agricultural 88,607 4,286 92,893
Total $ 2,491,065 $ 65,587 $ 2,556,652
At December 31, 2020, loans considered unclassified decreased to 96.3% of total loans from 97.4% of total loans atDecember 31, 2019.
At December 31, 2020, the Company had $60.9 million, or 2.6%, of total loans excluding PPP loans participating in thepayment deferral program. For additional information see “NOTE 4 – LOANS AND ALLOWANCE FOR LOAN LOSSES” in theNotes to Consolidated Financial Statements.
In accordance with applicable regulation, appraisals or evaluations are required to independently value real estate and, as animportant element, to consider when underwriting loans secured in part or in whole by real estate. The value of real estate collateralprovides additional support to the borrower’s credit capacity.
With respect to potential problem loans, all monitored and under-performing loans are reviewed and evaluated to determine ifthey are impaired. If we determine that a loan is impaired, then we evaluate the borrower’s overall financial condition to determinethe need, if any, for possible write downs or appropriate additions to the allowance for loan losses based on the unlikelihood of fullrepayment of principal and interest in accordance with the contractual terms or the net realizable value of the pledged collateral.
Allowance for loan losses
Please see “Critical Accounting Policies – Allowance for Loan Losses” for additional discussion of our allowance policy.
74
In connection with our review of the loan portfolio, risk elements attributable to particular loan types or categories areconsidered when assessing the quality of individual loans. For additional information see “NOTE 1 – NATURE OF OPERATIONSAND SUMMARY OF SIGNIFICANT ACCOUNTING POLICIES” in the Notes to Consolidated Financial Statements.
Purchased credit impaired loans: Please see “Critical Accounting Policies – Allowance for Loan Losses” for additionaldiscussion of our purchased credit impaired loans policy. For additional information about our purchased credit impaired loans see“NOTE 4 – LOANS AND ALLOWANCE FOR LOAN LOSSES” in the Notes to Consolidated Financial Statements.
Analysis of allowance for loan and lease losses: At December 31, 2020, the allowance for loan losses totaled $33.7 million, or1.30% of total loans. At December 31, 2019, the allowance for loan losses aggregated $12.2 million, or 0.48% of total loans.
The allowance for loan losses on loans collectively evaluated for impairment totaled $23.2 million, or 0.92%, of the $2.54billion in loans collectively evaluated for impairment at December 31, 2020, compared to an allowance for loan losses of $11.0million, or 0.44%, of the $2.50 billion in loans collectively evaluated for impairment at December 31, 2019, and an allowance for loanlosses of $9.6 million, or 0.38%, of the $2.51 billion in loans collectively evaluated for impairment at December 31, 2018. Theincrease in allowance as a percentage of total loans and of loans collectively evaluated for impairment from December 31, 2019, toDecember 31, 2020, principally reflect management’s evaluation of current environmental conditions and changes in the compositionand quality of our loan portfolio.
Net losses as a percentage of average loans was 0.10% for the twelve months ended December 31, 2020, as compared to 0.68%for the twelve months ended December 31, 2019, and 0.04% for the twelve months ended December 31, 2018.
There have been no material changes to our accounting policies related to our allowance for loan and lease loss methodologyduring 2020 and 2019.
We will be adopting CECL effective January 1, 2021, and have estimated the impact from adoption related to loans held forinvestment to range from a $30.0 million to $40.0 million increase to the allowance for credit losses, a $4.0 million to $6.4 millionincrease to deferred tax asset and a $12.0 million to $19.6 million decrease to retained earnings. The increase in the allowance forcredit loss noted above includes a $14.0 million reclassification of purchased credit impaired non-accretable discount to the allowancefor credit losses. For additional information about the adoption of CECL see “NOTE 1 – NATURE OF OPERATIONS ANDSUMMARY OF SIGNIFICANT ACCOUNTING POLICIES” in the Notes to Consolidated Financial Statements.
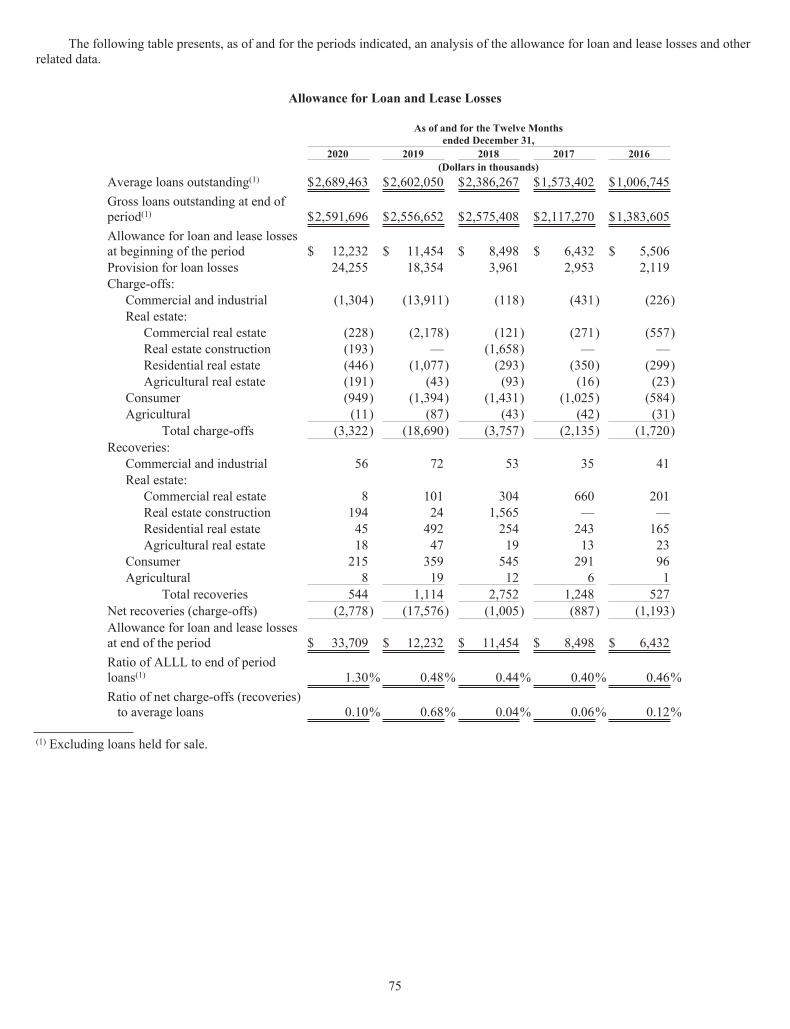
75
The following table presents, as of and for the periods indicated, an analysis of the allowance for loan and lease losses and otherrelated data.
Allowance for Loan and Lease Losses
As of and for the Twelve Monthsended December 31,
2020 2019 2018 2017 2016(Dollars in thousands)
Average loans outstanding(1) $2,689,463 $2,602,050 $2,386,267 $1,573,402 $1,006,745Gross loans outstanding at end ofperiod(1) $2,591,696 $2,556,652 $2,575,408 $2,117,270 $1,383,605Allowance for loan and lease lossesat beginning of the period $ 12,232 $ 11,454 $ 8,498 $ 6,432 $ 5,506Provision for loan losses 24,255 18,354 3,961 2,953 2,119Charge-offs:
Commercial and industrial (1,304) (13,911) (118) (431) (226)Real estate:
Commercial real estate (228) (2,178) (121) (271) (557)Real estate construction (193) — (1,658) — —Residential real estate (446) (1,077) (293) (350) (299)Agricultural real estate (191) (43) (93) (16) (23)
Consumer (949) (1,394) (1,431) (1,025) (584)Agricultural (11) (87) (43) (42) (31)
Total charge-offs (3,322) (18,690) (3,757) (2,135) (1,720)Recoveries:
Commercial and industrial 56 72 53 35 41Real estate:
Commercial real estate 8 101 304 660 201Real estate construction 194 24 1,565 — —Residential real estate 45 492 254 243 165Agricultural real estate 18 47 19 13 23
Consumer 215 359 545 291 96Agricultural 8 19 12 6 1
Total recoveries 544 1,114 2,752 1,248 527Net recoveries (charge-offs) (2,778) (17,576) (1,005) (887) (1,193)Allowance for loan and lease lossesat end of the period $ 33,709 $ 12,232 $ 11,454 $ 8,498 $ 6,432Ratio of ALLL to end of periodloans(1) 1.30% 0.48% 0.44% 0.40% 0.46%Ratio of net charge-offs (recoveries)to average loans 0.10% 0.68% 0.04% 0.06% 0.12%
(1) Excluding loans held for sale.
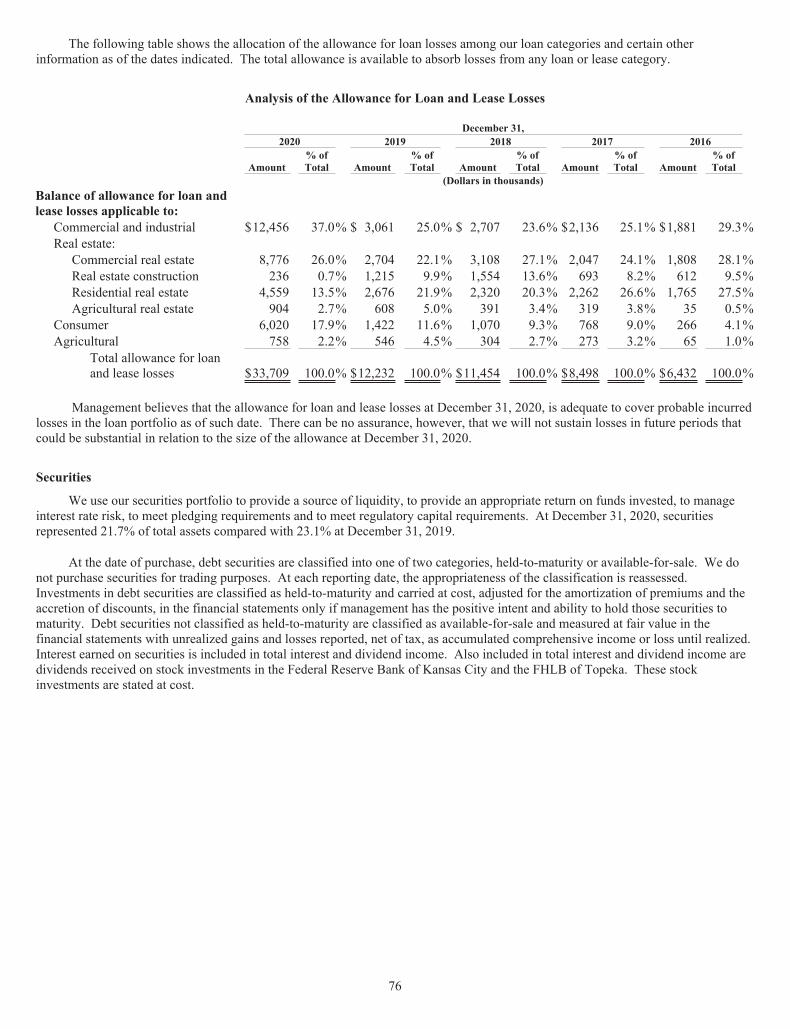
76
The following table shows the allocation of the allowance for loan losses among our loan categories and certain otherinformation as of the dates indicated. The total allowance is available to absorb losses from any loan or lease category.
Analysis of the Allowance for Loan and Lease Losses
December 31,2020 2019 2018 2017 2016
Amount% ofTotal Amount
% ofTotal Amount
% ofTotal Amount
% ofTotal Amount
% ofTotal
(Dollars in thousands)Balance of allowance for loan andlease losses applicable to:
Commercial and industrial $12,456 37.0% $ 3,061 25.0% $ 2,707 23.6% $2,136 25.1% $1,881 29.3%Real estate:
Commercial real estate 8,776 26.0% 2,704 22.1% 3,108 27.1% 2,047 24.1% 1,808 28.1%Real estate construction 236 0.7% 1,215 9.9% 1,554 13.6% 693 8.2% 612 9.5%Residential real estate 4,559 13.5% 2,676 21.9% 2,320 20.3% 2,262 26.6% 1,765 27.5%Agricultural real estate 904 2.7% 608 5.0% 391 3.4% 319 3.8% 35 0.5%
Consumer 6,020 17.9% 1,422 11.6% 1,070 9.3% 768 9.0% 266 4.1%Agricultural 758 2.2% 546 4.5% 304 2.7% 273 3.2% 65 1.0%
Total allowance for loanand lease losses $33,709 100.0% $12,232 100.0% $11,454 100.0% $8,498 100.0% $6,432 100.0%
Management believes that the allowance for loan and lease losses at December 31, 2020, is adequate to cover probable incurredlosses in the loan portfolio as of such date. There can be no assurance, however, that we will not sustain losses in future periods thatcould be substantial in relation to the size of the allowance at December 31, 2020.
Securities
We use our securities portfolio to provide a source of liquidity, to provide an appropriate return on funds invested, to manageinterest rate risk, to meet pledging requirements and to meet regulatory capital requirements. At December 31, 2020, securitiesrepresented 21.7% of total assets compared with 23.1% at December 31, 2019.
At the date of purchase, debt securities are classified into one of two categories, held-to-maturity or available-for-sale. We donot purchase securities for trading purposes. At each reporting date, the appropriateness of the classification is reassessed.Investments in debt securities are classified as held-to-maturity and carried at cost, adjusted for the amortization of premiums and theaccretion of discounts, in the financial statements only if management has the positive intent and ability to hold those securities tomaturity. Debt securities not classified as held-to-maturity are classified as available-for-sale and measured at fair value in thefinancial statements with unrealized gains and losses reported, net of tax, as accumulated comprehensive income or loss until realized.Interest earned on securities is included in total interest and dividend income. Also included in total interest and dividend income aredividends received on stock investments in the Federal Reserve Bank of Kansas City and the FHLB of Topeka. These stockinvestments are stated at cost.

77
The following table summarizes the amortized cost and fair value by classification of available-for-sale securities as of the datesshown.
Available-For-Sale Securities
December 31,2020 2019 2018
AmortizedCost
FairValue
AmortizedCost
FairValue
AmortizedCost
FairValue
(Dollars in thousands)U.S. government-sponsored entities $ 996 $ 1,023 $ — $ — $ — $ —U.S. treasury securities 4,024 4,025 — — — —Mortgage-backed securities
Government-sponsored residentialmortgage-backed securities 630,485 651,425 141,082 142,067 173,503 168,875
Private label residential mortgage-backedsecurities 44,302 44,178 — — — —
Corporate 52,503 53,650 — — — —Small Business Administration loan pools 1,226 1,270 — — — —State and local subdivisions 111,865 116,256 — — — —
Total available-for-sale securities $ 845,401 $ 871,827 $ 141,082 $ 142,067 $ 173,503 $ 168,875
The following table summarizes the amortized cost and fair value by classification of held-to-maturity securities as of the datesshown.
Held-To-Maturity Securities
December 31,2020 2019 2018
AmortizedCost
FairValue
AmortizedCost
FairValue
AmortizedCost
FairValue
(Dollars in thousands)U.S. government-sponsored entities $ — $ — $ 1,991 $ 2,013 $ 3,873 $ 3,860Mortgage-backed securities
Government-sponsored residentialmortgage-backed securities — — 593,236 603,972 567,766 560,467
Corporate — — 22,992 23,495 22,993 22,901Small Business Administration loan pools — — 1,478 1,490 1,746 1,728State and political subdivisions — — 149,362 152,941 151,978 151,033
Total held-to-maturity securities $ — $ — $ 769,059 $ 783,911 $ 748,356 $ 739,989
At December 31, 2020, 2019 and 2018, we did not own securities of any one issuer (other than the U.S. government and itsagencies or sponsored entities) for which aggregate adjusted cost exceeded 10% of the consolidated stockholders’ equity at thereporting dates noted.
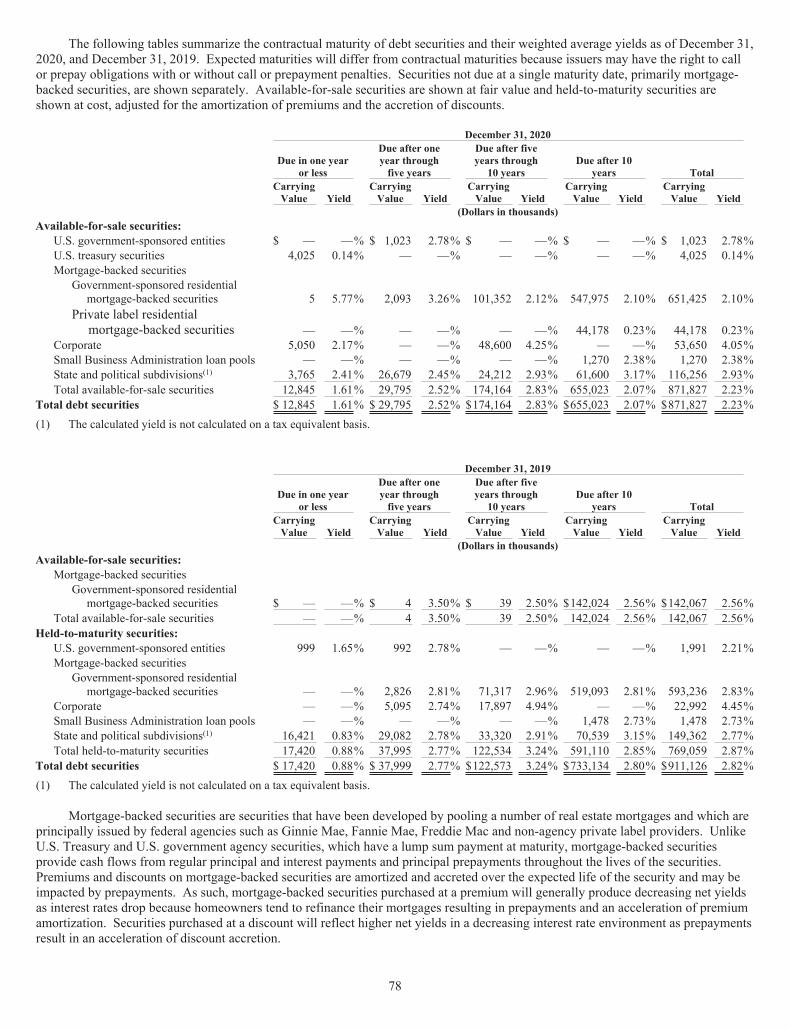
78
The following tables summarize the contractual maturity of debt securities and their weighted average yields as of December 31,2020, and December 31, 2019. Expected maturities will differ from contractual maturities because issuers may have the right to callor prepay obligations with or without call or prepayment penalties. Securities not due at a single maturity date, primarily mortgage-backed securities, are shown separately. Available-for-sale securities are shown at fair value and held-to-maturity securities areshown at cost, adjusted for the amortization of premiums and the accretion of discounts.
December 31, 2020
Due in one yearor less
Due after oneyear throughfive years
Due after fiveyears through
10 yearsDue after 10
years TotalCarryingValue Yield
CarryingValue Yield
CarryingValue Yield
CarryingValue Yield
CarryingValue Yield
(Dollars in thousands)Available-for-sale securities:
U.S. government-sponsored entities $ — —% $ 1,023 2.78% $ — —% $ — —% $ 1,023 2.78%U.S. treasury securities 4,025 0.14% — —% — —% — —% 4,025 0.14%Mortgage-backed securities
Government-sponsored residentialmortgage-backed securities 5 5.77% 2,093 3.26% 101,352 2.12% 547,975 2.10% 651,425 2.10%
Private label residentialmortgage-backed securities — —% — —% — —% 44,178 0.23% 44,178 0.23%
Corporate 5,050 2.17% — —% 48,600 4.25% — —% 53,650 4.05%Small Business Administration loan pools — —% — —% — —% 1,270 2.38% 1,270 2.38%State and political subdivisions(1) 3,765 2.41% 26,679 2.45% 24,212 2.93% 61,600 3.17% 116,256 2.93%Total available-for-sale securities 12,845 1.61% 29,795 2.52% 174,164 2.83% 655,023 2.07% 871,827 2.23%
Total debt securities $ 12,845 1.61% $ 29,795 2.52% $174,164 2.83% $655,023 2.07% $871,827 2.23%(1) The calculated yield is not calculated on a tax equivalent basis.
December 31, 2019
Due in one yearor less
Due after oneyear throughfive years
Due after fiveyears through
10 yearsDue after 10
years TotalCarryingValue Yield
CarryingValue Yield
CarryingValue Yield
CarryingValue Yield
CarryingValue Yield
(Dollars in thousands)Available-for-sale securities:
Mortgage-backed securitiesGovernment-sponsored residential
mortgage-backed securities $ — —% $ 4 3.50% $ 39 2.50% $142,024 2.56% $142,067 2.56%Total available-for-sale securities — —% 4 3.50% 39 2.50% 142,024 2.56% 142,067 2.56%
Held-to-maturity securities:U.S. government-sponsored entities 999 1.65% 992 2.78% — —% — —% 1,991 2.21%Mortgage-backed securities
Government-sponsored residentialmortgage-backed securities — —% 2,826 2.81% 71,317 2.96% 519,093 2.81% 593,236 2.83%
Corporate — —% 5,095 2.74% 17,897 4.94% — —% 22,992 4.45%Small Business Administration loan pools — —% — —% — —% 1,478 2.73% 1,478 2.73%State and political subdivisions(1) 16,421 0.83% 29,082 2.78% 33,320 2.91% 70,539 3.15% 149,362 2.77%Total held-to-maturity securities 17,420 0.88% 37,995 2.77% 122,534 3.24% 591,110 2.85% 769,059 2.87%
Total debt securities $ 17,420 0.88% $ 37,999 2.77% $122,573 3.24% $733,134 2.80% $911,126 2.82%(1) The calculated yield is not calculated on a tax equivalent basis.
Mortgage-backed securities are securities that have been developed by pooling a number of real estate mortgages and which areprincipally issued by federal agencies such as Ginnie Mae, Fannie Mae, Freddie Mac and non-agency private label providers. UnlikeU.S. Treasury and U.S. government agency securities, which have a lump sum payment at maturity, mortgage-backed securitiesprovide cash flows from regular principal and interest payments and principal prepayments throughout the lives of the securities.Premiums and discounts on mortgage-backed securities are amortized and accreted over the expected life of the security and may beimpacted by prepayments. As such, mortgage-backed securities purchased at a premium will generally produce decreasing net yieldsas interest rates drop because homeowners tend to refinance their mortgages resulting in prepayments and an acceleration of premiumamortization. Securities purchased at a discount will reflect higher net yields in a decreasing interest rate environment as prepaymentsresult in an acceleration of discount accretion.

79
The contractual maturity of mortgage-backed securities is not a reliable indicator of their expected lives because borrowers havethe right to prepay their obligations at any time. Monthly pay downs on mortgage-backed securities cause the average lives of thesesecurities to be much different than their stated lives. At December 31, 2020, and December 31, 2019, 85.1% and 89.9% of themortgage-backed securities held by us had contractual final maturities of more than ten years with a weighted average life of 2.5 yearsand 4.2 years and a modified duration of 2.4 years and 3.8 years.
Deposits
Our lending and investing activities are primarily funded by deposits. A variety of deposit accounts are offered with a widerange of interest rates and terms including demand, savings, money market and time deposits. We rely primarily on competitivepricing policies, convenient locations, comprehensive marketing strategy and personalized service to attract and retain these deposits.
The following table shows our composition of deposits at December 31, 2020, 2019 and 2018.
Composition of DepositsDecember 31,
2020 2019 2018 2020 vs. 2019 2019 vs. 2018
Amount
Percentof
Total Amount
Percentof
Total Amount
Percentof
Total Change % Change %(Dollars in thousands)
Non-interest-bearingdemand $ 791,639 22.9% $ 481,298 15.7% $ 503,831 16.1% $ 310,341 64.5% $ (22,533) (4.5)%Interest-bearing demandand NOW accounts 1,016,424 29.5% 703,048 23.0% 671,320 21.5% 313,376 44.6% 31,728 4.7%Savings and money market 1,012,673 29.4% 1,046,000 34.1% 940,390 30.1% (33,327) (3.2)% 105,610 11.2%Time 626,854 18.2% 833,170 27.2% 1,007,906 32.3% (206,316) (24.8)% (174,736) (17.3)%
Total deposits $3,447,590 100.0% $3,063,516 100.0% $3,123,447 100.0% $ 384,074 12.5% $ (59,931) (1.9)%
The following table shows deposits assumed in 2020 acquisitions, as of the time of such acquisitions.
Almena Acquisition
AmountPercent ofTotal
(Dollars in thousands)Non-interest-bearing demand $ 11,737 18.8%Interest-bearing demand and NOW accounts 6,238 10.0%Savings and money market 5,835 9.3%Time 38,662 61.9%
Total deposits $ 62,472 100.0%
The following table shows deposits assumed in 2019 acquisitions, as of the time of such acquisitions.
MidFirst Acquisition
AmountPercent ofTotal
(Dollars in thousands)Non-interest-bearing demand $ 12,662 12.9%Interest-bearing demand and NOW accounts 11,538 11.7%Savings and money market 24,269 24.6%Time 50,074 50.8%
Total deposits $ 98,543 100.0%
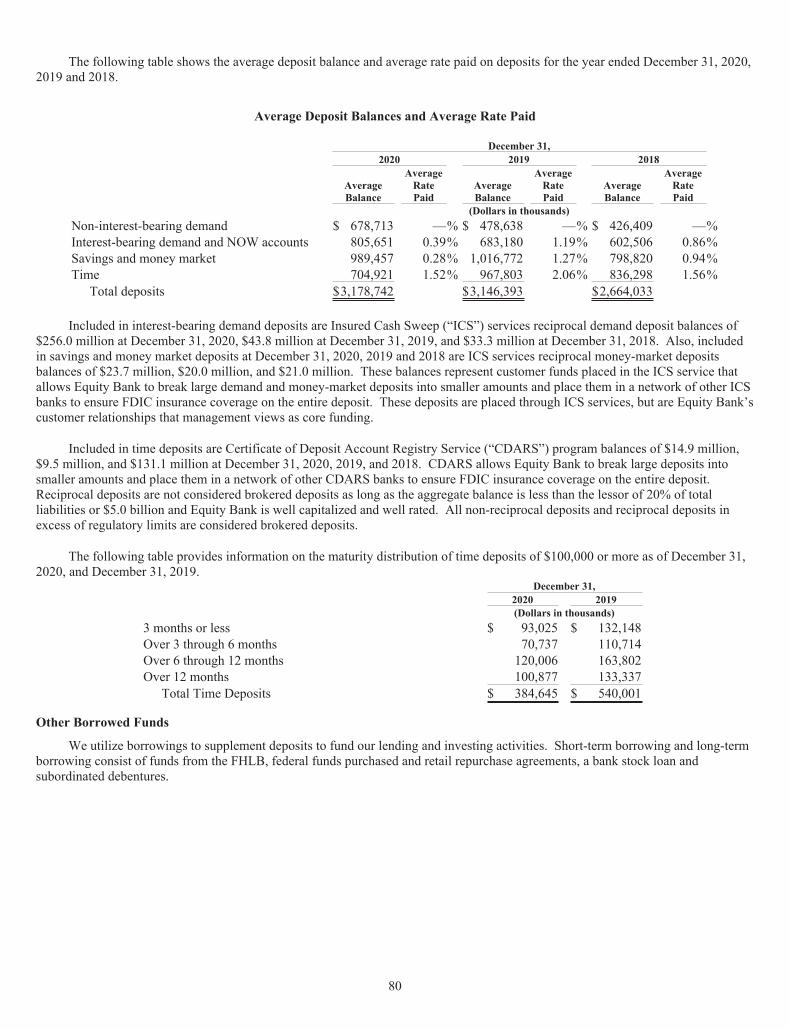
80
The following table shows the average deposit balance and average rate paid on deposits for the year ended December 31, 2020,2019 and 2018.
Average Deposit Balances and Average Rate Paid
December 31,2020 2019 2018
AverageBalance
AverageRatePaid
AverageBalance
AverageRatePaid
AverageBalance
AverageRatePaid
(Dollars in thousands)Non-interest-bearing demand $ 678,713 —% $ 478,638 —% $ 426,409 —%Interest-bearing demand and NOW accounts 805,651 0.39% 683,180 1.19% 602,506 0.86%Savings and money market 989,457 0.28% 1,016,772 1.27% 798,820 0.94%Time 704,921 1.52% 967,803 2.06% 836,298 1.56%
Total deposits $3,178,742 $3,146,393 $2,664,033
Included in interest-bearing demand deposits are Insured Cash Sweep (“ICS”) services reciprocal demand deposit balances of$256.0 million at December 31, 2020, $43.8 million at December 31, 2019, and $33.3 million at December 31, 2018. Also, includedin savings and money market deposits at December 31, 2020, 2019 and 2018 are ICS services reciprocal money-market depositsbalances of $23.7 million, $20.0 million, and $21.0 million. These balances represent customer funds placed in the ICS service thatallows Equity Bank to break large demand and money-market deposits into smaller amounts and place them in a network of other ICSbanks to ensure FDIC insurance coverage on the entire deposit. These deposits are placed through ICS services, but are Equity Bank’scustomer relationships that management views as core funding.
Included in time deposits are Certificate of Deposit Account Registry Service (“CDARS”) program balances of $14.9 million,$9.5 million, and $131.1 million at December 31, 2020, 2019, and 2018. CDARS allows Equity Bank to break large deposits intosmaller amounts and place them in a network of other CDARS banks to ensure FDIC insurance coverage on the entire deposit.Reciprocal deposits are not considered brokered deposits as long as the aggregate balance is less than the lessor of 20% of totalliabilities or $5.0 billion and Equity Bank is well capitalized and well rated. All non-reciprocal deposits and reciprocal deposits inexcess of regulatory limits are considered brokered deposits.
The following table provides information on the maturity distribution of time deposits of $100,000 or more as of December 31,2020, and December 31, 2019.
December 31,2020 2019(Dollars in thousands)
3 months or less $ 93,025 $ 132,148Over 3 through 6 months 70,737 110,714Over 6 through 12 months 120,006 163,802Over 12 months 100,877 133,337
Total Time Deposits $ 384,645 $ 540,001
Other Borrowed Funds
We utilize borrowings to supplement deposits to fund our lending and investing activities. Short-term borrowing and long-termborrowing consist of funds from the FHLB, federal funds purchased and retail repurchase agreements, a bank stock loan andsubordinated debentures.
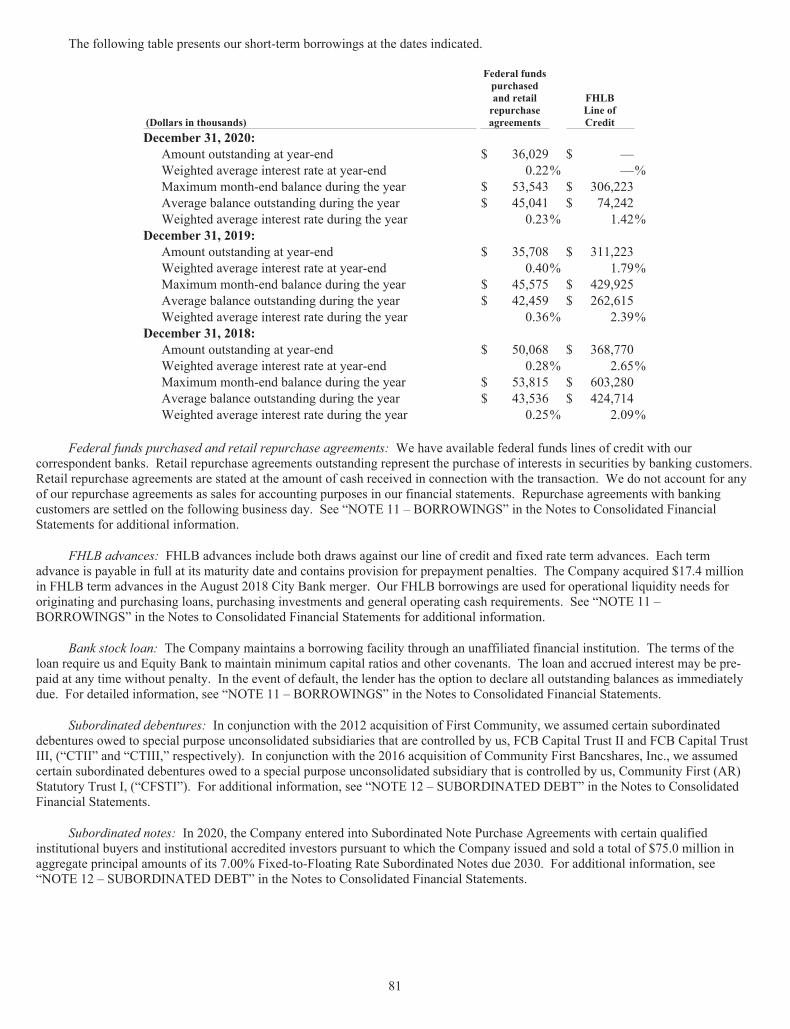
81
The following table presents our short-term borrowings at the dates indicated.
(Dollars in thousands)
Federal fundspurchasedand retailrepurchaseagreements
FHLBLine ofCredit
December 31, 2020:Amount outstanding at year-end $ 36,029 $ —Weighted average interest rate at year-end 0.22% —%Maximum month-end balance during the year $ 53,543 $ 306,223Average balance outstanding during the year $ 45,041 $ 74,242Weighted average interest rate during the year 0.23% 1.42%
December 31, 2019:Amount outstanding at year-end $ 35,708 $ 311,223Weighted average interest rate at year-end 0.40% 1.79%Maximum month-end balance during the year $ 45,575 $ 429,925Average balance outstanding during the year $ 42,459 $ 262,615Weighted average interest rate during the year 0.36% 2.39%
December 31, 2018:Amount outstanding at year-end $ 50,068 $ 368,770Weighted average interest rate at year-end 0.28% 2.65%Maximum month-end balance during the year $ 53,815 $ 603,280Average balance outstanding during the year $ 43,536 $ 424,714Weighted average interest rate during the year 0.25% 2.09%
Federal funds purchased and retail repurchase agreements: We have available federal funds lines of credit with ourcorrespondent banks. Retail repurchase agreements outstanding represent the purchase of interests in securities by banking customers.Retail repurchase agreements are stated at the amount of cash received in connection with the transaction. We do not account for anyof our repurchase agreements as sales for accounting purposes in our financial statements. Repurchase agreements with bankingcustomers are settled on the following business day. See “NOTE 11 – BORROWINGS” in the Notes to Consolidated FinancialStatements for additional information.
FHLB advances: FHLB advances include both draws against our line of credit and fixed rate term advances. Each termadvance is payable in full at its maturity date and contains provision for prepayment penalties. The Company acquired $17.4 millionin FHLB term advances in the August 2018 City Bank merger. Our FHLB borrowings are used for operational liquidity needs fororiginating and purchasing loans, purchasing investments and general operating cash requirements. See “NOTE 11 –BORROWINGS” in the Notes to Consolidated Financial Statements for additional information.
Bank stock loan: The Company maintains a borrowing facility through an unaffiliated financial institution. The terms of theloan require us and Equity Bank to maintain minimum capital ratios and other covenants. The loan and accrued interest may be pre-paid at any time without penalty. In the event of default, the lender has the option to declare all outstanding balances as immediatelydue. For detailed information, see “NOTE 11 – BORROWINGS” in the Notes to Consolidated Financial Statements.
Subordinated debentures: In conjunction with the 2012 acquisition of First Community, we assumed certain subordinateddebentures owed to special purpose unconsolidated subsidiaries that are controlled by us, FCB Capital Trust II and FCB Capital TrustIII, (“CTII” and “CTIII,” respectively). In conjunction with the 2016 acquisition of Community First Bancshares, Inc., we assumedcertain subordinated debentures owed to a special purpose unconsolidated subsidiary that is controlled by us, Community First (AR)Statutory Trust I, (“CFSTI”). For additional information, see “NOTE 12 – SUBORDINATED DEBT” in the Notes to ConsolidatedFinancial Statements.
Subordinated notes: In 2020, the Company entered into Subordinated Note Purchase Agreements with certain qualifiedinstitutional buyers and institutional accredited investors pursuant to which the Company issued and sold a total of $75.0 million inaggregate principal amounts of its 7.00% Fixed-to-Floating Rate Subordinated Notes due 2030. For additional information, see“NOTE 12 – SUBORDINATED DEBT” in the Notes to Consolidated Financial Statements.
82
Liquidity and Capital Resources
Liquidity
Market and public confidence in our financial strength and financial institutions in general will largely determine access toappropriate levels of liquidity. This confidence is significantly dependent on our ability to maintain sound asset quality andappropriate levels of capital reserves.
Liquidity is defined as the ability to meet anticipated customer demands for future funds under credit commitments and depositwithdrawals at a reasonable cost and on a timely basis. We measure our liquidity position by giving consideration to both on- and off-balance sheet sources of and demands for funds on a daily, weekly and monthly basis.
Liquidity risk involves the risk of being unable to fund assets with the appropriate duration and rate-based liabilities, as well asthe risk of not being able to meet unexpected cash needs. Liquidity planning and management are necessary to ensure the ability tofund operations in a cost-effective manner and to meet current and future potential obligations such as loan commitments, leaseobligations and unexpected deposit outflows. In this process, we focus on both assets and liabilities and on the manner in which theycombine to provide adequate liquidity to meet our needs.
During the years ended December 31, 2020, 2019 and 2018, our liquidity needs have primarily been met by core deposits,security and loan maturities and amortizing investment and loan portfolios. Other funding sources include federal funds purchased,retail repurchase agreements, brokered certificates of deposit, subordinated notes and borrowings from the FHLB.
Our largest sources of funds are FHLB borrowings and deposits and our largest uses of funds are the origination or purchases ofloans and securities purchases. Average loans were $2.70 billion for the year ended December 31, 2020, an increase of 3.4% overaverage loans of $2.61 billion for the year ended December 31, 2019. Excess deposits are primarily invested in our interest-bearingdeposit account with the Kansas City Federal Reserve Bank, investment securities, federal funds sold or other short-term liquidinvestments until the funds are needed to fund loan growth. Our securities portfolio has a weighted average life of 3.0 years and amodified duration of 2.8 years at December 31, 2020. We believe that our daily funding needs can be met through cash provided byoperating activities, payments and maturities on loans and investment securities, our core deposit base, FHLB advances and otherborrowing relationships. On March 13, 2017, the Company entered into an agreement with an unaffiliated financial institution thatprovided for a maximum borrowing facility of $30.0 million, which was subsequently amended on March 11, 2019, to increase themaximum borrowing facility to $40.0 million. This agreement, which is secured by Equity Bank stock, can be used to fund futureacquisitions and for general corporate purposes. There was no outstanding balance on this borrowing facility for the period endingDecember 31, 2020.
Cash Flow Overview
During 2020, operating activities provided $43.6 million of liquidity, investing activities infused $96.0 million of cash assetsand financing activities generated $51.8 million of additional funds, ultimately increasing total cash and cash equivalents by $191.4million. The cash provided by investing activities came primarily from $66.9 million of net proceeds from securities transactions and$25.9 million of net cash received from the Almena acquisition. The cash provided by financing activities was principally due to a$321.5 million increase in deposits and $75.0 million from subordinated notes originations, partially offset by a $314.2 millionreduction in FHLB borrowings, treasury stock purchases of $19.3 million and a $9.0 million net payoff of the bank stock loan.
During 2019, $48.5 million of liquidity was provided by operating activities and $96.1 million of net cash via investingactivities was offset by $248.1 million of net cash used in financing activities, resulting in a $103.5 million reduction in cash and cashequivalents. The cash provided by investing activities came principally from $85.4 million of net cash received from the MidFirstacquisition plus an $8.5 million net reduction in loan balances. The cash usage in financing activities was driven mostly by a $158.7million decrease in deposits, a $60.5 million paydown in FHLB advances, a $14.4 million reduction in federal funds purchased andretail repurchase agreements, $10.9 million for treasury stock purchases, premises and equipment acquisitions for $6.9 million and$6.5 million in net principal payments on the bank stock loan.
For information related to cash flow during 2018, see “Item 7 – Management’s Discussion and Analysis of Financial Conditionand Results of Operations” in our Annual Report on Form 10-K filed with the SEC on March 10, 2020.
Off-Balance Sheet Items
In the normal course of business, we enter into various transactions, which, in accordance with GAAP, are not included in ourconsolidated balance sheets. We enter into these transactions to meet the financing needs of our customers. These transactionsinclude commitments to extend credit and standby and commercial letters of credit, which involve, to varying degrees, elements ofcredit risk and interest rate risk in excess of the amounts recognized in the consolidated balance sheets. Our exposure to credit loss is

83
represented by the contractual amounts of these commitments. The same credit policies and procedures are used in making thesecommitments as for on-balance sheet instruments.
Our commitments associated with outstanding standby and performance letters of credit and commitments to extend creditexpiring by period as of December 31, 2020, are summarized below. Since commitments associated with letters of credit andcommitments to extend credit may expire unused, the amounts shown do not necessarily reflect the actual future cash fundingrequirements.
Credit Extensions and CommitmentsDecember 31, 2020
1 Yearor Less
More Than1 Year but LessThan 3 Years
3 Years orMore but LessThan 5 Years
5 Yearsor More Total
(Dollars in thousands)Standby and performance letters of credit $ 11,746 $ 311 $ 277 $ — $ 12,334Commitments to extend credit 280,632 35,932 73,915 152,494 542,973
Total $ 292,378 $ 36,243 $ 74,192 $ 152,494 $ 555,307
Standby and Performance Letters of Credit: For additional information see “NOTE 22 – COMMITMENTS AND CREDITRISK” in the Notes to Consolidated Financial Statements.
Commitments to Extend Credit: For additional information see “NOTE 22 – COMMITMENTS AND CREDIT RISK” in theNotes to Consolidated Financial Statements.
Contractual Obligations
The following table summarizes our contractual obligations and other commitments to make future payments as ofDecember 31, 2020 (other than securities sold under repurchase agreements). These obligations consist of our future cash paymentsassociated with contractual obligations pursuant to FHLB advances, time deposit contracts, borrowed funds, and non-cancelable futureoperating leases. Payments related to leases are based on actual payments specified in underlying contracts.
Other contractual obligations represent commitments made by us to make capital investments in limited-liability entities thatinvest in qualified affordable housing projects. Payments on these obligations are made as requested by the managers of the limited-liability entities, however the table below includes an estimate of the anticipated timing of payments pursuant to these commitments.
Contractual ObligationsDecember 31, 2020
1 Yearor Less
More Than1 Year butLess Than3 Years
3 Years orMore butLess Than5 Years
5 Years orMore Total
(Dollars in thousands)Certificates and other time deposits $ 456,542 $ 149,580 $ 20,123 $ 609 $ 626,854Subordinated debentures — — — 14,872 14,872Subordinated notes — — — 72,812 72,812FHLB advances 2,357 4,714 3,036 — 10,107Other contractual obligation commitments 3,436 1,662 17 74 5,189Non-cancellable future operating leases 360 725 289 2,150 3,524
Total $ 462,695 $ 156,681 $ 23,465 $ 90,517 $ 733,358
Capital Resources
Capital management consists of providing equity to support our current and future operations. The bank regulators view capitallevels as important indicators of an institution’s financial soundness. As a general matter, FDIC-insured depository institutions andtheir holding companies are required to maintain minimum capital relative to the amount and types of assets they hold. As a bankholding company and a state-chartered-Fed-member bank, the Company and Equity Bank are subject to regulatory capitalrequirements.

84
Capital adequacy guidelines and prompt corrective action regulations involve quantitative measures of assets, liabilities andcertain off-balance-sheet items calculated under regulatory accounting practices. Capital amounts and classifications are also subjectto qualitative judgments by regulators. Failure to meet capital requirements can initiate regulatory action. Management believes as ofDecember 31, 2020, and December 31, 2019, the Company and Equity Bank meet all capital adequacy requirements to which they aresubject.
Prompt corrective action regulations provide five classifications: well capitalized, adequately capitalized, undercapitalized,significantly undercapitalized, and critically undercapitalized, although these terms are not used to represent overall financialcondition. If adequately capitalized, regulatory approval is required to accept brokered deposits. If undercapitalized, capitaldistributions are limited, as are asset growth and acquisitions, and capital restoration plans are required.
Failure to meet capital guidelines could subject the institution to a variety of enforcement remedies by federal bank regulatoryagencies, including termination of deposit insurance by the FDIC, restrictions on certain business activities and appointment of theFDIC as conservator or receiver. As of December 31, 2020, the most recent notifications from the federal regulatory agenciescategorized Equity Bank as “well capitalized” under the regulatory framework for prompt corrective action. To be categorized as wellcapitalized, Equity Bank must maintain minimum total capital, Tier 1 capital, Common Equity Tier 1 capital and Tier 1 leverage ratiosas set forth in the table. There are no conditions or events since that notification that management believes have changed EquityBank’s category.
The decrease in stockholders’ equity was principally attributable to a loss of $75.0 million for the year ended December 31,2020, and treasury stock purchases of $19.3 million, partially offset by change in other comprehensive gain of $19.8 million, stockbased compensation of $3.5 million, common stock issued under employee stock purchase plan of $596 thousand, employee stockloan payments of $34 thousand and common stock issued upon exercise of stock options of $20 thousand. For additional informationabout the Company’s capital see “NOTE 16 – REGULATORY MATTERS” in Notes to Consolidated Financial Statements.
Non-GAAP Financial Measures
We identify certain financial measures discussed in this Annual Report on Form 10-K as being “non-GAAP financialmeasures.” In accordance with the SEC’s rules, we classify a financial measure as being a non-GAAP financial measure if thatfinancial measure excludes or includes amounts, or is subject to adjustments that have the effect of excluding or including amounts,that are included or excluded, as the case may be, in the most directly comparable measure calculated and presented in accordancewith generally accepted accounting principles as in effect from time to time in the United States in our statements of income, balancesheets or statements of cash flows. Non-GAAP financial measures do not include operating and other statistical measures or ratios orstatistical measures calculated using exclusively either financial measures calculated in accordance with GAAP, operating measures orother measures that are not non-GAAP financial measures or both.
The non-GAAP financial measures that we discuss in this Annual Report on Form 10-K should not be considered in isolation oras a substitute for the most directly comparable or other financial measures calculated in accordance with GAAP. Moreover, themanner in which we calculate the non-GAAP financial measures that we discuss in this Annual Report on Form 10-K may differ fromthat of other companies reporting measures with similar names. You should understand how such other banking organizationscalculate their financial measures similar or with names similar to the non-GAAP financial measures we have discussed in this AnnualReport on Form 10-K when comparing such non-GAAP financial measures.
Tangible Book Value per Common Share and Tangible Book Value Per Diluted Common Share: Tangible book value is a non-GAAP measure generally used by financial analysts and investment bankers to evaluate financial institutions. We calculate:(a) tangible common equity as total stockholders’ equity less preferred stock, goodwill, core deposit intangibles, net of accumulatedamortization, mortgage servicing asset, net of accumulated amortization and naming rights, net of accumulated amortization;(b) tangible book value per common share as tangible common equity (as described in clause (a)) divided by shares of common stockoutstanding; and (c) tangible book value per diluted common share as tangible common equity (as described in clause (a)) divided byshares of common stock outstanding plus the period-end dilutive effects of vested restricted stock units and the assumed exercise ofstock options and redemption of non-vested restricted stock units. For tangible book value, the most directly comparable financialmeasure calculated in accordance with GAAP is book value.
Management believes that these measures are important to many investors who are interested in changes from period to periodin book value per common share exclusive of changes in intangible assets. Goodwill and other intangible assets have the effect ofincreasing total book value while not increasing our tangible book value.

85
The following table reconciles, as of the dates set forth below, total stockholders’ equity to tangible common equity, tangiblebook value per common share, and diluted tangible book value per common share and compares these values with book value percommon share.
December 31,2020 2019 2018 2017 2016
(Dollars in thousands, except share data)Total stockholders’ equity $ 407,649 $ 478,060 $ 455,941 $ 374,144 $ 257,964Less: goodwill 31,601 136,432 131,712 104,907 58,874Less: core deposit intangibles, net 16,057 19,907 21,725 10,738 4,715Less: mortgage servicing asset, net — 5 11 17 23Less: naming rights, net 1,130 1,174 1,217 1,260 —
Tangible common equity $ 358,861 $ 320,542 $ 301,276 $ 257,222 $ 194,352Common shares outstanding at period end 14,540,556 15,444,434 15,793,095 14,605,607 11,680,308Diluted common shares outstanding at period end 14,540,556 15,719,810 16,085,729 14,873,257 11,873,480
Book value per common share $ 28.04 $ 30.95 $ 28.87 $ 25.62 $ 22.09Tangible book value per common share $ 24.68 $ 20.75 $ 19.08 $ 17.61 $ 16.64Tangible book value per diluted common share $ 24.68 $ 20.39 $ 18.73 $ 17.29 $ 16.37
Tangible Common Equity to Tangible Assets: Tangible common equity to tangible assets is a non-GAAP measure generallyused by financial analysts and investment bankers to evaluate financial institutions. We calculate: (a) tangible common equity as totalstockholders’ equity less preferred stock, goodwill, core deposit intangibles, net of accumulated amortization, mortgage servicingasset, net of accumulated amortization and naming rights, net of accumulated amortization; (b) tangible assets as total assets lessgoodwill, core deposit intangibles, net of accumulated amortization, mortgage servicing asset, net of accumulated amortization andnaming rights, net of accumulated amortization; and (c) tangible common equity to tangible assets as tangible common equity (asdescribed in clause (a)) divided by tangible assets (as described in clause (b)). For common equity to tangible assets, the most directlycomparable financial measure calculated in accordance with GAAP is total stockholders’ equity to total assets.
Management believes that this measure is important to many investors in the marketplace who are interested in the relativechanges from period to period in common equity and total assets, each exclusive of changes in intangible assets. Goodwill and otherintangible assets have the effect of increasing both total stockholders’ equity and total assets while not increasing tangible commonequity or tangible assets.
The following table reconciles, as of the dates set forth below, total stockholders’ equity to tangible common equity and totalassets to tangible assets.
December 31,2020 2019 2018 2017 2016
(Dollars in thousands)Total stockholders’ equity $ 407,649 $ 478,060 $ 455,941 $ 374,144 $ 257,964Less: goodwill 31,601 136,432 131,712 104,907 58,874Less: core deposit intangibles, net 16,057 19,907 21,725 10,738 4,715Less: mortgage servicing asset, net — 5 11 17 23Less: naming rights, net 1,130 1,174 1,217 1,260 —
Tangible common equity $ 358,861 $ 320,542 $ 301,276 $ 257,222 $ 194,352Total assets $4,013,356 $3,949,578 $4,061,716 $3,170,509 $ 2,192,192Less: goodwill 31,601 136,432 131,712 104,907 58,874Less: core deposit intangibles, net 16,057 19,907 21,725 10,738 4,715Less: mortgage servicing asset, net — 5 11 17 23Less: naming rights, net 1,130 1,174 1,217 1,260 —
Tangible assets $3,964,568 $3,792,060 $3,907,051 $3,053,587 $ 2,128,580Equity / assets 10.16% 12.10% 11.23% 11.80% 11.77%Tangible common equity to tangible assets 9.05% 8.45% 7.71% 8.42% 9.13%

86
Return on Average Tangible Common Equity: Return on average tangible common equity is a non-GAAP measure generallyused by financial analysts and investment bankers to evaluate financial institutions. We calculate: (a) average tangible common equityas total average stockholders’ equity less average intangible assets and preferred stock; (b) adjusted net income allocable to commonstockholders as net income allocable to common stockholders plus goodwill impairment, net of actual tax effect, plus amortization ofintangible assets less estimated tax effect on amortization of intangible assets (tax rates used in this calculation were 21% for 2020,2019 and 2018; 35% for 2017 and 2016) (c) return on average tangible common equity as adjusted net income allocable to commonstockholders (as described in clause (b)) divided by average tangible common equity (as described in clause (a)). For return onaverage tangible common equity, the most directly comparable financial measure calculated in accordance with GAAP is return onaverage equity.
Management believes that this measure is important to many investors in the marketplace because it measures the return onequity, exclusive of the effects of intangible assets on earnings and capital. Goodwill and other intangible assets have the effect ofincreasing average stockholders’ equity and, through amortization, decreasing net income allocable to common stockholders while notincreasing average tangible common equity or decreasing adjusted net income allocable to common stockholders.
The following table reconciles, as of the dates set forth below, total average stockholders’ equity to average tangible commonequity and net income allocable to common stockholders to adjusted net income allocable to common stockholders.
December 31,2020 2019 2018 2017 2016
(Dollars in thousands)Total average stockholders’ equity $ 464,608 $ 463,445 $ 420,453 $ 293,798 $ 168,823Less: average intangible assets 130,329 158,410 139,131 76,320 25,883
Average tangible common equity $ 334,279 $ 305,035 $ 281,322 $ 217,478 $ 142,940Net income (loss) allocable to common stockholders $ (74,970) $ 25,579 $ 35,825 $ 20,649 $ 9,373Plus: goodwill impairment, net of actual tax effect 99,526 — — — —Amortization of intangible assets 3,898 3,218 2,492 1,070 419Less: estimated tax effect on intangible asset amortization 819 676 523 375 147
Adjusted net income allocable to commonstockholders $ 27,635 $ 28,121 $ 37,794 $ 21,344 $ 9,645
Return on average equity (ROAE) (16.14)% 5.52% 8.52% 7.03% 5.55%Return on average tangible common equity(ROATCE) 8.27% 9.22% 13.43% 9.81% 6.75%
Efficiency Ratio: The efficiency ratio is a non-GAAP measure generally used by financial analysts and investment bankers toevaluate financial institutions. We calculate the efficiency ratio by dividing non-interest expense, excluding goodwill impairment,merger expenses and loss on debt extinguishment, by the sum of net interest income and non-interest income, excluding net gains onthe sale of available-for-sale securities and other securities transactions, and the net gain on acquisition. The GAAP-based efficiencyratio is non-interest expenses divided by net interest income plus non-interest income.
In management’s judgment, the adjustments made to non-interest expense and non-interest income allow investors and analyststo better assess operating expenses in relation to operating revenue by removing merger expenses, loss on debt extinguishment, netgains on the sale of available-for-sale securities and other securities transactions, and the net gain on acquisition.
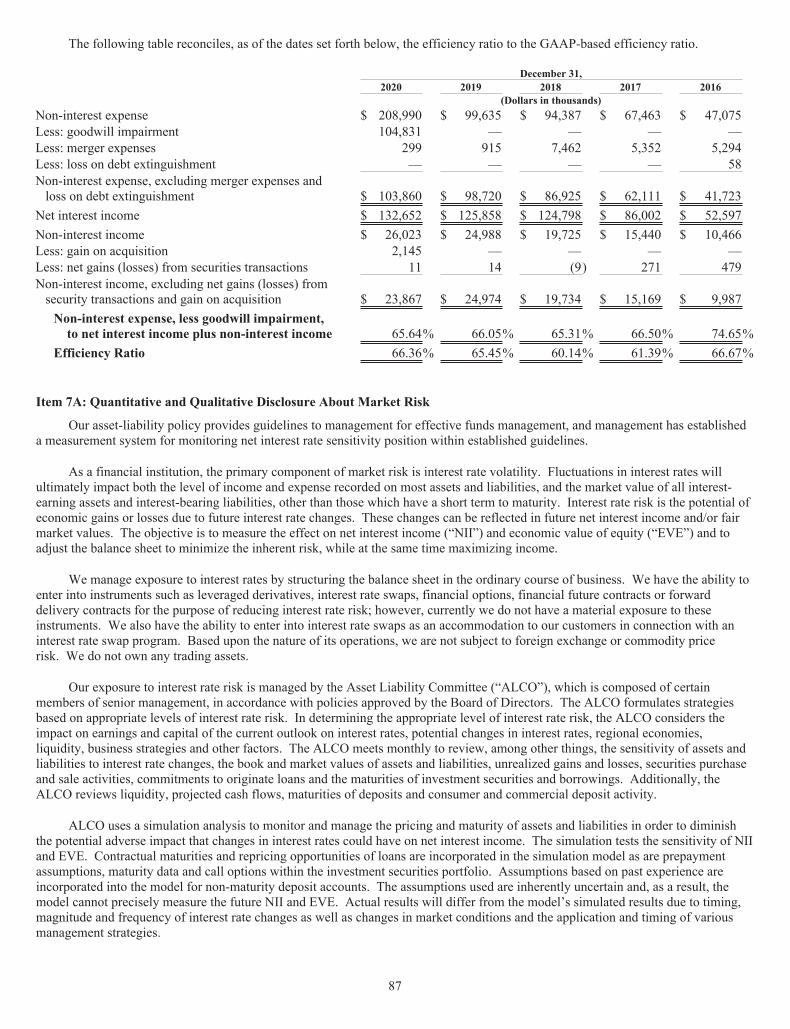
87
The following table reconciles, as of the dates set forth below, the efficiency ratio to the GAAP-based efficiency ratio.
December 31,2020 2019 2018 2017 2016
(Dollars in thousands)Non-interest expense $ 208,990 $ 99,635 $ 94,387 $ 67,463 $ 47,075Less: goodwill impairment 104,831 — — — —Less: merger expenses 299 915 7,462 5,352 5,294Less: loss on debt extinguishment — — — — 58Non-interest expense, excluding merger expenses andloss on debt extinguishment $ 103,860 $ 98,720 $ 86,925 $ 62,111 $ 41,723
Net interest income $ 132,652 $ 125,858 $ 124,798 $ 86,002 $ 52,597Non-interest income $ 26,023 $ 24,988 $ 19,725 $ 15,440 $ 10,466Less: gain on acquisition 2,145 — — — —Less: net gains (losses) from securities transactions 11 14 (9) 271 479Non-interest income, excluding net gains (losses) fromsecurity transactions and gain on acquisition $ 23,867 $ 24,974 $ 19,734 $ 15,169 $ 9,987Non-interest expense, less goodwill impairment,to net interest income plus non-interest income 65.64% 66.05% 65.31% 66.50% 74.65%
Efficiency Ratio 66.36% 65.45% 60.14% 61.39% 66.67%
Item 7A: Quantitative and Qualitative Disclosure About Market Risk
Our asset-liability policy provides guidelines to management for effective funds management, and management has establisheda measurement system for monitoring net interest rate sensitivity position within established guidelines.
As a financial institution, the primary component of market risk is interest rate volatility. Fluctuations in interest rates willultimately impact both the level of income and expense recorded on most assets and liabilities, and the market value of all interest-earning assets and interest-bearing liabilities, other than those which have a short term to maturity. Interest rate risk is the potential ofeconomic gains or losses due to future interest rate changes. These changes can be reflected in future net interest income and/or fairmarket values. The objective is to measure the effect on net interest income (“NII”) and economic value of equity (“EVE”) and toadjust the balance sheet to minimize the inherent risk, while at the same time maximizing income.
We manage exposure to interest rates by structuring the balance sheet in the ordinary course of business. We have the ability toenter into instruments such as leveraged derivatives, interest rate swaps, financial options, financial future contracts or forwarddelivery contracts for the purpose of reducing interest rate risk; however, currently we do not have a material exposure to theseinstruments. We also have the ability to enter into interest rate swaps as an accommodation to our customers in connection with aninterest rate swap program. Based upon the nature of its operations, we are not subject to foreign exchange or commodity pricerisk. We do not own any trading assets.
Our exposure to interest rate risk is managed by the Asset Liability Committee (“ALCO”), which is composed of certainmembers of senior management, in accordance with policies approved by the Board of Directors. The ALCO formulates strategiesbased on appropriate levels of interest rate risk. In determining the appropriate level of interest rate risk, the ALCO considers theimpact on earnings and capital of the current outlook on interest rates, potential changes in interest rates, regional economies,liquidity, business strategies and other factors. The ALCO meets monthly to review, among other things, the sensitivity of assets andliabilities to interest rate changes, the book and market values of assets and liabilities, unrealized gains and losses, securities purchaseand sale activities, commitments to originate loans and the maturities of investment securities and borrowings. Additionally, theALCO reviews liquidity, projected cash flows, maturities of deposits and consumer and commercial deposit activity.
ALCO uses a simulation analysis to monitor and manage the pricing and maturity of assets and liabilities in order to diminishthe potential adverse impact that changes in interest rates could have on net interest income. The simulation tests the sensitivity of NIIand EVE. Contractual maturities and repricing opportunities of loans are incorporated in the simulation model as are prepaymentassumptions, maturity data and call options within the investment securities portfolio. Assumptions based on past experience areincorporated into the model for non-maturity deposit accounts. The assumptions used are inherently uncertain and, as a result, themodel cannot precisely measure the future NII and EVE. Actual results will differ from the model’s simulated results due to timing,magnitude and frequency of interest rate changes as well as changes in market conditions and the application and timing of variousmanagement strategies.
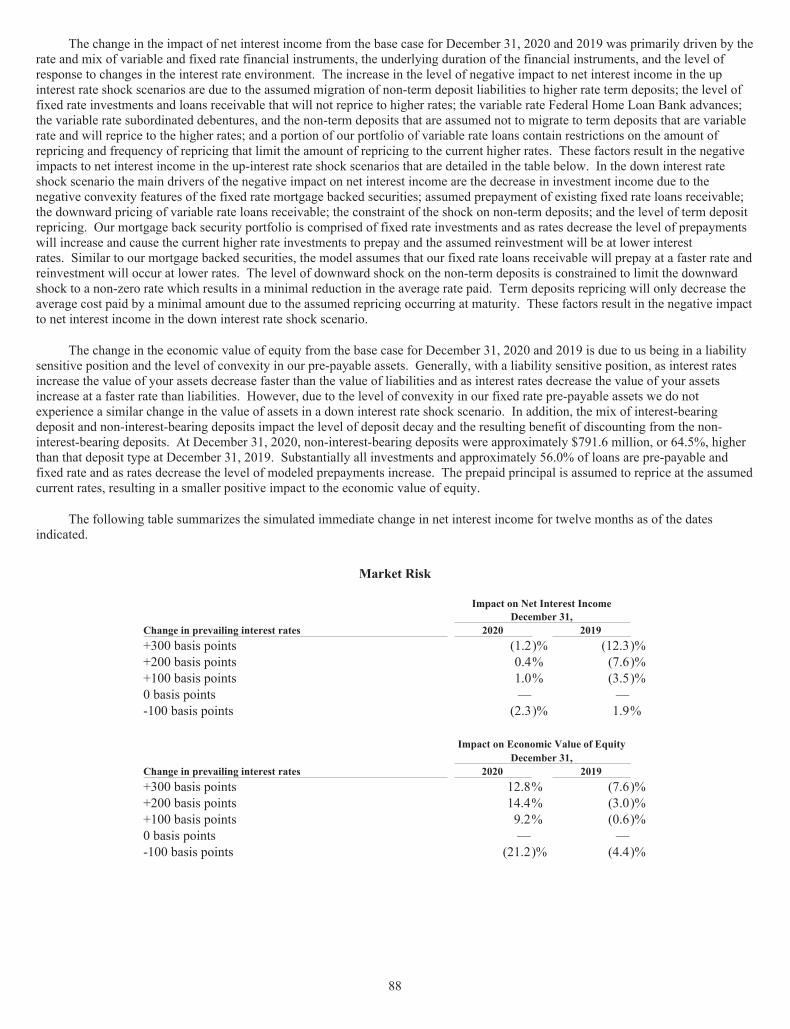
88
The change in the impact of net interest income from the base case for December 31, 2020 and 2019 was primarily driven by therate and mix of variable and fixed rate financial instruments, the underlying duration of the financial instruments, and the level ofresponse to changes in the interest rate environment. The increase in the level of negative impact to net interest income in the upinterest rate shock scenarios are due to the assumed migration of non-term deposit liabilities to higher rate term deposits; the level offixed rate investments and loans receivable that will not reprice to higher rates; the variable rate Federal Home Loan Bank advances;the variable rate subordinated debentures, and the non-term deposits that are assumed not to migrate to term deposits that are variablerate and will reprice to the higher rates; and a portion of our portfolio of variable rate loans contain restrictions on the amount ofrepricing and frequency of repricing that limit the amount of repricing to the current higher rates. These factors result in the negativeimpacts to net interest income in the up-interest rate shock scenarios that are detailed in the table below. In the down interest rateshock scenario the main drivers of the negative impact on net interest income are the decrease in investment income due to thenegative convexity features of the fixed rate mortgage backed securities; assumed prepayment of existing fixed rate loans receivable;the downward pricing of variable rate loans receivable; the constraint of the shock on non-term deposits; and the level of term depositrepricing. Our mortgage back security portfolio is comprised of fixed rate investments and as rates decrease the level of prepaymentswill increase and cause the current higher rate investments to prepay and the assumed reinvestment will be at lower interestrates. Similar to our mortgage backed securities, the model assumes that our fixed rate loans receivable will prepay at a faster rate andreinvestment will occur at lower rates. The level of downward shock on the non-term deposits is constrained to limit the downwardshock to a non-zero rate which results in a minimal reduction in the average rate paid. Term deposits repricing will only decrease theaverage cost paid by a minimal amount due to the assumed repricing occurring at maturity. These factors result in the negative impactto net interest income in the down interest rate shock scenario.
The change in the economic value of equity from the base case for December 31, 2020 and 2019 is due to us being in a liabilitysensitive position and the level of convexity in our pre-payable assets. Generally, with a liability sensitive position, as interest ratesincrease the value of your assets decrease faster than the value of liabilities and as interest rates decrease the value of your assetsincrease at a faster rate than liabilities. However, due to the level of convexity in our fixed rate pre-payable assets we do notexperience a similar change in the value of assets in a down interest rate shock scenario. In addition, the mix of interest-bearingdeposit and non-interest-bearing deposits impact the level of deposit decay and the resulting benefit of discounting from the non-interest-bearing deposits. At December 31, 2020, non-interest-bearing deposits were approximately $791.6 million, or 64.5%, higherthan that deposit type at December 31, 2019. Substantially all investments and approximately 56.0% of loans are pre-payable andfixed rate and as rates decrease the level of modeled prepayments increase. The prepaid principal is assumed to reprice at the assumedcurrent rates, resulting in a smaller positive impact to the economic value of equity.
The following table summarizes the simulated immediate change in net interest income for twelve months as of the datesindicated.
Market Risk
Impact on Net Interest IncomeDecember 31,
Change in prevailing interest rates 2020 2019+300 basis points (1.2)% (12.3)%+200 basis points 0.4% (7.6)%+100 basis points 1.0% (3.5)%0 basis points — —-100 basis points (2.3)% 1.9%
Impact on Economic Value of EquityDecember 31,
Change in prevailing interest rates 2020 2019+300 basis points 12.8% (7.6)%+200 basis points 14.4% (3.0)%+100 basis points 9.2% (0.6)%0 basis points — —-100 basis points (21.2)% (4.4)%

89
Item 8: Financial Statements and Supplementary Data
Our financial statements and accompanying notes, including the Report of Independent Registered Public Accounting Firm, areset forth beginning on page F-1 of this Annual Report on Form 10-K.
Audited Financial Statements
Description Page Number
Report of Independent Registered Public Accounting Firm ................................................................................................... F-1
Consolidated Balance Sheets as of December 31, 2020 and 2019.......................................................................................... F-4
Consolidated Statements of Income for the Years Ended December 31, 2020, 2019 and 2018............................................. F-5
Consolidated Statements of Comprehensive Income for the Years Ended December 31, 2020, 2019 and 2018................... F-6
Consolidated Statements of Stockholders’ Equity for the Years Ended December 31, 2020, 2019 and 2018....................... F-7
Consolidated Statements of Cash Flows for the Years Ended December 31, 2020, 2019 and 2018 ...................................... F-8
Notes to Consolidated Financial Statements ........................................................................................................................... F-10
The following tables present supplementary quarterly financial information (unaudited) for the years ended December 31, 2020and 2019. This information should be read in conjunction with the historical consolidated financial statements of the Company and thenotes thereto appearing elsewhere in this Annual Report on Form 10-K.
20204th Quarter 3rd Quarter 2nd Quarter 1st Quarter
(Dollars in thousands, except per share data)Total interest and dividend income $ 39,989 $ 37,082 $ 37,933 $ 40,557Total interest expense 4,430 4,975 5,042 8,462Net interest income 35,559 32,107 32,891 32,095Provision for loan loss 1,000 815 12,500 9,940Net interest income after provision for loan loss 34,559 31,292 20,391 22,155Total non-interest income 8,500 6,485 5,732 5,306Total non-interest expense(1) 28,460 130,835 23,937 25,758Provision (benefit) for income taxes 2,111 (2,653) 497 445Net income (loss) and net income (loss)allocable to common stockholders $ 12,488 $ (90,405) $ 1,689 $ 1,258
Basic earnings (loss) per share $ 0.85 $ (6.01) $ 0.11 $ 0.08Diluted earnings (loss) per share $ 0.84 $ (6.01) $ 0.11 $ 0.08
20194th Quarter 3rd Quarter 2nd Quarter 1st Quarter
(Dollars in thousands, except per share data)Total interest and dividend income $ 42,984 $ 44,549 $ 44,764 $ 43,202Total interest expense 10,579 13,023 13,476 12,563Net interest income 32,405 31,526 31,288 30,639Provision for loan loss 1,055 679 974 15,646Net interest income after provision for loan loss 31,350 30,847 30,314 14,993Total non-interest income 6,641 6,572 6,451 5,324Total non-interest expense 24,846 24,223 25,023 25,543Provision (benefit) for income taxes 3,131 2,790 2,510 (1,153)Net income (loss) and net income (loss)allocable to common stockholders $ 10,014 $ 10,406 $ 9,232 $ (4,073)
Basic earnings (loss) per share $ 0.65 $ 0.67 $ 0.59 $ (0.26)Diluted earnings (loss) per share $ 0.64 $ 0.66 $ 0.58 $ (0.26)
(1) For additional information see “Item 7: Management’s Discussion and Analysis of Financial Condition and Results of Operations”.

90
Item 9: Changes in and Disagreements with Accountants on Accounting and Financial Disclosures
None
Item 9A: Controls and Procedures
Disclosure Controls and Procedures
As of the end of the period covered by this report, management of the Company, under the supervision and with theparticipation of the Chief Executive Officer and Chief Financial Officer, carried out an evaluation of the effectiveness of the designand operation of the Company’s disclosure controls and procedures (as defined under Rules 13a-15(e) and 15d-15(e) of the ExchangeAct). Based upon, and as of the date of that evaluation, the Chief Executive Officer and Chief Financial Officer concluded that theCompany’s disclosure controls and procedures were effective, in ensuring the information relating to the Company (and itsconsolidated subsidiaries) required to be disclosed by the Company in the reports it files or submits under the Exchange Act wasrecorded, processed, summarized and reported in a timely manner.
Changes in Internal Control Over Financial Reporting
There has been no change in our internal control over financial reporting (as such term is defined in Rules 13a-15(f) and 15d-15(f) under the Exchange Act) during the last fiscal quarter of the fiscal year for which this Annual Report on Form 10-K is filed thathas materially affected, or is reasonably likely to materially affect, our internal control over financial reporting.
Report on Management�s Assessment of Internal Control Over Financial Reporting
Management of the Company is responsible for establishing and maintaining adequate internal control over financial reporting(as defined under Rules 13a-15(f) and 15d-15(f) of the Exchange Act). The Company’s internal control system is a process designedto provide reasonable assurance regarding the reliability of financial reporting and the preparation of financial statements for externalpurposes in accordance GAAP. Because of its inherent limitations, internal control over financial reporting may not prevent or detectmisstatements. Also, projections of any evaluation of effectiveness to future periods are subject to the risk that controls may becomeinadequate because of changes in conditions or that the degree of compliance with the policies or procedures may deteriorate.
As of December 31, 2020, management assessed the effectiveness of the Company’s internal control over financial reportingbased on the criteria for effective internal control over financial reporting established in “Internal Control-Integrated Framework,”issued by the Committee of Sponsoring Organizations (“COSO”) of the Treadway Commission in 2013. As permitted, the Companyhas excluded the operations of Almena State Bank acquired at October 23, 2020, which is described in “NOTE 2 – BUSINESSCOMBINATIONS” in the Notes to Consolidated Financial Statements, from the scope of management’s report on internal controlover financial reporting. Based on the assessment, management determined that the Company maintained effective internal controlover financial reporting as of December 31, 2020.
The effectiveness of the Company’s internal control over financial reporting as of December 31, 2020, has been audited byCrowe LLP, the independent registered public accounting firm who also has audited the Company’s consolidated financial statementsincluded in this Annual Report on Form 10-K. Crowe LLP has issued a report on the Company’s internal control over financialreporting as of December 31, 2020, which is included in Item 8 of this Form 10-K and is incorporated into this item by reference.
Item 9B: Other Information
None

91
Part III
Item 10: Directors, Executive Officers and Corporate Governance
The information required by this item will be contained in our Proxy Statement for the 2021 Annual Meeting of Stockholders tobe held in April 2021, a copy of which will be filed not later than 120 days after the close of the fiscal year and is incorporated hereinby reference.
Our board of directors has adopted a Code of Business Conduct and Ethics that applies to all of our employees, officers anddirectors, including our Chief Executive Officer, Chief Financial Officer and other executive officers. The full text of our Code ofBusiness Conduct and Ethics is posted on the investor relations page of our website which is located athttp://investor.equitybank.com. We will post any amendments to our code of business conduct and ethics, or waivers of itsrequirements, on our website.
Item 11: Executive Compensation
The information required by this item will be contained in our Proxy Statement for the 2021 Annual Meeting of Stockholders tobe held in April 2021, a copy of which will be filed not later than 120 days after the close of the fiscal year and is incorporated hereinby reference.
Item 12: Security Ownership of Certain Beneficial Owners and Management and Related Stockholder Matters
The information required by this item will be contained in our Proxy Statement for the 2021 Annual Meeting of Stockholders tobe held in April 2021, a copy of which will be filed not later than 120 days after the close of the fiscal year and is incorporated hereinby reference.
Information relating to securities authorized for issuance under our equity compensation plans is included in Part II of thisAnnual Report on Form 10-K under “Item 5 – Market for Registrant’s Common Equity, Related Shareholder Matters and IssuerPurchases of Equity Securities.”
Item 13: Certain Relationships and Related Transactions, and Director Independence
The information required by this item will be contained in our Proxy Statement for the 2021 Annual Meeting of Stockholders tobe held in April 2021, a copy of which will be filed not later than 120 days after the close of the fiscal year and is incorporated hereinby reference.
Item 14: Principal Accounting Fees and Services
The information required by this item will be contained in our Proxy Statement for the 2021 Annual Meeting of Stockholders tobe held in April 2021, a copy of which will be filed not later than 120 days after the close of the fiscal year and is incorporated hereinby reference.

92
Part IV
Item 15: Exhibits, Financial Statement Schedules
a) The following documents are filed as part of this Annual Report on Form 10-K:
1. Financial Statements
The financial statements included as part of this Form 10-K are identified in the index to the Audited Financial Statementsappearing in Item 8 of this Form 10-K and which index is incorporated in this Item 15 by reference.
2. Financial Statement Schedules
All supplemental schedules are omitted as inapplicable or because the required information is included in theConsolidated Financial Statements or notes thereto.
3. Exhibits
The information required by this Item 15(a)(3) is set forth in the Exhibit Index immediately following. The exhibits listedherein will be furnished upon written request to Equity Bancshares, Inc., 7701 East Kellogg Drive, Suite 300, Wichita,Kansas 67207, Attention: Investor Relations, and payment of a reasonable fee that will be limited to our reasonableexpense in furnishing such exhibits.
b) Exhibits
The exhibits listed below are incorporated by reference or attached hereto.
ExhibitNo. Description
3.1 Second Amended and Restated Articles of Incorporation of Equity Bancshares, Inc. (incorporatedby reference to Exhibit 3.1 to Equity Bancshares, Inc.’s Current Report on Form 8-K, filed with theSEC on May 3, 2016).
3.2 Amended and Restated Bylaws of Equity Bancshares, Inc. (incorporated by reference to Exhibit 3.2to Equity Bancshares, Inc.’s Registration Statement on Form S-1, filed with the SEC on October 9,2015, File No. 333-207351).
4.1 Specimen Class A Common Stock Certificate (incorporated by reference to Exhibit 4.1 to EquityBancshares, Inc.’s Amendment No. 1 to Registration Statement on Form S-1, filed with the SEC onOctober 27, 2015, File No. 333-207351).
4.2* Description of Registrant’s Securities
4.3 Indenture, dated as of June 29, 2020, by and between Equity Bancshares, Inc. and UMB Bank, N.A.,as trustee (incorporated by reference to Exhibit 4.1 to Equity Bancshares, Inc.’s Current Report onForm 8-K, filed with the SEC on July 2, 2020).
4.4 Form of 7.00% Fixed-to-Floating Rate Subordinated Note due 2030 (incorporated by reference toExhibit 4.2 to Equity Bancshares, Inc.’s Current Report on Form 8-K, filed with the SEC on July 2,2020).
10.1† Form of Indemnification Agreement (incorporated by reference to Exhibit 10.3 to EquityBancshares, Inc.’s Registration Statement on Form S-1, filed with the SEC on October 9, 2015, FileNo. 333-207351).
10.2† Equity Bancshares, Inc. 2006 Non-Qualified Stock Option Plan, as amended (incorporated byreference to Exhibit 10.1 to Equity Bancshares, Inc.’s Amendment No. 1 to Registration Statementon Form S-1, filed with the SEC on October 27, 2015, File No. 333-207351).
10.3† Equity Bancshares, Inc. Amended and Restated 2013 Stock Incentive Plan (incorporated byreference to Appendix A to Equity Bancshares, Inc.’s Definitive Proxy Statement on Schedule 14A,filed with the SEC on March 28, 2016).
10.4† Amended and Restated Employment Agreement, dated November 14, 2016, between Equity Bank,Equity Bancshares, Inc. and Brad S. Elliott (incorporated by reference to Exhibit 10.1 to EquityBancshares, Inc.’s Current Report on Form 8-K, filed with the SEC on November 15, 2016).
10.5† Amended and Restated Employment Agreement, dated November 14, 2016, among Equity Bank,Equity Bancshares, Inc. and Gregory H. Kossover (incorporated by reference to Exhibit 10.2 to
93
ExhibitNo. Description
Equity Bancshares, Inc.’s Current Report on Form 8-K, filed with the SEC on November 15, 2016).
10.6 Loan and Security Agreement, dated January 28, 2016, by and between Equity Bancshares, Inc. andServisFirst Bank (incorporated by reference to Exhibit 10.1 to Equity Bancshares, Inc.’s CurrentReport on Form 8-K, filed with the SEC on February 3, 2016).
10.7 Amended Loan and Security Agreement, dated March 13, 2017, between Equity Bancshares, Inc.and ServisFirst Bank (incorporated by reference to Exhibit 10.1 to Equity Bancshares, Inc.’s CurrentReport on Form 8-K, filed with the SEC on March 16, 2017).
10.8† Equity Bancshares, Inc. Annual Executive Incentive Plan (incorporated by reference to Appendix Ato Equity Bancshares, Inc.’s Definitive Proxy Statement on Schedule 14A, filed with the SEC onMarch 22, 2017).
10.9† Amended and Restated Employment Agreement, dated December 15, 2014, between Equity Bank,Equity Bancshares, Inc. and Julie Huber (incorporated by reference to Exhibit 10.1 to EquityBancshares, Inc.’s Quarterly Report on Form 10-Q, filed with the SEC on May 10, 2017).
10.10† Form of Performance-vested Restricted Stock Units Award Agreement (incorporated by reference toExhibit 10.1 to Equity Bancshares, Inc.’s Current Report on Form 8-K, filed with the SEC on March5, 2018).
10.11† Form of Time-vested Restricted Stock Units Award Agreement (incorporated by reference toExhibit 10.2 to Equity Bancshares, Inc.’s Current Report on Form 8-K, filed with the SEC on March5, 2018).
10.12† Employment Agreement, dated March 16, 2018, among Equity Bank and Craig L. Anderson,(incorporated by reference to Exhibit 10.1 to Equity Bancshares, Inc.’s Current Report on Form 8-K,filed with the SEC on March 22, 2018).
10.13 Second Amendment to Loan and Security Agreement, dated March 12, 2018. Between EquityBancshares, Inc. and ServisFirst Bank (incorporated by reference to Exhibit 10.1 to EquityBancshares, Inc.’s Quarterly Report on Form 10-Q, filed with the SEC on November 9, 2018).
10.14 Third Amendment to Loan and Security Agreement, dated March 11, 2019, Between EquityBancshares, Inc. and ServisFirst Bank (incorporated by reference to Exhibit 10.1 to EquityBancshares, Inc.’s Current Report on Form 8-K, filed with the SEC on March 14, 2019).
10.15† Equity Bancshares, Inc. 2019 Employee Stock Purchase Plan (incorporated by reference toAppendix A to Equity Bancshares, Inc.’s Definitive Proxy Statement on Schedule 14A, filed withthe SEC on March 22, 2019).
10.16† Employment Agreement, dated April 30, 2020, by and between Equity Bank and Eric Newell,(incorporated by reference to Exhibit 10.1 to Equity Bancshares, Inc.’s Current Report on Form 8-K,filed with the SEC on May 1, 2020).
10.17 Form of Subordinated Note Purchase Agreement, dated as of June 29, 2020, by and among EquityBancshares, Inc. and the several purchasers thereto (incorporated by reference to Exhibit 10.1 toEquity Bancshares, Inc.’s Current Report on Form 8-K, filed with the SEC on July 2, 2020).
10.18 Form of Registration Rights Agreement, dated as of June 29, 2020, by and among EquityBancshares, Inc. and the several purchasers thereto (incorporated by reference to Exhibit 10.2 toEquity Bancshares, Inc.’s Current Report on Form 8-K, filed with the SEC on July 2, 2020).
10.19 The Fourth Amendment to Loan and Security Agreement and Promissory Notes ModificationAgreement, dated June 29, 2020, by and among Equity Bancshares, Inc., as Borrower, andServisFirst Bank, as Lender (incorporated by reference to Exhibit 10.3 to Equity Bancshares, Inc.’sCurrent Report on Form 8-K, filed with the SEC on July 2, 2020).
10.20†* Employment Agreement, dated October 1, 2018, between Equity Bank, Equity Bancshares, Inc. andBrett A. Reber.
21.1* List of Subsidiaries of Equity Bancshares, Inc.
23.1* Consent of Crowe LLP

94
ExhibitNo. Description
24.1 Powers of Attorney (included on signature page).
31.1* Certification of Chief Executive Officer pursuant to Rule 13a-14(a) of the Exchange Act, as adoptedpursuant to Section 302 of the Sarbanes-Oxley Act of 2002.
31.2* Certification of Chief Financial Officer pursuant to Rule 13a-14(a) of the Exchange Act as adoptedpursuant to Section 302 of the Sarbanes-Oxley Act of 2002.
32.1** Certification of Chief Executive Officer pursuant to 18 U.S.C. Section 1350, as adopted pursuant toSection 906 of the Sarbanes-Oxley Act of 2002.
32.2** Certification of Chief Financial Officer pursuant to 18 U.S.C. Section 1350, as adopted pursuant toSection 906 of the Sarbanes-Oxley Act of 2002.
101.INS* Inline XBRL Instance Document (the instance document does not appear in the Interactive Data Filebecause its XBRL tags are embedded within the Inline XBRL document).
101.SCH* Inline XBRL Taxonomy Extension Schema Document.
101.CAL* Inline XBRL Taxonomy Extension Calculation Linkbase Document.
101.DEF* Inline XBRL Taxonomy Extension Definition Linkbase Document.
101.LAB* Inline XBRL Taxonomy Extension Label Linkbase Document.
101.PRE* Inline XBRL Taxonomy Extension Presentation Linkbase Document.
104* Cover Page Interactive Data File (formatted as inline XBRL and contained in Exhibit 101).
* Filed herewith.** These exhibits are furnished herewith and shall not be deemed “filed” for purposes of Section 18 of the Exchange
Act, or otherwise subject to the liability of that section, and shall not be deemed to be incorporated by reference intoany filing under the Securities Act or the Exchange Act.
† Represents a management contract or a compensatory plan or arrangement.
c) Excluded Financial Statements
Not Applicable

95
SIGNATURES
Pursuant to the requirements of Section 13 or 15(d) of the Securities Exchange Act of 1934, the registrant has duly caused thisreport to be signed on its behalf by the undersigned, thereunto duly authorized.
EQUITY BANCSHARES, INC.
By: /s/ Brad S. ElliottName: Brad S. ElliottTitle: Chairman and Chief Executive OfficerDate: March 9, 2021

96
POWER OF ATTORNEY
Each person whose signature appears below appoints Brad S. Elliott, Eric R. Newell and Gregory H. Kossover, and each ofthem, any of whom may act without the joinder of the other, as his true and lawful attorneys-in-fact and agents, with full power ofsubstitution and resubstitution, for him and in his name, place and stead, in any and all capacities, to sign any and all amendments tothis Annual Report on Form 10-K, and to file the same, with all exhibits thereto, and all other documents in connection therewith, withthe Securities and Exchange Commission, granting unto said attorneys-in-fact and agents full power and authority to do and performeach and every act and thing requisite and necessary to be done, as fully to all intents and purposes as he might or would do in person,hereby ratifying and confirming all that said attorneys-in-fact and agents or any of them or their or his substitute or substitutes, maylawfully do or cause to be done by virtue hereof.
Pursuant to the requirements of the Securities Exchange Act of 1934, this report has been signed below by the following personson behalf of the registrant and in the capacities and on the dates indicated.
Signature Title Date
/s/ Brad S. Elliott Chairman and March 9, 2021Brad S. Elliott Chief Executive Officer (Principal Executive
Officer)
/s/ Eric R. Newell Executive Vice President and Chief Financial March 9, 2021Eric R. Newell Officer (Principal Financial Officer and Principal
Accounting Officer)
/s/ Gregory H. Kossover Director, Executive Vice President and Chief March 9, 2021Gregory H. Kossover Operating Officer
/s/ Gary C. Allerheiligen Director March 9, 2021Gary C. Allerheiligen
/s/ James L. Berglund Director March 9, 2021James L. Berglund
/s/ Junetta M. Everett Director March 9, 2021Junetta M. Everett
/s/ Gregory L. Gaeddert Director March 9, 2021Gregory L. Gaeddert
/s/ Benjamen M. Hutton Director March 9, 2021Benjamen M. Hutton
/s/ R. Renee Koger Director March 9, 2021R. Renee Koger
/s/ Jerry P. Maland Director March 9, 2021Jerry P. Maland
/s/ Shawn D. Penner Director March 9, 2021Shawn D. Penner
/s/ Harvey R. Sorensen Director March 9, 2021Harvey R. Sorensen

F-1
Crowe LLPIndependent Member Crowe Global
REPORT OF INDEPENDENT REGISTERED PUBLIC ACCOUNTING FIRM
Stockholders and the Board of Directors of Equity Bancshares, Inc.Wichita, Kansas
Opinions on the Financial Statements and Internal Control over Financial Reporting
We have audited the accompanying consolidated balance sheets of Equity Bancshares, Inc. (the "Company") as ofDecember 31, 2020 and 2019, the related consolidated statements of income, comprehensive income, stockholders’equity, and cash flows for each of the years in the three-year period ended December 31, 2020, and the related notes(collectively referred to as the "financial statements"). We also have audited the Company’s internal control overfinancial reporting as of December 31, 2020, based on criteria established in Internal Control – IntegratedFramework: (2013) issued by the Committee of Sponsoring Organizations of the Treadway Commission (COSO).
In our opinion, the financial statements referred to above present fairly, in all material respects, the financial positionof the Company as of December 31, 2020 and 2019, and the results of its operations and its cash flows for each ofthe years in the three-year period ended December 31, 2020 in conformity with accounting principles generallyaccepted in the United States of America. Also in our opinion, the Company maintained, in all material respects,effective internal control over financial reporting as of December 31, 2020, based on criteria established in InternalControl – Integrated Framework: (2013) issued by COSO.
Basis for Opinions
The Company’s management is responsible for these financial statements, for maintaining effective internal controlover financial reporting, and for its assessment of the effectiveness of internal control over financial reporting,included in the accompanying Report on Management’s Assessment of Internal Control Over Financial Reporting.Our responsibility is to express an opinion on the Company’s financial statements and an opinion on the Company’sinternal control over financial reporting based on our audits. We are a public accounting firm registered with thePublic Company Accounting Oversight Board (United States) ("PCAOB") and are required to be independent withrespect to the Company in accordance with the U.S. federal securities laws and the applicable rules and regulationsof the Securities and Exchange Commission and the PCAOB.
We conducted our audits in accordance with the standards of the PCAOB. Those standards require that we plan andperform the audits to obtain reasonable assurance about whether the financial statements are free of materialmisstatement, whether due to error or fraud, and whether effective internal control over financial reporting wasmaintained in all material respects.
Our audits of the financial statements included performing procedures to assess the risks of material misstatement ofthe financial statements, whether due to error or fraud, and performing procedures that respond to those risks. Suchprocedures included examining, on a test basis, evidence regarding the amounts and disclosures in the financialstatements. Our audits also included evaluating the accounting principles used and significant estimates made bymanagement, as well as evaluating the overall presentation of the financial statements. Our audit of internal controlover financial reporting included obtaining an understanding of internal control over financial reporting, assessingthe risk that a material weakness exists, and testing and evaluating the design and operating effectiveness of internalcontrol based on the assessed risk.
F-2
As permitted, the Company has excluded the operations of Almena State Bank acquired during 2020, which is described in Note 2 ofthe financial statements, from the scope of the Report on Management’s Assessment of Internal Control over Financial Reporting. Assuch, it has also been excluded from the scope of our audit of internal control over financial reporting. Our audits also includedperforming such other procedures as we considered necessary in the circumstances. We believe that our audits provide a reasonablebasis for our opinions.
Definition and Limitations of Internal Control Over Financial Reporting
A company’s internal control over financial reporting is a process designed to provide reasonable assurance regarding the reliability offinancial reporting and the preparation of financial statements for external purposes in accordance with generally accepted accountingprinciples. A company’s internal control over financial reporting includes those policies and procedures that (1) pertain to themaintenance of records that, in reasonable detail, accurately and fairly reflect the transactions and dispositions of the assets of thecompany; (2) provide reasonable assurance that transactions are recorded as necessary to permit preparation of financial statements inaccordance with generally accepted accounting principles, and that receipts and expenditures of the company are being made only inaccordance with authorizations of management and directors of the company; and (3) provide reasonable assurance regardingprevention or timely detection of unauthorized acquisition, use, or disposition of the company’s assets that could have a material effecton the financial statements.
Because of its inherent limitations, internal control over financial reporting may not prevent or detect misstatements. Also, projectionsof any evaluation of effectiveness to future periods are subject to the risk that controls may become inadequate because of changes inconditions, or that the degree of compliance with the policies or procedures may deteriorate.
Critical Audit Matters
The critical audit matters communicated below are matters arising from the current period audit of the financial statements that werecommunicated or required to be communicated to the audit committee and that: (i) relate to accounts or disclosures that are material tothe financial statements and (ii) involved our especially challenging, subjective, or complex judgments. The communication of criticalaudit matters do not alter in any way our opinion on the financial statements, taken as a whole, and we are not, by communicating thecritical audit matters below, providing separate opinions on the critical audit matters or on the accounts or disclosures to which theyrelate.
Allowance for Loan Losses � Qualitative Loss Factors
As described in Notes 1 and 4 to the financial statements, the Company’s allowance for loan losses (“ALL”) is a valuation allowancefor probable incurred loan losses in the loan portfolio at each balance sheet date. The ALL was approximately $33.7 million atDecember 31, 2020 and consisted primarily of 1) a specific component of approximately $10.5 million of loss allocations on loansindividually evaluated for impairment and 2) a general component of approximately $23.2 million of loss allocations on loanscollectively evaluated for impairment.
Loss allocations within the general component are based on both historical loss ratios and qualitative loss factors, applied to each loanportfolio. The qualitative loss factors are used to adjust current conditions to the conditions that existed during the Company’s losshistory. The matters considered by the Company in determining these factors are disclosed in Note 1.
The determination of these qualitative loss factors for each loan portfolio can have a significant impact on the estimate of incurredlosses recorded within the general component of the ALL. The determination of these qualitative loss factors is an inherentlysubjective process as it requires a high degree of judgment by management to make assumptions regarding how credit quality factors,adjusted for external economic factors and other pertinent economic data, could impact the level of estimated incurred losses withinthe Company’s loan portfolios.
F-3
Given the significance of qualitative loss factors to the overall ALL, as well as the level of judgment and subjectivity involved inmanagement’s determination of the qualitative loss factors, we have identified auditing the qualitative loss factors used to establish thegeneral component of the ALL to be a critical audit matter because it required especially subjective auditor judgment.
The primary procedures to address this critical audit matter included:
• Tested management’s review controls over the determination of qualitative loss factor adjustments.• Tested internal controls over the completeness and accuracy of the data used in qualitative loss factor adjustments, as well as
internal controls over the mathematical accuracy of management’s ALL calculation.• Performed substantive testing procedures over management’s analysis supporting their determination of qualitative loss
factor adjustments.• Performed substantive procedures over the completeness and accuracy of the data used in qualitative loss factor adjustments
and verified the mathematical accuracy of management’s ALL calculation.• Evaluated the period-to-period consistency with which qualitative loss factors are determined and applied.• Evaluated the reasonableness of qualitative loss factors used based on our understanding of trends within the Company’s loan
portfolios as well as changes in observable and economic indicators.
Goodwill Impairment Assessment
As described in Note 7 to the financial statements, during the year ended December 31, 2020, the Company recorded a goodwillimpairment of approximately $104.8 million and retained a goodwill balance of approximately $31.6 million at December 31, 2020,which is allocated to the Company’s single reporting unit. Goodwill is tested for impairment at least annually at the reporting unitlevel or more frequently whenever events or circumstances occur that indicate it is more likely than not that fair value of the reportingunit is less than its carrying value. Due to the uncertain economic environment and sustained decline in the Company’s stock price,management performed a quantitative assessment of goodwill as of June 30, 2020 and September 30, 2020, concluding goodwill wasimpaired as of September 30, 2020.
The calculation of the reporting unit’s fair value in determining goodwill impairment involved significant estimates and subjectiveassumptions which required a high degree of management judgment. This judgment included, but was not limited to, the selection ofappropriate discount rates, the identification of relevant market comparables and the development of cash flow projections. Theselection and weighting of the various fair value techniques may have resulted in a higher or lower fair value. Judgment was applied indetermining the weightings that were most representative of fair value.
We identified the Company’s goodwill impairment assessment to be a critical audit matter. The principal considerations for thisdetermination was the degree of auditor judgment in performing procedures over the key assumptions, which include discounted cashflows, discount rate, prospective financial information, and weighting allocation to valuation methodologies.
The primary procedures performed to address this critical audit matter included:
• Tested the effectiveness of management’s review controls over the accuracy of data and appropriateness of estimates andassumptions used in the valuation.
• Evaluated valuation methods and weighting allocated to each method used to determine the fair value of the reporting unit.• Evaluated the reasonableness of the key assumptions including the discounted cash flows, discount rate, prospective financial
information and weighting allocation to each valuation methodology.
Utilization of auditor employed specialist to evaluate appropriateness of valuation methodologies, discount rate, control premium, andoverall reasonableness of the fair value.
• Substantively tested the mathematical accuracy of the fair value computation and evaluated the reasonableness of thefinancial projections.
/s/ Crowe LLP
We have served as the Company's auditor since 2007.
Dallas, TexasMarch 9, 2021
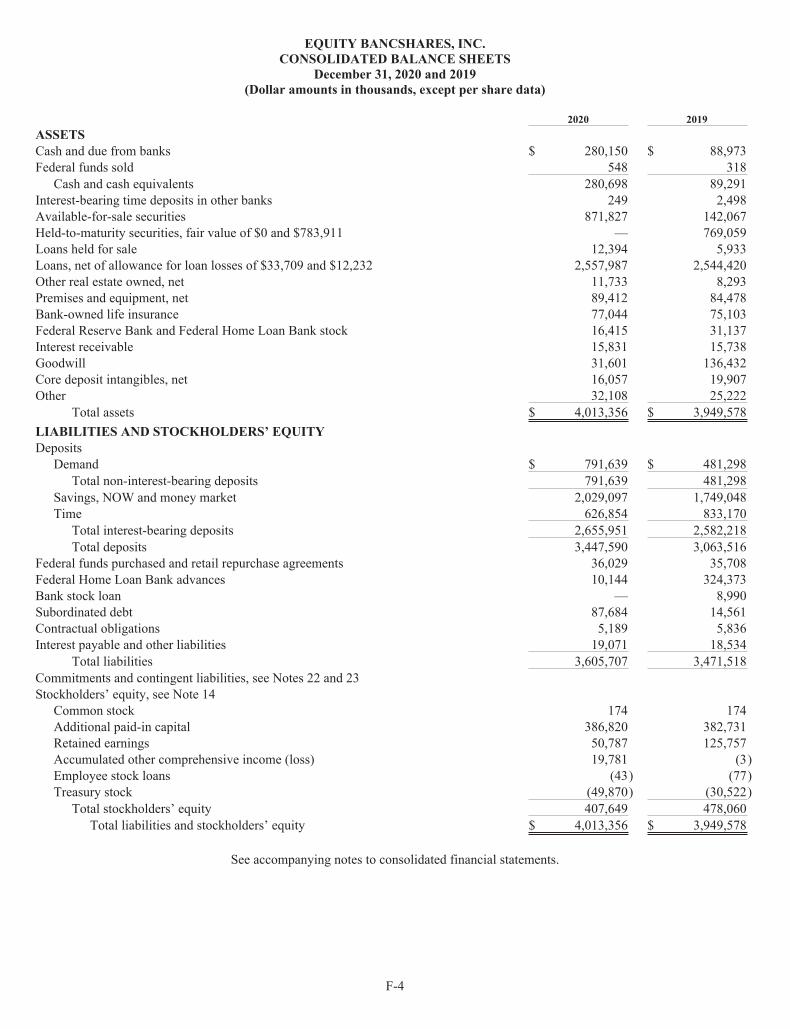
F-4
EQUITY BANCSHARES, INC.CONSOLIDATED BALANCE SHEETS
December 31, 2020 and 2019(Dollar amounts in thousands, except per share data)
2020 2019ASSETSCash and due from banks $ 280,150 $ 88,973Federal funds sold 548 318
Cash and cash equivalents 280,698 89,291Interest-bearing time deposits in other banks 249 2,498Available-for-sale securities 871,827 142,067Held-to-maturity securities, fair value of $0 and $783,911 — 769,059Loans held for sale 12,394 5,933Loans, net of allowance for loan losses of $33,709 and $12,232 2,557,987 2,544,420Other real estate owned, net 11,733 8,293Premises and equipment, net 89,412 84,478Bank-owned life insurance 77,044 75,103Federal Reserve Bank and Federal Home Loan Bank stock 16,415 31,137Interest receivable 15,831 15,738Goodwill 31,601 136,432Core deposit intangibles, net 16,057 19,907Other 32,108 25,222
Total assets $ 4,013,356 $ 3,949,578LIABILITIES AND STOCKHOLDERS’ EQUITYDeposits
Demand $ 791,639 $ 481,298Total non-interest-bearing deposits 791,639 481,298
Savings, NOW and money market 2,029,097 1,749,048Time 626,854 833,170
Total interest-bearing deposits 2,655,951 2,582,218Total deposits 3,447,590 3,063,516
Federal funds purchased and retail repurchase agreements 36,029 35,708Federal Home Loan Bank advances 10,144 324,373Bank stock loan — 8,990Subordinated debt 87,684 14,561Contractual obligations 5,189 5,836Interest payable and other liabilities 19,071 18,534
Total liabilities 3,605,707 3,471,518Commitments and contingent liabilities, see Notes 22 and 23Stockholders’ equity, see Note 14
Common stock 174 174Additional paid-in capital 386,820 382,731Retained earnings 50,787 125,757Accumulated other comprehensive income (loss) 19,781 (3)Employee stock loans (43) (77)Treasury stock (49,870) (30,522)
Total stockholders’ equity 407,649 478,060Total liabilities and stockholders’ equity $ 4,013,356 $ 3,949,578
See accompanying notes to consolidated financial statements.

F-5
EQUITY BANCSHARES, INC.CONSOLIDATED STATEMENTS OF INCOMEYears ended December 31, 2020, 2019 and 2018
(Dollar amounts in thousands, except per share data)2020 2019 2018
Interest and dividend incomeLoans, including fees $ 134,664 $ 149,298 $ 137,048Securities, taxable 15,521 19,339 17,943Securities, nontaxable 3,682 4,180 4,089Federal funds sold and other 1,694 2,682 2,476
Total interest and dividend income 155,561 175,499 161,556Interest expense
Deposits 16,582 40,914 25,687Federal funds purchased and retail repurchase agreements 105 155 114Federal Home Loan Bank advances 2,292 6,667 9,039Federal Reserve Bank discount window 6 — —Bank stock loan 415 654 731Subordinated debt 3,509 1,251 1,187
Total interest expense 22,909 49,641 36,758
Net interest income 132,652 125,858 124,798Provision for loan losses 24,255 18,354 3,961Net interest income after provision for loan losses 108,397 107,504 120,837Non-interest income
Service charges and fees 6,856 8,672 7,250Debit card income 9,136 8,230 6,178Mortgage banking 3,153 2,468 1,298Increase in value of bank-owned life insurance 1,941 1,998 2,199Net gain on acquisition 2,145 — —Net gain (loss) from securities transactions 11 14 (9)Other 2,781 3,606 2,809
Total non-interest income 26,023 24,988 19,725Non-interest expense
Salaries and employee benefits 54,129 52,122 48,018Net occupancy and equipment 8,784 8,674 8,126Data processing 10,991 10,124 8,094Professional fees 4,282 4,734 3,402Advertising and business development 2,498 3,075 3,002Telecommunications 1,873 2,079 1,775FDIC insurance 2,088 1,228 1,536Courier and postage 1,441 1,348 1,183Free nationwide ATM cost 1,609 1,680 1,355Amortization of core deposit intangibles 3,850 3,168 2,443Loan expense 789 875 1,005Other real estate owned 2,310 707 (71)Merger expenses 299 915 7,462Goodwill impairment 104,831 — —Other 9,216 8,906 7,057
Total non-interest expense 208,990 99,635 94,387Income (loss) before income tax (74,570) 32,857 46,175Provision for income taxes 400 7,278 10,350Net income (loss) and net income (loss) allocable to commonstockholders $ (74,970) $ 25,579 $ 35,825Basic earnings (loss) per share $ (4.97) $ 1.64 $ 2.33Diluted earnings (loss) per share $ (4.97) $ 1.61 $ 2.28
See accompanying notes to consolidated financial statements.
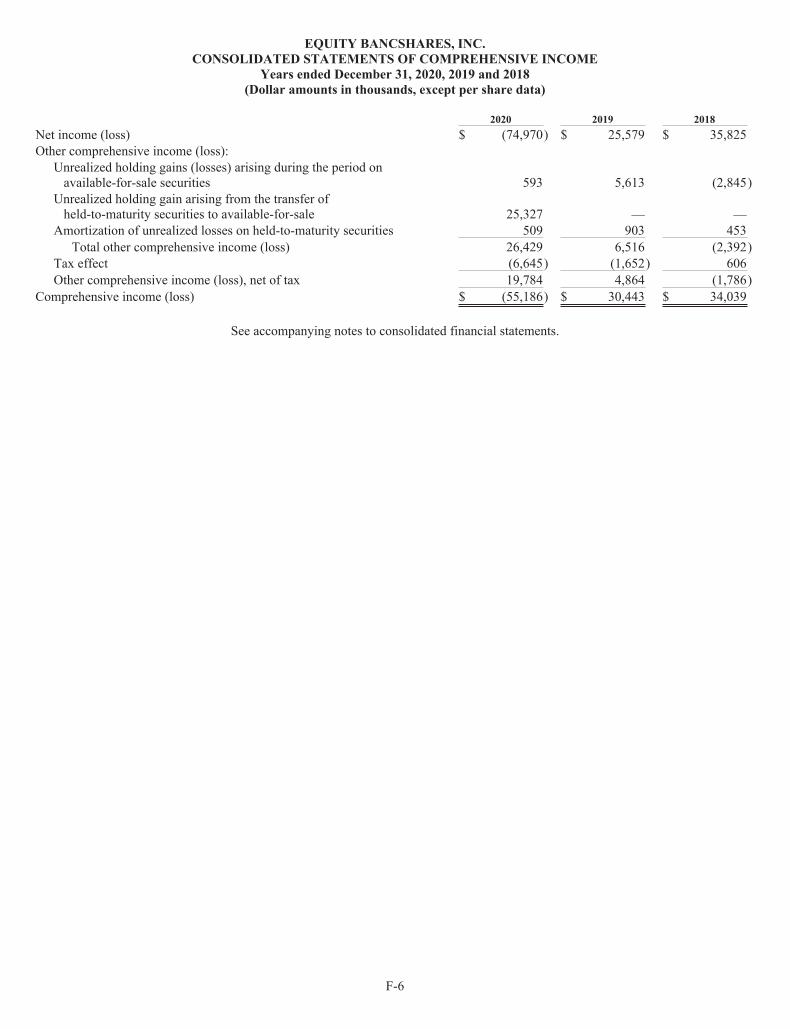
F-6
EQUITY BANCSHARES, INC.CONSOLIDATED STATEMENTS OF COMPREHENSIVE INCOME
Years ended December 31, 2020, 2019 and 2018(Dollar amounts in thousands, except per share data)
2020 2019 2018Net income (loss) $ (74,970) $ 25,579 $ 35,825Other comprehensive income (loss):
Unrealized holding gains (losses) arising during the period onavailable-for-sale securities 593 5,613 (2,845)
Unrealized holding gain arising from the transfer ofheld-to-maturity securities to available-for-sale 25,327 — —
Amortization of unrealized losses on held-to-maturity securities 509 903 453Total other comprehensive income (loss) 26,429 6,516 (2,392)
Tax effect (6,645) (1,652) 606Other comprehensive income (loss), net of tax 19,784 4,864 (1,786)
Comprehensive income (loss) $ (55,186) $ 30,443 $ 34,039
See accompanying notes to consolidated financial statements.

F-7
EQUITYBANCSH
ARES,INC.
CONSO
LIDATEDST
ATEMENTSOFST
OCKHOLDERS’EQUITY
YearsendedDecem
ber31,2020,2019
and2018
(Dollaram
ountsinthousands,exceptshareandpersharedata)
Com
mon
Stock
Accum
ulated
Shares
Outstanding
Amount
Additional
Paid-In
Capital
Retained
Earnings
Other
Com
prehensive
Income(loss)
Treasury
Stock
Employee
Stock
Loans
Total
Stockholders’
Equity
Balance
atDecem
ber31,2017
14,605,607
$161
$331,339
$65,512
$(3,092)
$(19,655)
$(121)
$374,144
Netincome
——
—35,825
——
—35,825
Othercomprehensive
income,netoftax
effects
——
——
(1,786)
——
(1,786)
Stock-basedcompensation,seeNote19
1,375
—2,509
——
——
2,509
Com
mon
stockissued
upon
exerciseofstockoptions
21,201
—133
——
——
133
AdoptionofASU
2016-01reclassifying
AFS
equitysecuritiesw
ithreadily
determined
fairvalue
——
—(11)
11—
——
Com
mon
stockissued
inconnection
with
theacquisition
ofKansasB
ank
Corporation,netofissuanceexpenses
of$207
820,849
831,888
——
——
31,896
Com
mon
stockissued
inconnection
with
theacquisition
ofAdamsD
airy
Bancshares,Inc.,netofissuance
expenses
of$236
344,063
413,216
——
——
13,220
Balance
atDecem
ber31,2018
15,793,095
$173
$379,085
$101,326
$(4,867)
$(19,655)
$(121)
$455,941
Netincome
——
—25,579
——
—25,579
Othercomprehensive
income,netof
taxeffects
——
——
4,864
——
4,864
Stock-basedcompensation,seeNote19
9,104
—2,870
——
——
2,870
Com
mon
stockissued
upon
exerciseofstockoptions
20,402
—371
——
——
371
Repaymentson
employee
stockloans
——
——
——
4444
Com
mon
stockissued
under
stock-basedincentiveplans
23,628
1—
——
——
1Com
mon
stockissued
under
employee
stockpurchaseplan
19,221
—405
——
——
405
Treasurystockpurchases
(421,016)
——
——
(10,867)
—(10,867)
Cum
mulativeeffectofchange
inaccountingprincipalfrom
implem
entationofASU
2017-08
——
—(1,148)
——
—(1,148)
Balance
atDecem
ber31,2019
15,444,434
$174
$382,731
$125,757
$(3)
$(30,522)
$(77)
$478,060
Netincome(loss)
——
—(74,970)
——
—(74,970)
Othercomprehensive
income,netoftax
effects
——
——
19,784
——
19,784
Stock-basedcompensation,seeNote19
17,703
—3,473
——
——
3,473
Com
mon
stockissued
upon
exerciseofstockoptions
1,150
—20
——
——
20Repaymentson
employee
stockloans
——
——
——
3434
Com
mon
stockissued
under
stock-basedincentiveplan
34,891
——
——
——
—Com
mon
stockissued
under
employee
stockpurchaseplan
34,593
—596
——
——
596
Treasurystockpurchases
(992,215)
——
——
(19,348)
—(19,348)
Balance
atDecem
ber31,2020
14,540,556
$174
$386,820
$50,787
$19,781
$(49,870)
$(43)
$407,649
Seeaccompanyingnotestoconsolidated
financialstatem
ents.
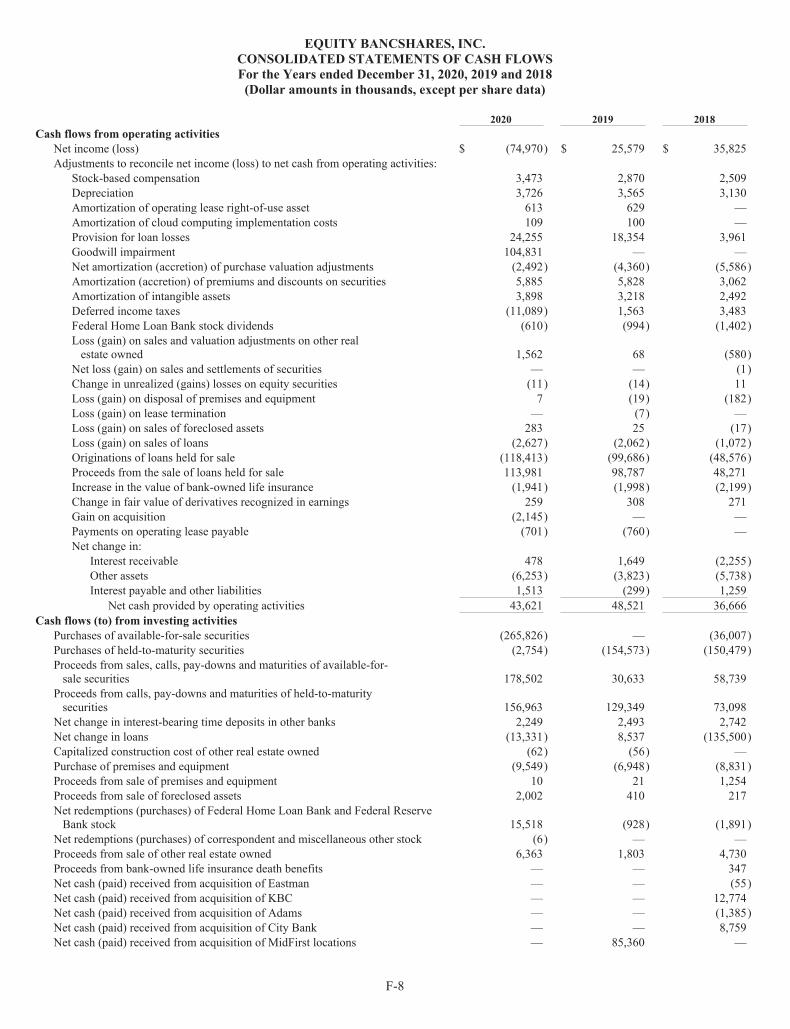
F-8
EQUITY BANCSHARES, INC.CONSOLIDATED STATEMENTS OF CASH FLOWSFor the Years ended December 31, 2020, 2019 and 2018(Dollar amounts in thousands, except per share data)
2020 2019 2018Cash flows from operating activities
Net income (loss) $ (74,970) $ 25,579 $ 35,825Adjustments to reconcile net income (loss) to net cash from operating activities:
Stock-based compensation 3,473 2,870 2,509Depreciation 3,726 3,565 3,130Amortization of operating lease right-of-use asset 613 629 —Amortization of cloud computing implementation costs 109 100 —Provision for loan losses 24,255 18,354 3,961Goodwill impairment 104,831 — —Net amortization (accretion) of purchase valuation adjustments (2,492) (4,360) (5,586)Amortization (accretion) of premiums and discounts on securities 5,885 5,828 3,062Amortization of intangible assets 3,898 3,218 2,492Deferred income taxes (11,089) 1,563 3,483Federal Home Loan Bank stock dividends (610) (994) (1,402)Loss (gain) on sales and valuation adjustments on other realestate owned 1,562 68 (580)
Net loss (gain) on sales and settlements of securities — — (1)Change in unrealized (gains) losses on equity securities (11) (14) 11Loss (gain) on disposal of premises and equipment 7 (19) (182)Loss (gain) on lease termination — (7) —Loss (gain) on sales of foreclosed assets 283 25 (17)Loss (gain) on sales of loans (2,627) (2,062) (1,072)Originations of loans held for sale (118,413) (99,686) (48,576)Proceeds from the sale of loans held for sale 113,981 98,787 48,271Increase in the value of bank-owned life insurance (1,941) (1,998) (2,199)Change in fair value of derivatives recognized in earnings 259 308 271Gain on acquisition (2,145) — —Payments on operating lease payable (701) (760) —Net change in:
Interest receivable 478 1,649 (2,255)Other assets (6,253) (3,823) (5,738)Interest payable and other liabilities 1,513 (299) 1,259
Net cash provided by operating activities 43,621 48,521 36,666Cash flows (to) from investing activities
Purchases of available-for-sale securities (265,826) — (36,007)Purchases of held-to-maturity securities (2,754) (154,573) (150,479)Proceeds from sales, calls, pay-downs and maturities of available-for-sale securities 178,502 30,633 58,739
Proceeds from calls, pay-downs and maturities of held-to-maturitysecurities 156,963 129,349 73,098
Net change in interest-bearing time deposits in other banks 2,249 2,493 2,742Net change in loans (13,331) 8,537 (135,500)Capitalized construction cost of other real estate owned (62) (56) —Purchase of premises and equipment (9,549) (6,948) (8,831)Proceeds from sale of premises and equipment 10 21 1,254Proceeds from sale of foreclosed assets 2,002 410 217Net redemptions (purchases) of Federal Home Loan Bank and Federal ReserveBank stock 15,518 (928) (1,891)
Net redemptions (purchases) of correspondent and miscellaneous other stock (6) — —Proceeds from sale of other real estate owned 6,363 1,803 4,730Proceeds from bank-owned life insurance death benefits — — 347Net cash (paid) received from acquisition of Eastman — — (55)Net cash (paid) received from acquisition of KBC — — 12,774Net cash (paid) received from acquisition of Adams — — (1,385)Net cash (paid) received from acquisition of City Bank — — 8,759Net cash (paid) received from acquisition of MidFirst locations — 85,360 —
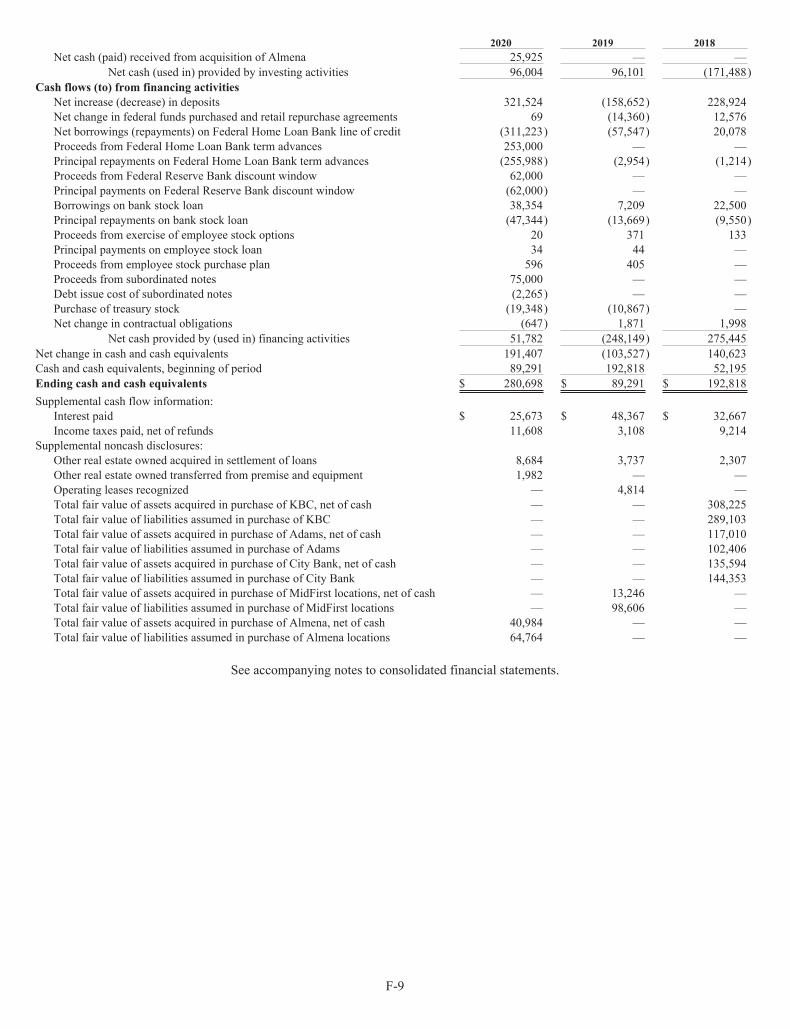
F-9
2020 2019 2018Net cash (paid) received from acquisition of Almena 25,925 — —
Net cash (used in) provided by investing activities 96,004 96,101 (171,488)Cash flows (to) from financing activities
Net increase (decrease) in deposits 321,524 (158,652) 228,924Net change in federal funds purchased and retail repurchase agreements 69 (14,360) 12,576Net borrowings (repayments) on Federal Home Loan Bank line of credit (311,223) (57,547) 20,078Proceeds from Federal Home Loan Bank term advances 253,000 — —Principal repayments on Federal Home Loan Bank term advances (255,988) (2,954) (1,214)Proceeds from Federal Reserve Bank discount window 62,000 — —Principal payments on Federal Reserve Bank discount window (62,000) — —Borrowings on bank stock loan 38,354 7,209 22,500Principal repayments on bank stock loan (47,344) (13,669) (9,550)Proceeds from exercise of employee stock options 20 371 133Principal payments on employee stock loan 34 44 —Proceeds from employee stock purchase plan 596 405 —Proceeds from subordinated notes 75,000 — —Debt issue cost of subordinated notes (2,265) — —Purchase of treasury stock (19,348) (10,867) —Net change in contractual obligations (647) 1,871 1,998
Net cash provided by (used in) financing activities 51,782 (248,149) 275,445Net change in cash and cash equivalents 191,407 (103,527) 140,623Cash and cash equivalents, beginning of period 89,291 192,818 52,195Ending cash and cash equivalents $ 280,698 $ 89,291 $ 192,818Supplemental cash flow information:
Interest paid $ 25,673 $ 48,367 $ 32,667Income taxes paid, net of refunds 11,608 3,108 9,214
Supplemental noncash disclosures:Other real estate owned acquired in settlement of loans 8,684 3,737 2,307Other real estate owned transferred from premise and equipment 1,982 — —Operating leases recognized — 4,814 —Total fair value of assets acquired in purchase of KBC, net of cash — — 308,225Total fair value of liabilities assumed in purchase of KBC — — 289,103Total fair value of assets acquired in purchase of Adams, net of cash — — 117,010Total fair value of liabilities assumed in purchase of Adams — — 102,406Total fair value of assets acquired in purchase of City Bank, net of cash — — 135,594Total fair value of liabilities assumed in purchase of City Bank — — 144,353Total fair value of assets acquired in purchase of MidFirst locations, net of cash — 13,246 —Total fair value of liabilities assumed in purchase of MidFirst locations — 98,606 —Total fair value of assets acquired in purchase of Almena, net of cash 40,984 — —Total fair value of liabilities assumed in purchase of Almena locations 64,764 — —
See accompanying notes to consolidated financial statements.

F-10
EQUITY BANCSHARES, INC.NOTES TO CONSOLIDATED FINANCIAL STATEMENTS
December 31, 2020, 2019 and 2018(Dollar amounts in thousands, except per share data)
NOTE 1 – NATURE OF OPERATIONS AND SUMMARY OF SIGNIFICANT ACCOUNTING POLICIES
Nature of Operations: Equity Bancshares, Inc. is a bank holding company, whose principal activity is the ownership andmanagement of its wholly-owned subsidiaries, Equity Bank (“Equity Bank”) and EBAC, LLC (“EBAC”). SA Holdings, Inc. is awholly-owned subsidiary of Equity Bank and was established for the purpose of holding and selling other real estate owned. Theseentities are collectively referred to as the “Company”. All significant intercompany accounts and transactions have been eliminated inconsolidation.
Equity Bank is a Kansas state-chartered bank and member of the Federal Reserve (state Fed member bank jointly supervised byboth the Federal Reserve Bank of Kansas City and the Office of the Kansas State Bank Commissioner).
The Company is primarily engaged in providing a full range of banking, mortgage banking and financial services to individualand corporate customers generally in Arkansas, Kansas, Missouri and Oklahoma. Equity Bank competes with a variety of otherfinancial institutions including large regional banks, community banks and thrifts as well as credit unions and other non-traditionallenders.
Use of Estimates: To prepare financial statements in conformity with U.S. generally accepted accounting principles,management makes estimates and assumptions based on available information. These estimates and assumptions affect the amountsreported in the financial statements and the disclosures provided and actual results could differ.
Risk and Uncertainties: The outbreak of COVID-19 has adversely impacted a broad range of industries in which theCompany’s customers operate and could impair their ability to fulfill their financial obligations to the Company. The World HealthOrganization has declared COVID-19 to be a global pandemic indicating that almost all public commerce and related businessactivities could be impacted, to varying degrees, with the goal of decreasing the rate of new infections. The spread of the outbreak hascaused significant disruptions in the U.S. economy and has disrupted banking and other financial activity in the areas in which theCompany operates. While there has been no material impact to the Company’s employees to date, COVID-19 could also potentiallycreate widespread business continuity issues for the Company. Congress, the President, and the Federal Reserve have taken severalactions designed to cushion the economic fallout from COVID-19.
The Company’s business is dependent upon the willingness and ability of its employees and customers to conduct banking andother financial transactions. If the global response to contain COVID-19 is unsuccessful, the Company could experience a materialadverse effect on its business, financial condition, results of operations and cash flows. It is not possible to know the full universe orextent of impact to the Company’s operations brought about from COVID-19 and resulting measures to curtail its spread.
Cash Equivalents: Cash and cash equivalents include cash, deposits with other financial institutions with original maturities lessthan 90 days and federal funds sold. Net cash flows are reported for customer loan and deposit transactions, interest-bearing depositsin other financial institutions, federal funds purchased, retail repurchase agreements, Federal Home Loan Bank advances andcontractual obligations.
Securities: Securities are classified as held-to-maturity when management has the positive intent and ability to hold them tomaturity. Securities are classified as available-for-sale when they might be sold before maturity. Held-to-maturity securities arecarried at amortized cost while available-for-sale securities are carried at fair value, with unrealized holding gains and losses reportedin other comprehensive income, net of tax.
Interest income includes amortization of purchase premium or discount. Premiums and discounts on mortgage-backed securitiesare amortized using the level-yield method over the estimated cash flows of the securities. This method requires retrospectiveadjustment of the effective yield each time a payment is received or changes occur in the estimated remaining cash flows, whichadjusts life-to-date amortization. Premiums and discounts on other investments are amortized using the level-yield method tocontractual maturity or first call date, if purchased at a premium.
Management evaluates securities for other-than-temporary impairment (“OTTI”) on at least a quarterly basis and morefrequently when economic or market conditions warrant such an evaluation. For securities in an unrealized loss position, managementconsiders the extent and duration of the unrealized loss and the financial condition and near-term prospects of the issuer. Managementalso assesses whether it intends to sell, or it is more likely than not that it will be required to sell, a security in an unrealized lossposition before recovery of its amortized cost basis. If either of the criteria regarding intent or requirement to sell is met, the entire

F-11
difference between amortized cost and fair value is recognized as impairment through earnings. For debt securities that do not meetthe aforementioned criteria, the amount of impairment is split into two components as follows: 1) OTTI related to credit loss, whichmust be recognized in the income statement and 2) OTTI related to other factors, which is recognized in other comprehensive income.The credit loss is defined as the difference between the present value of the cash flows expected to be collected and the amortized costbasis.
Equity investments with a readily determinable fair value are measured at fair value with changes in fair value recognized in netincome. The exit price concept is used when measuring the fair value of financial instruments for disclosure purposes.
Loans Held for Sale: Mortgage loans originated and intended for sale in the secondary market are carried at the lower ofaggregate cost or fair value. Net unrealized losses, if any, are recorded as a valuation allowance and charged to earnings. Mortgageloans held for sale are sold with servicing rights released. Gains or losses on loans held for sale are recognized upon completion of thesale and based on the difference between the net sales proceeds and the carrying value of the sold loan.
Loans: Loans that management has the intent and ability to hold for the foreseeable future or until maturity or payoff arereported at the principal balance outstanding, net of previous charge-offs and an allowance for loan losses, and for purchased loans,net of unamortized purchase premiums and discounts. Interest income is accrued on the unpaid principal balance.
Purchased Credit Impaired Loans. As a part of acquisitions, the Company acquired certain loans, for which there was, atacquisition, evidence of deterioration of credit quality since origination. These purchased credit impaired loans were recorded at theacquisition date fair value, such that there is no carryover of the seller’s allowance for loan losses. After acquisition, losses arerecognized by an increase in the allowance for loan losses. Such purchase credit impaired loans are accounted for individually. TheCompany estimates the amount and timing of expected cash flows for each loan, and the expected cash flows in excess of the amountpaid are recorded as interest income over the remaining life of the loan (accretable yield). During acquisitions, if the Companyexpects to liquidate the loan collateral in a relatively short period of time, the Company will assign no value to accretable yield as theimpact is immaterial. The excess of the loan’s contractual principal and interest over expected cash flows is not recorded (non-accretable difference). Over the life of the loan, expected cash flows continue to be estimated. If the present value of the expectedcash flows is less than the carrying amount, a loss is recorded. If the present value of the expected cash flows is greater than thecarrying amount, it is recognized as part of future interest income.
Nonaccrual Loans. Generally, loans are designated as nonaccrual when either principal or interest payments are 90 days ormore past due based on contractual terms unless the loan is well secured and in the process of collection. Consumer loans aretypically charged-off no later than 180 days past due. In all cases, loans are placed on nonaccrual or charged-off at an earlier date ifcollection of principal or interest is considered doubtful. When a loan is placed on nonaccrual status, unpaid interest credited toincome is reversed against income. Future interest income may be recorded on a cash basis after recovery of principal is reasonablyassured. Nonaccrual loans are returned to accrual status when all the principal and interest amounts contractually due are broughtcurrent and future payments are reasonably assured.
Impaired Loans. A loan is considered impaired when, based on current information and events, it is probable that the Companywill be unable to collect all contractual principal and interest due according to the terms of the loan agreement. Impaired loans aremeasured based on the present value of expected future cash flows discounted at the loan’s effective interest rate or on the value of theunderlying collateral if the loan is collateral dependent. The Company evaluates the collectability of both principal and interest whenassessing the need for a loss accrual.
Factors considered by management in determining impairment include payment status, collateral value and the probability ofcollecting scheduled principal and interest payments when due. Loans that experience insignificant payment delays and paymentshortfalls generally are not classified as impaired. Management determines the significance of payment delays and payment shortfallson a case-by-case basis, taking into consideration all of the circumstances surrounding the loan and the borrower, including the lengthof the delay, the reasons for the delay, the borrower’s prior payment record and the amount of the shortfall in relation to the principaland interest owed.
Troubled Debt Restructurings. In cases where a borrower experiences financial difficulties and the Company makes certainconcessionary modifications to contractual terms, the loan is classified as a troubled debt restructured loan and classified asimpaired. Generally, a nonaccrual loan that is a troubled debt restructuring remains on nonaccrual until such time that repayment ofthe remaining principal and interest is not in doubt and the borrower has a period of satisfactory repayment performance.
Allowance for Loan Losses: The allowance for loan losses is a valuation allowance for probable incurred credit losses. Loanlosses are charged against the allowance when management believes the collectability of a loan balance is unlikely. Subsequentrecoveries, if any, are credited to the allowance. Management estimates the allowance balance required using past loan lossexperience, the nature and volume of the portfolio, information about specific borrower situations and estimated collateral values,

F-12
economic conditions and other factors. A loan review process, independent of the loan approval process, is utilized by management toverify loans are being made and administered in accordance with Company policy, to review loan risk grades and potential losses, toverify that potential problem loans are receiving adequate and timely corrective measures to avoid or reduce losses and to assist in theverification of the adequacy of the loan loss reserve. Allocations of the allowance may be made for specific loans, but the entireallowance is available for any loan that, in management’s judgment, should be charged off.
The allowance consists of specific and general components. The specific component relates to loans that are individuallyclassified as impaired. If a loan is impaired, a portion of the allowance is allocated so that the loan is reported net at the present valueof estimated future cash flows using the loan’s existing rate or at the fair value of collateral if repayment is expected solely from thesale of the collateral. Troubled debt restructurings are separately identified for impairment disclosures and are measured at the presentvalue of estimated future cash flows using the loan’s effective rate at inception. If a troubled debt restructuring is considered to be acollateral dependent loan, the loan is reported, net, at the fair value of the collateral. For troubled debt restructurings that subsequentlydefault, the Company determines the amount of reserve in accordance with the accounting policy for the allowance for loan losses.
The general component of the allowance for loan losses covers non-impaired loans and is based on historical loss experienceadjusted for current factors. The historical loss experience is determined by portfolio and class and is based on the actual loss historyexperienced by the Company. This actual loss experience is then adjusted by comparing current conditions to the conditions thatexisted during the loss history. The Company considers the changes related to (i) lending policies, (ii) economic conditions, (iii)nature and volume of the loan portfolio and class, (iv) lending staff, (v) volume and severity of past due, non-accrual and risk gradedloans, (vi) loan review system, (vii) value of underlying collateral for collateral dependent loans, (viii) concentration levels and (ix)effects of other external factors.
The Company considers loan performance and collateral values in assessing risk for each class in the loan portfolio, as follows:
• Commercial and industrial loans are dependent on the strength of the industries of the related borrowers and the success oftheir businesses. Commercial and industrial loans are advanced for equipment purchases, to provide working capital ormeet other financing needs of the business. These loans may be secured by accounts receivable, inventory, equipment orother business assets. Financial information is obtained from the borrower to evaluate the debt service coverage andability to repay the loans.
• Commercial real estate loans are dependent on the industries tied to these loans, as well as the local commercial real estatemarket. The loans are secured by real estate and typically appraisals are obtained to support the loan amount. Generally,an evaluation of the project’s cash flows is performed to evaluate the borrower’s ability to repay the loan at the time oforigination and periodically updated during the life of the loan.
• Residential real estate loans are affected by the local residential real estate market, the local economy and movement ininterest rates. The Company evaluates the borrower’s repayment ability through a review of credit reports and debt toincome ratios. Generally, appraisals are obtained to support the loan amount.
• Agricultural real estate loans are real estate loans related to farmland and are affected by the value of farmland.Generally, the Company evaluates the borrower’s ability to repay based on cash flows from farming operations.
• Consumer loans are dependent on the local economy. Consumer loans are generally secured by consumer assets, but maybe unsecured. Typically, the Company evaluates the borrower’s repayment ability through a review of credit scores andan evaluation of debt to income ratios.
• Agricultural loans are primary operating lines subject to annual farming revenues, including productivity and yield of thefarm products and market pricing at the time of sale.
There have been no material changes to the Company’s accounting policies related to its allowance for loan loss methodologyduring 2020 and 2019. However, as COVID-19 impacted our lending operations, the company has been assessing economicconditions and increasing the allowance for loan losses through adjustments of qualitative adjustment factors as necessary.
Transfers of Financial Assets: Transfers of financial assets are accounted for as sales when control over the assets has beenrelinquished. Control over transferred assets is deemed to be surrendered when the assets have been isolated from the Company, thetransferee obtains the right (free of conditions that constrain it from taking advantage of that right) to pledge or exchange thetransferred assets and the Company does not maintain effective control over the transferred assets through an agreement to repurchasethem before their maturity.
Bank-Owned Life Insurance: The Company maintains insurance policies on certain key executives as well as policies fromacquired institutions. Bank-owned life insurance is recorded at the amount that can be realized under the insurance contract at thebalance sheet date, which is the cash surrender value adjusted for other charges or other amounts due that are probable at settlement.

F-13
In some cases, the Company has entered into agreements with the insured which would require it to make one-time payments to theinsured’s beneficiaries if certain conditions exist at the time of death.
Other Real Estate Owned: Assets acquired through or instead of loan foreclosure are initially recorded at fair value lessestimated cost to sell when acquired, thereby establishing a new cost basis. Generally, collateral properties are recorded as other realestate owned when the Company takes physical possession. Physical possession of residential real estate collateral occurs when legaltitle is obtained upon completion of foreclosure or when the borrower conveys all interest in the property to satisfy the loan throughcompletion of a deed in lieu of foreclosure or through a similar legal agreement. Other real estate owned properties are subsequentlyaccounted for at the lower of cost or fair value less estimated costs to sell. If fair value declines subsequent to foreclosure, a valuationallowance is recorded through expense. Operating costs after acquisition are expensed.
Premises and Equipment: Land is carried at cost. Premises and equipment are carried at cost less accumulateddepreciation. Depreciation is an estimate and is charged to expense using the straight-line method over the estimated useful lives ofthe respective assets. The useful lives of buildings and related components are estimated to be 39 years. The useful lives of furniture,fixtures and equipment are estimated to be 4 to 7 years. Leasehold improvements are capitalized and depreciated using the straight-line method over the terms of the respective leases or the estimated useful lives of the improvements, whichever is shorter. Propertyheld for sale is carried at the lower of cost or fair value.
Premises and equipment and other long-term assets are reviewed for impairment when events indicate their carrying amountmay not be recoverable from future undiscounted cash flows. If impaired, the assets are recorded at fair value.
Lease Obligation. The Company evaluates contracts that convey the right to control the use of identified property, plant orequipment for a period of time for consideration to determine if they are lease obligations. The Company evaluates each leasecomponent to determine if the lease qualifies as a financing lease or as an operating lease. Leases that meet any of the followingcriteria are considered financing leases: (1) the lease transfers ownership of the underlying asset by the end of the lease term; (2) thelease grants the Company an option to purchase the underlying asset that the Company is reasonably certain to exercise; (3) the leaseterm is the major part of the remaining economic life of the underlying asset; (4) the present value of the sum of the lease paymentsand any residual value guaranteed by the Company that is not already reflected in lease payments equals or exceeds substantially all ofthe fair value of the underlying asset; or (5) the underlying asset is of such a specialized nature that it is expected to have noalternative use to the lessor at the end of the lease term. If none of the financing lease criteria are met, the lease is considered anoperating lease.
The Company evaluates each lease to determine the lease term which will be used based on the type and use of the leasedequipment and future expected changes in operations. The resulting lease term will consist of the non-cancellable period for whichthe Company has the right to use the underlying asset plus (1) periods covered by an option to extend the lease if the Company isreasonably certain to exercise that option; (2) periods covered by an option to terminate the lease if the Company is reasonably certainnot to exercise that option; and (3) periods covered by an option to extend the lease in which exercise of the option is controlled by thelessor. The Company has certain leases that contain options to extend the lease and contain options for changes in lease paymentswhich are evaluated by the Company to determine the recorded values for right-of-use assets and lease liability.
Lease payments that are contractually known at lease inception are used by the Company for calculating the right-of-use assetand lease liability. Lease payments that vary because of facts or circumstances after the commencement date of the lease from otherthan passage of time are treated as variable lease payments and are recorded to lease expense in the period in which the obligation forthe payments are incurred by the Company. Variable lease payments are not part of the lease payments for determining the right-of-use asset or the lease liability at the lease commencement date.
The discount rate to initially determine the present value of the lease payments is based on the information available at the leasecommencement date and is either the rate implicit in the lease or the Company’s incremental borrowing rate. If the rate implicit in thelease is known or determinable, that rate shall be used. If that rate is not known, the Company’s incremental borrowing rate shall beused. At January 1, 2019, implementation of this accounting guidance, the Company’s incremental borrowing rate based on theremaining lease term was used to calculate the right-of-use assets and operating lease liabilities.
Operating lease right-of-use assets and lease obligations are accounted for subsequent to initial recording by amortizing theright-of-use asset over the lease term on a straight-line method while the lease obligation is increased by the accrual of interest anddecreased by subsequent lease payments. Operating lease right-of-use asset amortization and lease obligation interest are reported innon-interest expense in the Consolidated Statements of Income. Operating lease payments and variable lease payments are reflectedwithin cash flows from operating activities in the Consolidated Statement of Cash Flows.
Financing lease right-of-use assets and lease obligations are accounted for subsequent to initial recording by amortizing theright-of-use asset similar to owned assets over the lesser of the lease term or economic life of the asset if the lease transfers ownershipof the leased asset while the lease obligation is increased by the accrual of interest and decreased by subsequent lease payments.Financing lease right-of-use asset amortization is reported in non-interest expense, similar to other owned assets, and lease obligationinterest accruals are reported in interest expense in the Consolidated Statements of Income. Financing lease obligation principal
F-14
payments are reflected within cash flows from financing activities and interest payments and variable lease payments are reflectedwith the cash flows from operating activities in the Consolidated Statements of Cash Flows.
The Company evaluates lease modifications and will consider the modification a new contract if the modification grants thelessee an additional right of use not included in the original lease and the lease payments increase commensurate with the stand-aloneprice for the additional right-of-use asset. The Company will reallocate the remaining consideration in the contract and remeasure thelease liability using a discount rate for the lease determined at the effective date of the lease modification if the contract modificationdoes any of the following: (1) grants the Company an additional right of use that was not included in the original contract; (2) extendsor reduces the term of an existing lease; (3) fully or partially terminates an existing lease; or (4) changes the consideration in thecontract only. The Company will recognize the remeasurement of the lease liability for the modification as an adjustment of the right-of-use asset when the contract modification grants additional right-of-use-assets, extends or reduces the term of the lease or changesthe consideration of the lease contract. In the case of full or partial termination of the lease, the Company will decrease the carryingamount of the right-of-use-asset on a proportionate basis to the reduction in the lease liability with a gain or loss recognized for thedifference between the lease liability adjustment and right of use asset adjustment.
If the Company modifies an operating lease, where the Company is the lessor, and the modification is not accounted for as aseparate contract, the Company will account for the modification as if it were a termination of the existing lease and the creation of anew lease that commences on the effective date of the modification as follows:
• If the modified lease is classified as an operating lease, the Company will consider any prepaid or accrued lease rentalsrelating to the original lease as part of the lease payments for the modified lease.
• If the modified lease is classified as a direct financing lease or a sales-type lease, the Company will derecognize anydeferred rent liability or accrued rent asset and adjust the selling profit or loss.
If the Company modifies a direct financing lease, where the Company is the lessor, and the modification is not accounted for asa separate contract, the Company will account for the modified lease as follows:
• If the modified lease is classified as a direct financing lease, the Company will adjust the discount rate for the modifiedlease, so the initial net investment equals the carrying amount of the original lease at the modification effective date.
• If the modified lease is classified as a sales-type lease, the Company shall determine the selling profit/loss oncommencement date of the modified lease as the difference between the fair value of the underlying asset and netinvestment in the original lease prior to modification.
• If the modified lease is classified as an operating lease, the carrying amount of the underlying asset shall equal the netinvestment in the original lease immediately before the effective date of the modification.
If the Company modifies a sales-type lease, where the Company is the lessor, and the modification is not accounted for as aseparate contract, the Company will account for the modified lease as follows:
• If the modified lease is classified as a direct financing lease, the Company will adjust the discount rate for the modifiedlease, so the initial net investment of the modified lease equals the carrying amount of the original lease at themodification effective date.
• If the modified lease is classified as a direct financing lease, the Company will adjust the discount rate for the modifiedlease, so the initial net investment equals the carrying amount of the original lease at the modification effective date.
Federal Reserve Bank and Federal Home Loan Bank Stock: Federal Reserve Bank (“FRB”) and Federal Home Loan Bank(“FHLB”) stocks are required investments for institutions that are members of the FRB and FHLB systems. FRB and FHLB stocksare carried at cost, considered restricted securities and are periodically evaluated for impairment based on the ultimate recovery of parvalue. Both cash and stock dividends are reported as income.
Goodwill and Core Deposit Intangibles: Goodwill results from business acquisitions and represents the excess of the purchaseprice over the fair value of acquired tangible assets and liabilities and identifiable intangible assets. Core deposit intangibles areacquired customer relationships arising from whole bank and branch acquisitions. Core deposit intangibles are initially measured atfair value and then amortized over their estimated useful lives using an accelerated method. The useful lives of the core deposits areestimated to generally be between seven and ten years. Goodwill and core deposit intangibles are assessed at least annually forimpairment and any such impairment is recognized and expensed in the period identified. The Company has selected December 31 asthe date to perform its annual goodwill impairment test. Goodwill is the only intangible asset with an indefinite useful life.
Credit Related Financial Instruments: Credit related financial instruments include off-balance-sheet credit instruments, such ascommitments to make loans and commercial letters of credit, issued to meet customer financing needs. The face amount for theseitems represents the exposure to loss before considering customer collateral or ability to repay. Such financial instruments arerecorded when they are funded.

F-15
Derivatives: The Company is exposed to interest rate risk primarily from the effect of interest rate changes on its interest-earning assets and its sources of funding these assets. The Company will periodically enter into interest rate swaps or interest ratecaps/floors to manage certain interest rate risk exposure.
An interest rate swap is an agreement between two entities to exchange cash flows in the future. The agreement sets the dates onwhich the cash flows will be paid and the manner in which the cash flows will be calculated. Typically, an interest rate swaptransaction is used as an exchange of cash flows based on a fixed rate for cash flows based on a variable rate.
In an interest rate cap agreement, a cash flow is generated if the price or interest rate of an underlying variable rises above acertain threshold price or interest rate. In an interest rate floor agreement, a cash flow is generated if the price or interest rate of anunderlying variable falls below a certain threshold price or interest rate. Caps and floors are designed as protection against the interestrate on a variable rate asset or liability rising above or falling below a certain level.
At the inception of a derivative contract, the Company designates the derivatives as one of three types. These three types are:(1) a hedge of the fair value of a recognized asset or liability or of an unrecognized firm commitment (“fair value hedge”); (2) a hedgeof a forecasted transaction or the variability of cash flows to be received or paid related to a recognized asset or liability (“cash flowhedge”); or (3) an instrument with no hedging designation (“stand-alone derivative”).
Beginning January 1, 2019, the Company adopted new hedge accounting guidance that requires the following presentation ofgains/(losses) on derivatives and hedging activities for qualifying hedges. For a fair value hedge, the gain or loss on the derivative, aswell as the offsetting loss or gain on the hedged item and net interest settlements, are recognized in net interest income in the sameline as the earnings effect of the hedged item. For a cash flow hedge, the gain or loss on the derivative is reported in othercomprehensive income and is reclassified into earnings in the same periods during which the hedged transaction affects earnings.Changes in the fair value of derivatives that do not qualify for hedge accounting are reported currently in earnings as non-interestincome.
Prior to January 1, 2019, gains/(losses) on derivatives and hedging activities for qualifying hedges were presented as follows.For a fair value hedge, the gain or loss on the derivative, as well as the offsetting loss or gain on the hedged item were recognized incurrent earnings as fair value changes. For a cash flow hedge, the gain or loss on the derivative was reported in other comprehensiveincome and was reclassified into earnings in the same periods during which the hedged transaction affects earnings. For both types ofhedges, changes in the fair value of derivatives that were not highly effective in hedging the changes in fair value or expected cashflows of the hedged item were recognized immediately in current earnings. Changes in the fair value of derivatives that did notqualify for hedge accounting were reported in earnings as non-interest income.
Net cash settlements on derivatives that qualify for hedge accounting are recorded in interest income or interest expense, basedon the item being hedged. Net cash settlements on derivatives that do not qualify for hedge accounting are reported in non-interestincome. Cash flows on hedges are classified in the cash flow statement the same as the cash flows of the items being hedged unlessthe derivative meets the criteria to be a financing derivative. All derivatives are recognized in the consolidated balance sheet at theirfair values and are reported as either derivative assets or derivative liabilities net of accrued net settlements and collateral, if any. Theindividual derivative amounts are netted by counterparty when the netting requirements have been met. If these netted values arepositive, they are classified as an asset and, if negative, they are classified as a liability.
The Company formally documents the relationship between derivatives and hedged items, as well as the risk-managementobjective and the strategy for undertaking hedge transactions at the inception of the hedging relationship. This documentationincludes linking fair value or cash flow hedges to specific assets and liabilities on the balance sheet or to specific firm commitments orforecasted transactions. The Company also formally assesses, both at the hedge’s inception and on an ongoing basis, at leastquarterly, whether the derivative instruments that are used are highly effective in offsetting changes in fair values or cash flows of thehedged items. The Company discontinues hedge accounting when it determines that the derivative is no longer effective in offsettingchanges in the fair value or cash flows of the hedged item, the derivative is settled or terminates, a hedged forecasted transaction is nolonger probable, a hedged firm commitment is no longer firm or treatment of the derivative as a hedge is no longer appropriate orintended.
When hedge accounting is discontinued, subsequent changes in fair value of the derivative are recorded as non-interestincome. When a fair value hedge is discontinued, the hedged asset or liability is no longer adjusted for changes in fair value and theexisting basis adjustment is amortized or accreted over the remaining life of the asset or liability. When a cash flow hedge isdiscontinued but the hedged cash flows or forecasted transactions are still expected to occur, gains or losses that are accumulated inother comprehensive income are amortized into earnings over the same periods which the hedged transactions will affect earnings.
The Company has entered into interest rate cap derivatives to assist with interest rate risk management. These derivatives arenot designated as hedging instruments but rather as stand-alone derivatives. The fair values of stand-alone derivatives are included in
F-16
other assets and other liabilities. Changes in fair value of stand-alone derivatives are recorded through earnings as non-interestincome.
Income Taxes: Income tax expense is the total of the current year income tax due or refundable and the change in deferred taxassets and liabilities. Deferred tax assets and liabilities are the expected future tax amounts for the temporary differences betweencarrying amounts and tax bases of assets and liabilities and are computed using enacted tax rates. A valuation allowance, if needed,reduces deferred tax assets to the amount expected to be realized. A tax position is recognized as a benefit only if it is “more likelythan not” that the tax position will be sustained in a tax examination, with a tax examination being presumed to occur. The amountrecognized is the largest amount of tax benefit that is more likely than not to be realized on examination.
The Company recognizes interest and/or penalties related to income tax matters in income tax expense. There were no suchinterest or penalties incurred in 2020, 2019 or 2018.
Earnings Per Common Share: Net income, less dividends and discount accretion on preferred stock, equals net income allocableto common stockholders. Basic earnings per common share is net income allocable to common stockholders divided by the weightedaverage number of common shares and vested restricted stock units outstanding during the period. Diluted earnings per commonshare include the dilutive effect of additional potential common shares of unexercised stock options and unvested restricted stockunits.
Share-Based Payments: The Company has share-based payments which are described more fully in a subsequentnote. Compensation expense associated with the stock option plan is based on the fair value of the options at the grant date. Thiscompensation is expensed over the periods during which the options vest. Options vest based on the passage of time or theachievement of performance targets, depending on the structure of the related grant.
Compensation expense associated with restricted stock units is based on the fair value of the units at the grant date. Thiscompensation expense is recognized ratably over the service period stipulated in the grant agreement.
Comprehensive Income: Comprehensive income consists of net income and other comprehensive income. Othercomprehensive income includes unrealized gains and losses on securities available-for-sale and the amortization of unrealized gainsand losses on securities transferred to held-to-maturity from available-for-sale.
Loss Contingencies: Loss contingencies, including claims and legal actions arising in the ordinary course of business, arerecorded as liabilities when the likelihood of loss is probable and an amount or range of loss can be reasonably estimated. Additionaldiscussion of loss contingencies at December 31, 2020, is presented in a subsequent note.
Restrictions on Cash: Cash on hand or on deposit with the Federal Reserve Bank was required to meet regulatory reserve andclearing requirements.
Dividend Restriction: Banking regulations require maintaining certain capital levels, positive undivided profits and a certainlevel of net income available to shareholders and may limit the dividends paid by the wholly-owned subsidiaries to the holdingcompany or by the holding company to stockholders.
Fair Value: Fair values of financial instruments, impaired loans, other real estate owned and property held for sale are estimatedusing relevant market information and other assumptions, as more fully disclosed in a separate note. Fair value estimates involveuncertainties and matters of significant judgment regarding interest rates, credit risk, prepayments, collateral values and other factors,especially in the absence of broad markets for particular items. Changes in assumptions or in market conditions could materiallyaffect the estimates.
Segment Information: As a community-oriented financial institution, substantially all of the Company’s operations involve thedelivery of loan and deposit products to customers. Management makes operating decisions and assesses performance based on anongoing review of these banking operations, which constitute the Company’s only operating segment for financial reporting purposes.
Reclassifications: Some items in the prior year financial statements were reclassified to conform to the currentpresentation. Management determined the items reclassified are immaterial to the consolidated financial statements taken as a wholeand did not result in a change in equity or net income for years ended December 31, 2020, 2019 and 2018.
Recent Accounting Pronouncements:
In February 2016, FASB issued ASU 2016-02, Leases, with the intention of improving financial reporting about leasingtransactions. The ASU requires all lessees to recognize lease assets and lease liabilities on the balance sheet. Lessor accounting islargely unchanged by the ASU, however disclosures about the amount, timing and uncertainty of cash flows arising from leases are
F-17
required of both lessees and lessors. Lessees and lessors are required to recognize and measure leases at the beginning of the earliestperiod presented using a modified retrospective approach. The modified retrospective approach provides for optional practicalexpedients when applying the ASU to leases that commenced before the effective date of the ASU. This accounting pronouncementwas further modified in July 2018 with the issuance of ASU 2018-11, Leases � Targeted Improvements, to allow for another transitionmethod by applying a cumulative-effect adjustment to opening retained earnings at adoption and providing lessors a practicalexpedient to not separate non-lease and lease components in certain circumstances. The Company adopted this accounting standardeffective January 1, 2019, resulting in the Company recording $3,251 in right of use assets and $3,251 of operating lease liabilities. Inaddition, the Company elected the following practical expedients to all leases that commenced prior to January 1, 2019: (1) Noreassessment of lease populations as long as the contract was properly scoped as a lease or not a lease under ASC 840; (2) Noreassessment of existing lease classification; and (3) No adjustment of existing costs.
In June 2016, FASB issued ASU 2016-13, Financial Instruments � Credit Losses, which will change how the Companymeasures credit losses for most of its financial assets. This guidance is applicable to loans held for investment, off-balance-sheetcredit exposures, such as loan commitments and standby letters of credit, and held-to-maturity investment securities. The Company isrequired to use a new forward-looking current expected credit losses (CECL) model that is anticipated to result in the earlierrecognition of allowances for losses. For available-for-sale securities with unrealized losses, the Company will measure credit lossesin a manner similar to current practice but will recognize those credit losses as allowances rather than reductions in the amortized costof the securities. In addition, the ASU requires significantly more disclosure including information about credit quality by year oforigination for most loans. Generally, the amendments will be applied through a cumulative-effect adjustment to retained earnings asof the beginning of the first reporting period in which the guidance is effective. The Company has completed the process ofdeveloping credit models but is finalizing model implementation, implementation of internal controls, financial reporting process andcorporate governance processes to comply with the new guidance. The ASU was originally effective for the Company beginning inthe first quarter of 2020; however, the CARES Act, issued in 2020, provided temporary relief related to the implementation of thisaccounting guidance until the earlier of the date on which the national emergency concerning the COVID-19 virus terminates orDecember 31, 2020. The Company elected to utilize this relief and has calculated the allowance for loan losses and the resultingprovision for loan losses using the prior incurred loss method at December 31, 2020. Further implementation relief for this standardwas provided on December 27, 2020, by section 540 of the Consolidated Appropriations Act (“CAA”) which allowed for anadditional extension to the earlier of 60 days after the national emergency termination date or January 1, 2022. The Company haselected not to extend the implementation any further and will adopt effective January 1, 2021. The adoption of CECL will result in anincrease to our total allowance for credit losses (ACL) on loans held for investment and will require a reclassification of purchasedcredit-impaired discount from loans to the allowance for credit losses. The expected increase in the ACL is largely attributable tomoving to a life of loan allowance methodology and from additional qualitative adjustments to historical loss rates brought about theanticipated impacts of the COVID-19 virus. The ultimate impact to the Company’s financial condition and results of operations of theASU, at both adoption and each subsequent reporting periods, is highly dependent on credit quality, macroeconomic forecasts andconditions, the composition of our loan portfolio and other management judgements. The Company expects the allowance for creditlosses to increase by a material amount with the first quarter 2021 adoption of this accounting standard but have yet concluded on aprecise estimate.
In January 2017, FASB issued ASU 2017-04, Intangibles-Goodwill and Other, which will simplify the subsequent measurementof goodwill. Goodwill and other intangibles must be assessed for impairment annually. If an entity’s assessment determines that thefair value of an entity is less than its carrying amount, including goodwill, currently, the measurement of goodwill impairment requiresthat the entity’s identifiable net assets be valued following procedures similar to determining the fair value of assets acquired andliabilities assumed in a business combination. Under ASU 2017-04, goodwill impairment is measured to the extent that the carryingamount of an entity exceeds its fair value. The amendments in this update were effective for the Company’s annual goodwillimpairment tests beginning in 2020. The impact of this new accounting guidance is highly dependent on changes in financial marketsand future events. The Company will monitor indicators of goodwill impairment on a quarterly basis and will record impairmentwhen it is determined to have occurred.
In March 2017, FASB issued ASU 2017-08, Premium Amortization on Purchased Callable Debt Securities. This updateshortens the amortization period of certain callable debt securities held at a premium to the earliest call date. The amendments in thisupdate are effective for the Company’s fiscal year beginning after December 15, 2018, and interim periods within that fiscal year,however, early adoption is permitted. If early adoption of this update is elected by the Company, any adjustments will be reflected asof the beginning of the fiscal year. The amendments will be applied on a modified retrospective basis through a cumulative-effectadjustment to retained earnings as of the beginning of the period of adoption and the Company will be required to provide change inaccounting principle disclosures. The Company adopted this accounting standard effective January 1, 2019, which resulted in theCompany recording a $1,385 reduction in the amortized cost of investment securities and a reduction of $1,148 in retained earnings,net of $237 in deferred taxes.
In August 2017, FASB issued ASU 2017-12, Derivatives and Hedging, Targeted Improvements to Accounting for HedgingActivities, with the stated objective of improving the financial reporting of hedging relationships to better reflect the economics of
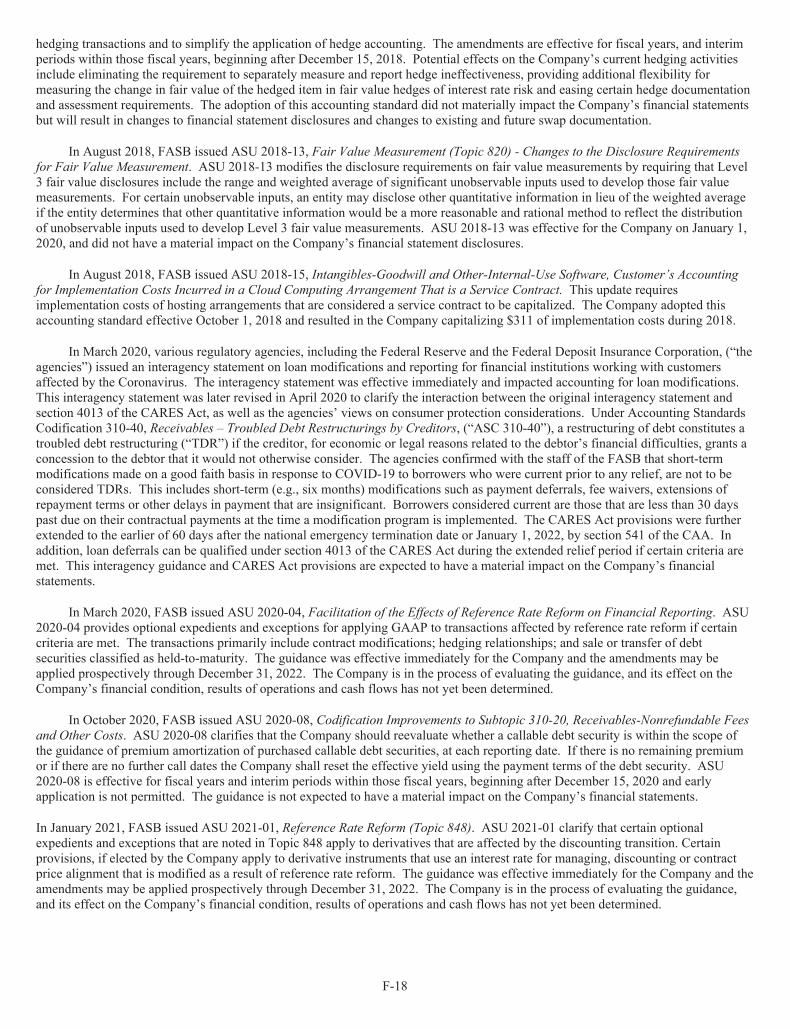
F-18
hedging transactions and to simplify the application of hedge accounting. The amendments are effective for fiscal years, and interimperiods within those fiscal years, beginning after December 15, 2018. Potential effects on the Company’s current hedging activitiesinclude eliminating the requirement to separately measure and report hedge ineffectiveness, providing additional flexibility formeasuring the change in fair value of the hedged item in fair value hedges of interest rate risk and easing certain hedge documentationand assessment requirements. The adoption of this accounting standard did not materially impact the Company’s financial statementsbut will result in changes to financial statement disclosures and changes to existing and future swap documentation.
In August 2018, FASB issued ASU 2018-13, Fair Value Measurement (Topic 820) - Changes to the Disclosure Requirementsfor Fair Value Measurement. ASU 2018-13 modifies the disclosure requirements on fair value measurements by requiring that Level3 fair value disclosures include the range and weighted average of significant unobservable inputs used to develop those fair valuemeasurements. For certain unobservable inputs, an entity may disclose other quantitative information in lieu of the weighted averageif the entity determines that other quantitative information would be a more reasonable and rational method to reflect the distributionof unobservable inputs used to develop Level 3 fair value measurements. ASU 2018-13 was effective for the Company on January 1,2020, and did not have a material impact on the Company’s financial statement disclosures.
In August 2018, FASB issued ASU 2018-15, Intangibles-Goodwill and Other-Internal-Use Software, Customer�s Accountingfor Implementation Costs Incurred in a Cloud Computing Arrangement That is a Service Contract. This update requiresimplementation costs of hosting arrangements that are considered a service contract to be capitalized. The Company adopted thisaccounting standard effective October 1, 2018 and resulted in the Company capitalizing $311 of implementation costs during 2018.
In March 2020, various regulatory agencies, including the Federal Reserve and the Federal Deposit Insurance Corporation, (“theagencies”) issued an interagency statement on loan modifications and reporting for financial institutions working with customersaffected by the Coronavirus. The interagency statement was effective immediately and impacted accounting for loan modifications.This interagency statement was later revised in April 2020 to clarify the interaction between the original interagency statement andsection 4013 of the CARES Act, as well as the agencies’ views on consumer protection considerations. Under Accounting StandardsCodification 310-40, Receivables � Troubled Debt Restructurings by Creditors, (“ASC 310-40”), a restructuring of debt constitutes atroubled debt restructuring (“TDR”) if the creditor, for economic or legal reasons related to the debtor’s financial difficulties, grants aconcession to the debtor that it would not otherwise consider. The agencies confirmed with the staff of the FASB that short-termmodifications made on a good faith basis in response to COVID-19 to borrowers who were current prior to any relief, are not to beconsidered TDRs. This includes short-term (e.g., six months) modifications such as payment deferrals, fee waivers, extensions ofrepayment terms or other delays in payment that are insignificant. Borrowers considered current are those that are less than 30 dayspast due on their contractual payments at the time a modification program is implemented. The CARES Act provisions were furtherextended to the earlier of 60 days after the national emergency termination date or January 1, 2022, by section 541 of the CAA. Inaddition, loan deferrals can be qualified under section 4013 of the CARES Act during the extended relief period if certain criteria aremet. This interagency guidance and CARES Act provisions are expected to have a material impact on the Company’s financialstatements.
In March 2020, FASB issued ASU 2020-04, Facilitation of the Effects of Reference Rate Reform on Financial Reporting. ASU2020-04 provides optional expedients and exceptions for applying GAAP to transactions affected by reference rate reform if certaincriteria are met. The transactions primarily include contract modifications; hedging relationships; and sale or transfer of debtsecurities classified as held-to-maturity. The guidance was effective immediately for the Company and the amendments may beapplied prospectively through December 31, 2022. The Company is in the process of evaluating the guidance, and its effect on theCompany’s financial condition, results of operations and cash flows has not yet been determined.
In October 2020, FASB issued ASU 2020-08, Codification Improvements to Subtopic 310-20, Receivables-Nonrefundable Feesand Other Costs. ASU 2020-08 clarifies that the Company should reevaluate whether a callable debt security is within the scope ofthe guidance of premium amortization of purchased callable debt securities, at each reporting date. If there is no remaining premiumor if there are no further call dates the Company shall reset the effective yield using the payment terms of the debt security. ASU2020-08 is effective for fiscal years and interim periods within those fiscal years, beginning after December 15, 2020 and earlyapplication is not permitted. The guidance is not expected to have a material impact on the Company’s financial statements.
In January 2021, FASB issued ASU 2021-01, Reference Rate Reform (Topic 848). ASU 2021-01 clarify that certain optionalexpedients and exceptions that are noted in Topic 848 apply to derivatives that are affected by the discounting transition. Certainprovisions, if elected by the Company apply to derivative instruments that use an interest rate for managing, discounting or contractprice alignment that is modified as a result of reference rate reform. The guidance was effective immediately for the Company and theamendments may be applied prospectively through December 31, 2022. The Company is in the process of evaluating the guidance,and its effect on the Company’s financial condition, results of operations and cash flows has not yet been determined.

F-19
NOTE 2 – BUSINESS COMBINATIONS
At the close of business on October 23, 2020, the Company acquired the assets and assumed the deposit liabilities of AlmenaState Bank (“Almena”), based in Norton, Kansas, pursuant to a Purchase and Assumption Agreement facilitated by the FederalDeposit Insurance Corporation (“FDIC”). Results of Almena operations were included in the Company’s results of operationsbeginning October 24, 2020. Acquisition-related costs associated with this acquisition were $299 ($225 on an after-tax basis) and areincluded in merger expense in the Company’s income statement for the year ended December 31, 2020.
Information necessary to recognize the fair value of assets acquired and liabilities assumed is complete except for certainmatters related to loan valuation, which is partially due to a limited due diligence period related to the FDIC acquisition. Therecognized amounts of the identifiable net assets acquired, exceeded the cash consideration exchanged resulting in a gain onacquisition of $2,145. The acquisition was an expansion to the Company’s current footprint in western Kansas with the addition ofone branch location in Norton, Kansas, and one in Almena, Kansas.
The following table summarizes the amounts of assets acquired and liabilities assumed recognized at the acquisition date.
Recognized amounts of identifiable assets acquired andliabilities assumed:Cash and due from banks $ 25,925Available-for-sale securities 7,041Federal Reserve Bank and Federal Home Loan Bank stock 187Loans 31,407Premises and equipment 1,109Other real estate owned 636Other assets 604
Total assets acquired 66,909Deposits 62,472Federal funds purchased and retail repurchase agreements 251Interest payable and other liabilities 2,041
Total liabilities assumed 64,764Total identifiable net assets 2,145Gain on acquisition (2,145)
$ —
The fair value of net assets acquired includes fair value adjustments to certain loans that were not considered impaired as of theacquisition date. The fair value adjustments were determined using discounted contractual cash flows. However, the Companybelieves that all contractual cash flows related to these financial instruments will be collected. As such, these loans were notconsidered impaired at the acquisition date and were not subject to the guidance relating to purchased credit impaired loans, whichhave shown evidence of credit deterioration since origination.
The following table presents information about the loans acquired in the Almena acquisition as of the date of acquisition.Non-CreditImpaired
Purchased CreditImpaired
Contractually required principal $ 25,702 $ 20,597Non-accretable difference (expected losses) — (14,637)
Cash flows expected to be collected 25,702 5,960Accretable yield (255) —
Fair value of acquired loans $ 25,447 $ 5,960
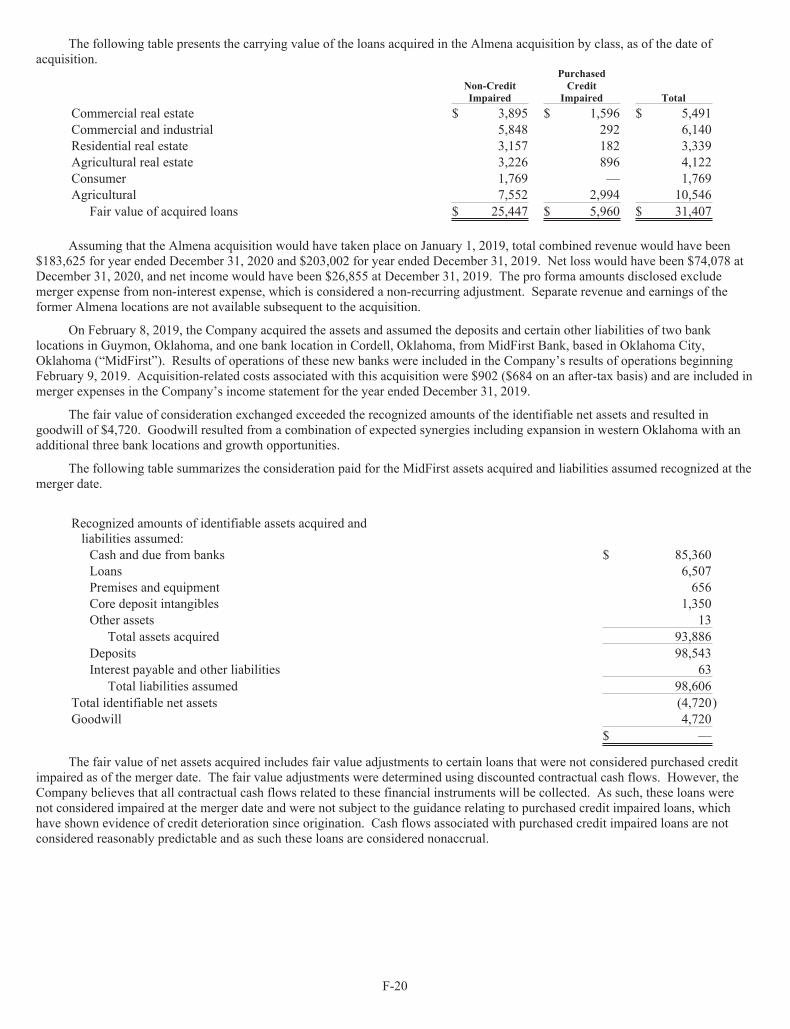
F-20
The following table presents the carrying value of the loans acquired in the Almena acquisition by class, as of the date ofacquisition.
Non-CreditImpaired
PurchasedCredit
Impaired TotalCommercial real estate $ 3,895 $ 1,596 $ 5,491Commercial and industrial 5,848 292 6,140Residential real estate 3,157 182 3,339Agricultural real estate 3,226 896 4,122Consumer 1,769 — 1,769Agricultural 7,552 2,994 10,546
Fair value of acquired loans $ 25,447 $ 5,960 $ 31,407
Assuming that the Almena acquisition would have taken place on January 1, 2019, total combined revenue would have been$183,625 for year ended December 31, 2020 and $203,002 for year ended December 31, 2019. Net loss would have been $74,078 atDecember 31, 2020, and net income would have been $26,855 at December 31, 2019. The pro forma amounts disclosed excludemerger expense from non-interest expense, which is considered a non-recurring adjustment. Separate revenue and earnings of theformer Almena locations are not available subsequent to the acquisition.
On February 8, 2019, the Company acquired the assets and assumed the deposits and certain other liabilities of two banklocations in Guymon, Oklahoma, and one bank location in Cordell, Oklahoma, from MidFirst Bank, based in Oklahoma City,Oklahoma (“MidFirst”). Results of operations of these new banks were included in the Company’s results of operations beginningFebruary 9, 2019. Acquisition-related costs associated with this acquisition were $902 ($684 on an after-tax basis) and are included inmerger expenses in the Company’s income statement for the year ended December 31, 2019.
The fair value of consideration exchanged exceeded the recognized amounts of the identifiable net assets and resulted ingoodwill of $4,720. Goodwill resulted from a combination of expected synergies including expansion in western Oklahoma with anadditional three bank locations and growth opportunities.
The following table summarizes the consideration paid for the MidFirst assets acquired and liabilities assumed recognized at themerger date.
Recognized amounts of identifiable assets acquired andliabilities assumed:Cash and due from banks $ 85,360Loans 6,507Premises and equipment 656Core deposit intangibles 1,350Other assets 13
Total assets acquired 93,886Deposits 98,543Interest payable and other liabilities 63
Total liabilities assumed 98,606Total identifiable net assets (4,720)Goodwill 4,720
$ —
The fair value of net assets acquired includes fair value adjustments to certain loans that were not considered purchased creditimpaired as of the merger date. The fair value adjustments were determined using discounted contractual cash flows. However, theCompany believes that all contractual cash flows related to these financial instruments will be collected. As such, these loans werenot considered impaired at the merger date and were not subject to the guidance relating to purchased credit impaired loans, whichhave shown evidence of credit deterioration since origination. Cash flows associated with purchased credit impaired loans are notconsidered reasonably predictable and as such these loans are considered nonaccrual.
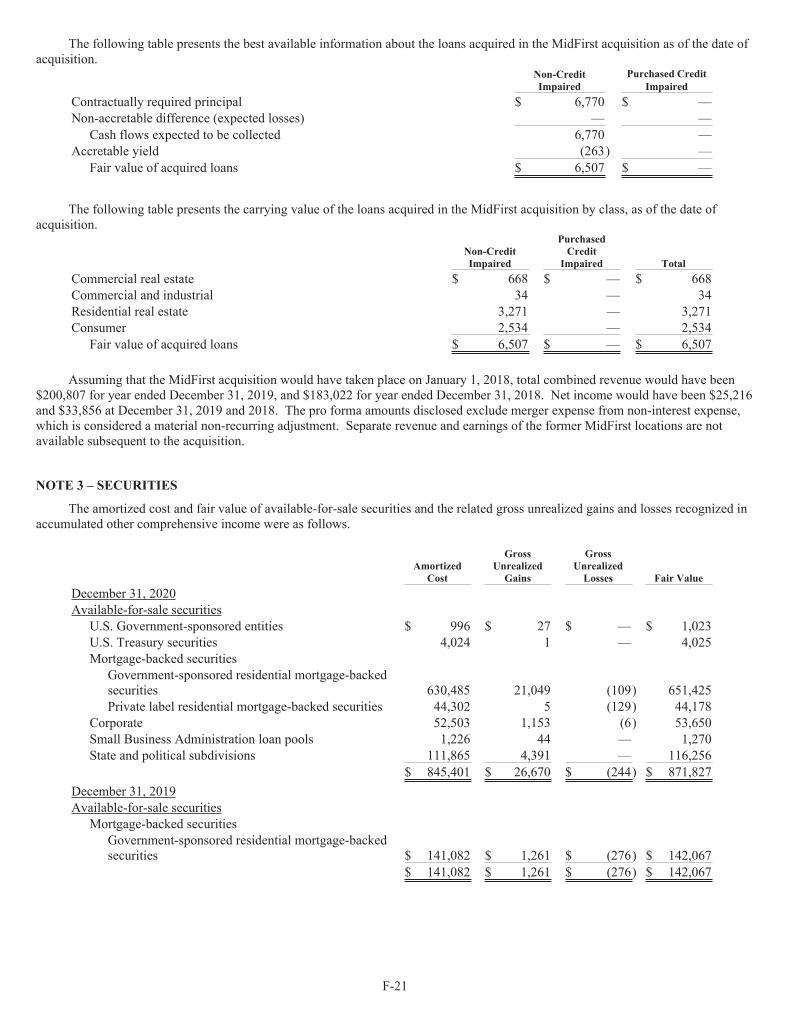
F-21
The following table presents the best available information about the loans acquired in the MidFirst acquisition as of the date ofacquisition.
Non-CreditImpaired
Purchased CreditImpaired
Contractually required principal $ 6,770 $ —Non-accretable difference (expected losses) — —
Cash flows expected to be collected 6,770 —Accretable yield (263) —
Fair value of acquired loans $ 6,507 $ —
The following table presents the carrying value of the loans acquired in the MidFirst acquisition by class, as of the date ofacquisition.
Non-CreditImpaired
PurchasedCredit
Impaired TotalCommercial real estate $ 668 $ — $ 668Commercial and industrial 34 — 34Residential real estate 3,271 — 3,271Consumer 2,534 — 2,534
Fair value of acquired loans $ 6,507 $ — $ 6,507
Assuming that the MidFirst acquisition would have taken place on January 1, 2018, total combined revenue would have been$200,807 for year ended December 31, 2019, and $183,022 for year ended December 31, 2018. Net income would have been $25,216and $33,856 at December 31, 2019 and 2018. The pro forma amounts disclosed exclude merger expense from non-interest expense,which is considered a material non-recurring adjustment. Separate revenue and earnings of the former MidFirst locations are notavailable subsequent to the acquisition.
NOTE 3 – SECURITIES
The amortized cost and fair value of available-for-sale securities and the related gross unrealized gains and losses recognized inaccumulated other comprehensive income were as follows.
AmortizedCost
GrossUnrealizedGains
GrossUnrealizedLosses Fair Value
December 31, 2020Available-for-sale securities
U.S. Government-sponsored entities $ 996 $ 27 $ — $ 1,023U.S. Treasury securities 4,024 1 — 4,025Mortgage-backed securities
Government-sponsored residential mortgage-backedsecurities 630,485 21,049 (109) 651,425Private label residential mortgage-backed securities 44,302 5 (129) 44,178
Corporate 52,503 1,153 (6) 53,650Small Business Administration loan pools 1,226 44 — 1,270State and political subdivisions 111,865 4,391 — 116,256
$ 845,401 $ 26,670 $ (244) $ 871,827December 31, 2019Available-for-sale securities
Mortgage-backed securitiesGovernment-sponsored residential mortgage-backedsecurities $ 141,082 $ 1,261 $ (276) $ 142,067
$ 141,082 $ 1,261 $ (276) $ 142,067
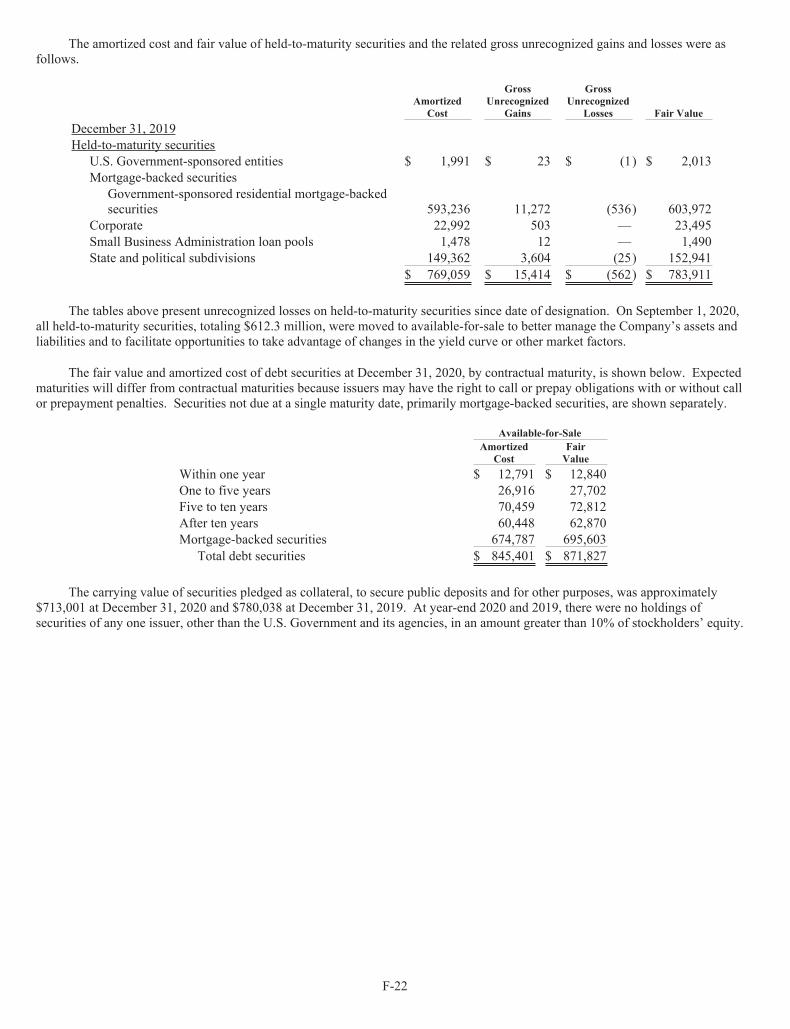
F-22
The amortized cost and fair value of held-to-maturity securities and the related gross unrecognized gains and losses were asfollows.
AmortizedCost
GrossUnrecognized
Gains
GrossUnrecognized
Losses Fair ValueDecember 31, 2019Held-to-maturity securities
U.S. Government-sponsored entities $ 1,991 $ 23 $ (1) $ 2,013Mortgage-backed securities
Government-sponsored residential mortgage-backedsecurities 593,236 11,272 (536) 603,972
Corporate 22,992 503 — 23,495Small Business Administration loan pools 1,478 12 — 1,490State and political subdivisions 149,362 3,604 (25) 152,941
$ 769,059 $ 15,414 $ (562) $ 783,911
The tables above present unrecognized losses on held-to-maturity securities since date of designation. On September 1, 2020,all held-to-maturity securities, totaling $612.3 million, were moved to available-for-sale to better manage the Company’s assets andliabilities and to facilitate opportunities to take advantage of changes in the yield curve or other market factors.
The fair value and amortized cost of debt securities at December 31, 2020, by contractual maturity, is shown below. Expectedmaturities will differ from contractual maturities because issuers may have the right to call or prepay obligations with or without callor prepayment penalties. Securities not due at a single maturity date, primarily mortgage-backed securities, are shown separately.
Available-for-SaleAmortized
CostFairValue
Within one year $ 12,791 $ 12,840One to five years 26,916 27,702Five to ten years 70,459 72,812After ten years 60,448 62,870Mortgage-backed securities 674,787 695,603
Total debt securities $ 845,401 $ 871,827
The carrying value of securities pledged as collateral, to secure public deposits and for other purposes, was approximately$713,001 at December 31, 2020 and $780,038 at December 31, 2019. At year-end 2020 and 2019, there were no holdings ofsecurities of any one issuer, other than the U.S. Government and its agencies, in an amount greater than 10% of stockholders’ equity.
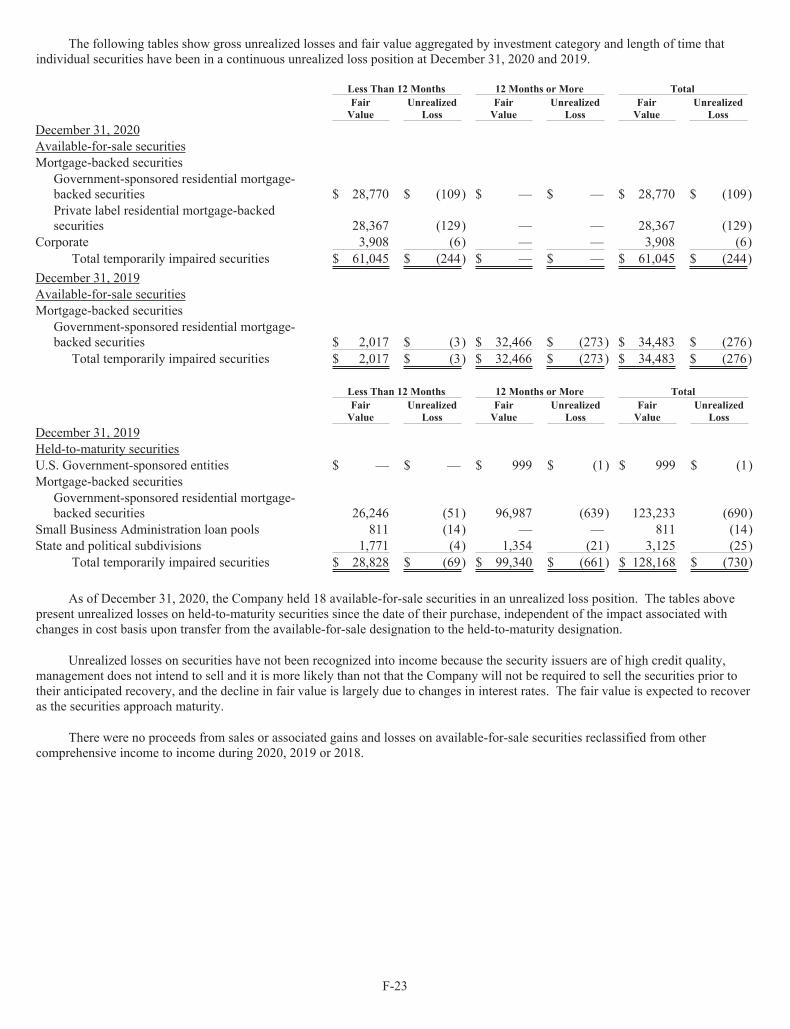
F-23
The following tables show gross unrealized losses and fair value aggregated by investment category and length of time thatindividual securities have been in a continuous unrealized loss position at December 31, 2020 and 2019.
Less Than 12 Months 12 Months or More TotalFairValue
UnrealizedLoss
FairValue
UnrealizedLoss
FairValue
UnrealizedLoss
December 31, 2020Available-for-sale securitiesMortgage-backed securities
Government-sponsored residential mortgage-backed securities $ 28,770 $ (109) $ — $ — $ 28,770 $ (109)Private label residential mortgage-backedsecurities 28,367 (129) — — 28,367 (129)
Corporate 3,908 (6) — — 3,908 (6)Total temporarily impaired securities $ 61,045 $ (244) $ — $ — $ 61,045 $ (244)
December 31, 2019Available-for-sale securitiesMortgage-backed securities
Government-sponsored residential mortgage-backed securities $ 2,017 $ (3) $ 32,466 $ (273) $ 34,483 $ (276)
Total temporarily impaired securities $ 2,017 $ (3) $ 32,466 $ (273) $ 34,483 $ (276)
Less Than 12 Months 12 Months or More TotalFairValue
UnrealizedLoss
FairValue
UnrealizedLoss
FairValue
UnrealizedLoss
December 31, 2019Held-to-maturity securitiesU.S. Government-sponsored entities $ — $ — $ 999 $ (1) $ 999 $ (1)Mortgage-backed securities
Government-sponsored residential mortgage-backed securities 26,246 (51) 96,987 (639) 123,233 (690)
Small Business Administration loan pools 811 (14) — — 811 (14)State and political subdivisions 1,771 (4) 1,354 (21) 3,125 (25)
Total temporarily impaired securities $ 28,828 $ (69) $ 99,340 $ (661) $ 128,168 $ (730)
As of December 31, 2020, the Company held 18 available-for-sale securities in an unrealized loss position. The tables abovepresent unrealized losses on held-to-maturity securities since the date of their purchase, independent of the impact associated withchanges in cost basis upon transfer from the available-for-sale designation to the held-to-maturity designation.
Unrealized losses on securities have not been recognized into income because the security issuers are of high credit quality,management does not intend to sell and it is more likely than not that the Company will not be required to sell the securities prior totheir anticipated recovery, and the decline in fair value is largely due to changes in interest rates. The fair value is expected to recoveras the securities approach maturity.
There were no proceeds from sales or associated gains and losses on available-for-sale securities reclassified from othercomprehensive income to income during 2020, 2019 or 2018.
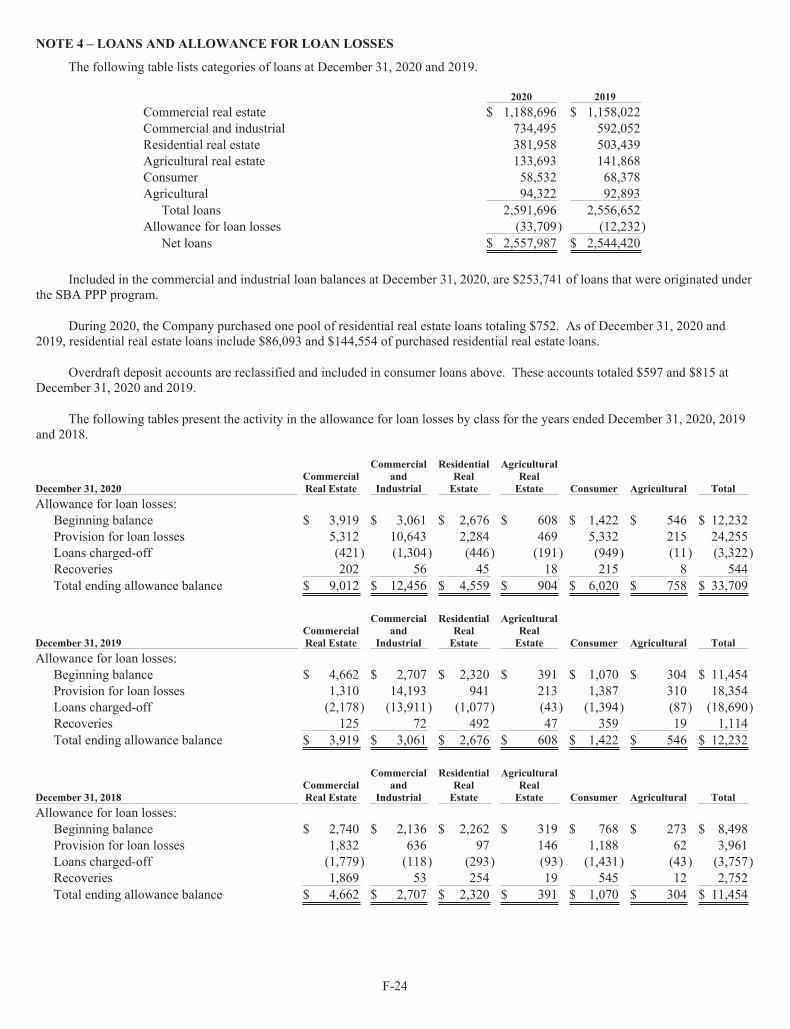
F-24
NOTE 4 – LOANS AND ALLOWANCE FOR LOAN LOSSES
The following table lists categories of loans at December 31, 2020 and 2019.
2020 2019Commercial real estate $ 1,188,696 $ 1,158,022Commercial and industrial 734,495 592,052Residential real estate 381,958 503,439Agricultural real estate 133,693 141,868Consumer 58,532 68,378Agricultural 94,322 92,893
Total loans 2,591,696 2,556,652Allowance for loan losses (33,709) (12,232)
Net loans $ 2,557,987 $ 2,544,420
Included in the commercial and industrial loan balances at December 31, 2020, are $253,741 of loans that were originated underthe SBA PPP program.
During 2020, the Company purchased one pool of residential real estate loans totaling $752. As of December 31, 2020 and2019, residential real estate loans include $86,093 and $144,554 of purchased residential real estate loans.
Overdraft deposit accounts are reclassified and included in consumer loans above. These accounts totaled $597 and $815 atDecember 31, 2020 and 2019.
The following tables present the activity in the allowance for loan losses by class for the years ended December 31, 2020, 2019and 2018.
December 31, 2020CommercialReal Estate
Commercialand
Industrial
ResidentialRealEstate
AgriculturalRealEstate Consumer Agricultural Total
Allowance for loan losses:Beginning balance $ 3,919 $ 3,061 $ 2,676 $ 608 $ 1,422 $ 546 $ 12,232Provision for loan losses 5,312 10,643 2,284 469 5,332 215 24,255Loans charged-off (421) (1,304) (446) (191) (949) (11) (3,322)Recoveries 202 56 45 18 215 8 544Total ending allowance balance $ 9,012 $ 12,456 $ 4,559 $ 904 $ 6,020 $ 758 $ 33,709
December 31, 2019CommercialReal Estate
Commercialand
Industrial
ResidentialRealEstate
AgriculturalRealEstate Consumer Agricultural Total
Allowance for loan losses:Beginning balance $ 4,662 $ 2,707 $ 2,320 $ 391 $ 1,070 $ 304 $ 11,454Provision for loan losses 1,310 14,193 941 213 1,387 310 18,354Loans charged-off (2,178) (13,911) (1,077) (43) (1,394) (87) (18,690)Recoveries 125 72 492 47 359 19 1,114Total ending allowance balance $ 3,919 $ 3,061 $ 2,676 $ 608 $ 1,422 $ 546 $ 12,232
December 31, 2018CommercialReal Estate
Commercialand
Industrial
ResidentialRealEstate
AgriculturalRealEstate Consumer Agricultural Total
Allowance for loan losses:Beginning balance $ 2,740 $ 2,136 $ 2,262 $ 319 $ 768 $ 273 $ 8,498Provision for loan losses 1,832 636 97 146 1,188 62 3,961Loans charged-off (1,779) (118) (293) (93) (1,431) (43) (3,757)Recoveries 1,869 53 254 19 545 12 2,752Total ending allowance balance $ 4,662 $ 2,707 $ 2,320 $ 391 $ 1,070 $ 304 $ 11,454

F-25
The following tables present the recorded investment in loans and the balance in the allowance for loan losses by portfolio andclass based on impairment method as of December 31, 2020 and 2019.
December 31, 2020CommercialReal Estate
Commercialand
Industrial
ResidentialRealEstate
AgriculturalRealEstate Consumer Agricultural Total
Allowance for loan losses:Individually evaluated for impairment $ 2,159 $ 5,457 $ 485 $ 595 $ 68 $ 96 $ 8,860Collectively evaluated for impairment 6,472 5,985 3,949 266 5,952 586 23,210Purchased credit impaired loans 381 1,014 125 43 — 76 1,639Total $ 9,012 $ 12,456 $ 4,559 $ 904 $ 6,020 $ 758 $ 33,709
Loan Balance:Individually evaluated for impairment $ 4,752 $ 20,421 $ 1,939 $ 2,711 $ 272 $ 2,201 $ 32,296Collectively evaluated for impairment 1,176,403 710,038 377,331 126,256 58,242 87,158 2,535,428Purchased credit impaired loans 7,541 4,036 2,688 4,726 18 4,963 23,972Total $1,188,696 $ 734,495 $381,958 $ 133,693 $ 58,532 $ 94,322 $2,591,696
December 31, 2019CommercialReal Estate
Commercialand
Industrial
ResidentialRealEstate
AgriculturalRealEstate Consumer Agricultural Total
Allowance for loan losses:Individually evaluated for impairment $ 281 $ 199 $ 303 $ 56 $ 39 $ 57 $ 935Collectively evaluated for impairment 3,581 2,848 2,352 459 1,383 394 11,017Purchased credit impaired loans 57 14 21 93 — 95 280Total $ 3,919 $ 3,061 $ 2,676 $ 608 $ 1,422 $ 546 $ 12,232
Loan Balance:Individually evaluated for impairment $ 4,375 $ 16,335 $ 7,358 $ 584 $ 381 $ 518 $ 29,551Collectively evaluated for impairment 1,145,701 570,606 493,309 135,776 67,972 90,347 2,503,711Purchased credit impaired loans 7,946 5,111 2,772 5,508 25 2,028 23,390Total $1,158,022 $ 592,052 $503,439 $ 141,868 $ 68,378 $ 92,893 $2,556,652
Excluding purchased credit impaired loans, included in the above tables is $380,058, $624,747 and $827,676 of loanspurchased at a discount acquired as part of a merger and the discount associated with these loans is $5,510, $8,287 and $11,372 atDecember 31, 2020, 2019 and 2018.

F-26
The following table presents information related to impaired loans, excluding those purchased credit impaired loans which havenot deteriorated since acquisition, by class of loans as of and for the year ended December 31, 2020.
December 31, 2020
UnpaidPrincipalBalance
RecordedInvestment
Allowance forLoan LossesAllocated
AverageRecordedInvestment
InterestIncome
RecognizedWith no related allowance recorded:
Commercial real estate $ 6,279 $ 1,683 $ — $ 782 $ 36Commercial and industrial 2,087 643 — 11,512 28Residential real estate 270 180 — 3,475 17Agricultural real estate 3,408 1,090 — 670 5Consumer — — — — —Agricultural 11,326 4,492 — 898 —Subtotal 23,370 8,088 — 17,337 86
With an allowance recorded:Commercial real estate 7,134 5,899 2,540 5,713 35Commercial and industrial 29,245 22,814 6,471 12,168 362Residential real estate 3,023 2,775 610 3,414 14Agricultural real estate 3,474 3,021 638 3,432 34Consumer 294 272 68 309 7Agricultural 1,330 820 172 1,285 1Subtotal 44,500 35,601 10,499 26,321 453
Total $ 67,870 $ 43,689 $ 10,499 $ 43,658 $ 539
The above table presents interest income for the twelve months ended December 31, 2020. Interest income recognized in theabove table was substantially recognized on the cash basis. The recorded investment in loans excludes accrued interest receivable dueto immateriality.
The following table presents information related to impaired loans, excluding purchased credit impaired loans which have notdeteriorated since acquisition, by portfolio and class of loans as of and for the year ended December 31, 2019.
December 31, 2019
UnpaidPrincipalBalance
RecordedInvestment
Allowance forLoan LossesAllocated
AverageRecordedInvestment
InterestIncome
RecognizedWith no related allowance recorded:
Commercial real estate $ 2,166 $ 2,150 $ — $ 6,372 $ 82Commercial and industrial 20,152 14,832 — 4,617 11Residential real estate 4,395 4,324 — 4,193 50Agricultural real estate 1,610 1,533 — 1,750 —Consumer — — — 25 —Agricultural — — — 240 —Subtotal 28,323 22,839 — 17,197 143
With an allowance recorded:Commercial real estate 3,469 2,749 338 6,262 74Commercial and industrial 1,845 1,640 213 15,150 21Residential real estate 3,395 3,244 324 6,221 59Agricultural real estate 1,142 1,015 149 928 2Consumer 430 381 39 694 9Agricultural 1,619 1,359 152 803 2Subtotal 11,900 10,388 1,215 30,058 167
Total $ 40,223 $ 33,227 $ 1,215 $ 47,255 $ 310
The above table presents interest income for the twelve months ended December 31, 2019. Interest income recognized in theabove table was substantially recognized on the cash basis. The recorded investment in loans excludes accrued interest receivable dueto immateriality.
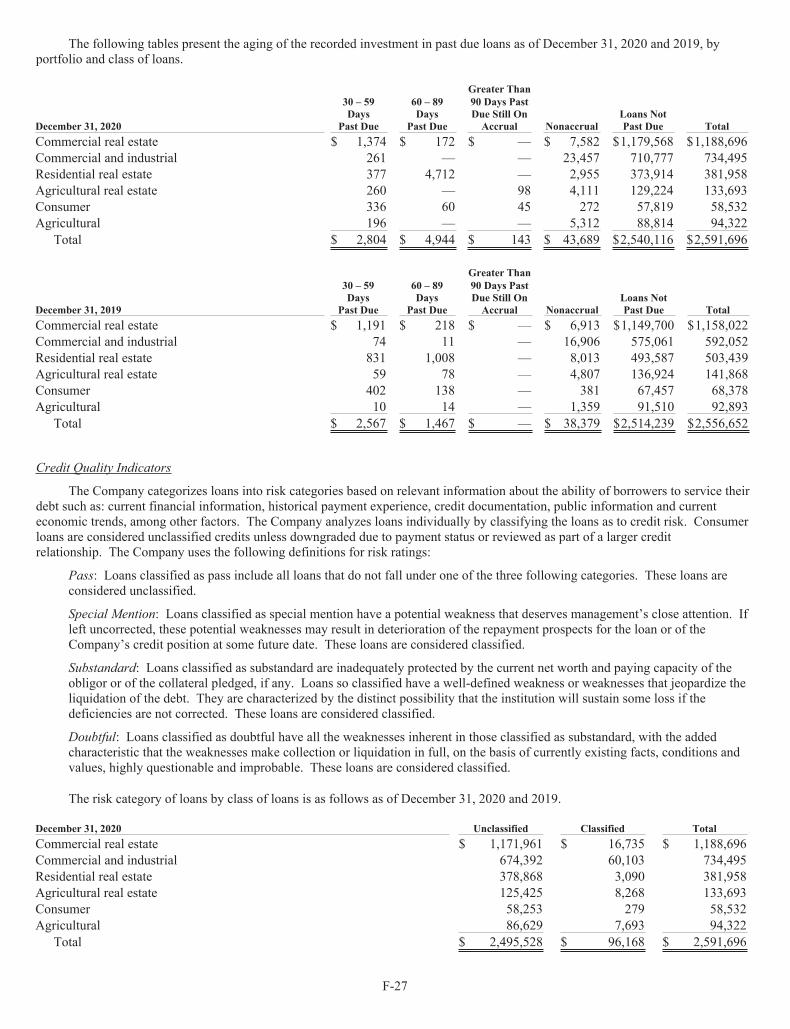
F-27
The following tables present the aging of the recorded investment in past due loans as of December 31, 2020 and 2019, byportfolio and class of loans.
December 31, 2020
30 – 59Days
Past Due
60 – 89Days
Past Due
Greater Than90 Days PastDue Still OnAccrual Nonaccrual
Loans NotPast Due Total
Commercial real estate $ 1,374 $ 172 $ — $ 7,582 $1,179,568 $1,188,696Commercial and industrial 261 — — 23,457 710,777 734,495Residential real estate 377 4,712 — 2,955 373,914 381,958Agricultural real estate 260 — 98 4,111 129,224 133,693Consumer 336 60 45 272 57,819 58,532Agricultural 196 — — 5,312 88,814 94,322
Total $ 2,804 $ 4,944 $ 143 $ 43,689 $2,540,116 $2,591,696
December 31, 2019
30 – 59Days
Past Due
60 – 89Days
Past Due
Greater Than90 Days PastDue Still OnAccrual Nonaccrual
Loans NotPast Due Total
Commercial real estate $ 1,191 $ 218 $ — $ 6,913 $1,149,700 $1,158,022Commercial and industrial 74 11 — 16,906 575,061 592,052Residential real estate 831 1,008 — 8,013 493,587 503,439Agricultural real estate 59 78 — 4,807 136,924 141,868Consumer 402 138 — 381 67,457 68,378Agricultural 10 14 — 1,359 91,510 92,893
Total $ 2,567 $ 1,467 $ — $ 38,379 $2,514,239 $2,556,652
Credit Quality Indicators
The Company categorizes loans into risk categories based on relevant information about the ability of borrowers to service theirdebt such as: current financial information, historical payment experience, credit documentation, public information and currenteconomic trends, among other factors. The Company analyzes loans individually by classifying the loans as to credit risk. Consumerloans are considered unclassified credits unless downgraded due to payment status or reviewed as part of a larger creditrelationship. The Company uses the following definitions for risk ratings:
Pass: Loans classified as pass include all loans that do not fall under one of the three following categories. These loans areconsidered unclassified.
Special Mention: Loans classified as special mention have a potential weakness that deserves management’s close attention. Ifleft uncorrected, these potential weaknesses may result in deterioration of the repayment prospects for the loan or of theCompany’s credit position at some future date. These loans are considered classified.
Substandard: Loans classified as substandard are inadequately protected by the current net worth and paying capacity of theobligor or of the collateral pledged, if any. Loans so classified have a well-defined weakness or weaknesses that jeopardize theliquidation of the debt. They are characterized by the distinct possibility that the institution will sustain some loss if thedeficiencies are not corrected. These loans are considered classified.
Doubtful: Loans classified as doubtful have all the weaknesses inherent in those classified as substandard, with the addedcharacteristic that the weaknesses make collection or liquidation in full, on the basis of currently existing facts, conditions andvalues, highly questionable and improbable. These loans are considered classified.
The risk category of loans by class of loans is as follows as of December 31, 2020 and 2019.
December 31, 2020 Unclassified Classified TotalCommercial real estate $ 1,171,961 $ 16,735 $ 1,188,696Commercial and industrial 674,392 60,103 734,495Residential real estate 378,868 3,090 381,958Agricultural real estate 125,425 8,268 133,693Consumer 58,253 279 58,532Agricultural 86,629 7,693 94,322
Total $ 2,495,528 $ 96,168 $ 2,591,696
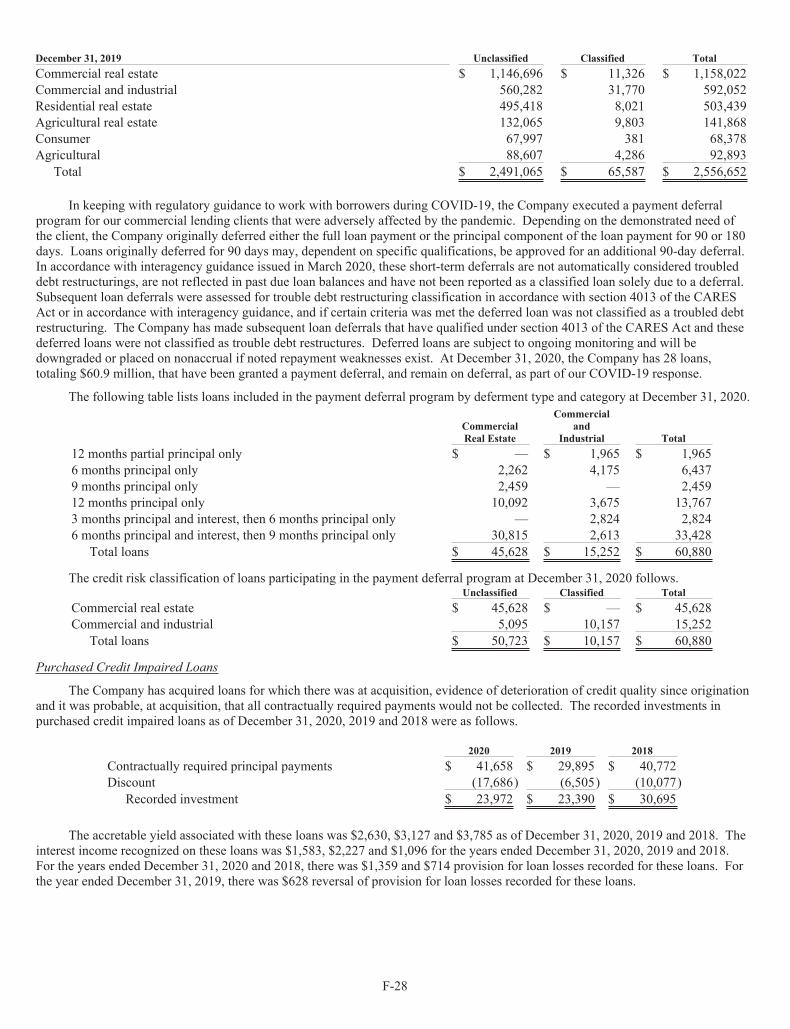
F-28
December 31, 2019 Unclassified Classified TotalCommercial real estate $ 1,146,696 $ 11,326 $ 1,158,022Commercial and industrial 560,282 31,770 592,052Residential real estate 495,418 8,021 503,439Agricultural real estate 132,065 9,803 141,868Consumer 67,997 381 68,378Agricultural 88,607 4,286 92,893
Total $ 2,491,065 $ 65,587 $ 2,556,652
In keeping with regulatory guidance to work with borrowers during COVID-19, the Company executed a payment deferralprogram for our commercial lending clients that were adversely affected by the pandemic. Depending on the demonstrated need ofthe client, the Company originally deferred either the full loan payment or the principal component of the loan payment for 90 or 180days. Loans originally deferred for 90 days may, dependent on specific qualifications, be approved for an additional 90-day deferral.In accordance with interagency guidance issued in March 2020, these short-term deferrals are not automatically considered troubleddebt restructurings, are not reflected in past due loan balances and have not been reported as a classified loan solely due to a deferral.Subsequent loan deferrals were assessed for trouble debt restructuring classification in accordance with section 4013 of the CARESAct or in accordance with interagency guidance, and if certain criteria was met the deferred loan was not classified as a troubled debtrestructuring. The Company has made subsequent loan deferrals that have qualified under section 4013 of the CARES Act and thesedeferred loans were not classified as trouble debt restructures. Deferred loans are subject to ongoing monitoring and will bedowngraded or placed on nonaccrual if noted repayment weaknesses exist. At December 31, 2020, the Company has 28 loans,totaling $60.9 million, that have been granted a payment deferral, and remain on deferral, as part of our COVID-19 response.
The following table lists loans included in the payment deferral program by deferment type and category at December 31, 2020.
CommercialReal Estate
Commercialand
Industrial Total12 months partial principal only $ — $ 1,965 $ 1,9656 months principal only 2,262 4,175 6,4379 months principal only 2,459 — 2,45912 months principal only 10,092 3,675 13,7673 months principal and interest, then 6 months principal only — 2,824 2,8246 months principal and interest, then 9 months principal only 30,815 2,613 33,428
Total loans $ 45,628 $ 15,252 $ 60,880
The credit risk classification of loans participating in the payment deferral program at December 31, 2020 follows.Unclassified Classified Total
Commercial real estate $ 45,628 $ — $ 45,628Commercial and industrial 5,095 10,157 15,252
Total loans $ 50,723 $ 10,157 $ 60,880
Purchased Credit Impaired Loans
The Company has acquired loans for which there was at acquisition, evidence of deterioration of credit quality since originationand it was probable, at acquisition, that all contractually required payments would not be collected. The recorded investments inpurchased credit impaired loans as of December 31, 2020, 2019 and 2018 were as follows.
2020 2019 2018Contractually required principal payments $ 41,658 $ 29,895 $ 40,772Discount (17,686) (6,505) (10,077)
Recorded investment $ 23,972 $ 23,390 $ 30,695
The accretable yield associated with these loans was $2,630, $3,127 and $3,785 as of December 31, 2020, 2019 and 2018. Theinterest income recognized on these loans was $1,583, $2,227 and $1,096 for the years ended December 31, 2020, 2019 and 2018.For the years ended December 31, 2020 and 2018, there was $1,359 and $714 provision for loan losses recorded for these loans. Forthe year ended December 31, 2019, there was $628 reversal of provision for loan losses recorded for these loans.

F-29
Troubled Debt Restructurings
Consistent with accounting and regulatory guidance, the Company recognizes a TDR when the Company, for economic or legalreasons related to a borrower’s financial difficulties, grants a concession to the borrower that would not normally be considered.Regardless of the form of concession granted, the Company’s objective in offering a TDR is to increase the probability of repaymentof the borrower’s loan.
The following table summarizes the Company’s TDRs by accrual status at December 31, 2020 and 2019.
December 31, 2020 Nonaccrual
RelatedAllowance forLoan Losses
Commercial real estate $ 1,167 $ 342Commercial and industrial 13,613 1,954
Total troubled debt restructurings $ 14,780 $ 2,296
December 31, 2019 Nonaccrual
RelatedAllowance forLoan Losses
Commercial real estate $ 1,247 $ —Commercial and industrial 14,261 —
Total troubled debt restructurings $ 15,508 $ —
During the year ended December 31, 2020, there were no loans modified in a TDR. The following table summarizesinformation in regard to TDRs that were restructured during the year ended December 31, 2019.
Number ofLoans
RecordedInvestment
ImpairmentRecognized
Commercial real estate 1 $ 1,247 $ —Commercial and industrial 1 14,261 4,994
Total troubled debt restructurings 2 $ 15,508 $ 4,994
No interest income was recognized on TDR loans during the periods ended December 31, 2020 and 2019, as all TDR loans wereaccounted for as non-accrual.
There were no outstanding commitments to lend additional funds on these loans as of the periods ended December 31, 2020 and2019.
NOTE 5 – OTHER REAL ESTATE OWNED
Changes in other real estate owned for the years ended December 31, 2020 and 2019 were as follows.
2020 2019Beginning of year $ 8,293 $ 6,372Transfers in 10,729 3,984Acquired in acquisition 636 —Net (loss) gain on sales 835 (10)Proceeds from sales (6,363) (1,803)
14,130 8,543Additions to valuation reserve (2,397) (250)
Recorded investment $ 11,733 $ 8,293
F-30
Expenses related to other real estate owned for the years ended December 31, 2020, 2019 and 2018 were as follows.
2020 2019 2018Net loss (gain) on sales $ (835) $ 10 $ 75Gain on initial valuation of other real estate propertiesreceived — (191) (920)Provision for unrealized losses 2,397 250 265Operating expenses, net of rental income 748 638 509
$ 2,310 $ 707 $ (71)
The balance of other real estate owned includes $996 of foreclosed residential real estate properties recorded as a result of obtainingphysical possession of the property at December 31, 2020, and $741 at December 31, 2019. The recorded investment of consumermortgage loans secured by residential real estate properties for which formal foreclosure proceedings are in process was $1,334 atDecember 31, 2020, and $2,174 at December 31, 2019. Included in the other real estate owned balance at December 31, 2020, is$1,035 related to three closed bank locations transferred from premises and equipment.
NOTE 6 – PREMISES AND EQUIPMENT
Major classifications of premises and equipment, stated at cost, are as follows.
2020 2019Land $ 20,113 $ 17,018Buildings and improvements 71,923 68,575Furniture, fixtures and equipment 19,928 18,207
111,964 103,800Less: accumulated depreciation (22,552) (19,322)
Premises and equipment, net $ 89,412 $ 84,478
At December 31, 2020, the Company had lease liabilities totaling $3,524 and right-of-use assets totaling $3,540 related tooperating leases. At December 31, 2019, the Company had lease liabilities totaling $4,112 and right-of-use assets totaling $4,153related to operating leases. Lease liabilities and right-of-use assets are reflected in other liabilities and other assets.
Right-of-use asset and lease obligations by type of property are listed below.
December 31, 2020Right-of-Use
AssetLease
Liability
WeightedAverage
Lease Termin Years
WeightedAverageDiscountRate
Operating leasesLand and building leases $ 3,540 $ 3,524 16.9 2.99%Total operating leases $ 3,540 $ 3,524 16.9 2.99%
December 31, 2019Right-of-Use
AssetLease
Liability
WeightedAverage
Lease Termin Years
WeightedAverageDiscountRate
Operating leasesLand and building leases $ 4,153 $ 4,112 16.0 2.95%Total operating leases $ 4,153 $ 4,112 16.0 2.95%
Operating lease costs are listed below.2020 2019
Operating lease cost $ 728 $ 726Short-term lease cost — —Variable lease cost 34 49Total operating lease cost $ 762 $ 775
F-31
There were no sales and leaseback transactions, leverage leases, lease transactions with related parties or leases that had not yetcommenced during the periods ended December 31, 2020 or 2019.
A maturity analysis of operating lease liabilities and reconciliation of the undiscounted cash flows to the total operating leaseliability as of December 31, 2020, is listed below.
Lease paymentsDue in one year or less $ 461Due after one year through two years 504Due after two years through three years 388Due after three years through four years 214Due after four years through five years 218Thereafter 2,829Total undiscounted cash flows 4,614
Discount on cash flows (1,090)Total $ 3,524
NOTE 7 – GOODWILL AND CORE DEPOSIT INTANGIBLES
The assets and liabilities acquired in business combinations are recorded at their estimated fair values at the acquisitiondate. The excess of the purchase price over the estimated fair value of the net assets for tax free acquisitions is recorded as goodwill,none of which is deductible for tax purposes. The excess of the purchase price over the estimated fair value of the net assets fortaxable acquisitions is recorded as goodwill and is deductible for tax purposes.
The Company performed an interim quantitative analysis to assess goodwill for impairment of Equity Bancshares, Inc., the solereporting unit. Consideration was given to the ongoing economic market disruption, the movement of the Company’s stock price inrelation to other bank indexes and the length of time that the market value of the reporting unit was below its book value as triggeringevents and completed a quantitative analysis to assess whether or not goodwill was impaired. This analysis determined that goodwillwas impaired, and the Company subsequently booked a $104,831 non-cash impairment charge to goodwill on September 30, 2020.
The determination of the September 30, 2020 fair value of the reporting unit incorporated assumptions that marketplaceparticipants would use in their estimates of fair value in a change in control transaction, as prescribed by ASC Topic 820. To arrive ata conclusion of fair value, management utilized both the income approach and the market approach and then applied weighting factorsto each approach. Weighting factors represent managements best business judgement of the weightings a market participant wouldutilize in arriving at fair value of the reporting unit. In performing the analysis, Company management made numerous assumptionswith respect to industry performance, reporting unit business performance, economic and market conditions and various other matters,many of which require significant management judgement. Projections related to business unit performance over the next five yearsassumed an economic downturn over a 12-month time horizon subsequently returning to conservative positive growth rates in loanand deposits after that time period. The analysis performed and the assumptions that were incorporated into the analysis reflect thebest currently available estimates and judgements as to the expected future financial performance of the reporting unit at September30, 2020.
As of December 31, 2020, management conducted a qualitative evaluation of current economic and COVID-19 conditions,Company performance, stock price and other pertinent factors, finally concluding that no additional goodwill impairment is warrantedat this time. At December 31, 2020, the Company had goodwill of $31,601 which could be at risk of further impairment with furtherdeclines in performance, stock price or market conditions for bank stocks.
The carrying basis of goodwill and core deposit intangibles as of and for the years ended December 31, 2020 and 2019, were asfollows.
Goodwill Core DepositBalance as of January 1, 2019 $ 131,712 $ 21,725Acquired in acquisition 4,720 1,350Amortization — (3,168)Balance as of December 31, 2019 136,432 19,907Impairment (104,831) —Amortization — (3,850)Balance as of December 31, 2020 $ 31,601 $ 16,057
F-32
Estimated core deposit intangibles amortization expense for each of the following five years and thereafter is listed in thefollowing table.
Expensed in one year or less $ 4,116Expensed after one year through two years 3,417Expensed after two years through three years 2,627Expensed after three years through four years 2,188Expensed after four years through five years 1,647Thereafter 2,062
Total $ 16,057
NOTE 8 – QUALIFIED AFFORDABLE HOUSING PROJECT INVESTMENTS
The Company invests in qualified affordable housing projects. At December 31, 2020, 2019 and 2018, the balances of theinvestments in qualified affordable housing projects were $7,799, $8,663 and $6,689. These balances are reflected in the other assetsline in the consolidated balance sheets. Total unfunded commitments related to the investments in qualified affordable housingprojects totaled $5,189, $5,836 and $3,965 at December 31, 2020, 2019 and 2018. The Company expects to fulfill these commitmentsduring the years 2021 through 2034.
During the years ended December 31, 2020, 2019 and 2018, the Company recognized amortization expense of $860, $522 and$412, which was included within pretax income on the consolidated statements of income. Additionally, during the years endedDecember 31, 2020, 2019 and 2018, the Company recognized tax credits from its investment in affordable housing tax credits of $600,$636 and $568.
NOTE 9 – DERIVATIVE FINANCIAL INSTRUMENTS
Interest Rate Swaps Designated as Fair Value Hedges
The Company periodically enters into interest rate swaps to hedge the fair value of certain commercial real estate loans. Thesetransactions are designated as fair value hedges. In this type of transaction, the Company typically receives from the counterparty avariable-rate cash flow based on the one-month London Interbank Offered Rate (LIBOR) plus a spread to this index and pays a fixed-rate cash flow equal to the customer loan rate. At December 31, 2020, the portfolio of interest rate swaps had a weighted averagematurity of 6.3 years, a weighted average pay rate of 5.19% and a weighted average rate received of 3.21%. At December 31, 2019,the portfolio of interest rate swaps had a weighted average maturity of 7.3 years, a weighted average pay rate of 5.19% and a weightedaverage rate received of 4.78%.
Stand-Alone Derivatives
The Company periodically enters into interest rate swaps with our borrowers and simultaneously enters into swaps with acounterparty with offsetting terms for the purpose of providing our borrowers long-term fixed rate loans. Neither swap is designatedas a hedge and both are marked to market through earnings. At December 31, 2020, this portfolio of interest rate swaps had aweighted average maturity of 7.9 years, weighed average pay rate of 7.33% and a weighted rate received of 7.33%. At December 31,2019, this portfolio of interest rate swaps had a weighted average maturity of 8.8 years, weighted average pay rate of 4.92% and aweighted rate received of 4.92%.
Reconciliation of Derivative Fair Values and Gains/(Losses)
The notional amount of a derivative contract is a factor in determining periodic interest payments or cash flows received or paid.The notional amount of derivatives serves as a level of involvement in various types of derivatives. The notional amount does notrepresent the Company’s overall exposure to credit or market risk, generally, the exposure is significantly smaller.

F-33
The following table shows the notional balances and fair values (including net accrued interest) of the derivatives outstanding byderivative type at December 31, 2020 and December 31, 2019.
December 31, 2020 December 31, 2019NotionalAmount
DerivativeAssets
DerivativeLiabilities
NotionalAmount
DerivativeAssets
DerivativeLiabilities
Derivatives designated as hedging instruments:Interest rate swaps $ 5,585 $ — $ 497 $ 5,797 $ 30 $ 177
Total derivatives designated as hedging relationships 5,585 — 497 5,797 30 177Derivatives not designated as hedging instruments:
Interest rate swaps 119,341 7,172 7,820 114,571 3,505 3,899Total derivatives not designated as hedginginstruments 119,341 7,172 7,820 114,571 3,505 3,899
Total $ 124,926 7,172 8,317 $ 120,368 3,535 4,076Cash collateral — (8,440) — (4,186)Netting adjustments 123 123 182 182Net amount presented in balance sheet $ 7,295 $ — $ 3,717 $ 72
The following table shows net gains or losses on derivatives and hedging activities for the years ended December 31, 2020,2019 and 2018.
2020 2019 2018Derivatives designated as hedging instruments:
Interest rate swaps $ — $ — $ —Total net gain (loss) related to fair value hedgeineffectiveness — — —
Derivatives not designated as hedging instruments:Economic hedges:
Interest rate swaps 254 307 202Total net gains (losses) related to derivatives not designatedas hedging instruments 254 307 202
Net gains (losses) on derivatives and hedging activities $ 254 $ 307 $ 202
F-34
The following table shows the recorded net gains or losses on derivatives and the related hedged items in fair value hedgingrelationships and the impact of those derivatives on the Company’s net interest income for the years ended December 31, 2020, 2019and 2018.
December 31, 2020
Gain/(Loss)on
Derivatives
Gain/(Loss)on HedgedItems
Net Fair ValueHedge
Gain/(Loss)
Effect ofDerivatives onNet InterestIncome
Commercial real estate loans $ 367 $ (367) $ — $ (90)Total $ 367 $ (367) $ — $ (90)
December 31, 2019
Gain/(Loss)on
Derivatives
Gain/(Loss)on HedgedItems
Net Fair ValueHedge
Gain/(Loss)
Effect ofDerivatives onNet InterestIncome
Commercial real estate loans $ (387) $ 387 $ — $ 21Total $ (387) $ 387 $ — $ 21
December 31, 2018
Gain/(Loss)on
Derivatives
Gain/(Loss)on HedgedItems
Net Fair ValueHedge
Ineffectiveness
Effect ofDerivatives onNet InterestIncome
Commercial real estate loans $ 283 $ (283) $ — $ (40)Total $ 283 $ (283) $ — $ (40)
NOTE 10 – DEPOSITS
Time deposits that met or exceeded the FDIC insurance limit of $250 totaled $171,833 and $285,958 as of December 31, 2020and 2019.
At December 31, 2020 and 2019, Certificate of Deposit Account Registry Services (“CDARS”) deposits of $14,857 and $9,503were included in the Company’s time deposit balance. Of the CDARS deposits at December 31, 2020 and 2019, $14,857 and $9,503were reciprocal customer funds placed in the CDARS program. CDARS allows Equity Bank to break large deposits into smalleramounts and place them in a network of other CDARS banks to ensure that FDIC insurance coverage is gained on the entire deposit.Reciprocal deposits are not considered brokered deposits as long as the aggregate balance is less than the lesser of 20% of totalliabilities or $5 billion and Equity Bank is well capitalized and well rated. All non-reciprocal deposits and reciprocal deposits inexcess of regulatory limits are considered brokered deposits.
At December 31, 2020, the scheduled maturities of time deposits are as follows.
Due in one year or less $ 456,542Due after one year through two years 126,871Due after two years through three years 22,709Due after three years through four years 10,984Due after four years through five years 9,139Thereafter 609
Total $ 626,854
NOTE 11 – BORROWINGS
Federal funds purchased and retail repurchase agreements
Federal funds purchased and retail repurchase agreements included the following at December 31, 2020 and 2019.
2020 2019Federal funds purchased $ — $ —Retail repurchase agreements $ 36,029 $ 35,708
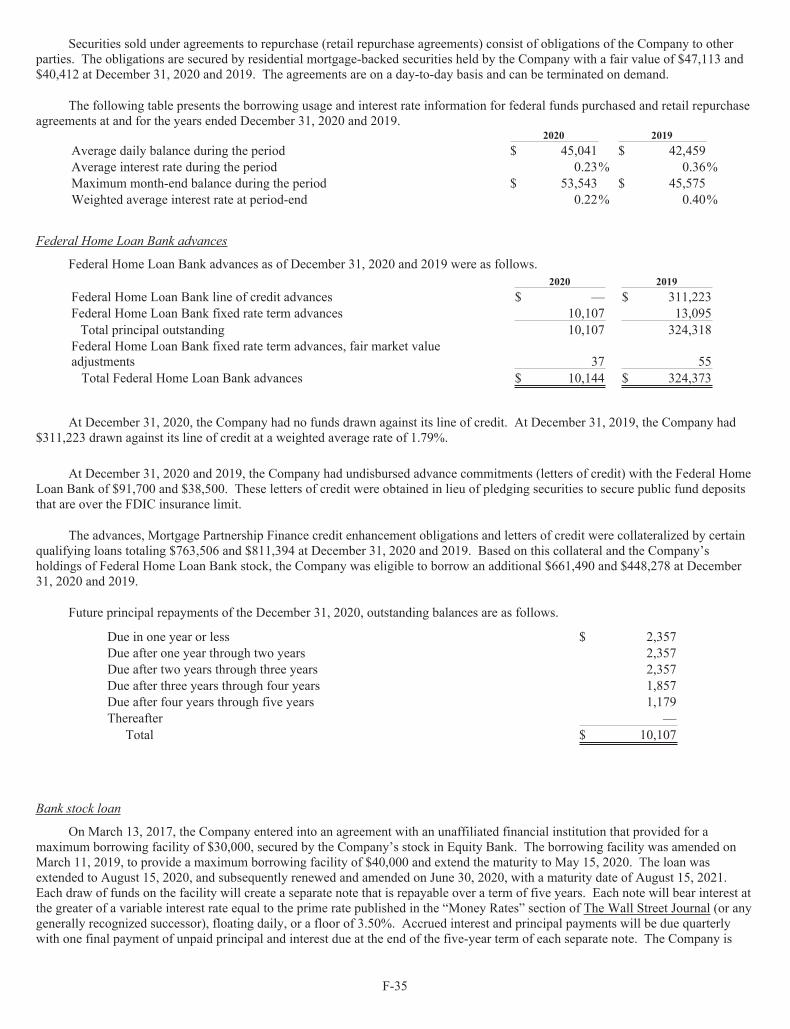
F-35
Securities sold under agreements to repurchase (retail repurchase agreements) consist of obligations of the Company to otherparties. The obligations are secured by residential mortgage-backed securities held by the Company with a fair value of $47,113 and$40,412 at December 31, 2020 and 2019. The agreements are on a day-to-day basis and can be terminated on demand.
The following table presents the borrowing usage and interest rate information for federal funds purchased and retail repurchaseagreements at and for the years ended December 31, 2020 and 2019.
2020 2019Average daily balance during the period $ 45,041 $ 42,459Average interest rate during the period 0.23% 0.36%Maximum month-end balance during the period $ 53,543 $ 45,575Weighted average interest rate at period-end 0.22% 0.40%
Federal Home Loan Bank advances
Federal Home Loan Bank advances as of December 31, 2020 and 2019 were as follows.2020 2019
Federal Home Loan Bank line of credit advances $ — $ 311,223Federal Home Loan Bank fixed rate term advances 10,107 13,095Total principal outstanding 10,107 324,318
Federal Home Loan Bank fixed rate term advances, fair market valueadjustments 37 55Total Federal Home Loan Bank advances $ 10,144 $ 324,373
At December 31, 2020, the Company had no funds drawn against its line of credit. At December 31, 2019, the Company had$311,223 drawn against its line of credit at a weighted average rate of 1.79%.
At December 31, 2020 and 2019, the Company had undisbursed advance commitments (letters of credit) with the Federal HomeLoan Bank of $91,700 and $38,500. These letters of credit were obtained in lieu of pledging securities to secure public fund depositsthat are over the FDIC insurance limit.
The advances, Mortgage Partnership Finance credit enhancement obligations and letters of credit were collateralized by certainqualifying loans totaling $763,506 and $811,394 at December 31, 2020 and 2019. Based on this collateral and the Company’sholdings of Federal Home Loan Bank stock, the Company was eligible to borrow an additional $661,490 and $448,278 at December31, 2020 and 2019.
Future principal repayments of the December 31, 2020, outstanding balances are as follows.
Due in one year or less $ 2,357Due after one year through two years 2,357Due after two years through three years 2,357Due after three years through four years 1,857Due after four years through five years 1,179Thereafter —
Total $ 10,107
Bank stock loan
On March 13, 2017, the Company entered into an agreement with an unaffiliated financial institution that provided for amaximum borrowing facility of $30,000, secured by the Company’s stock in Equity Bank. The borrowing facility was amended onMarch 11, 2019, to provide a maximum borrowing facility of $40,000 and extend the maturity to May 15, 2020. The loan wasextended to August 15, 2020, and subsequently renewed and amended on June 30, 2020, with a maturity date of August 15, 2021.Each draw of funds on the facility will create a separate note that is repayable over a term of five years. Each note will bear interest atthe greater of a variable interest rate equal to the prime rate published in the “Money Rates” section of The Wall Street Journal (or anygenerally recognized successor), floating daily, or a floor of 3.50%. Accrued interest and principal payments will be due quarterlywith one final payment of unpaid principal and interest due at the end of the five-year term of each separate note. The Company is
F-36
also required to pay an unused commitment fee in an amount equal to 20 basis points per annum on the unused portion of themaximum borrowing facility.
There were no bank stock loan advances as of December 31, 2020. Bank stock loan advances as of December 31, 2019, were asfollows.
December 31, 2019OutstandingBalance
Weighted AverageRate
Bank stock loan $ 8,990 4.75%
The terms of the borrowing facility require the Company and Equity Bank to maintain minimum capital ratios and othercovenants. For the twelve months ended December 31, 2020, the lender has granted the Company a waiver with reference to thereturn on assets ratio covenant contained within our loan contract. The Company was in compliance with all other terms of theborrowing facility.
NOTE 12 – SUBORDINATED DEBT
The following table lists outstanding subordinated debt as of December 31, 2020 and 2019.2020 2019
Subordinated debentures $ 14,872 $ 14,561Subordinated notes 72,812 —
Total $ 87,684 $ 14,561
Subordinated debentures
In conjunction with the 2012 acquisition of First Community Bancshares, Inc. (FCB), the Company assumed certainsubordinated debentures owed to special purpose unconsolidated subsidiaries that are controlled by the Company, FCB Capital TrustII and FCB Capital Trust III, (“CTII” and “CTIII”, respectively).
On March 24, 2005, CTII, an unconsolidated subsidiary of the Company, issued $10,000 of variable rate trust preferredsecurities, all of which are outstanding at December 31, 2020 and 2019. The trust preferred securities issued by CTII accrue and paydistributions quarterly at three-month LIBOR plus 2.00% (2.24% at December 31, 2020, and 3.99% at December 31, 2019) on thestated liquidation amount of the trust preferred securities. As an integral part of the acquisition of FCB, the Company has guaranteedfully and unconditionally all of the obligations of CTII. The guaranty covers the quarterly distributions and payments on liquidationor redemption of the trust preferred securities. These trust preferred securities are mandatorily redeemable upon maturity on April 15,2035, or upon earlier redemption. The Company has the right to redeem the trust preferred securities in whole or in part, on or afterApril 15, 2015, at a redemption price specified in the indenture plus any accrued but unpaid interest to the redemption date. Theproceeds from the sale of the trust preferred securities and the issuance of $310 in common securities to FCB were used by CTII topurchase $10,310 of floating rate subordinated debentures of FCB which have the same payment terms as the trust preferredsecurities.
On March 30, 2007, CTIII, an unconsolidated subsidiary of the Company, issued $5,000 of variable rate trust preferredsecurities, all of which are outstanding at December 31, 2020 and 2019. The trust preferred securities issued by CTIII accrue and paydistributions quarterly at three-month LIBOR plus 1.89% (2.11% at December 31, 2020, and 3.78% at December 31, 2018) on thestated liquidation amount of the trust preferred securities. As an integral part of the acquisition of FCB, the Company has guaranteedfully and unconditionally all of the obligations of CTIII. The guaranty covers the quarterly distributions and payments on liquidationor redemption of the trust preferred securities. These trust preferred securities are mandatorily redeemable upon maturity on June 15,2037, or upon earlier redemption. The Company has the right to redeem the trust preferred securities in whole or in part at aredemption price specified in the indenture plus any accrued but unpaid interest to the redemption date. The proceeds from the sale ofthe trust preferred securities and the issuance of $155 in common securities to FCB were used by CTIII to purchase $5,155 of floatingrate subordinated debentures of FCB which have the same payment terms as the trust preferred securities.
In conjunction with the 2016 acquisition of Community First Bancshares, Inc. (CFBI), the Company assumed certainsubordinated debentures owed to a special purpose unconsolidated subsidiary, Community First (AR) Statutory Trust I, (“CFSTI”).The trust preferred securities issued by CFSTI accrue and pay distributions quarterly at three-month LIBOR plus 3.25% (3.50% atDecember 31, 2020, and 5.20% at December 31, 2019) on the stated liquidation amount of the trust preferred securities. These trustpreferred securities are mandatorily redeemable upon maturity on December 26, 2032, or upon earlier redemption.
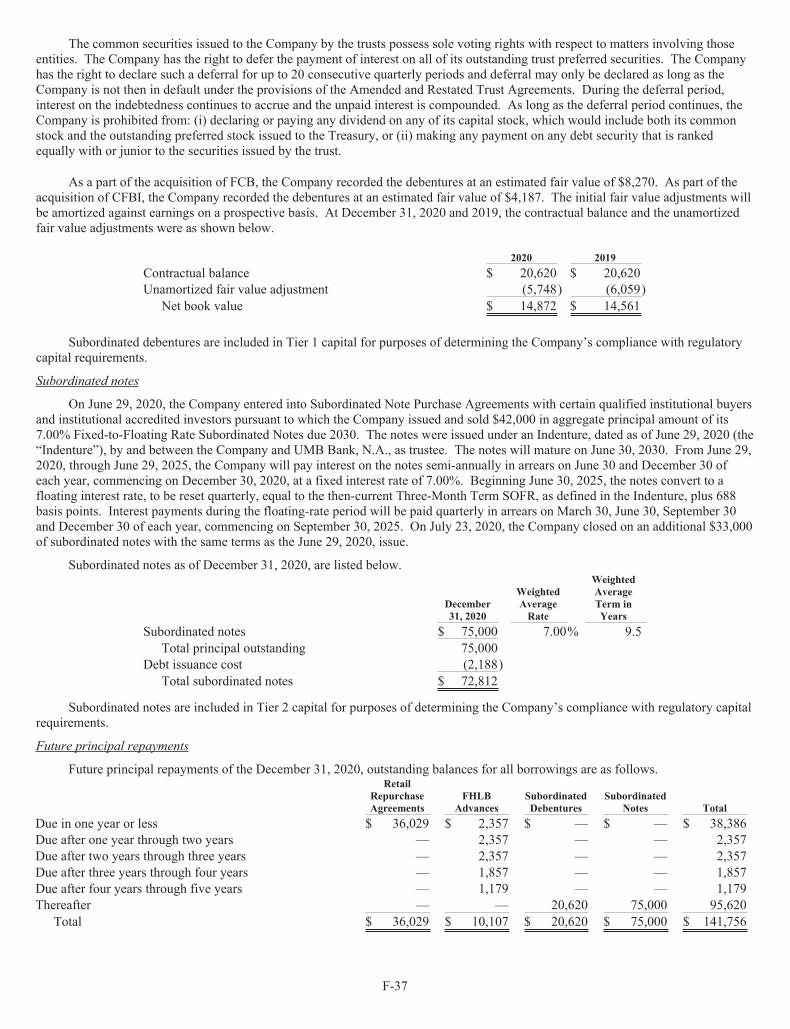
F-37
The common securities issued to the Company by the trusts possess sole voting rights with respect to matters involving thoseentities. The Company has the right to defer the payment of interest on all of its outstanding trust preferred securities. The Companyhas the right to declare such a deferral for up to 20 consecutive quarterly periods and deferral may only be declared as long as theCompany is not then in default under the provisions of the Amended and Restated Trust Agreements. During the deferral period,interest on the indebtedness continues to accrue and the unpaid interest is compounded. As long as the deferral period continues, theCompany is prohibited from: (i) declaring or paying any dividend on any of its capital stock, which would include both its commonstock and the outstanding preferred stock issued to the Treasury, or (ii) making any payment on any debt security that is rankedequally with or junior to the securities issued by the trust.
As a part of the acquisition of FCB, the Company recorded the debentures at an estimated fair value of $8,270. As part of theacquisition of CFBI, the Company recorded the debentures at an estimated fair value of $4,187. The initial fair value adjustments willbe amortized against earnings on a prospective basis. At December 31, 2020 and 2019, the contractual balance and the unamortizedfair value adjustments were as shown below.
2020 2019Contractual balance $ 20,620 $ 20,620Unamortized fair value adjustment (5,748) (6,059)
Net book value $ 14,872 $ 14,561
Subordinated debentures are included in Tier 1 capital for purposes of determining the Company’s compliance with regulatorycapital requirements.
Subordinated notes
On June 29, 2020, the Company entered into Subordinated Note Purchase Agreements with certain qualified institutional buyersand institutional accredited investors pursuant to which the Company issued and sold $42,000 in aggregate principal amount of its7.00% Fixed-to-Floating Rate Subordinated Notes due 2030. The notes were issued under an Indenture, dated as of June 29, 2020 (the“Indenture”), by and between the Company and UMB Bank, N.A., as trustee. The notes will mature on June 30, 2030. From June 29,2020, through June 29, 2025, the Company will pay interest on the notes semi-annually in arrears on June 30 and December 30 ofeach year, commencing on December 30, 2020, at a fixed interest rate of 7.00%. Beginning June 30, 2025, the notes convert to afloating interest rate, to be reset quarterly, equal to the then-current Three-Month Term SOFR, as defined in the Indenture, plus 688basis points. Interest payments during the floating-rate period will be paid quarterly in arrears on March 30, June 30, September 30and December 30 of each year, commencing on September 30, 2025. On July 23, 2020, the Company closed on an additional $33,000of subordinated notes with the same terms as the June 29, 2020, issue.
Subordinated notes as of December 31, 2020, are listed below.
December31, 2020
WeightedAverageRate
WeightedAverageTerm inYears
Subordinated notes $ 75,000 7.00% 9.5Total principal outstanding 75,000
Debt issuance cost (2,188)Total subordinated notes $ 72,812
Subordinated notes are included in Tier 2 capital for purposes of determining the Company’s compliance with regulatory capitalrequirements.
Future principal repayments
Future principal repayments of the December 31, 2020, outstanding balances for all borrowings are as follows.Retail
RepurchaseAgreements
FHLBAdvances
SubordinatedDebentures
SubordinatedNotes Total
Due in one year or less $ 36,029 $ 2,357 $ — $ — $ 38,386Due after one year through two years — 2,357 — — 2,357Due after two years through three years — 2,357 — — 2,357Due after three years through four years — 1,857 — — 1,857Due after four years through five years — 1,179 — — 1,179Thereafter — — 20,620 75,000 95,620
Total $ 36,029 $ 10,107 $ 20,620 $ 75,000 $ 141,756
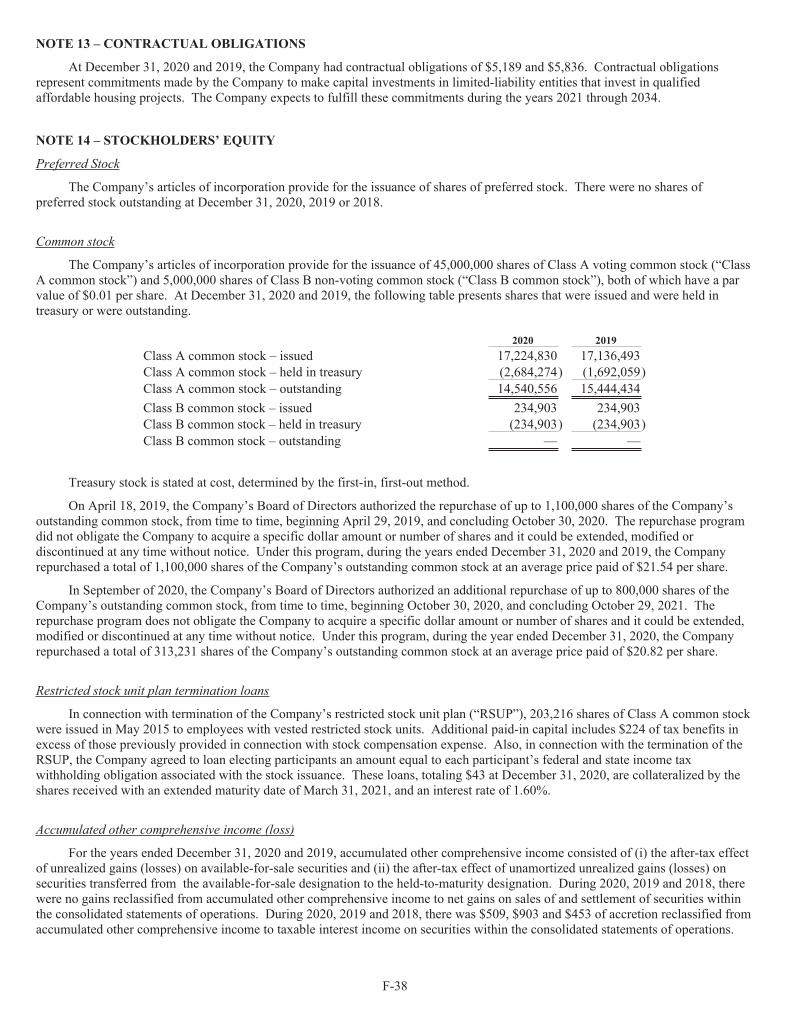
F-38
NOTE 13 – CONTRACTUAL OBLIGATIONS
At December 31, 2020 and 2019, the Company had contractual obligations of $5,189 and $5,836. Contractual obligationsrepresent commitments made by the Company to make capital investments in limited-liability entities that invest in qualifiedaffordable housing projects. The Company expects to fulfill these commitments during the years 2021 through 2034.
NOTE 14 – STOCKHOLDERS’ EQUITY
Preferred Stock
The Company’s articles of incorporation provide for the issuance of shares of preferred stock. There were no shares ofpreferred stock outstanding at December 31, 2020, 2019 or 2018.
Common stock
The Company’s articles of incorporation provide for the issuance of 45,000,000 shares of Class A voting common stock (“ClassA common stock”) and 5,000,000 shares of Class B non-voting common stock (“Class B common stock”), both of which have a parvalue of $0.01 per share. At December 31, 2020 and 2019, the following table presents shares that were issued and were held intreasury or were outstanding.
2020 2019Class A common stock – issued 17,224,830 17,136,493Class A common stock – held in treasury (2,684,274) (1,692,059)Class A common stock – outstanding 14,540,556 15,444,434Class B common stock – issued 234,903 234,903Class B common stock – held in treasury (234,903) (234,903)Class B common stock – outstanding — —
Treasury stock is stated at cost, determined by the first-in, first-out method.
On April 18, 2019, the Company’s Board of Directors authorized the repurchase of up to 1,100,000 shares of the Company’soutstanding common stock, from time to time, beginning April 29, 2019, and concluding October 30, 2020. The repurchase programdid not obligate the Company to acquire a specific dollar amount or number of shares and it could be extended, modified ordiscontinued at any time without notice. Under this program, during the years ended December 31, 2020 and 2019, the Companyrepurchased a total of 1,100,000 shares of the Company’s outstanding common stock at an average price paid of $21.54 per share.
In September of 2020, the Company’s Board of Directors authorized an additional repurchase of up to 800,000 shares of theCompany’s outstanding common stock, from time to time, beginning October 30, 2020, and concluding October 29, 2021. Therepurchase program does not obligate the Company to acquire a specific dollar amount or number of shares and it could be extended,modified or discontinued at any time without notice. Under this program, during the year ended December 31, 2020, the Companyrepurchased a total of 313,231 shares of the Company’s outstanding common stock at an average price paid of $20.82 per share.
Restricted stock unit plan termination loans
In connection with termination of the Company’s restricted stock unit plan (“RSUP”), 203,216 shares of Class A common stockwere issued in May 2015 to employees with vested restricted stock units. Additional paid-in capital includes $224 of tax benefits inexcess of those previously provided in connection with stock compensation expense. Also, in connection with the termination of theRSUP, the Company agreed to loan electing participants an amount equal to each participant’s federal and state income taxwithholding obligation associated with the stock issuance. These loans, totaling $43 at December 31, 2020, are collateralized by theshares received with an extended maturity date of March 31, 2021, and an interest rate of 1.60%.
Accumulated other comprehensive income (loss)
For the years ended December 31, 2020 and 2019, accumulated other comprehensive income consisted of (i) the after-tax effectof unrealized gains (losses) on available-for-sale securities and (ii) the after-tax effect of unamortized unrealized gains (losses) onsecurities transferred from the available-for-sale designation to the held-to-maturity designation. During 2020, 2019 and 2018, therewere no gains reclassified from accumulated other comprehensive income to net gains on sales of and settlement of securities withinthe consolidated statements of operations. During 2020, 2019 and 2018, there was $509, $903 and $453 of accretion reclassified fromaccumulated other comprehensive income to taxable interest income on securities within the consolidated statements of operations.

F-39
Components of accumulated other comprehensive income as of December 31, 2020 and 2019 were as follows.
Available-for-SaleSecurities
Held-to-MaturitySecurities
AccumulatedOther
ComprehensiveIncome
December 31, 2020Net unrealized or unamortized gains (losses) $ 26,426 $ — $ 26,426Tax effect (6,645) — (6,645)
$ 19,781 $ — $ 19,781December 31, 2019Net unrealized or unamortized gains (losses) $ 985 $ (988) $ (3)Tax effect (248) 248 —
$ 737 $ (740) $ (3)
NOTE 15 – INCOME TAXES
Income tax expense is listed in the following table.
2020 2019 2018Current income tax expense
Federal $ 9,054 $ 4,066 $ 4,655State 2,435 1,649 2,212
Total current income tax expense 11,489 5,715 6,867Deferred income tax expense
Federal (8,770) 1,444 2,933State (2,319) 119 550
Total deferred income tax expense (11,089) 1,563 3,483Total income tax expense $ 400 $ 7,278 $ 10,350
A reconciliation of income tax expense at the U.S. federal statutory rate (21% in 2020, 2019 and 2018) to the Company’s actualincome tax expense is shown below.
2020 2019 2018Computed at the statutory rate $ (15,660) $ 6,900 $ 9,697Increase (decrease) resulting from:
State and local taxes, net of federal benefit 407 1,422 1,909Tax-exempt interest (766) (885) (844)Non-taxable life insurance income (408) (419) (462)Non-deductible expenses 183 353 264Share-based payments 77 18 (23)Federal tax credits (600) (636) (568)Non-deductible goodwill 17,584 — —Bargain purchase gain (450) — —Change in valuation allowance 164 396 655Other (131) 129 (278)
Income tax expense $ 400 $ 7,278 $ 10,350

F-40
Components of deferred tax assets and liabilities are shown in the table below.
2020 2019Deferred tax assets
Allowance for loan losses $ 8,376 $ 3,076Tax credit carryforwards 897 974Goodwill amortization 3,102 (1,871)Accrued compensation 2,159 2,209Net operating loss and attribute carryforwards 1,189 1,338Other real estate owned 708 481Acquired loans fair market value adjustments 1,897 2,717Other 1,342 1,152
Gross deferred tax assets 19,670 10,076Deferred tax liabilities
Assumed debt fair market value adjustments 1,389 1,464Depreciation 4,491 3,934Federal Home Loan Bank stock dividends 445 841Acquisition related basis adjustment 938 —Net unrealized or unamortized gains (losses) on securities 6,646 (1)Core deposit intangibles 2,757 3,616Other 377 564
Gross deferred tax liabilities 17,043 10,418Valuation allowance (1,479) (1,623)Net deferred tax asset (liability) $ 1,148 $ (1,965)
Deferred income tax balances reflect the effects of temporary differences between the carrying amounts of assets and liabilitiesand their tax basis and are stated at enacted tax rates expected to be in effect when taxes are actually paid or recovered. In 2019, theCompany recognized deferred tax liabilities of $21 for temporary differences associated with the MidFirst acquisition. Federal netoperating losses acquired through previous acquisitions were fully utilized at December 31, 2020. Acquired federal tax creditstotaling $897 at December 31, 2020, will expire between 2029 and 2034. The utilization of these tax credit carryforwards is notexpected to be limited by Internal Revenue Code (“IRC”) sections 382 and 383.
The Company and its subsidiaries are subject to U.S. federal income tax as well as state income taxes in Arkansas, Kansas,Missouri, Oklahoma and Iowa. Commercial banks are not allowed to file consolidated Kansas returns with non-bank consolidatedgroup members. The Company has unused state operating loss carryforwards of approximately $32,006 that expire between 2021 and2030 resulting from the separate Kansas corporate returns of Equity Bancshares, Inc. and SA Holdings, Inc. These operating losseshave a valuation allowance of $28,319 recorded against them. In connection with a 2015 acquisition, the Company acquired Kansasnet operating losses useable against Kansas bank income. At December 31, 2020, the Kansas net operating loss carryforward useableagainst Kansas bank income totaled $2,054 with expiration dates between 2021 and 2024. The utilization of this acquired Kansas netoperating loss carryforward is expected to be limited and a valuation allowance has been recorded against the portion which isexpected to expire unused. In establishing a valuation allowance, management considers whether it is more likely than not that someor all of the deferred tax assets will not be realized. Based on this analysis, certain deferred tax assets have a valuation allowancerecorded against them resulting in a zero carrying value. The Company is generally no longer subject to U.S. federal, state and localtax examinations for years before 2017. At December 31, 2020, there were no examinations in any jurisdiction.
NOTE 16 – REGULATORYMATTERS
Banks and bank holding companies are subject to regulatory capital requirements administered by federal bankingagencies. Capital adequacy guidelines and, additionally for banks, prompt corrective action regulations, involve quantitative measuresof assets, liabilities and certain off-balance-sheet items calculated under regulatory accounting practices. Capital amounts andclassifications are also subject to qualitative judgments by regulators. Failure to meet capital requirements can initiate regulatoryaction. The final rules implementing the Basel Committee on Banking Supervision’s capital guidelines for U.S. banks (Basel III rules)became effective for the Company on January 1, 2015, with full compliance with all of the requirements being phased in over a multi-year schedule, and fully phased in January 1, 2019. The Basel III rules also require banks to maintain a Common Equity Tier 1 capitalratio of 6.5%, a total Tier 1 capital ratio of 8%, a total capital ratio of 10% and a leverage ratio of 5% to be deemed “well capitalized”for purposes of certain rules and prompt corrective action requirements. The risk-based ratios include a “capital conservation buffer”of 2.5%. The new capital conservation buffer requirement was to be phased in beginning January 2016 at 0.625% of risk-weightedassets and increased by that amount each year until fully implemented January 2019. An institution is subject to limitations on certain

F-41
activities, including payment of dividends, share repurchases and discretionary bonuses to executive officers, if its capital level isbelow the buffer amount. Management believes as of December 31, 2020, the Company and Bank meet all capital adequacyrequirements to which they are subject.
Prompt corrective action regulations provide five classifications: well capitalized, adequately capitalized, undercapitalized,significantly undercapitalized and critically undercapitalized, although these terms are not used to represent overall financialcondition. If adequately capitalized, regulatory approval is required to accept brokered deposits. If undercapitalized, capitaldistributions are limited, as are asset growth and acquisitions and capital restoration plans are required.
As of December 31, 2020, the most recent notifications from the federal regulatory agencies categorized Equity Bank as wellcapitalized under the regulatory framework for prompt corrective action. To be categorized as well capitalized, Equity Bank mustmaintain minimum total risk-based, Tier 1 risk-based and Tier 1 leverage ratios as set forth in the table. There are no conditions orevents since that notification that management believes have changed Equity Bank’s category.
The Company’s and Equity Bank’s capital amounts and ratios at December 31, 2020 and 2019, are presented in the tablesbelow. Ratios provided for Equity Bancshares, Inc. represent the ratios of the Company on a consolidated basis.
Actual
Minimum Required forCapital AdequacyUnder Basel III
To Be WellCapitalized UnderPrompt Corrective
ProvisionsAmount Ratio Amount Ratio Amount Ratio
December 31, 2020Total capital to risk weighted assets
Equity Bancshares, Inc. $462,865 17.35% $280,072 10.50% $ N/A N/AEquity Bank 418,992 15.73% 279,646 10.50% 266,329 10.00%
Tier 1 capital to risk weighted assetsEquity Bancshares, Inc. 356,707 13.37% 226,725 8.50% N/A N/AEquity Bank 385,696 14.48% 226,380 8.50% 213,064 8.00%
Common equity Tier 1 capital to risk weightedassets
Equity Bancshares, Inc. 341,835 12.82% 186,714 7.00% N/A N/AEquity Bank 385,696 14.48% 186,431 7.00% 173,114 6.50%
Tier 1 leverage to average assetsEquity Bancshares, Inc. 356,707 9.30% 153,490 4.00% N/A N/AEquity Bank 385,696 10.07% 153,276 4.00% 191,595 5.00%
Actual
Minimum Required forCapital AdequacyUnder Basel III
To Be WellCapitalized UnderPrompt Corrective
ProvisionsAmount Ratio Amount Ratio Amount Ratio
December 31, 2019Total capital to risk weighted assets
Equity Bancshares, Inc. $352,853 12.59% $294,341 10.50% $ N/A N/AEquity Bank 348,951 12.47% 293,917 10.50% 279,921 10.00%
Tier 1 capital to risk weighted assetsEquity Bancshares, Inc. 340,621 12.15% 238,276 8.50% N/A N/AEquity Bank 336,719 12.03% 237,933 8.50% 223,937 8.00%
Common equity Tier 1 capital to risk weightedassets
Equity Bancshares, Inc. 326,060 11.63% 196,227 7.00% N/A N/AEquity Bank 336,719 12.03% 195,945 7.00% 181,949 6.50%
Tier 1 leverage to average assetsEquity Bancshares, Inc. 340,621 9.02% 151,072 4.00% N/A N/AEquity Bank 336,719 8.92% 150,943 4.00% 188,679 5.00%
Equity Bank is subject to certain restrictions on the amount of dividends that it may declare without prior regulatory approval.

F-42
NOTE 17 – RELATED PARTY TRANSACTIONS
At December 31, 2020 and 2019, the Company had loans outstanding to executive officers, directors, significant stockholdersand their affiliates (related parties) in the amount of $1,978 and $2,030. Changes during 2020 are listed below.
2020Balance at January 1, 2020 $ 2,030New loans/advances 1,363Repayments (1,415)Balance at December 31, 2020 $ 1,978
At December 31, 2020 and 2019, the Company had deposits from executive officers, directors, significant stockholders and theiraffiliates (related parties) in the amount of $6,108 and $6,894.
NOTE 18 – EMPLOYEE BENEFITS
The Company has a defined contribution profit sharing plan and a retirement savings 401(k) plan covering substantially allemployees. Employees may contribute up to $20 of their compensation. Contributions to the profit-sharing plan and 401(k) plan arediscretionary and are determined annually by the Board of Directors. Employer contributions charged to expense for 2020, 2019 and2018 were $1,023, $826 and $885.
As a result of the acquisition of First Independence, the Company assumed the obligations related to First Independence’sparticipation in the Pentegra Defined Benefit Plan for Financial Institutions, a tax-qualified defined benefit pension plan. ThePentegra Defined Benefit Plan is treated as a multi-employer plan for accounting purposes but operates as a multiple-employer planunder the Employee Retirement Income Security Act of 1974 (ERISA) and the Internal Revenue Code. As a result, certain multi-employer plan disclosures are not applicable to the Pentegra Defined Benefit Plan. Under the Pentegra Defined Benefit Plan,contributions made by a participating employer may be used to provide benefits to employees of other participating employersbecause assets contributed by an employer are not segregated in a separate account or restricted to provide benefits only to employeesof that employer. Also, in the event a participating employer is unable to meet its contribution requirements, the requiredcontributions for the other participating employers could increase proportionately.
The Pentegra Defined Benefit Plan covered substantially all officers and employees of First Independence who beganemployment prior to December 31, 2009, with 54 participants retaining benefits under the plan.
The Pentegra Defined Benefit Plan operates on a fiscal year from July 1 through June 30 and files one Form 5500 on behalf ofall employers who participate in the plan. The Employer Identification Number is 13-5645888 and the three-digit plan number is333. There are no collective bargaining agreements in place at the Company.
The Pentegra Defined Benefit Plan’s annual valuation process includes calculating the plan’s funded status and separatelycalculating the funded status of each participating employer. The funded status is defined as the market value of assets divided by thefunding target (100 percent of the present value of all benefit liabilities accrued at that date). As permitted by ERISA, the PentegraDefined Benefit Plan accepts contributions for the prior plan year up to eight and a half months after the asset valuation date. As aresult, the fair value of assets at the valuation date (July 1) will increase by any subsequent contributions designated for theimmediately preceding plan year ended June 30. The most recent Form 5500 available for the Pentegra Defined Benefit Plan is for theyear ended June 30, 2019.
The following table presents the net pension cost and funded status of the Company relating to the Pentegra Defined BenefitPlan since the date of acquisition (dollar amounts in thousands).
2020 2019Net pension cost charged to salaries and employeebenefits $ 158 $ 142Pentegra defined benefit plan funded status as ofJuly 1 108.20% 108.62%Plan's funded status as of July 1 90.55% 91.40%Contributions paid to the plan $ 144 $ 109
The Company’s contributions to the Pentegra Defined Benefit Plan were less than 5.00% of the total contributions to thePentegra Defined Benefit plan for the plan year ended June 30, 2019.

F-43
NOTE 19 – SHARE-BASED PAYMENTS
The Company’s Amended and Restated 2013 Stock Incentive Plan (the Plan) reserved 1,500,000 shares for the grant of non-qualified stock options, restricted stock units, restricted stock and unrestricted stock to its employees and directors. The Plan replacedthe 2006 Non-qualified Stock Option Plan (2006 Plan). Under the 2006 Plan, there were 150,000 and 150,000 fully vested andexercisable options outstanding at December 31, 2020 and 2019. No new grants of options may be made under the 2006 Plan. TheCompany believes that stock-based awards better align the interests of its employees with those of its stockholders. Under theCompany’s 2020 and 2019 director compensation policy, the directors receive a portion of their compensation in stock. For the yearsended December 31, 2020 and 2019, the Company recognized expense of $260 and $160 and issued 17,703 and 9,104 shares. Foryears prior to 2019, the directors could elect to receive all or a portion of their fees in cash, Company stock or non-qualified stockoptions. During the year ended December 31, 2018, the Company recognized director compensation expense of $53 and issued 1,375shares of Company stock pursuant to certain directors’ elections. At December 31, 2020, there were 497,501 shares available forequity awards under the Plan.
Stock Option Awards: Options granted to directors and employees under the Plan vest depending on the passage of time or theachievement of performance targets, depending on the terms of the underlying grant.
The following tables summarize stock option activity for the years ended December 31, 2020 and 2019.
December 31, 2020 Options
WeightedAverageExercisePrice
WeightedAverageRemainingContractual
Term(Years)
AggregateIntrinsicValue
Outstanding at beginning of year 785,758 $ 23.17 6 $ 6,896Exercised (1,150) 17.43 4 —Forfeited or expired (33,275) 29.66 6 —Outstanding at end of year 751,333 $ 22.89 5 $ 2,790Fully vested and expected to vest 751,333 $ 22.89 5 $ 2,790Exercisable at end of year 647,861 $ 21.22 4 $ 2,790
December 31, 2019 Options
WeightedAverageExercisePrice
WeightedAverageRemainingContractual
Term(Years)
AggregateIntrinsicValue
Outstanding at beginning of year 852,556 $ 23.57 7 $ 10,044Granted 61,019 32.43 10 —Exercised (20,402) 18.22 6 —Forfeited or expired (107,415) 32.56 9 —Outstanding at end of year 785,758 $ 23.17 6 $ 6,896Fully vested and expected to vest 785,758 $ 23.17 6 $ 6,896Exercisable at end of year 609,323 $ 20.45 5 $ 6,797
There were no stock options granted during the year ended December 31, 2020. The fair values of stock options granted duringthe years ended December 31, 2019 and 2018, were estimated to be $7.10 per share and $9.01 per share. The fair value of each optionaward is estimated on the date of grant using a closed form option valuation (Black-Scholes) model. Expected stock price volatility isbased on the historical volatility of the SNL Bank Index. The expected term of options granted is based on the SimplifiedMethod. The risk-free interest rate for the expected term of the option is based on the U.S. Treasury yield curve in effect at the time ofthe grant.
The fair values of options granted were determined using the following weighted-average assumptions as of grant dates.
2019 2018Risk free rate 2.52% 2.45%Market value of stock on grant date $ 32.43 $ 34.69Expected term (in years) 5.8 6.3Expected volatility 15.71% 19.71%Dividend rate —% —%
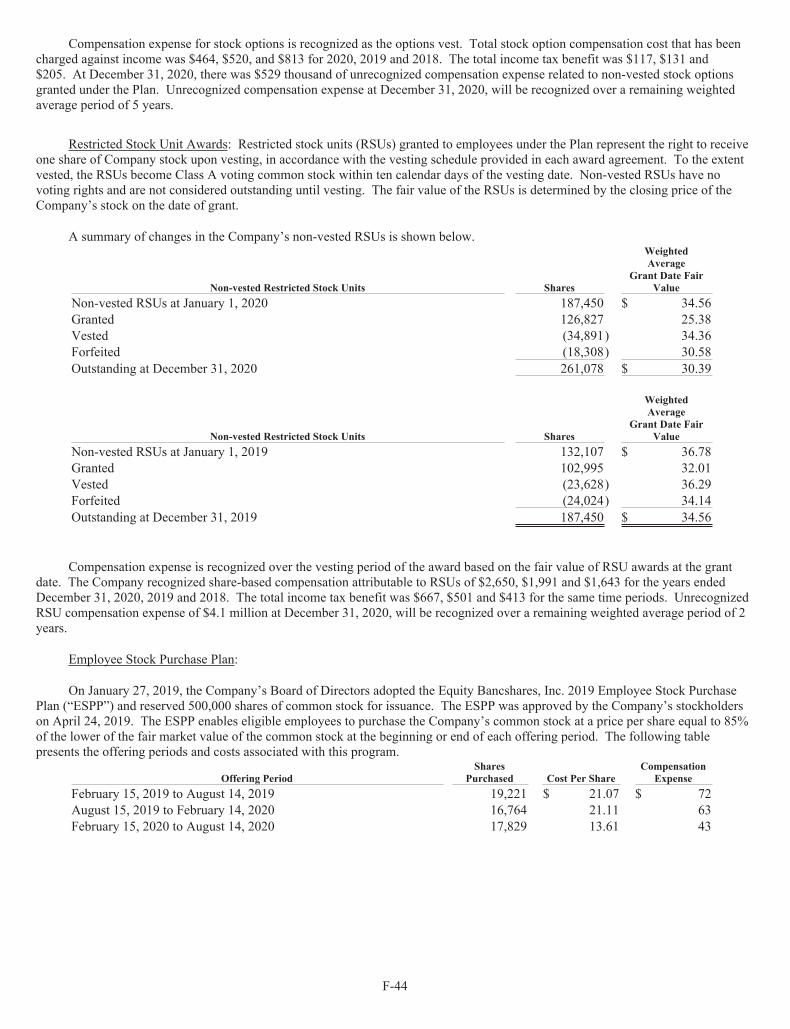
F-44
Compensation expense for stock options is recognized as the options vest. Total stock option compensation cost that has beencharged against income was $464, $520, and $813 for 2020, 2019 and 2018. The total income tax benefit was $117, $131 and$205. At December 31, 2020, there was $529 thousand of unrecognized compensation expense related to non-vested stock optionsgranted under the Plan. Unrecognized compensation expense at December 31, 2020, will be recognized over a remaining weightedaverage period of 5 years.
Restricted Stock Unit Awards: Restricted stock units (RSUs) granted to employees under the Plan represent the right to receiveone share of Company stock upon vesting, in accordance with the vesting schedule provided in each award agreement. To the extentvested, the RSUs become Class A voting common stock within ten calendar days of the vesting date. Non-vested RSUs have novoting rights and are not considered outstanding until vesting. The fair value of the RSUs is determined by the closing price of theCompany’s stock on the date of grant.
A summary of changes in the Company’s non-vested RSUs is shown below.
Non-vested Restricted Stock Units Shares
WeightedAverage
Grant Date FairValue
Non-vested RSUs at January 1, 2020 187,450 $ 34.56Granted 126,827 25.38Vested (34,891) 34.36Forfeited (18,308) 30.58Outstanding at December 31, 2020 261,078 $ 30.39
Non-vested Restricted Stock Units Shares
WeightedAverage
Grant Date FairValue
Non-vested RSUs at January 1, 2019 132,107 $ 36.78Granted 102,995 32.01Vested (23,628) 36.29Forfeited (24,024) 34.14Outstanding at December 31, 2019 187,450 $ 34.56
Compensation expense is recognized over the vesting period of the award based on the fair value of RSU awards at the grantdate. The Company recognized share-based compensation attributable to RSUs of $2,650, $1,991 and $1,643 for the years endedDecember 31, 2020, 2019 and 2018. The total income tax benefit was $667, $501 and $413 for the same time periods. UnrecognizedRSU compensation expense of $4.1 million at December 31, 2020, will be recognized over a remaining weighted average period of 2years.
Employee Stock Purchase Plan:
On January 27, 2019, the Company’s Board of Directors adopted the Equity Bancshares, Inc. 2019 Employee Stock PurchasePlan (“ESPP”) and reserved 500,000 shares of common stock for issuance. The ESPP was approved by the Company’s stockholderson April 24, 2019. The ESPP enables eligible employees to purchase the Company’s common stock at a price per share equal to 85%of the lower of the fair market value of the common stock at the beginning or end of each offering period. The following tablepresents the offering periods and costs associated with this program.
Offering PeriodShares
Purchased Cost Per ShareCompensation
ExpenseFebruary 15, 2019 to August 14, 2019 19,221 $ 21.07 $ 72August 15, 2019 to February 14, 2020 16,764 21.11 63February 15, 2020 to August 14, 2020 17,829 13.61 43

F-45
NOTE 20 – EARNINGS PER SHARE
Earnings per share were computed as shown below.
2020 2019 2018Basic:
Net income allocable to common stockholders $ (74,970) $ 25,579 $ 35,825Weighted average common shares outstanding 15,097,726 15,618,690 15,389,513Weighted average vested restricted stock units 786 1,201 4,403Weighted average shares 15,098,512 15,619,891 15,393,916
Basic earnings per common share $ (4.97) $ 1.64 $ 2.33Diluted:
Net income allocable to common stockholders $ (74,970) $ 25,579 $ 35,825Weighted average common shares outstanding for:
Basic earnings per common share 15,098,512 15,619,891 15,393,916Dilutive effects of the assumed exercise ofstock options — 201,409 293,588
Dilutive effects of the assumed redemption of RSUs — 21,839 20,882Average shares and dilutive potential common shares 15,098,512 15,843,139 15,708,386
Diluted earnings per common share $ (4.97) $ 1.61 $ 2.28
Dilutive shares not included above due to the net loss in the period.2020 2019 2018
Dilutive effects of the assumed exercise ofstock options 98,943 — —
Dilutive effects of the assumed vesting ofrestricted stock units 37,677 — —
Dilutive effects of the assumed exercise of ESPPpurchases 3,367 — —
Total dilutive shares 139,987 — —
Average outstanding stock options and RSUs not included in the computation of diluted earnings (loss) because they wereantidilutive are shown below.
2020 2019 2018Stock options 309,951 308,933 26,419Restricted stock units 135,155 2,027 —
Total antidilutive shares 445,106 310,960 26,419
NOTE 21 – FAIR VALUE
The Company uses fair value measurements to record fair value adjustments to certain assets and liabilities and to disclose thefair value of its financial instruments. Fair value is the exchange price that would be received for an asset or paid to transfer a liability(exit price) in the principal or most advantageous market for the asset or liability in an orderly transaction between market participantson the measurement date. For disclosure purposes, the Company groups its financial and non-financial assets and liabilities into threedifferent levels based on the nature of the instrument and the availability and reliability of the information that is used to determinefair value. The three levels of inputs that may be used to measure fair values are defined as follows.
Level 1: Quoted prices (unadjusted) for identical assets or liabilities in active markets that the entity has the ability to access asof the measurement date.
Level 2: Significant other observable inputs other than Level 1 prices such as quoted prices for similar assets or liabilities;quoted prices in markets that are not active; or other inputs that are observable or can be corroborated by observable marketdata.
Level 3: Significant unobservable inputs that reflect a reporting entity’s own assumptions about the assumptions that marketparticipants would use in pricing an asset or liability.
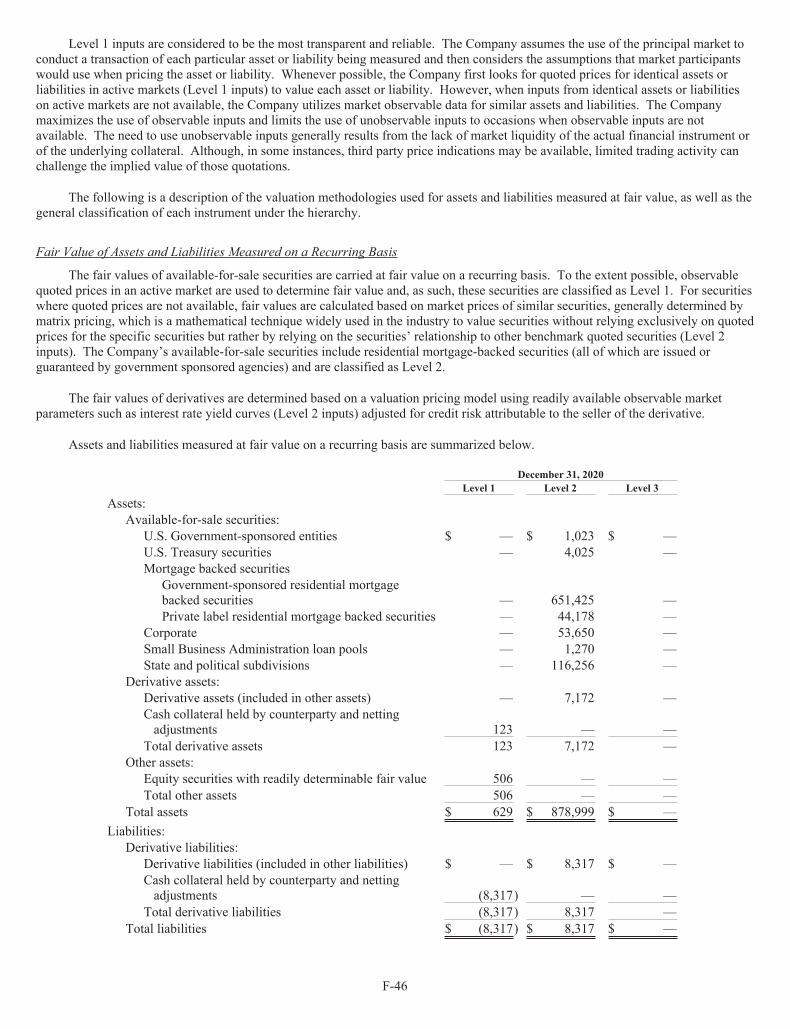
F-46
Level 1 inputs are considered to be the most transparent and reliable. The Company assumes the use of the principal market toconduct a transaction of each particular asset or liability being measured and then considers the assumptions that market participantswould use when pricing the asset or liability. Whenever possible, the Company first looks for quoted prices for identical assets orliabilities in active markets (Level 1 inputs) to value each asset or liability. However, when inputs from identical assets or liabilitieson active markets are not available, the Company utilizes market observable data for similar assets and liabilities. The Companymaximizes the use of observable inputs and limits the use of unobservable inputs to occasions when observable inputs are notavailable. The need to use unobservable inputs generally results from the lack of market liquidity of the actual financial instrument orof the underlying collateral. Although, in some instances, third party price indications may be available, limited trading activity canchallenge the implied value of those quotations.
The following is a description of the valuation methodologies used for assets and liabilities measured at fair value, as well as thegeneral classification of each instrument under the hierarchy.
Fair Value of Assets and Liabilities Measured on a Recurring Basis
The fair values of available-for-sale securities are carried at fair value on a recurring basis. To the extent possible, observablequoted prices in an active market are used to determine fair value and, as such, these securities are classified as Level 1. For securitieswhere quoted prices are not available, fair values are calculated based on market prices of similar securities, generally determined bymatrix pricing, which is a mathematical technique widely used in the industry to value securities without relying exclusively on quotedprices for the specific securities but rather by relying on the securities’ relationship to other benchmark quoted securities (Level 2inputs). The Company’s available-for-sale securities include residential mortgage-backed securities (all of which are issued orguaranteed by government sponsored agencies) and are classified as Level 2.
The fair values of derivatives are determined based on a valuation pricing model using readily available observable marketparameters such as interest rate yield curves (Level 2 inputs) adjusted for credit risk attributable to the seller of the derivative.
Assets and liabilities measured at fair value on a recurring basis are summarized below.
December 31, 2020Level 1 Level 2 Level 3
Assets:Available-for-sale securities:
U.S. Government-sponsored entities $ — $ 1,023 $ —U.S. Treasury securities — 4,025 —Mortgage backed securities
Government-sponsored residential mortgagebacked securities — 651,425 —Private label residential mortgage backed securities — 44,178 —
Corporate — 53,650 —Small Business Administration loan pools — 1,270 —State and political subdivisions — 116,256 —
Derivative assets:Derivative assets (included in other assets) — 7,172 —Cash collateral held by counterparty and nettingadjustments 123 — —
Total derivative assets 123 7,172 —Other assets:
Equity securities with readily determinable fair value 506 — —Total other assets 506 — —
Total assets $ 629 $ 878,999 $ —Liabilities:
Derivative liabilities:Derivative liabilities (included in other liabilities) $ — $ 8,317 $ —Cash collateral held by counterparty and nettingadjustments (8,317) — —
Total derivative liabilities (8,317) 8,317 —Total liabilities $ (8,317) $ 8,317 $ —
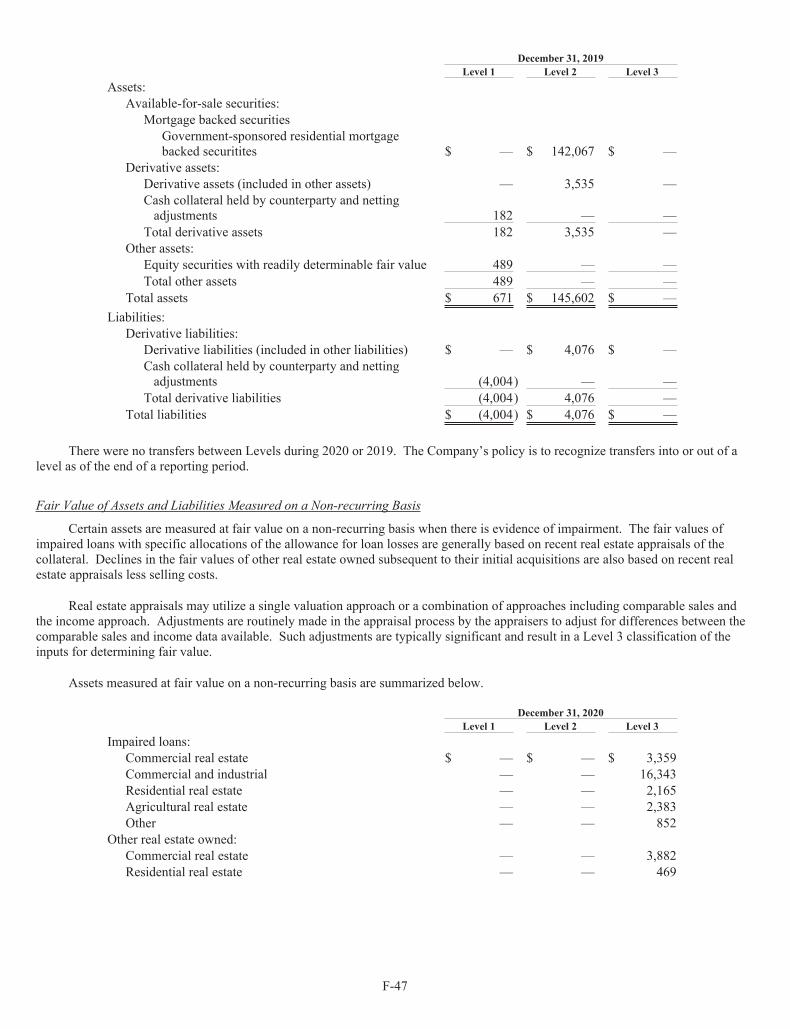
F-47
December 31, 2019Level 1 Level 2 Level 3
Assets:Available-for-sale securities:
Mortgage backed securitiesGovernment-sponsored residential mortgagebacked securitites $ — $ 142,067 $ —
Derivative assets:Derivative assets (included in other assets) — 3,535 —Cash collateral held by counterparty and nettingadjustments 182 — —
Total derivative assets 182 3,535 —Other assets:
Equity securities with readily determinable fair value 489 — —Total other assets 489 — —
Total assets $ 671 $ 145,602 $ —Liabilities:
Derivative liabilities:Derivative liabilities (included in other liabilities) $ — $ 4,076 $ —Cash collateral held by counterparty and nettingadjustments (4,004) — —
Total derivative liabilities (4,004) 4,076 —Total liabilities $ (4,004) $ 4,076 $ —
There were no transfers between Levels during 2020 or 2019. The Company’s policy is to recognize transfers into or out of alevel as of the end of a reporting period.
Fair Value of Assets and Liabilities Measured on a Non-recurring Basis
Certain assets are measured at fair value on a non-recurring basis when there is evidence of impairment. The fair values ofimpaired loans with specific allocations of the allowance for loan losses are generally based on recent real estate appraisals of thecollateral. Declines in the fair values of other real estate owned subsequent to their initial acquisitions are also based on recent realestate appraisals less selling costs.
Real estate appraisals may utilize a single valuation approach or a combination of approaches including comparable sales andthe income approach. Adjustments are routinely made in the appraisal process by the appraisers to adjust for differences between thecomparable sales and income data available. Such adjustments are typically significant and result in a Level 3 classification of theinputs for determining fair value.
Assets measured at fair value on a non-recurring basis are summarized below.
December 31, 2020Level 1 Level 2 Level 3
Impaired loans:Commercial real estate $ — $ — $ 3,359Commercial and industrial — — 16,343Residential real estate — — 2,165Agricultural real estate — — 2,383Other — — 852
Other real estate owned:Commercial real estate — — 3,882Residential real estate — — 469

F-48
December 31, 2019Level 1 Level 2 Level 3
Impaired loans:Commercial real estate $ — $ — $ 2,411Commercial and industrial — — 15,688Residential real estate — — 2,920Agricultural real estate — — 866Other — — 1,549
Other real estate owned:Commercial real estate — — 1,268Residential real estate — — 42
The Company did not record any liabilities for which the fair value was measured on a non-recurring basis during the yearsended December 31, 2020 and 2019.
Valuations of impaired loans and other real estate owned utilize third party appraisals or broker price opinions and are classifiedas Level 3 due to the significant judgment involved. Appraisals may include the utilization of unobservable inputs, subjective factorsand utilize quantitative data to estimate fair market value.
The following table presents additional information about the unobservable inputs used in the fair value measurement offinancial assets measured on a nonrecurring basis that were categorized with Level 3 of the fair value hierarchy.
FairValue
ValuationTechnique
UnobservableInput
Range(weightedaverage)
December 31, 2020Impaired real estate loans
$ 13,443Sales Comparison
ApproachAdjustments for differencesbetween comparable sales
2% - 22%(12%)
Impaired other loans$ 11,659
Multiple ofEarnings
Multiples of earnings forcomparable entities
4.5X - 5.5X(5.0X)
Impaired other real estate owned$ 4,351
Sales ComparisonApproach
Adjustments for differencesbetween comparable sales
16% - 42%(29%)
December 31, 2019Impaired real estate loans
$ 9,173Sales Comparison
ApproachAdjustments for differencesbetween comparable sales
3% - 12%(8%)
Impaired other loans$ 14,261
Multiple ofEarnings
Multiples of earnings forcomparable entities
4.5X - 5.5X(5.0X)
Impaired other real estate owned$ 1,310
Sales ComparisonApproach
Adjustments for differencesbetween comparable sales
10% - 55%(32%)
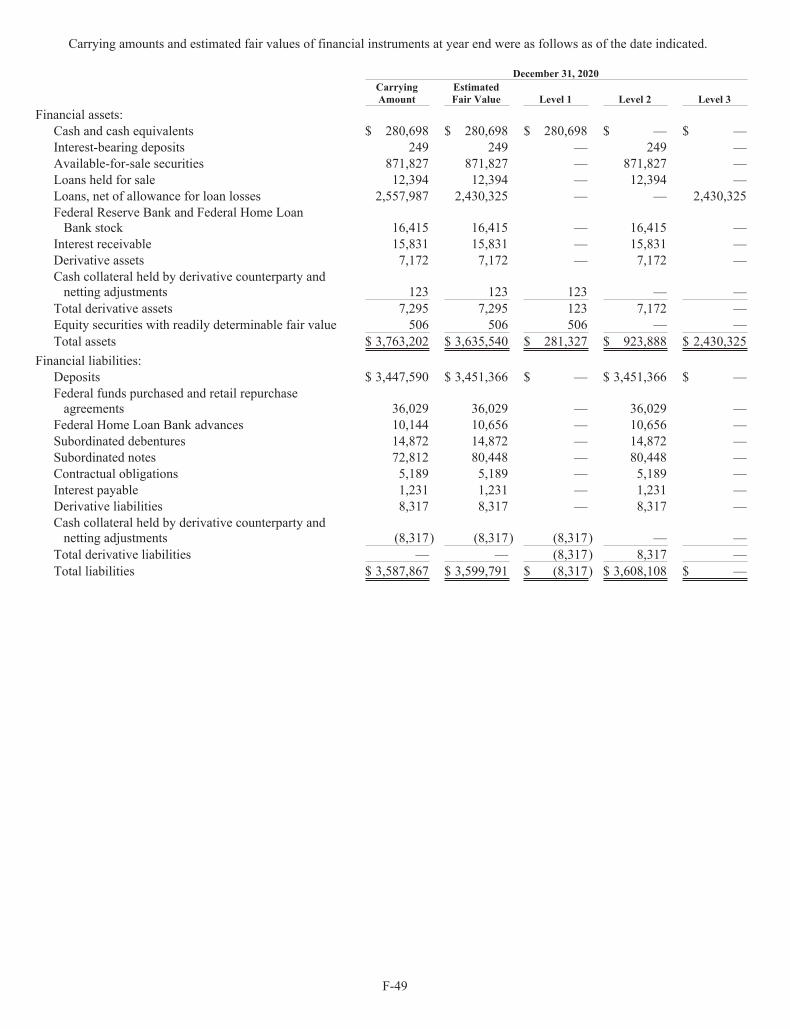
F-49
Carrying amounts and estimated fair values of financial instruments at year end were as follows as of the date indicated.
December 31, 2020CarryingAmount
EstimatedFair Value Level 1 Level 2 Level 3
Financial assets:Cash and cash equivalents $ 280,698 $ 280,698 $ 280,698 $ — $ —Interest-bearing deposits 249 249 — 249 —Available-for-sale securities 871,827 871,827 — 871,827 —Loans held for sale 12,394 12,394 — 12,394 —Loans, net of allowance for loan losses 2,557,987 2,430,325 — — 2,430,325Federal Reserve Bank and Federal Home LoanBank stock 16,415 16,415 — 16,415 —
Interest receivable 15,831 15,831 — 15,831 —Derivative assets 7,172 7,172 — 7,172 —Cash collateral held by derivative counterparty andnetting adjustments 123 123 123 — —
Total derivative assets 7,295 7,295 123 7,172 —Equity securities with readily determinable fair value 506 506 506 — —Total assets $ 3,763,202 $ 3,635,540 $ 281,327 $ 923,888 $ 2,430,325
Financial liabilities:Deposits $ 3,447,590 $ 3,451,366 $ — $ 3,451,366 $ —Federal funds purchased and retail repurchaseagreements 36,029 36,029 — 36,029 —
Federal Home Loan Bank advances 10,144 10,656 — 10,656 —Subordinated debentures 14,872 14,872 — 14,872 —Subordinated notes 72,812 80,448 — 80,448 —Contractual obligations 5,189 5,189 — 5,189 —Interest payable 1,231 1,231 — 1,231 —Derivative liabilities 8,317 8,317 — 8,317 —Cash collateral held by derivative counterparty andnetting adjustments (8,317) (8,317) (8,317) — —
Total derivative liabilities — — (8,317) 8,317 —Total liabilities $ 3,587,867 $ 3,599,791 $ (8,317) $ 3,608,108 $ —

F-50
December 31, 2019CarryingAmount
EstimatedFair Value Level 1 Level 2 Level 3
Financial assets:Cash and cash equivalents $ 89,291 $ 89,291 $ 89,291 $ — $ —Interest-bearing deposits 2,498 2,498 — 2,498 —Available-for-sale securities 142,067 142,067 — 142,067 —Held-to-maturity securities 769,059 783,911 — 783,911 —Loans held for sale 5,933 5,933 — 5,933 —Loans, net of allowance for loan losses 2,544,420 2,538,209 — — 2,538,209Federal Reserve Bank and Federal Home LoanBank stock 31,137 31,137 — 31,137 —
Interest receivable 15,738 15,738 — 15,738 —Derivative assets 3,535 3,535 — 3,535 —Cash collateral held by derivative counterparty andnetting adjustments 182 182 182 — —
Total derivative assets 3,717 3,717 182 3,535 —Equity securities with readily determinable fair value 489 489 489 — —Total assets $ 3,604,349 $ 3,612,990 $ 89,962 $ 984,819 $ 2,538,209
Financial liabilities:Deposits $ 3,063,516 $ 3,070,305 $ — $ 3,070,305 $ —Federal funds purchased and retail repurchaseagreements 35,708 35,708 — 35,708 —
Federal Home Loan Bank advances 324,373 324,373 — 324,373 —Bank stock loan 8,990 8,990 — 8,990 —Subordinated debentures 14,561 14,561 — 14,561 —Contractual obligations 5,836 5,836 — 5,836 —Interest payable 4,454 4,454 — 4,454 —Derivative liabilities 4,076 4,076 — 4,076 —Cash collateral held by derivative counterparty andnetting adjustments (4,004) (4,004) (4,004) — —
Total derivative liabilities 72 72 (4,004) 4,076 —Total liabilities $ 3,457,510 $ 3,464,299 $ (4,004) $ 3,468,303 $ —
The fair value of off-balance-sheet items is not considered material.
NOTE 22 – COMMITMENTS AND CREDIT RISK
The Company extends credit for commercial real estate mortgages, residential mortgages, working capital financing and loans tobusinesses and consumers.
Commitments to Originate Loans and Available Lines of Credit:
Commitments to originate loans and available lines of credit are agreements to lend to a customer as long as there is no violationof any condition established in the contract. Commitments and lines of credit generally have fixed expiration dates or othertermination clauses and may require payment of a fee. Since a portion of the commitments and lines of credit may expire withoutbeing drawn upon, the total commitment and lines of credit amounts do not necessarily represent future cash requirements. Eachcustomer’s creditworthiness is evaluated on a case-by-case basis. The amount of collateral obtained, if deemed necessary, is based onmanagement’s credit evaluation of the counterparty. Collateral held varies, but may include accounts receivable, inventory, property,plant and equipment, commercial real estate, and residential real estate. Mortgage loans in the process of origination representamounts that the Company plans to fund within a normal period of 60 to 90 days and are intended for sale to investors in thesecondary market.
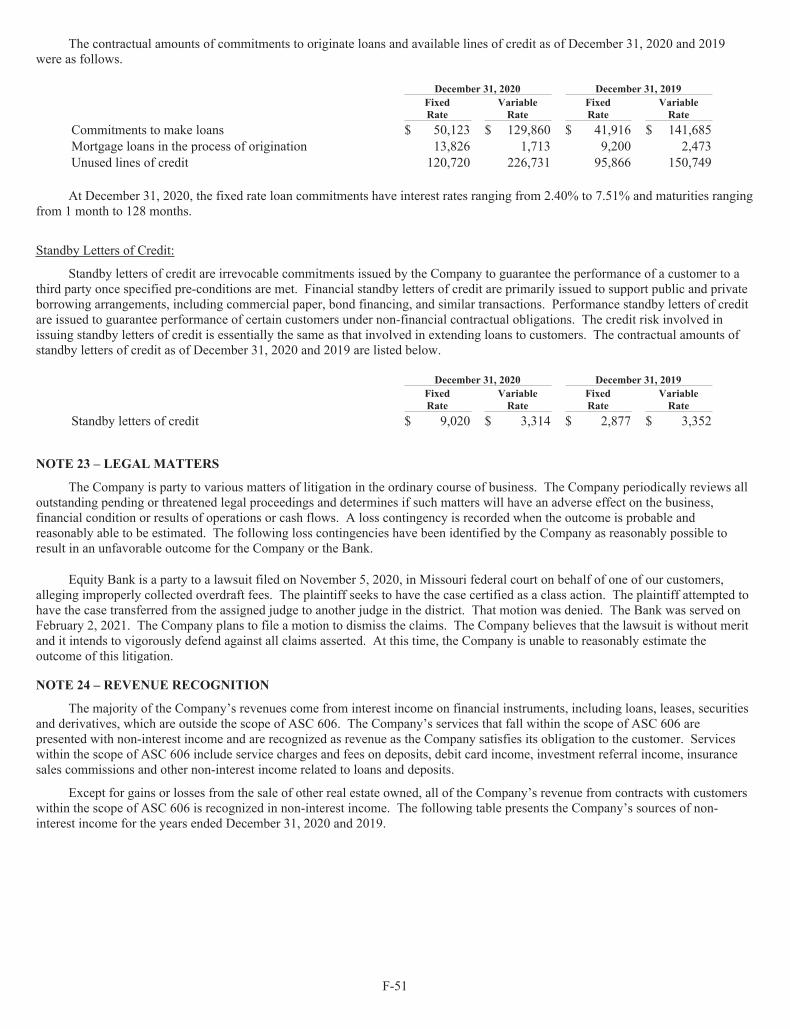
F-51
The contractual amounts of commitments to originate loans and available lines of credit as of December 31, 2020 and 2019were as follows.
December 31, 2020 December 31, 2019FixedRate
VariableRate
FixedRate
VariableRate
Commitments to make loans $ 50,123 $ 129,860 $ 41,916 $ 141,685Mortgage loans in the process of origination 13,826 1,713 9,200 2,473Unused lines of credit 120,720 226,731 95,866 150,749
At December 31, 2020, the fixed rate loan commitments have interest rates ranging from 2.40% to 7.51% and maturities rangingfrom 1 month to 128 months.
Standby Letters of Credit:
Standby letters of credit are irrevocable commitments issued by the Company to guarantee the performance of a customer to athird party once specified pre-conditions are met. Financial standby letters of credit are primarily issued to support public and privateborrowing arrangements, including commercial paper, bond financing, and similar transactions. Performance standby letters of creditare issued to guarantee performance of certain customers under non-financial contractual obligations. The credit risk involved inissuing standby letters of credit is essentially the same as that involved in extending loans to customers. The contractual amounts ofstandby letters of credit as of December 31, 2020 and 2019 are listed below.
December 31, 2020 December 31, 2019FixedRate
VariableRate
FixedRate
VariableRate
Standby letters of credit $ 9,020 $ 3,314 $ 2,877 $ 3,352
NOTE 23 – LEGAL MATTERS
The Company is party to various matters of litigation in the ordinary course of business. The Company periodically reviews alloutstanding pending or threatened legal proceedings and determines if such matters will have an adverse effect on the business,financial condition or results of operations or cash flows. A loss contingency is recorded when the outcome is probable andreasonably able to be estimated. The following loss contingencies have been identified by the Company as reasonably possible toresult in an unfavorable outcome for the Company or the Bank.
Equity Bank is a party to a lawsuit filed on November 5, 2020, in Missouri federal court on behalf of one of our customers,alleging improperly collected overdraft fees. The plaintiff seeks to have the case certified as a class action. The plaintiff attempted tohave the case transferred from the assigned judge to another judge in the district. That motion was denied. The Bank was served onFebruary 2, 2021. The Company plans to file a motion to dismiss the claims. The Company believes that the lawsuit is without meritand it intends to vigorously defend against all claims asserted. At this time, the Company is unable to reasonably estimate theoutcome of this litigation.
NOTE 24 – REVENUE RECOGNITION
The majority of the Company’s revenues come from interest income on financial instruments, including loans, leases, securitiesand derivatives, which are outside the scope of ASC 606. The Company’s services that fall within the scope of ASC 606 arepresented with non-interest income and are recognized as revenue as the Company satisfies its obligation to the customer. Serviceswithin the scope of ASC 606 include service charges and fees on deposits, debit card income, investment referral income, insurancesales commissions and other non-interest income related to loans and deposits.
Except for gains or losses from the sale of other real estate owned, all of the Company’s revenue from contracts with customerswithin the scope of ASC 606 is recognized in non-interest income. The following table presents the Company’s sources of non-interest income for the years ended December 31, 2020 and 2019.

F-52
2020 2019Non-interest incomeService charges and fees $ 6,856 $ 8,672Debit card income 9,136 8,230Mortgage banking(a) 3,153 2,468Increase in bank-owned life insurance(a) 1,941 1,998Net gain on acquisition(a) 2,145 —Net gain (loss) from securities transactions(a) 11 14Other non-interest income
Investment referral income 567 590Trust income 433 243Insurance sales commissions 275 177Recovery on zero-basis purchased loans(a) 134 143Income from equity method investments(a) (210) 26Other non-interest income related to loansand deposits 1,299 2,340Other non-interest income not related toloans and deposits(a) 283 87Total other non-interest income 2,781 3,606
Total $ 26,023 $ 24,988(a) Not within the scope of ASC 606
A description of the Company’s revenue streams accounted for under ASC 606 follows.
Service Charges and Fees
The company earns fees from its deposit customers for transaction-based account maintenance and overdraft services.Transaction-based fees, which include services such as stop payment charges, statement rendering and ACH fees, are recognized atthe time the transaction is executed as that is the point in time the Company fulfills the customer’s request. Account maintenance fees,which relate primarily to monthly maintenance, are earned over the course of a month, representing the period over which theCompany satisfies the performance obligation. Overdraft fees are recognized at the point in time that the overdraft occurs. Servicecharges on deposits are collected through withdrawal from the customer’s account balance.
Debit Card Income
The Company earns debit card income from cardholder transactions conducted through payment processors. Debit card incomefrom cardholder transactions represents a percentage of the underlying transaction value and is recognized concurrently with thetransaction processing services provided to the cardholder.
Investment Referral Income
Investment referral services are offered through an unaffiliated registered broker-dealer and investment advisor. Investmentreferral income consists of transaction-based fees (i.e., trade commissions) and account fees (i.e., custodial fees). The serviceobligation for transaction-based fees relates to processing of individual transactions and is considered earned at the time thetransaction occurs. The Company currently records this income when payment is received and at each month end for current-monthtransactions. Account fees are considered earned over the period for which the fees relate. These fees are received during the firstmonth of each quarter and represent advance payment for the current quarter. These fees are amortized ratably over the three monthsduring the quarter. Therefore, all account-based fees are currently recorded as performance obligations are satisfied.
Trust Income
Trust income includes fees from asset management, custody, recordkeeping, investment advisory and administration services.Revenue is recognized at the time the services are performed and may be based on either the fair value of the account or the servicesprovided.
Insurance Sales Commissions
Insurance commissions are received based on contracts with insurance companies which provide for a percentage of premiumsto be paid to the Company in exchange for placement of policies with customers. The commissions generally relate to a period of oneyear or less. Under certain contracts, the Company may also assist with the claims processing, but this performance obligation isconsidered insignificant compared to the initial placement of the policy. As such, the performance obligation is considered to havebeen substantially satisfied at the time of policy placement. While this indicates that all related revenue would be appropriatelyaccrued at policy inception, in some cases recognition occurs over the policy period if received in installments from the insurance
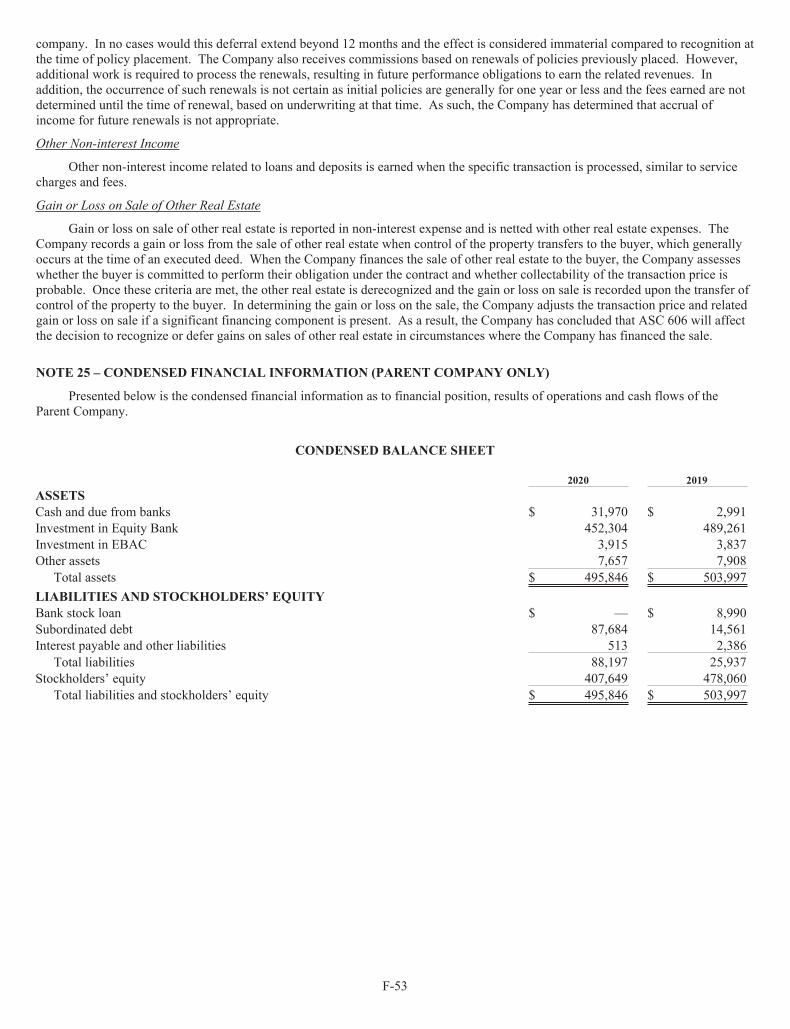
F-53
company. In no cases would this deferral extend beyond 12 months and the effect is considered immaterial compared to recognition atthe time of policy placement. The Company also receives commissions based on renewals of policies previously placed. However,additional work is required to process the renewals, resulting in future performance obligations to earn the related revenues. Inaddition, the occurrence of such renewals is not certain as initial policies are generally for one year or less and the fees earned are notdetermined until the time of renewal, based on underwriting at that time. As such, the Company has determined that accrual ofincome for future renewals is not appropriate.
Other Non-interest Income
Other non-interest income related to loans and deposits is earned when the specific transaction is processed, similar to servicecharges and fees.
Gain or Loss on Sale of Other Real Estate
Gain or loss on sale of other real estate is reported in non-interest expense and is netted with other real estate expenses. TheCompany records a gain or loss from the sale of other real estate when control of the property transfers to the buyer, which generallyoccurs at the time of an executed deed. When the Company finances the sale of other real estate to the buyer, the Company assesseswhether the buyer is committed to perform their obligation under the contract and whether collectability of the transaction price isprobable. Once these criteria are met, the other real estate is derecognized and the gain or loss on sale is recorded upon the transfer ofcontrol of the property to the buyer. In determining the gain or loss on the sale, the Company adjusts the transaction price and relatedgain or loss on sale if a significant financing component is present. As a result, the Company has concluded that ASC 606 will affectthe decision to recognize or defer gains on sales of other real estate in circumstances where the Company has financed the sale.
NOTE 25 – CONDENSED FINANCIAL INFORMATION (PARENT COMPANY ONLY)
Presented below is the condensed financial information as to financial position, results of operations and cash flows of theParent Company.
CONDENSED BALANCE SHEET
2020 2019ASSETSCash and due from banks $ 31,970 $ 2,991Investment in Equity Bank 452,304 489,261Investment in EBAC 3,915 3,837Other assets 7,657 7,908
Total assets $ 495,846 $ 503,997LIABILITIES AND STOCKHOLDERS’ EQUITYBank stock loan $ — $ 8,990Subordinated debt 87,684 14,561Interest payable and other liabilities 513 2,386
Total liabilities 88,197 25,937Stockholders’ equity 407,649 478,060
Total liabilities and stockholders’ equity $ 495,846 $ 503,997
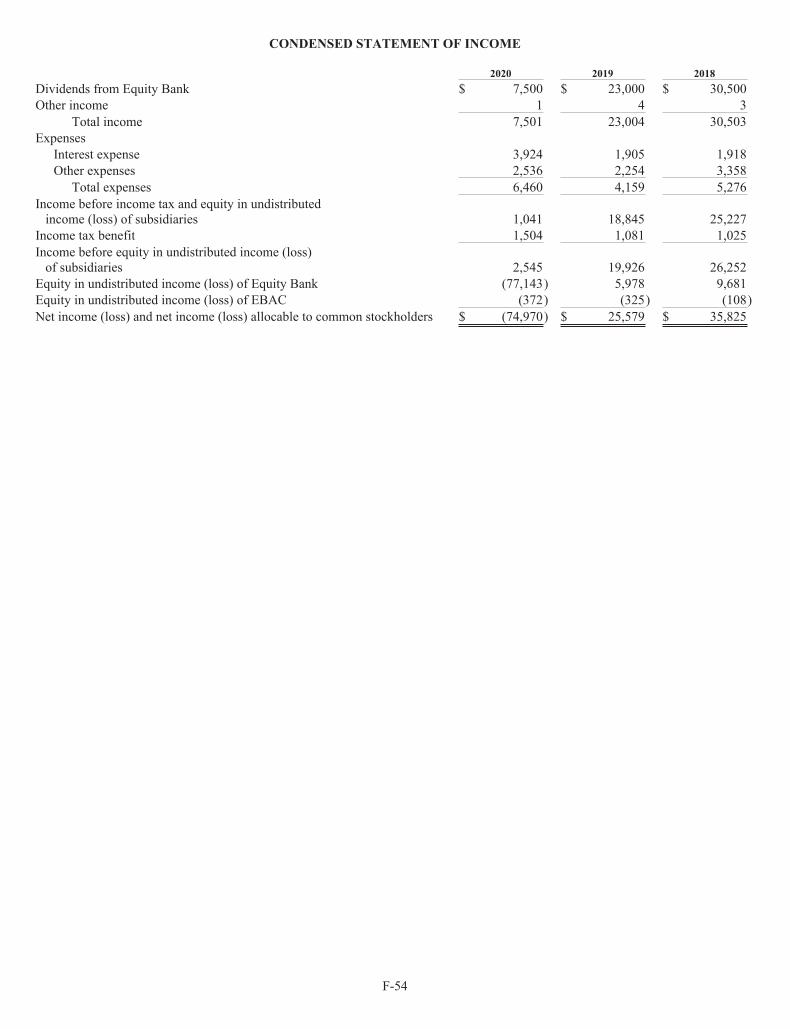
F-54
CONDENSED STATEMENT OF INCOME
2020 2019 2018Dividends from Equity Bank $ 7,500 $ 23,000 $ 30,500Other income 1 4 3
Total income 7,501 23,004 30,503Expenses
Interest expense 3,924 1,905 1,918Other expenses 2,536 2,254 3,358
Total expenses 6,460 4,159 5,276Income before income tax and equity in undistributedincome (loss) of subsidiaries 1,041 18,845 25,227
Income tax benefit 1,504 1,081 1,025Income before equity in undistributed income (loss)of subsidiaries 2,545 19,926 26,252
Equity in undistributed income (loss) of Equity Bank (77,143) 5,978 9,681Equity in undistributed income (loss) of EBAC (372) (325) (108)Net income (loss) and net income (loss) allocable to common stockholders $ (74,970) $ 25,579 $ 35,825

F-55
CONDENSED STATEMENT OF CASH FLOWS
2020 2019 2018Cash flows from operating activitiesNet income (loss) $ (74,970) $ 25,579 $ 35,825Adjustments to reconcile net income to net cash fromoperating activities:Stock based compensation 3,473 2,870 2,509Equity in undistributed (income) loss of Equity Bank 77,143 (5,978) (9,681)Equity in undistributed (income) loss of EBAC 372 325 108Net amortization of purchase valuation adjustments 388 301 292Net change in:
Other assets (300) (4,092) (4,092)Interest payable and other liabilities (4,524) (147) (50)
Net cash from (to) operating activities 1,582 18,858 24,911Cash flows (to) from investing activities
Purchase stock of Eastman, net of holdingcompany cash acquired — — (55)
Purchase stock of KBC, net of holdingcompany cash acquired — — (14,151)
Purchase stock of Adams, net of holdingcompany cash acquired — — (4,179)
Purchase assets of City Bank, net of liabilities assumed — — (18,900)Additional investment in Equity Bank (17,200) — —Additional investment in EBAC (450) (900) (3,370)
Net cash (used in) investing activities (17,650) (900) (40,655)Cash flows (to) from financing activities
Borrowings on bank stock loan 38,354 7,209 22,500Principal payments on bank stock loan (47,344) (13,669) (9,550)Borrowings on subordinated debt 75,000 — —Subordinated debt issue cost (2,265) — —Proceeds from exercise of employee stock options 20 371 133Principal payments on employee stock loan 34 44 —Proceeds from employee stock purchase plan 596 405 —Purchase of treasury stock (19,348) (10,867) —
Net cash provided by (used in) financing activities 45,047 (16,507) 13,083Net change in cash and cash equivalents 28,979 1,451 (2,661)Cash and cash equivalents, beginning of period 2,991 1,540 4,201Ending cash and cash equivalents $ 31,970 $ 2,991 $ 1,540

[THIS PAGE INTENTIONALLY LEFT BLANK]

[THIS PAGE INTENTIONALLY LEFT BLANK]

[THIS PAGE INTENTIONALLY LEFT BLANK]

