lessons learned from interim volunteer-plant (vp) eccs
TRANSCRIPT

1NEI PWR Sump Performance WorkshopJuly 30 – 31, 2003
Lessons Learned from InterimVolunteer-Plant (VP) ECCS
Vulnerability Assessment
Bruce LetellierDesign Safety and Risk Analysis Group
Los Alamos National Laboratory
NEI PWR Sump Performance WorkshopBaltimore, MDJuly 30-31, 2003

2NEI PWR Sump Performance WorkshopJuly 30 – 31, 2003
Overview
• Objectives of Volunteer-Plant Analysis• Plant Description• Sump-Screen Head Loss• Pool Transport• Blow Down/Wash Down Debris Transport• Debris Generation• Break Location• Current Insights

3NEI PWR Sump Performance WorkshopJuly 30 – 31, 2003
Objectives of Study
• Volunteer Plant study integrates all phenomenology infoand analysis methods using best available plant specific data
• Illustrates one possible implementation of the Reg Guide• Provides NRC a detailed standard of comparison for
reviewing future submittals and NEI ground rules• May provide a template for content of plant assessments but
with exaggerated detail needed for methodology insight• Sets expectations for conservatism and application of data• Will address all major accident scenario components
BUT… will not analyze all industry conditions/configs• ‘Best Available’ info will still require approximation and
engineering judgment. Will improve as conditionassessment and further head-loss analyses are completed

4NEI PWR Sump Performance WorkshopJuly 30 – 31, 2003
Required Plant Information
• Water balance calculations– Return flow locations and rates– Minimum pool depths for various break scenarios– ECCS flow rates for various break scenarios
• ECCS pool geometry– Flow velocity calculations– Identify dead sumps that can trap debris during fill up– Scope pool dynamics (regimes of fill up, spray return, steady-state)
• Piping layout and insulation applications by type• Sump-screen geometry• Plant cleanliness characterization (Latent Debris)

5NEI PWR Sump Performance WorkshopJuly 30 – 31, 2003
VP Geometry Features
• Large dry containment (133 ft diam), four loop, ‘remote’ sumps• Raised steam generator compartments
– Continual falling water sweeps compartment floor– Compartment opposite break cannot accept debris during fill phase– No damping of falling water. Momentum directed to annulus
• Two adjacent roughly equivalent sump cages (260 ft2 total)– Very close to one steam generator compartment outlet
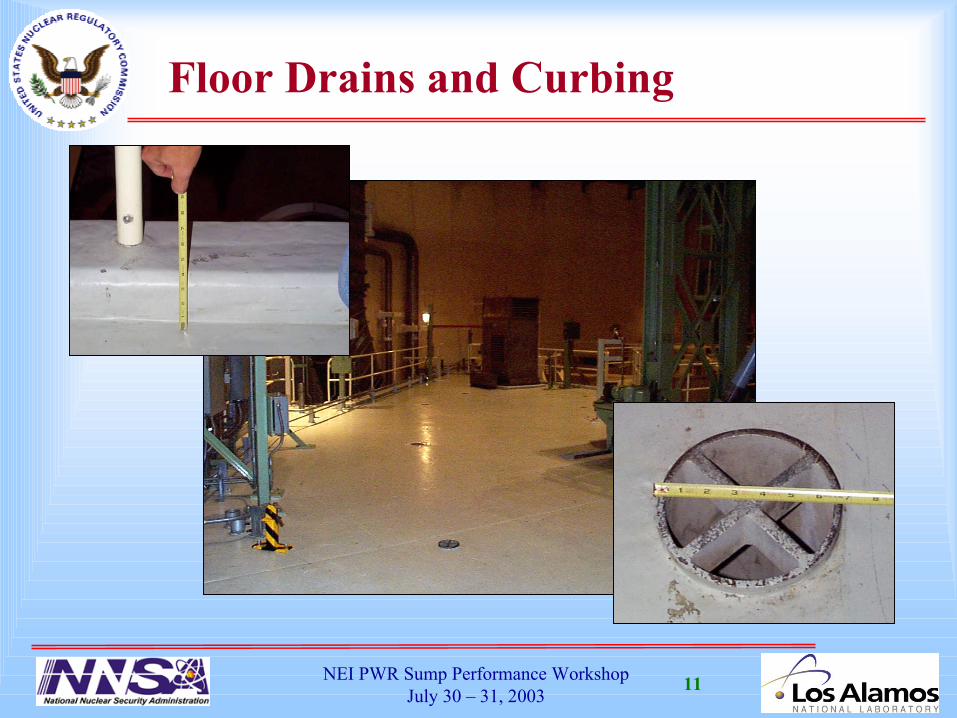
• Sump-screen curb (4 in)– Effective at stopping RMI debris unless severe piling occurs– Reduces effective pool depth
• Nonsubmerged vertical sump screens 4.75 ft above curb– Failure criteria ~1/2 pool depth above curb (ft H2O)
• Fall height from upper level drains ~10 ft• Spray return drains adjacent to vertical sump screens• Reactor cavity access has curb and partial steel-plate cover

6NEI PWR Sump Performance WorkshopJuly 30 – 31, 2003
Sump Pool Plan View

7NEI PWR Sump Performance WorkshopJuly 30 – 31, 2003
Sump Cages

8NEI PWR Sump Performance WorkshopJuly 30 – 31, 2003
Sump-Screen Construction
9NEI PWR Sump Performance WorkshopJuly 30 – 31, 2003
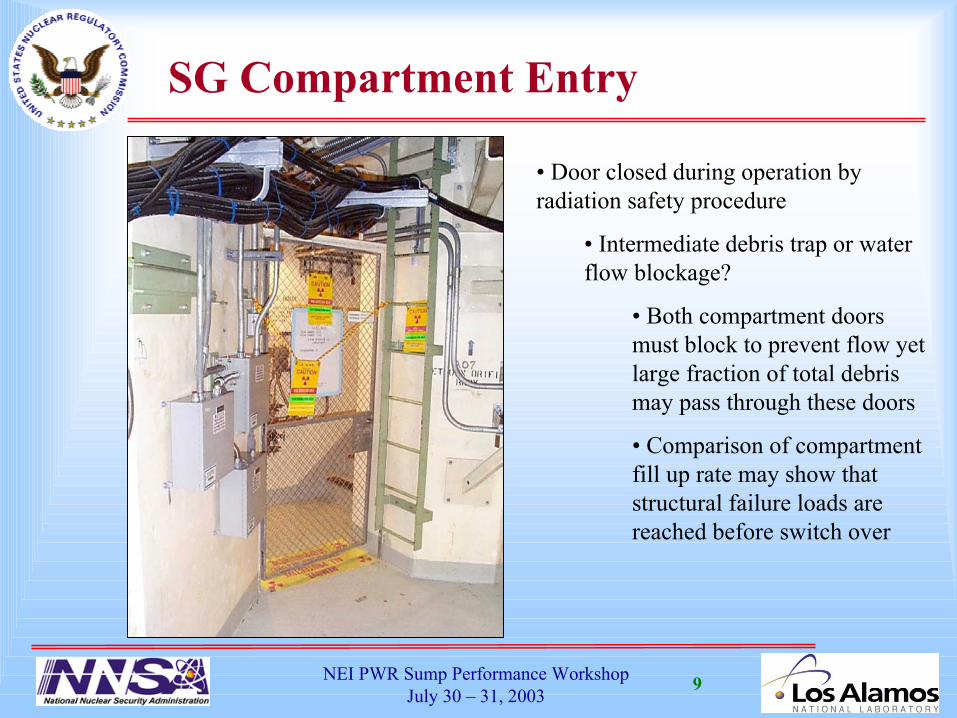
SG Compartment Entry
• Door closed during operation byradiation safety procedure
• Intermediate debris trap or waterflow blockage?
• Both compartment doorsmust block to prevent flow yetlarge fraction of total debrismay pass through these doors
• Comparison of compartmentfill up rate may show thatstructural failure loads arereached before switch over

10NEI PWR Sump Performance WorkshopJuly 30 – 31, 2003
Steam Generator Compartment
RHRpiping
Loop 4roomdoor
Loop 4SG
supportlegs
Loop 4 RCPump
supportleg
11NEI PWR Sump Performance WorkshopJuly 30 – 31, 2003
Floor Drains and Curbing

12NEI PWR Sump Performance WorkshopJuly 30 – 31, 2003
Concrete Structures
CAD modelconstructed by
tracing plan view ofeach level

13NEI PWR Sump Performance WorkshopJuly 30 – 31, 2003
Piping and Equipment Model

14NEI PWR Sump Performance WorkshopJuly 30 – 31, 2003
Ranges of Sump Flow
0 5000 10000 15000 20000 25000
Total Sump Flow (gpm)
0
1
2
3
4
5Po
ol H
eigh
t (ft)
LLOCA (Brk)
LLOCA (CS+Brk)
SLOCA (Brk)
SLOCA (CS+Brk)
MSLB (Brk)
Spray Flow = ~15,200 gpmwhen running

15NEI PWR Sump Performance WorkshopJuly 30 – 31, 2003
Head-Loss Vulnerability Assessment
Boxes Represent Available Debris Based on Parametric Evaluation Model
(Min-K Included but Not Latent Fibers)
Plant-Specific‘h’ Curves
Thin-Beds

16NEI PWR Sump Performance WorkshopJuly 30 – 31, 2003
Containment Pool Flow Analysis
Volume fraction at 90 s and 0.1 m height Velocities typical during fill up
• Fluent fill up calculation with 7400 gpm break in upper left quadrant
• CS return cascades begin to hit pool at about 90s. Difficult to compute

17NEI PWR Sump Performance WorkshopJuly 30 – 31, 2003
Estimated Spray Return Cascades
325
768
1021
849849
804
58
1345
130
150
700
520Falling Down Annular Gap
Floor Drains from Level 832
Flow Rates in GPM
397 GPM1743 GPM2030 GPM
Level 808 Sprays – 1080 GPM
730
Total Spray Flow = 15220 GPM
1021
Containment Liner FilmFlow of 700 GPM Uniformly Distributed
18NEI PWR Sump Performance WorkshopJuly 30 – 31, 2003
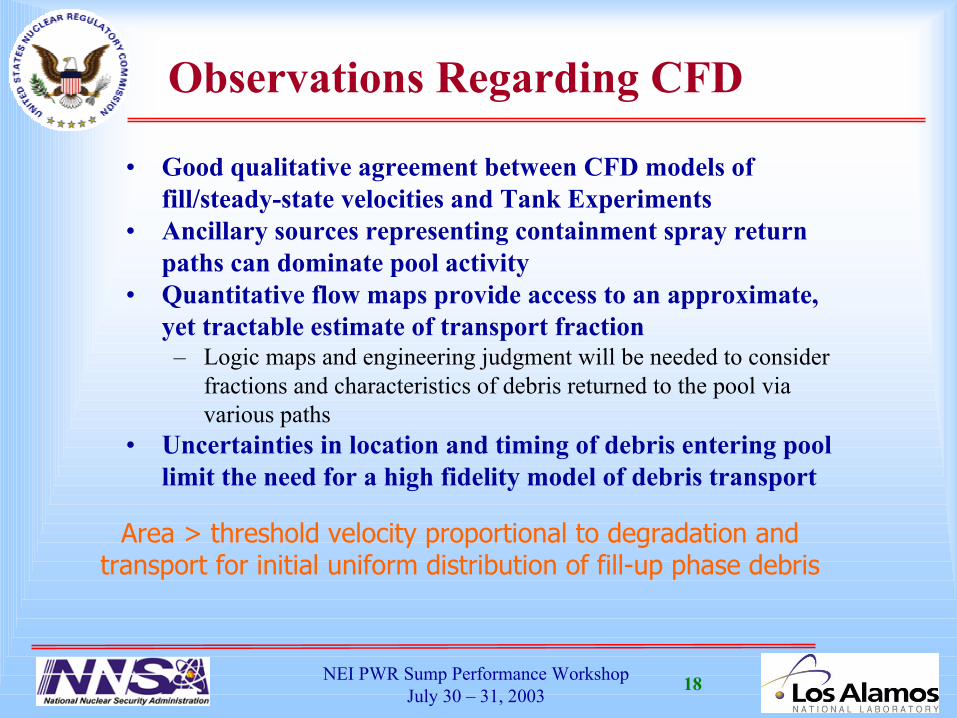
Observations Regarding CFD
• Good qualitative agreement between CFD models offill/steady-state velocities and Tank Experiments
• Ancillary sources representing containment spray returnpaths can dominate pool activity
• Quantitative flow maps provide access to an approximate,yet tractable estimate of transport fraction
– Logic maps and engineering judgment will be needed to considerfractions and characteristics of debris returned to the pool viavarious paths
• Uncertainties in location and timing of debris entering poollimit the need for a high fidelity model of debris transport
Area > threshold velocity proportional to degradation andtransport for initial uniform distribution of fill-up phase debris

19NEI PWR Sump Performance WorkshopJuly 30 – 31, 2003
Transitional Pool Flow SequenceEvent
Break Occurs
Sprays Trip
Max Spray Return
Lower Sumps Full
Characteristics
Jet impingement, steam expansion, water to bare floor withsheet flow directed away from break. Highesttransport velocities. Initial deposition pattern in deadareas and sumps.
Spray runoff accumulates and washdown begins, Sheetcover complete. Sumps fill via directed flow.Deposition pattern modified by splash zones
Maximum energy in minimum pool depth (~inches). Nodirected flow. Pool begins to fill. Max degradation.Pseudostable deposition pattern develops.
Directed flow begins to develop. Deposition patternmodified in vicinity of sump. Suspended debriscollected very quickly. Steady-state flow patternestablished.
Dead sump sheltering is only significant sequester

20NEI PWR Sump Performance WorkshopJuly 30 – 31, 2003
Key Transport Test Observations
• Cal-Sil and fiber were able to form a thin bed on a ¼-inmesh vertical screen at nominal approach velocity
• Fiber flocks that enter turbulent splash zones are effectivelyshredded to transportable sizes
• Individual fibers are suspended and continue to collect formany hours
• Shear forces between higher and lower pool velocity zonesmay be capable of slowly degrading piles of fiber flocks

21NEI PWR Sump Performance WorkshopJuly 30 – 31, 2003
Containment Airborne/WashdownDebris Transport Logic Chart
Break Debris Size Volume Region Surface Orientation Exposure Primary Capture Secondary
CaptureDebris Sump
Pool
Fines
Other
Capture
Condensate CaptureTransported
Transported Small Debris
CaptureRegion j
CaptureSmall Floor Spray Transported
Transported Small DebrisZOI Debris
Eroded Transported Fine Debris
Capture
Drainage CaptureTransported
Transported Small Debris
Region j+1
Large
Intact

22NEI PWR Sump Performance WorkshopJuly 30 – 31, 2003
Two-Phase Debris Generation
OPG Test Conditions•Tank Capacity = 2.2 m3
•Nozzle Size = 2.87 in.
•Initial Pressure = 1400 psia
•Initial Temp = 311oC

23NEI PWR Sump Performance WorkshopJuly 30 – 31, 2003
Survey of Break Locations

24NEI PWR Sump Performance WorkshopJuly 30 – 31, 2003
Integrated Vulnerability Assessment
DebrisGeneration
DebrisTransport
DebrisAccumulation
SumpPerformance
ZOI CADSimulations
CFD Simulation and Testing
Head-LossAnalysis
Systems Analysisand PRA
Plant-SpecificConditions andConfiguration
T/H models
AccidentConditions

25NEI PWR Sump Performance WorkshopJuly 30 – 31, 2003
Required Skill Set
• Familiarity with containment– Visual understanding of spray and floor water flow paths
• Understanding of water levels and pump-flow rates asrelated to EOPs
• Competent application of BLOCKAGE or otherimplementation of NUREG/CR-6224 head-loss correlation
– All plants should start by understanding current sump vulnerability• Understanding of ZOD correlations to scope break locations• Knowledge of applied insulation types and ability to
query/manipulate electronic spatial information– CAD models desirable, but not critical
• Awareness of debris generation and head-loss data– Identify unique materials and plan for characterization

26NEI PWR Sump Performance WorkshopJuly 30 – 31, 2003
Methodology Insights
• Design/adapt screens to defeat thin-bed formation– Transverse bulk and inlet flows to sweep or ‘self-clean’ surface
• Stacked disks, crenulated plates, etc.– Complex filter surface to fragment fiber layer
• Can mitigate to protect against large debris volumes– Reducing insulation volume– Increase screen area with compact high surface modifications– Intermediate gates at pool level– Divert fill-up flow towards dead sumps/cavities
• Always maximize pool depth– Especially important for nonsubmerged screens– Run sprays for breaks of all sizes?
• Special attention to cleanliness at pool level for small break/no spray• Fill-up retention in dead sumps is perhaps the only important pool-
transport reduction factor
27NEI PWR Sump Performance WorkshopJuly 30 – 31, 2003
Mitigation Strategies
• Submerge screens without compromising area– Utilizes full NPSH margin of mechanical pumps
• Avoid horizontal screens below grade• Test and approve back-flush/throttle cycles to dislodge compacted
debris• Midstream debris screens to intercept steady-state flow channels• Plant cleanliness programs• Modification of insulation types
– With due care not to increase resident loading• Active mechanical sweep and collect concepts• Innovative porous media designs on top of existing screens• Multiple inclined screen surfaces that fall away to expose new area
Preserve Integrated Safety Plan!