lesson: le monsieur chef · for each linear function on the graph, identify the slope (m) and the...
TRANSCRIPT

MidSchoolMath 1
Being able to determine the general shape of a graph just by looking at an equation is a skill that will help students to better analyze and understand the behavior of functions. In Le Monsieur Chef, Chef Pierre regales the audience with his culinary secrets, one of which is ze secret to le steak. He points us to a love story that was ruined by an overcooked steak, which has led him to pay utmost attention to cooking times and has led him to develop equations for various cooking tasks. He challenges us to identify whether each of ze cooking tasks are modeled by a linear or non-linear equation. The data provided is a page in Chef Pierre’s cookbook showing equations used for various cooking tasks.
LESSON: LE MONSIEUR CHEFWhich cooking tasks are modeled by a linear equation?
Which cooking tasks are modeled by a non-linear equation?
Le Monsieur Chef
Interpret the equation y = mx + b as defining a linear function, whose graph is a straight line; give examples of functions that are not linear. For example, the function A = s2 giving the area of a square as a function of its side length is not linear because its graph contains the points (1, 1), (2, 4) and (3, 9), which are not on a straight line.
The Math SimulatorTM
ImmersionPlay Le Monsieur Chef Immersion video, whole-class. Restate the question: Which cooking tasks are modeled by a linear equation? Which cooking tasks are modeled by a non-linear equation?Facilitate classroom discussion; ask students: "What do we need to know?"
•
•
•
1
2 Data & ComputationPrint the Data Artifact and distribute to students. Allow students work time. Ask students: "Does your answer make sense?"Consider using a sharing protocol leading to mathematical insights and/or highlighting misconceptions. Allow students to revise their work.
•
•
•
•
3 ResolutionPlay Le Monsieur Chef Resolution video, whole-class. Prepare and give brief lecture (Teacher Instruction).
••
Download the Detailed Lesson PlanAvailable on the Teacher Dashboard
+ Simulation TrainerAssign the Simulation Trainer.Use protocols that encourage students to help each other.Use Progress Monitoring to access real-time data for the classroom.Provide individual help for students who are not making progress.
•
•
••
(Use student headphones.)
8.F.A.3Functions

MidSchoolMath Le Monsieur Chef
Clicker QuizLaunch the Clicker Quiz, whole-class.
8.F.A.3Functions
2
Gladys: Make sure students are comfortable manipulating equations into various forms, especially slope-intercept form. Consider providing some time for review of this skill.
Kevin: When students are unsure about classifying an equation as linear (or even a function), encourage them to create a table of values and to plot those values on a graph to see the relationship visually. Remind students that a constant rate of change between points indicates a linear relationship.
Megan: Consider giving small groups an envelope containing various graphs, tables and equations. Ask them to classify them as being linear or non-linear, and have groups share their results with each other, before receiving confirmation from you. Once they have a correct classification, ask them to jot down patterns or structures they notice about those that are linear and those that are non-linear.
KevinSimpson
GladysGraham
MeganLeBleu
Ex. Clicker Quiz #3Standard Math Procedures
Instruction at a Glance
1
3
Simplify the equation to isolate y.
Determine if the equation is linear.
y + 2 = -3x + 6
y = -3x + 4
y = -3x + 4
y = mx + b
It appears as if any input x will yield one output y, so it is a function.
B: Function, Linear
Equation can be written in slope-intercept form, so it is linear.
2
4
Determine the if equation represents a function.
Select appropriate option.
8.F
Stan
dard
s &
Les
sons
8.F
Ass
essm
ents
8.F
Dom
ain
Revi
ew

LE MONSIEUR CHEFWhich cooking tasks are modeled by a linear equation? Which cooking tasks are modeled by a non-linear equation?
Chef Pierre takes his craft very seriously, so much so zat he has developed his own cookbook to share with ze world. He knows the importance of precision and attention to detail in ze kitchen, and so he has worked very hard to develop a series of equations that could be helpful to any aspiring chef.
Cooking tasks zat are modeled by linear equations are a bit more predictable zan zose modeled by non-linear equations. Consequently, Chef Pierre thinks it very important for any chef to be able to distinguish tasks that are linear from tasks that are non-linear.
Take Chef Pierre’s challenge in ze cookbook. Identify which cooking tasks are modeled by linear equations and which are modeled by non-linear equations.
8.F.A.3
Interpret the equation y = mx + b as defi ning a linear function, whose graph is a straight line; give examples of functions that are not linear. For example, the function A = s2 giving the area of a square as a function of its side length is not linear because its graph contains the points (1, 1), (2, 4) and (3, 9), which are not on a straight line.
About this standard
Date PeriodName
MidSchoolMath Le Monsieur Chef 1 of 2
APPLYING THE STANDARD
MidSchoolMath 2 of 2
Date PeriodName
How might this standard appear on a test?
Le Monsieur Chef
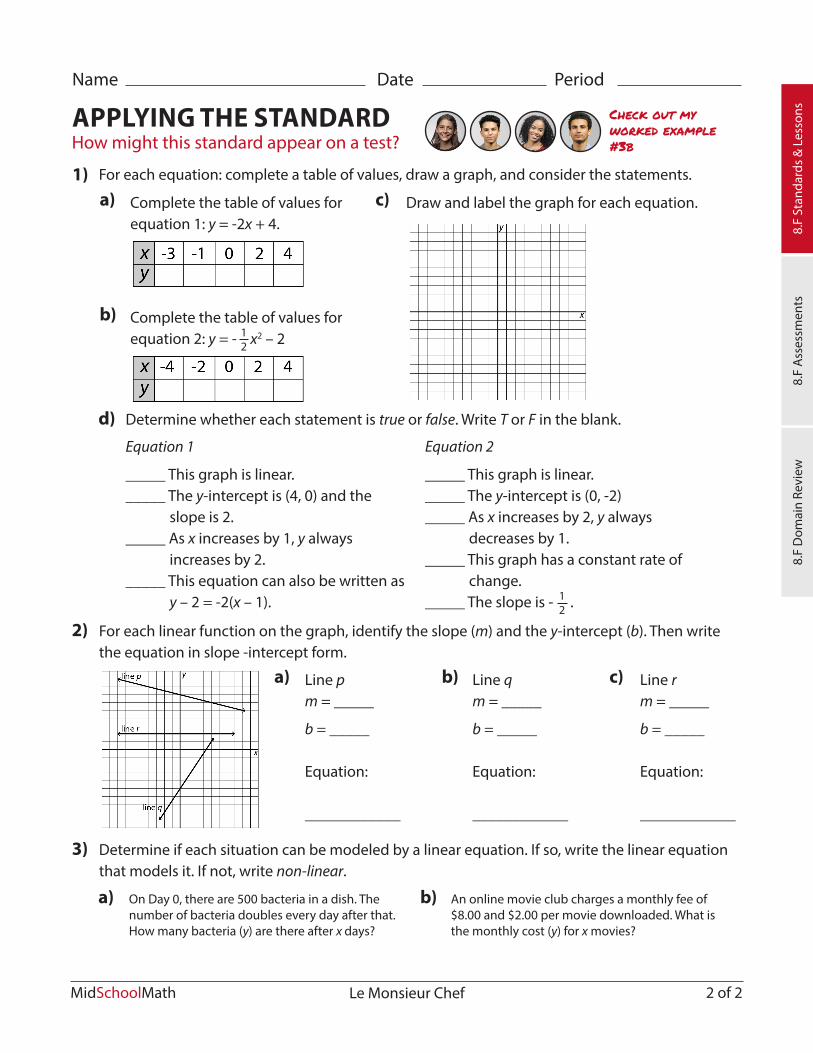
For each equation: complete a table of values, draw a graph, and consider the statements.
Complete the table of values for equation 1: y = -2x + 4.
Draw and label the graph for each equation.
Complete the table of values for equation 2: y = - x2 – 2
1)a)
Line pm = _____
b = _____
Equation:
____________
a) Line qm = _____
b = _____
Equation:
____________
b) Line rm = _____
b = _____
Equation:
____________
c)
c)
b)12
Determine whether each statement is true or false. Write T or F in the blank.d)
For each linear function on the graph, identify the slope (m) and the y-intercept (b). Then write the equation in slope -intercept form.
Determine if each situation can be modeled by a linear equation. If so, write the linear equation that models it. If not, write non-linear.
2)
3)
Equation 1
_____ This graph is linear._____ The y-intercept is (4, 0) and the slope is 2._____ As x increases by 1, y always increases by 2._____ This equation can also be written as y – 2 = -2(x – 1).
Equation 2
_____ This graph is linear._____ The y-intercept is (0, -2) _____ As x increases by 2, y always decreases by 1._____ This graph has a constant rate of change._____ The slope is - .1
2
On Day 0, there are 500 bacteria in a dish. The number of bacteria doubles every day after that. How many bacteria (y) are there after x days?
a) An online movie club charges a monthly fee of $8.00 and $2.00 per movie downloaded. What is the monthly cost (y) for x movies?
b)
Check out my worked example #3b
8.F
Stan
dard
s &
Les
sons
8.F
Ass
essm
ents
8.F
Dom
ain
Revi
ew