lesotho: land administration reform project (larp) impact
TRANSCRIPT
LESOTHO: Land Administration Reform Project (LARP) Impact & performance evaluation design report
Daniel Ayalew Ali, Klaus Deininger, Thea Hilhorst The World Bank
Submitted to: Millennium Challenge Corporation (MCC)
December 2018
i
List of Acronyms
CAPI Computer Assisted Personal Interviewing DiD Difference-in-Differences ERR Economic Rate of Return ESRI Environmental Research System Institute ICC Intra-Cluster Correlation LAA Land Administration Authority LARP Land Administration Reform Project LSPP Land Surveys and Physical Planning LTR Land Tenure Regularization MCA-Lesotho Millennium Challenge Account Lesotho MCC Millennium Challenge Corporation MDES minimum detectable effect size MMCs Maseru Municipal Councils MSU Michigan State University PSD Private Sector Development PSM Propensity score matching RCT Randomized Control Trial RD Regression Discontinuity RQU Registration and Quality Unity UN SOLA United Nations Solutions for Open Land Administration USDA United States Department of Agriculture
ii
Table of Contents List of Acronyms ........................................................................................................................................... i List of Tables ................................................................................................................................................ ii List of Figures ............................................................................................................................................... ii 1. Introduction and Background................................................................................................................ 1 2. Overview of the Compact and the Interventions Evaluated .................................................................. 1
A. Original project description .............................................................................................................. 1 B. LARP activities and implementation ................................................................................................ 1 C. Theory of change .............................................................................................................................. 3 D. Economic Rate of Return (ERR) ...................................................................................................... 4 E. Literature ........................................................................................................................................... 4
3. Evaluation Design ..................................................................................................................................... 5 3.1 Evaluation History and Scope ............................................................................................................. 5 3.2 Impact Evaluation Design: Challenges encountered and measures taken in response ................ 9
3.2.1 Suggested approaches to address the challenges ................................................................... 11 3.2.2 Primary Data Collection .......................................................................................................... 17 3.2.3 Secondary Data ........................................................................................................................ 20 3.2.4 Analysis Plan ............................................................................................................................ 20
3.3 Performance Evaluation using Administrative Data .................................................................... 20 4. Administrative ..................................................................................................................................... 23 References ................................................................................................................................................... 25 Appendix Figures and Tables ..................................................................................................................... 27 List of Tables Table 1: Baseline questionnaire topics .......................................................................................................... 8 Table 2: List of treatment and control villages ............................................................................................. 9 Table 3: Minimum detectable effects after propensity score matching; power=0.8, total sample size=1,275 households; 4,896 individuals; 1,553 parcels; allocation ratio (NC/NT)=0.429 ......................................... 13 Table 4: Minimum detectable effects for a geographic discontinuity design: power=0.8, take up rate in control areas 30%; allocation ratio (NC/NT)=1 ........................................................................................... 14 Table 5: Summary of research questions, outcomes and data sources for the impact evaluation ....... 15 Table 6: Table of content of the endline survey instruments ................................................................. 18 Table 7: Summary of data collection ....................................................................................................... 19 Table 8: Research question and data source for the administrative data analysis ....................................... 21 Table 9: Evaluation timeline and reporting schedule .................................................................................. 23 Appendix Table 1: Sample balance before and after matching (unmatched=1418 households; matched=1275 households) ........................................................................................................................ 31 Appendix Table 2: Covariate bias before and after matching ..................................................................... 33 List of Figures Figure 1: Location of treatment (MMC1, 2, and 3) and Control Wards in Maseru City .............................. 7 Figure 2: The recorded geographic coordinates of surveyed households vis-à-vis sampled wards .............. 7 Figure 3: Layout plan covered under the Maseru City Council project in MMC 27 ........................... 11 Figure 4: Sample geographic discontinuity design ................................................................................. 14 Figure 5: Sample land use changes between 2012 and 2016 using high resolution aerial photography .... 17 Appendix Figure 1: MMC 01 – 13 treatment clusters ................................................................................ 27
iii
Appendix Figure 2: MCC2 – 11 treatment clusters .................................................................................... 27 Appendix Figure 3: MCC3 – 4 cluster treatment clusters........................................................................... 28 Appendix Figure 4: MMC 27 – 12 control clusters .................................................................................... 28 Appendix Figure 5: Density distribution of propensity scores including both on support and off support observation .................................................................................................................................................. 29 Appendix Figure 6: Density distribution of propensity scores restricting to matched observations .......... 29 Appendix Figure 7: Density distribution of standardized percentage bias across covariates ..................... 30

1
1. Introduction and Background
The Kingdom of Lesotho is a small (30,355 sq. km with a population of about 2 million), mostly mountainous (75%) and land locked country surrounded by South Africa. Lesotho’s economy, primarily driven by the performance of textile manufacturing and agriculture, have been growing by about 3% over the past three years. Despite its decreasing trend, the country is characterized by high inequality and poverty as well as high-level of unemployment hovering around at a rate of 24 to 28%. At the same time, the level of urbanization in Lesotho was staggeringly low estimated at 23% in 2007 and 28% in 2017 (World Bank 2018b). Recognizing the need for new sources of growth, it has made considerable progress in improving its investment climate for private sector development particularly by streamlining business and property registration process (World Bank 2018a).
MCC’s compact 1 project aimed to support private sector development in several ways, including the registration of property rights to land through the Lesotho Land Administration Reform Project (LARP). This report proposes a design for impact and performance evaluation of these activities. We first assess some of the problems encountered in implementing the original impact evaluation design, the challenges this poses for adhering to the original design and the minimum size of detectable effects this would imply. We present complementary approaches, especially a discontinuity design and use of time series high resolution imagery that can help to cost-effectively complement the original methodology and thus help assess medium-term effects of different components of LARP. Primary and administrative data required to complement the impact evaluation with an assessment of performance are discussed as well and we present our estimate of efforts and time line for implementation.
2. Overview of the Compact and the Interventions Evaluated
A. Original project description
In July 2007, the Millennium Challenge Corporation (MCC) signed a five-year, $362.6 million Compact with the Kingdom of Lesotho (the Government of Lesotho) aimed at improving the supply of water for industrial and domestic use, increasing access to essential health services and anti-retroviral therapy, and removing barriers to foreign and local private sector investment through improving access to credit, reducing transaction costs and increasing the participation of women in the economy. The Compact implemented by the Millennium Challenge Account Lesotho (“MCA-Lesotho”), entered into force in September 2008.
LARP activities, the subject of the evaluation design, are under the Private Sector Development (PSD) Project of the Compact. LARP was implemented in Maseru and nearby areas in Lesotho between 2008 and 2013. LARP included a systematic land regularization program for urban/peri-urban areas, legal and regulatory reform, and development of a new land administration authority and related institutional capacity building. LARP aimed to benefit a total of at least 55,000 landholders; 19,000 who would benefit from new land legislation and a more efficient Land Administration Authority (LAA) and 36,000 inhabitants of informal areas who would receive land leases under the program.
B. LARP activities and implementation
Specifically, LARP had 4 sub-activities:
Policy and legal reform: Technical assistance was made available to assess the legal and regulatory environment for land and adopt land policy and regulatory reforms that promote the use of land as collateral and an economic asset. The reforms were expected to encourage a dynamic land market and improve the security of property rights. During the compact period, 10 out of 18 targeted reforms were passed while
2
recommendations and amendments for others (such as the sectional title bill) had been drafted but not yet adopted by Parliament in 2013.1
Modernization and improvement of land administration services: This sub-component aimed at decreasing the time and inefficiencies associated with conducting a formal land transaction and increasing confidence in the formal system, thereby increasing demand for formal land registration services. Activities included simplification and improvement of the formal land administration procedures, establishment of a new streamlined Land Administration Authority (LAA) as well as an updated land information system (register of property rights) to enable the land to be traded more easily in the form of sale or rent at lower land-transaction costs. The Compact established the LAA, which became fully operational, taking over from the Land Surveys and Physical Planning (LSPP) in 2010. However, the delay in the establishment of the land information system due to contract failure forced LAA to adopt the United Nations Solutions for Open Land Administration (UN SOLA) system as an interim solution that had sub-optimal functionality. The system has since been migrated to Trimble Landfolio which seamlessly integrates the textual and spatial databases. Overall, people seem to have confidence in the LAA, with monitoring data from the LAA showing a rise in demand for formal land transactions and more vibrant land markets, including increases in first time registration, mortgages and transfers. Nevertheless, as data capture from scanned paper records (both for first time registration and subsequent transactions) is still in progress, the land information system is not yet fully up-to-date.
Systematic regularization of land in urban areas and improvement of rural land allocation processes: This component aimed to simplify and streamline lease preparation and registration process through establishing a legal framework for systematic regularization and registration and provide secure land tenure in informal settlements in urban and peri-urban areas through issuing legal documents (referred to as “Lease”) to property owners. MCA hired Land Equity International (pilot activity) and COWI-Orgut (roll-out activity) to carry out the systematic land regularization work and the newly established Lesotho Land Administration Authority (LAA) Registration and Quality Unity (RQU) also carried out systematic regularization in rollout areas. LARP used minimal planning standards to allow for regularization in certain settlements that did not meet city-wide standards while avoiding redline areas for the government that had significant issues like being too close to the road or in areas planned for water/sewage.
As a result, LARP managed to issue 41,789 of the target of 55,000 leases in Maseru and nearby areas of Lesotho by the end of the Compact and related closeout period in 2013. The government continued post Compact to register project areas, providing leases to a total of 51,577 parcels, as of July 2018, in project areas including 6,169 in the name of male, 17,566 in the name of women, 27,809 jointly titled and 33 to companies.2 Due to the focus on women’s land rights, including the Compact condition precedent to recognize women’s rights to land and joint titling, women’s share of land rights increased dramatically. This trend seemingly continued post Compact. As of June 2018, women held land rights individually or jointly with a man, in 74% of officially documented land parcels, including sporadic non-project issued leases. This compares to only 29% of land parcels prior to the Compact (considering leases issued between 1981 and 2010 given leases under the systematic process started to be issued in 2011).
Public outreach and training: This component supported land administration reform activities, including sensitization on LARP rollout and awareness raising on changes in land laws, the establishment of the LAA, women’s land rights and conducting land transactions.
1 The 10 reforms passed by the government as of 2012/2013 were: the land act, the LAA act and the systematic land regularization regulation in June 2010; land act implementing regulations in February 2011; District land court rules and land court rules in February 2012; land survey amendment act, land amendment act, land administration amendment act and deeds registry amendment act in March 2012. Furthermore, additional amendments that have been passed since 2013 include: land survey amendment regulation; land regulation amendment, deeds registry (amendment of schedule) regulation in February 2013; land amendment act in 2014; and land administration authority amendment act in September 2016. 2 As of July 2018, data compiled by LAA, there were 90,941 registered parcels with leases (51,577 under the regularization process and 39,364 under sporadic process. Of the 39,364 leases issued under the sporadic process, 8,863 and 11,902 were issued in 2011-2013 and 2014-2018, respectively.
3
C. Theory of change
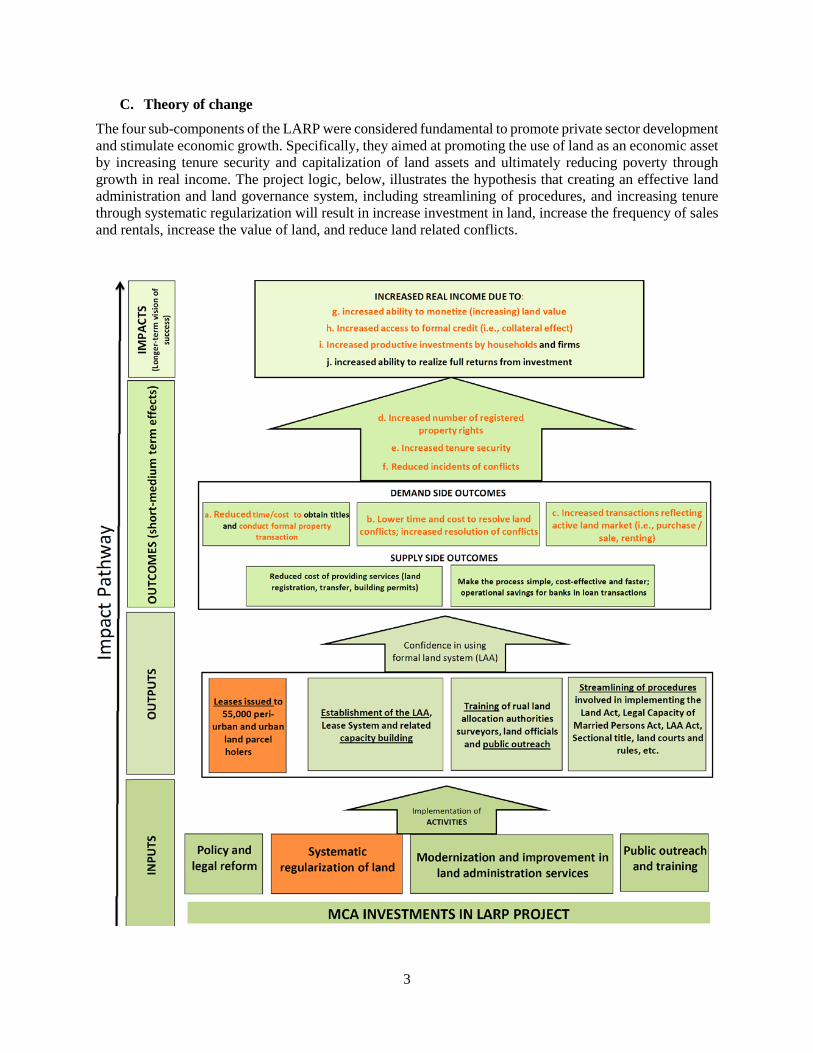
The four sub-components of the LARP were considered fundamental to promote private sector development and stimulate economic growth. Specifically, they aimed at promoting the use of land as an economic asset by increasing tenure security and capitalization of land assets and ultimately reducing poverty through growth in real income. The project logic, below, illustrates the hypothesis that creating an effective land administration and land governance system, including streamlining of procedures, and increasing tenure through systematic regularization will result in increase investment in land, increase the frequency of sales and rentals, increase the value of land, and reduce land related conflicts.
4
Provision of leases and awareness raising was expected to improve security of tenure and encourage investments, increasing productivity of land and related land values and income. This was especially true for women who prior were seen as minors after marriage with few owning properties unless single. Reforming the land governance and administration system was expected to result in the short-term in facilitating citizens access to land services via lower land transaction costs and increase confidence in and use of the formal land system and banking sector, while in the medium to longer-term providing sustainability of secure tenure rights, enabling the land to be traded more easily in the form of sale or rent and encouraging development. Formal access to credit was also expected to increase based on the policy and regulatory reforms and the creation of the LAA. The expectation was there would be a jump in mortgages towards the end of the Compact, especially with the removal of the required Minister’s consent on every mortgage and efficiencies by the LAA. Although a land title does not equate to automatically securing a loan, in Lesotho’s case, the inefficiencies of the former land authority and the legislation requiring all mortgages to be signed by the Minister of Local Governance specifically constrained the mortgage markets. Nevertheless, as banks still require income or some other form of collateral beyond land to be credit worthy, the formal access to credit was expected to largely occur by those in the previously formal areas with a consistent income source and those better off in the previously informal areas. In the long-term, as land and financial markets develop, the use of formal land rights as collateral will likely expand considerably.
D. Economic Rate of Return (ERR)
MCC uses the economic rate of return (ERR) to assess the long-term feasibility of its investment projects in recipient countries. It is computed by comparing the economic costs and benefits of a program and/or policy measure discounted over its life. Specifically, it compares incremental investment returns and costs with and without the project by taking dynamic trends into account over the life of the project. MCC considers projects for investment only if their pre-investment ERR, calculated using data and evidence available at the time, passes the 10% hurdle rate. The basis for pre-investment and closeout (after MCC costs and some indicators of benefits were known) ERRs calculations of the land administration component of the Lesotho Private Sector Development Project was the expected increase in mortgage activity and incremental value added associated with economic activity facilitated by increased access to credit over a period of 20 years. The incremental cost considered transaction costs associated with first time property registration as well as mortgage and property transfer registration. The scenario with the project included project expenses covered by MCC and other institutional costs. The pre-investment and closeout ERRs were 18% and 16% respectively.
The planned impact and performance evaluation provides an opportunity to update key parameters used to calculate pre-investment and closeout ERRs. To this effect, survey and administrative data that will be collected for the evaluation and impact estimates will provide better information and evidence to re-estimate ERRs. The key parameters for estimating the benefit streams that include the number of registered parcels, registered mortgages and values, registered property transfers and property values over time will be updated with actual data from the land administration information system of LAA. Reduction time to register parcels will be revised using administrative data from the registry. Impact estimates on housing related investments from survey data, analysis of time series aerial photos and building permits (with estimated costs) from Maseru City Council – for which details are given in the relevant sections on impact and performance evaluation – will substantially complement the estimates of the incremental investment returns from increased mortgage lending. Land registration and transaction registration (mortgage and transfer) cost will also be revised using updated data from LAA and other relevant intuitions. Depending on data availability, the cost-benefit analysis model will be modified to consider: (i) gains from allocative efficiency arising from property transfer; (ii) increased property values due to investments; and (iii) gains for loan providers.
E. Literature By defining who is entitled to reap the benefit streams that flow from a resource, the way in which land rights are defined and can be accessed is a key element of the power structure and social fabric of society.
5
Moreover, by establishing a correspondence between the effort expended in increasing resource values and the rewards from such activity, land rights affect investment incentives and -by reducing the transaction cost for market-mediated land transfers- structural change and possible use of land as collateral in credit markets (Besley and Ghatak 2010)
Clearly defined and registered property rights to land will reduce expropriation risk thus encouraging land-related investment (Besley 1995; Fenske 2011) and eliminating the need to spend resources to defend land against challenges (Fetzer and Marden 2017). Receipt of titles allowed former squatters, especially women, to join formal labor markets instead of staying at home to guard their land, thereby increasing their income and reducing child labor (Field 2007). In Vietnam, certificates prompted higher investment in perennials and prompted households, especially the poor, to spend more time in non-agricultural activities (Do and Iyer 2008). Demarcation of land led to higher long-term investment and freed up labor for productive uses in Benin (Goldstein et al. 2015). If women were disadvantaged before, they can disproportionately benefit from such measures. In Ethiopia land certification helped to empower women and led to increased productivity as well as land market transactions (Deininger et al. 2011). Titles including women in Argentina are credited with having helped to reduce fertility and increase investment in children’s human capital (Galiani and Schargrodsky 2004) via investment rather than improved credit access (Galiani and Schargrodsky 2010). Positive impacts of land-tenure security on investment in rural areas have been documented in China (Jacoby et al. 2002), Thailand (Feder et al. 1988), Latin America (Bandiera 2007), and eastern Europe (Rozelle and Swinnen 2004) as well as globally (Lawry et al. 2016) and even in low income settings, demand for and willingness to pay for land rights is high, with considerable scope for positive gender effects (Ali et al. 2016).
Documented land rights allow realizing the full potential from trade in land and its use as collateral in financial markets if authoritative information on the assignment of property rights is available at low cost, normally from public registries (Arrunada 2009). Credit impacts from land titling can be expected if land markets are sufficiently fluid and third parties such as mortgage lenders can easily access registries to get reliable land ownership information. In settings where these conditions do not hold, credit effects of land titling may be absent or limited to the better off (Carter and Olinto 2003). Where they apply, as in urban India, even simple measures such as reducing the cost of accessing registry information via computerization increased the number of registered mortgages and volume of credit (Deininger and Goyal 2012).
Despite overall positive effects of land tenure reforms, particularly with regard to women’s access to land and land rights across countries, magnitude and significance levels are context specific and depend on evaluation methodology and the nature of data used. The LARP project in Lesotho provides a unique opportunity to have better understandings of comprehensive land tenure reforms in urban settings with substantial level of informality as it is the case in most African cities. Unlike any other previous studies, this evaluation will combine household survey, remote sensing and administrative data.
3. Evaluation Design
3.1 Evaluation History and Scope
The MCC established a partnership with Michigan State University (MSU), through a Cooperative Agreement with the United States Department of Agriculture (USDA), to design and conduct the evaluation of LARP, including supporting baseline data collection, carrying out data analysis and drafting results. The evaluation aimed to test whether the following expected outcomes were realized and attributable to LARP:
a. Reduction in the financial and time burden of conducting land transaction with LAA b. Increased efficiency in rendering land administration services to the public by LAA c. Reduction in time for land conflict resolution d. Reduction in land related conflicts within the areas where there has been intervention amongst the
55,000 lease holders e. Increased number of land parcels used as collateral for mortgage
6
f. Increased property investment, subleasing, rentals and other economic activities g. Increased frequency of formal land transaction h. Increased base case mortgage lending volume i. Increased land values j. Increased household income of primary and secondary beneficiaries k. Increased understanding by Basotho of their rights and knowledge about services rendered by the
LAA. l. Increased willingness of other land owners outside the regularization impact areas to request formal
land title
The first evaluation design, which used a randomized control trial (RCT) methodology, and related baseline survey failed due to quality issues with the local data collection firm, as well as project implementation changes. A revised evaluation design using a non-experimental matched comparison group difference-in-differences (DiD) was agreed upon in 2013.3
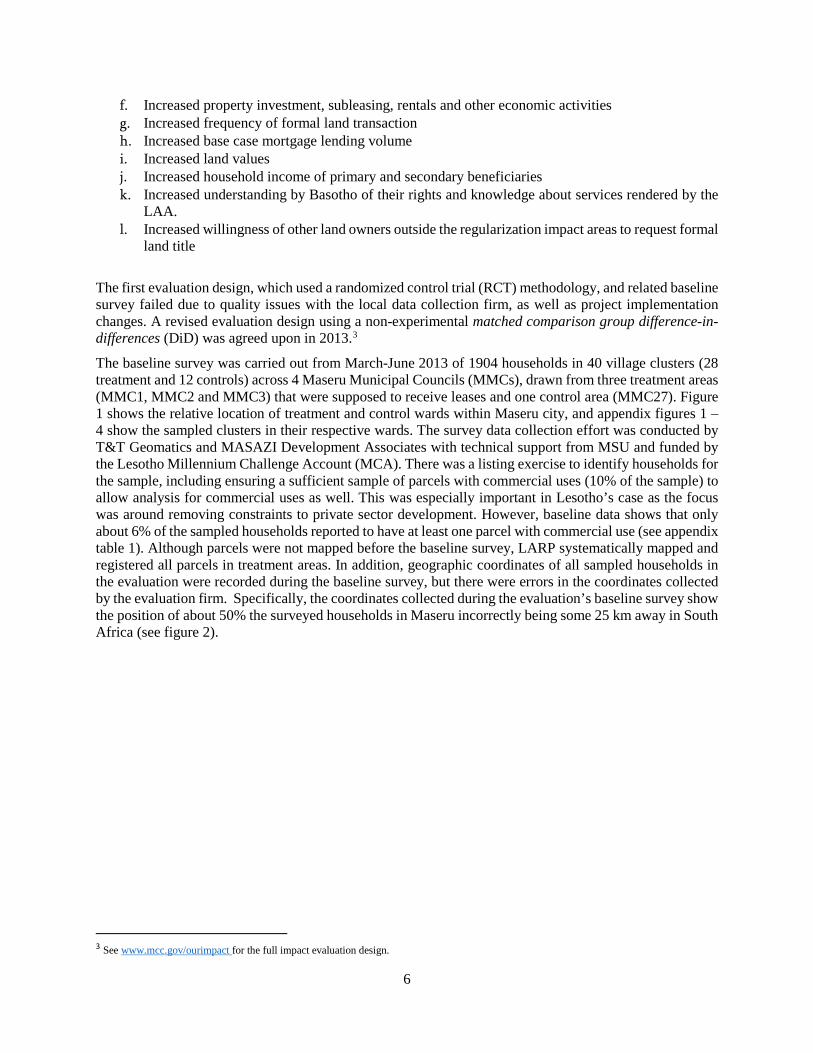
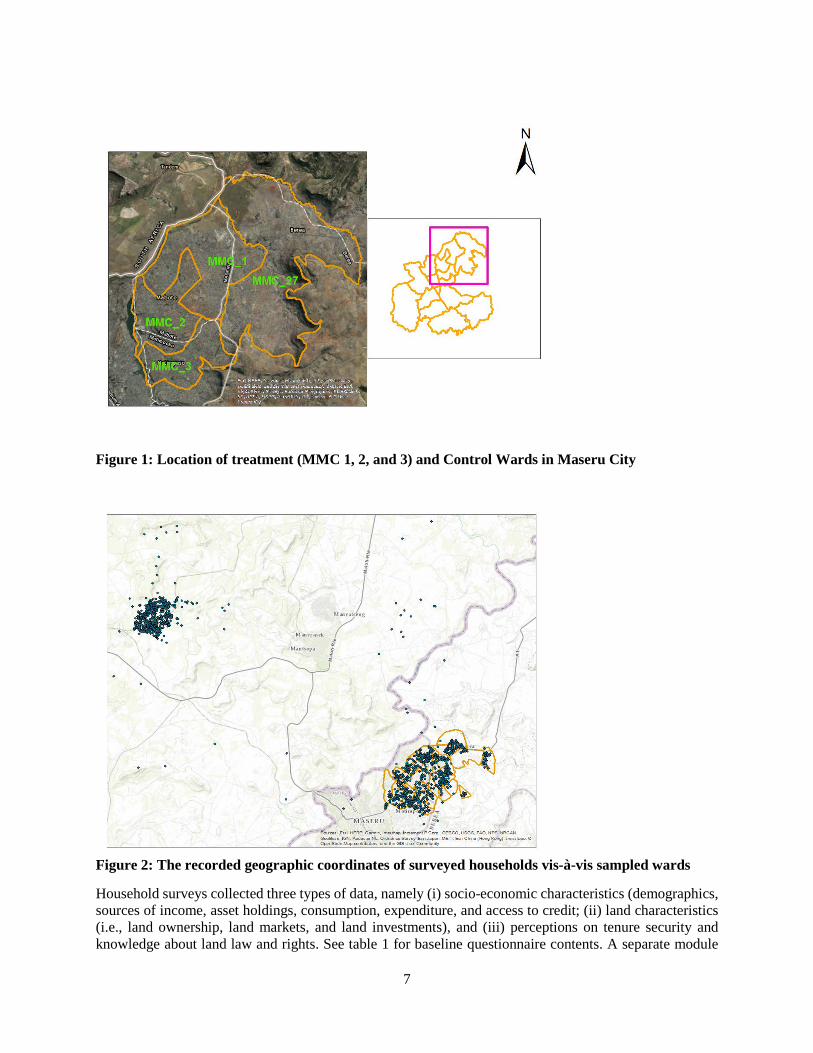
The baseline survey was carried out from March-June 2013 of 1904 households in 40 village clusters (28 treatment and 12 controls) across 4 Maseru Municipal Councils (MMCs), drawn from three treatment areas (MMC1, MMC2 and MMC3) that were supposed to receive leases and one control area (MMC27). Figure 1 shows the relative location of treatment and control wards within Maseru city, and appendix figures 1 – 4 show the sampled clusters in their respective wards. The survey data collection effort was conducted by T&T Geomatics and MASAZI Development Associates with technical support from MSU and funded by the Lesotho Millennium Challenge Account (MCA). There was a listing exercise to identify households for the sample, including ensuring a sufficient sample of parcels with commercial uses (10% of the sample) to allow analysis for commercial uses as well. This was especially important in Lesotho’s case as the focus was around removing constraints to private sector development. However, baseline data shows that only about 6% of the sampled households reported to have at least one parcel with commercial use (see appendix table 1). Although parcels were not mapped before the baseline survey, LARP systematically mapped and registered all parcels in treatment areas. In addition, geographic coordinates of all sampled households in the evaluation were recorded during the baseline survey, but there were errors in the coordinates collected by the evaluation firm. Specifically, the coordinates collected during the evaluation’s baseline survey show the position of about 50% the surveyed households in Maseru incorrectly being some 25 km away in South Africa (see figure 2).
3 See www.mcc.gov/ourimpact for the full impact evaluation design.
7
Figure 1: Location of treatment (MMC 1, 2, and 3) and Control Wards in Maseru City
Figure 2: The recorded geographic coordinates of surveyed households vis-à-vis sampled wards
Household surveys collected three types of data, namely (i) socio-economic characteristics (demographics, sources of income, asset holdings, consumption, expenditure, and access to credit; (ii) land characteristics (i.e., land ownership, land markets, and land investments), and (iii) perceptions on tenure security and knowledge about land law and rights. See table 1 for baseline questionnaire contents. A separate module
8
was supposed to capture women’s perceptions of tenure and knowledge in addition to the household head. However, data from female respondents are very limited -only 138 female respondents were interviewed and of these only 17 can be matched with a survey for which main household level data were collected. But the fact that more than 50% of the households in the overall sample were headed by women, who were the main respondents for the household survey, would at least allow comparison between male and female headed households.4 Following completion of the baseline, COWI/Orgut immediately started moving forward with LARP implementation, including calling for land documents and mapping land parcels in order to provide each parcel with a registered lease. Table 1: Baseline questionnaire topics
MODULE A – Head of the Household Question Number Consent Statement ‐‐ Household Identification A01‐A29 Eligibility Filter Questions for the Survey XX1‐XX3 List of Villages in Maseru Municipal Council 1, 2, 3 and 27 ‐‐ Household Members B00‐B19 Salaried Employment During the Last 12 Months C100‐C117 Self‐Employment Activities in the Past 12 Months C200‐C212 Transfers, Remittances and Pensions in the Past 12 Months C300‐C315 Inventory of Parcels D01‐D18 Characteristics of Parcels E01‐E37 Information on Parcel Acquisition, Documents and Land Value F00‐F34 Land Conflicts G00‐G17 Rights to the Land and Perception of Risks for Each Parcel Owned by the H h ld
H00‐H11 Parcels Rented Out / Lent to Others – Housing and Commercial Parcels I00‐I14 Parcels Rented In / Borrowed from Others J00‐J19 Investments on Land K00‐K48 Credit L01‐L31 Land Transfer: Land the Household Used to Own in the Last Three Years M01‐M15 Knowledge, Perception and Opinion About the Lease, Renting Land, Women’s
i h d N01‐N25
Consumption O01‐O07 Ownership of Assets P00‐O05 Monthly Expenditures Q100‐Q101 Expenses in the Last 12 Months Q200‐Q201 Sale of Household Goods in the Last 12 Months Q301‐Q302 MODULE B – Head Woman of the Household Question Number Consent Statement Respondent Information BA01‐BA07 Land Ownership by Women BB01‐BB17 Knowledge, Perceptions and Opinion About Land Issues – Women of the
h ld BN01‐BN20
As the data set MSU received from the survey firm in 2013 had many gaps and data matching issues, it was decided that the survey research unit at Michigan State University (MSU) re-enter data based on scanned copies of the completed questionnaires. The LARP baseline report is based on the dataset
4 Descriptive statistics show that a significantly percentage of male-headed household respondents were knowledgeable about lease than the respondents in the female-headed households (see Maredia et al. 2016).
9
compiled at MSU after this second re-entry. It provides a summary of the evaluation and household characteristics and illustrates the application of Propensity Score Matching technique to reduce sample bias and make households more comparable across treatment and control areas. Tests of correlation between household/parcel characteristics and the treatment/outcome variables are also presented to examine some of the underlying assumptions of the LARP project logic.5
To effectively utilize the available baseline data and harness the rich administrative data in measuring outcomes that would otherwise not possible, the endline evaluation has two main components: (i) an impact evaluation of the systematic land registration and certification mainly focusing on capturing changes in perceptions of tenure security, conflicts, land investment and land values differentiated by gender, mode of acquisition of registered land rights and land use (commercial and residential); and (ii) a performance evaluation of LARP legal and regulatory reforms, institutional strengthening and public awareness building on land governance and administration of land rights in Lesotho, specifically assessing changes in amount of time and cost to conduct a land transaction and confidence in the land governance system, as well as related changes in demand and volume for formal land transactions and similar effects on mortgages, property development investment, land utilization and urban development.
3.2 Impact Evaluation Design: Challenges encountered and measures taken in response
By the time the poor quality of the baseline survey of the original design was discovered, all of Maseru city council had already been designated as intervention area and, in fact, implementation had already started in all areas except in MMC 1, 2, 3 and 27. As discussed, the poor quality of the baseline survey of the original design was not known before early 2013. It was thus impossible to assign some villages within Maseru city as treatment and control villages once failure of the original RCT design became evident. An agreement was, however, reached to exclude one of Maseru’s Municipal Councils (MMC) from the regularization plan for at least 3 years. MMC 27, a peri-urban area located in the north-east tip of Maseru city, was thus designated as the control/comparison group. The neighboring villages in MMC 1, 2, and 3 that were not yet regularized were assigned as treatment areas for the impact evaluation. The list of the study villages in the treatment and control areas are given in table 2, and the location of the sub-villages (clusters) are given in appendix figures 1-4.
A two-stage cluster sampling design was used to select the sampled households. The sample size was determined after statistical power calculation assuming: (i) a power of 80% (a statistical significance level of 5%), (ii) the proportion of sampled households to treatment group being 70%, and (iii) a minimum detectable effect size (MDES) of 35% which is between small and medium effect size in the literature (for the details see Maredia et al. 2016). The estimated minimum sample size was 40 clusters with 40 observations per cluster. To account for attrition and non-response rate the number of observations per cluster were increased by 5, resulting in a total sample size of 1,800 households (eventually, 1,904 households were interviewed). To meet the minimum number of cluster requirement, the sampled treatment and control villages were further subdivided into 28 and 12 sub-villages (clusters); respectively, with roughly about 100 households in each cluster (see appendix figures 1-4).
Table 2: List of treatment and control villages
Treatment Villages Control Villages MMC01 Boiketlo MMC27 Ha Foso MMC01 Kuroane MMC27 Ikheteleng MMC01 Le-coop MMC27 Khopane MMC01 Pecha MMC27 Koalabata MMC01 Phomolong MMC27 Marabeng
5 The full evaluation baseline report (Maredia et al. 2016) can be found online at www.mcc.gov/ourimpact.

10
MMC01 Rasetimala MMC27 Sekhutlong MMC01 Selakhapane MMC01 Thoteng-Khubetsoana MMC02 Bochabela I MMC02 Bochabela II MMC02 Bochabela III MMC02 Lifelekoaneng-Mabote MMC02 Mapaleng-Mabote MMC02 Maqalika MMC02 Phahameng-Khubetsoana MMC02 Phpoletsa-Mabote MMC02 Rural MMC02 Sebaboleng MMC02 Taung-Mabote MMC02 Thoteng-Mabote MMC03 Naleli-Tsosane MMC03 Tsosane (part that is not regularized)
The impact evaluation strategy designed at baseline has several problems that need to be addressed for any results derived from an end-line survey to be credible. The main ones are: (i) non-comparability of treatment and control areas; (ii) implementation of similar interventions in the control areas; and (iii) little consideration of information spillovers. All these could potentially introduce substantial bias in any post-program differences in outcome variables, and hence the sources, potential magnitudes and implications as well as proposed adaptation to the design are discussed below.
Non-comparability: As intervention placement was non-random, limited comparability between treatment and control groups prior to the intervention could be a cause for considerable bias in any effort to identify post-program differences. This is particularly relevant because MMC27, located in the north-eastern fringe of Maseru city, was the only viable area left to serve as a control group when failure of the RCT became apparent.6 Some obvious differences are that the ‘control area’ (MMC 27) was (i) less developed and less densely populated with larger parcel sizes; and (ii) had more agricultural fields mixed with residential parcels with greater potential for expansion in property and housing developments than the adjacent treatment areas (MMC1, 2 and 3).7
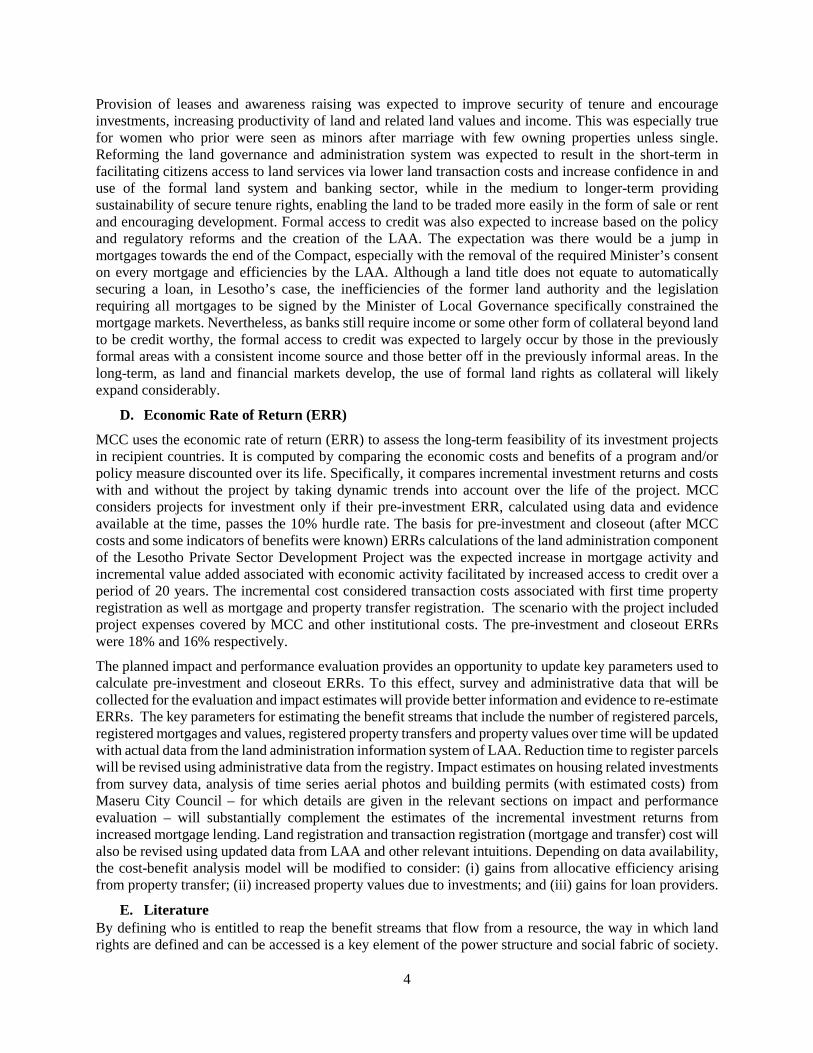
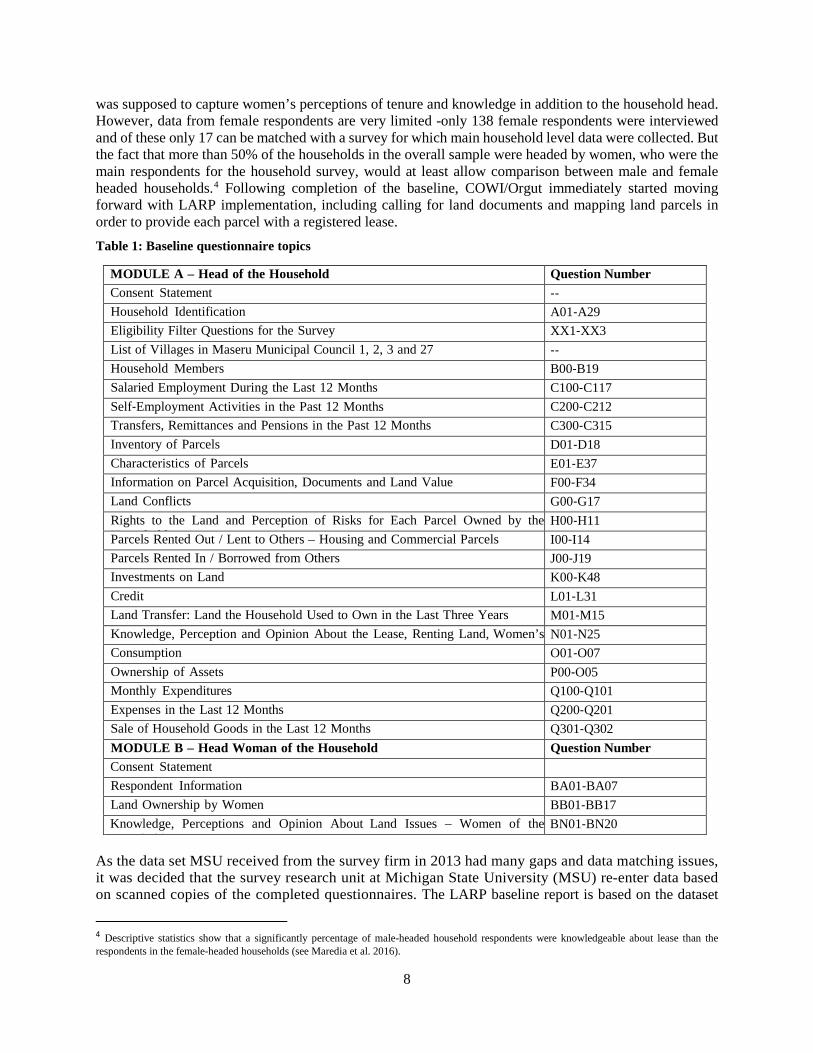
Intervention like Land Tenure Regularization (LTR) in the control area: To address informal subdivision of agricultural fields, Maseru City Council started implementation of a planning and surveying exercise in parts of the control area in late 2016/early 2017, i.e. about 3 years after the baseline survey had been conducted. A layout plan for about 1,900 parcels was prepared (see figure 3) and 900 of these were fully surveyed. Owners pay a subsidized fee of Maloti 950 for the parcel survey and a lease document processing fee of Maloti 290. While this contrasts to free provision of these services under LTR, the intervention by Maseru City Council has implication for the design of the follow survey and the survey instruments particularly on the reference period of retrospective questions (such investment on land and housing).
6 MMC 27 was chosen as a control because MMC 1, 2 and 3 had already been gazetted and were in the pipeline for the workplan of implementation. 7 During a field visit of treatment and control areas and discussion with relevant stakeholders in late August 2018, the impact evaluation team observed the following changes: (i) significant new property developments particularly in control areas; (ii) new business developments on the road side dividing treatment and control areas; (iii) investment in service quarters that will be used for rental purposes; and (iv) investment in VIP toilets supported by NGOs and Government. It was also noted during the field visit that expected road construction that cuts across (which was under construction at the time of the field visit) might have contributed to the expansion of property development in the control area.
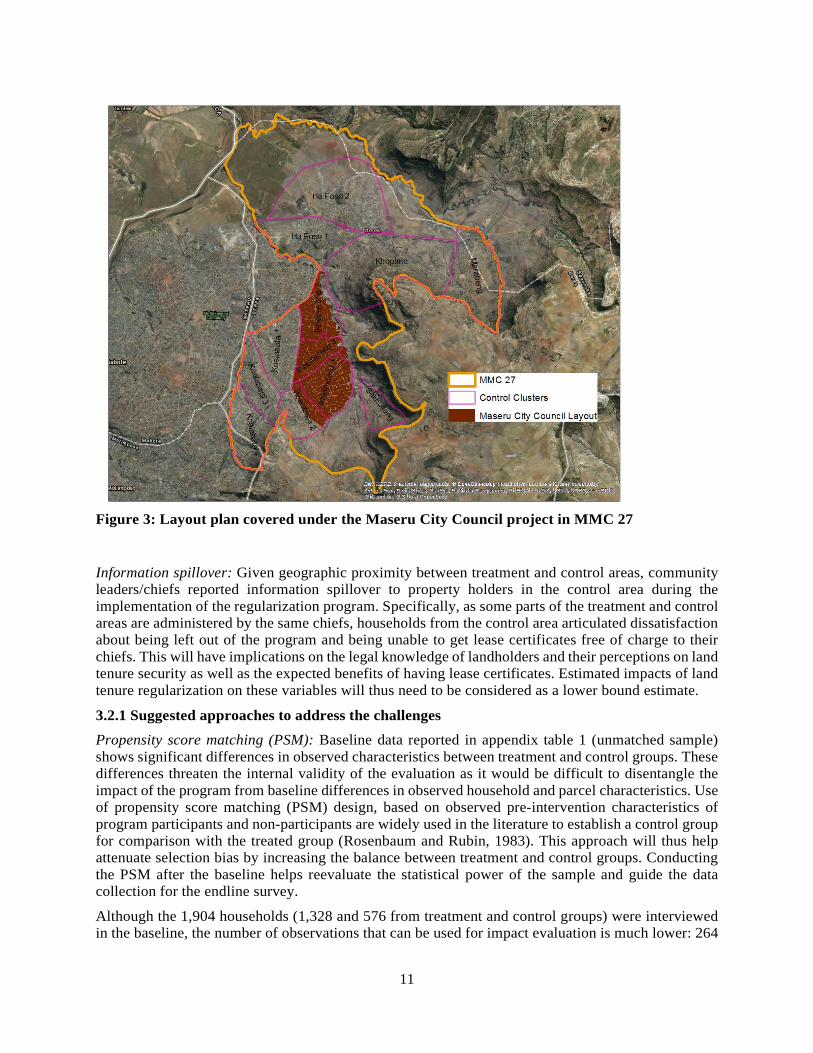
11
Figure 3: Layout plan covered under the Maseru City Council project in MMC 27
Information spillover: Given geographic proximity between treatment and control areas, community leaders/chiefs reported information spillover to property holders in the control area during the implementation of the regularization program. Specifically, as some parts of the treatment and control areas are administered by the same chiefs, households from the control area articulated dissatisfaction about being left out of the program and being unable to get lease certificates free of charge to their chiefs. This will have implications on the legal knowledge of landholders and their perceptions on land tenure security as well as the expected benefits of having lease certificates. Estimated impacts of land tenure regularization on these variables will thus need to be considered as a lower bound estimate.
3.2.1 Suggested approaches to address the challenges
Propensity score matching (PSM): Baseline data reported in appendix table 1 (unmatched sample) shows significant differences in observed characteristics between treatment and control groups. These differences threaten the internal validity of the evaluation as it would be difficult to disentangle the impact of the program from baseline differences in observed household and parcel characteristics. Use of propensity score matching (PSM) design, based on observed pre-intervention characteristics of program participants and non-participants are widely used in the literature to establish a control group for comparison with the treated group (Rosenbaum and Rubin, 1983). This approach will thus help attenuate selection bias by increasing the balance between treatment and control groups. Conducting the PSM after the baseline helps reevaluate the statistical power of the sample and guide the data collection for the endline survey.
Although the 1,904 households (1,328 and 576 from treatment and control groups) were interviewed in the baseline, the number of observations that can be used for impact evaluation is much lower: 264
12
households from the treatment and 31 households from the control group already had lease certificates for their properties at the time of the baseline survey. High levels of missing observations for critical covariates or outcome variables at baseline further reduce the number of valid observations available for analysis. Overall, after dropping households with lease certificates and those with missing data, only 1,418 households (931 from treatment and 487 from control) with valid observations remain for the estimation of the PSM model.
The matching exercise is done at the household level, and covariates at the parcel and individual level are aggregated at the household level. The 5-nearest neighbors matching model was estimated using the STATA program psmatch2. As appendix table 1 illustrates, many observable characteristics at individual, household and parcel level (50 covariates in total) can help capture observed differences between treatment and control groups. The results of the matching exercise consisting of mean values, standardized percentage bias8, t-value and t-test for the treatment and control group using matched and unmatched sample as well as the standardized percentage reduction in bias between the matched and unmatched sample are displayed in appendix table 1. The distributions of propensity scores estimated based on the model are reported in appendix figures 5 and 6 respectively with and without unmatched observations. Overall, there are 108 off-support treated households and 35 unmatched control households with the 5-nearest neighbor matching criteria. The total matched sample size is thus 1,275 households (823 treatment and 452 control households).
After matching, the two groups are better balanced with respect to almost all the observed covariates included in the analysis except for two sets of variables, i.e., age of household head and past and expected land related disputes where mean differences; albeit, lower, are still statistically significant at 5% level (appendix table 1). In general, as shown in appendix table 2, the matching resulted in covariate balance, reducing the mean (median) percentage bias from 14.8 (13.4) to 5.2 (4.1). Furthermore, the distribution of the standardized percentage bias across covariates using histograms (appendix figure 7) shows that the bias concentrated around zero for the matched sample while it is widely spread for the unmatched sample.
A key question is whether the matched sample size is large enough to detect meaningful program impacts on key outcome variables. Critical assessment of this issue requires statistical power calculation using parameters estimated from the baseline data and the matched sample. The parameters consist of: (i) 40 clusters (28 treatment and 12 controls); (ii) matched sample size of 1,275 households; and (iii) 31.875 average number of households per cluster, 122.4 individuals with valid employment questions per cluster and 38.825 parcels of land per cluster. Outcome variables at the household, individual and parcel level are considered for the analysis. Assuming 80% statistical power and estimated mean, standard deviation and intra-class correlation coefficient from the baseline data, table 3 reports the minimum detectable effects (also in percentage points) generated using STATA program clsampsi for proportions (i.e., statistical power calculation for comparing two mean or proportions in the presence of clustering).
Estimated minimum detectable effects at 80% of statistical power for the variables of interest imply that the assumptions underlying the baseline survey (i.e., mean detectable effects of 35%) were too optimistic and cannot be achieved with the sample after matching. Except for wage employment at the individual level (25%), estimated minimum detectable effects range between 50% (for constructing new buildings over a period of three years) and 150% (for applying loan over a period of 12 months). As means for all of these variables of interest are very low to start with (most close to 10%), such effect sizes are more modest in terms of absolute numbers with required changes to achieve the estimated MDES are all below 10-15 percentage points. Yet, relying on this design alone, which is likely to be further compromised by attrition, might not be sufficient and it needs to be complemented
8 The standardized percentage bias is the percentage difference of the sample means in the treatment and control group (unmatched or matched) sub-samples as a percentage of the square root of the average of the sample variances in the treatment and control groups (see Rosenbaum and Rubin, 1985).
13
with approaches that would address data related issues as well as the potential contamination due to the implementation of a similar program in some parts of the control area by Maseru City Council and/or take-up through a sporadic process in the control area. For instance, assuming a 10% to 30% (reasonable estimate based on administrative data) take up rate in the control area through a sporadic titling process would increase the minimum detectable effects by about 11% to 43% (see table 3) to maintain the 80% statistical power.
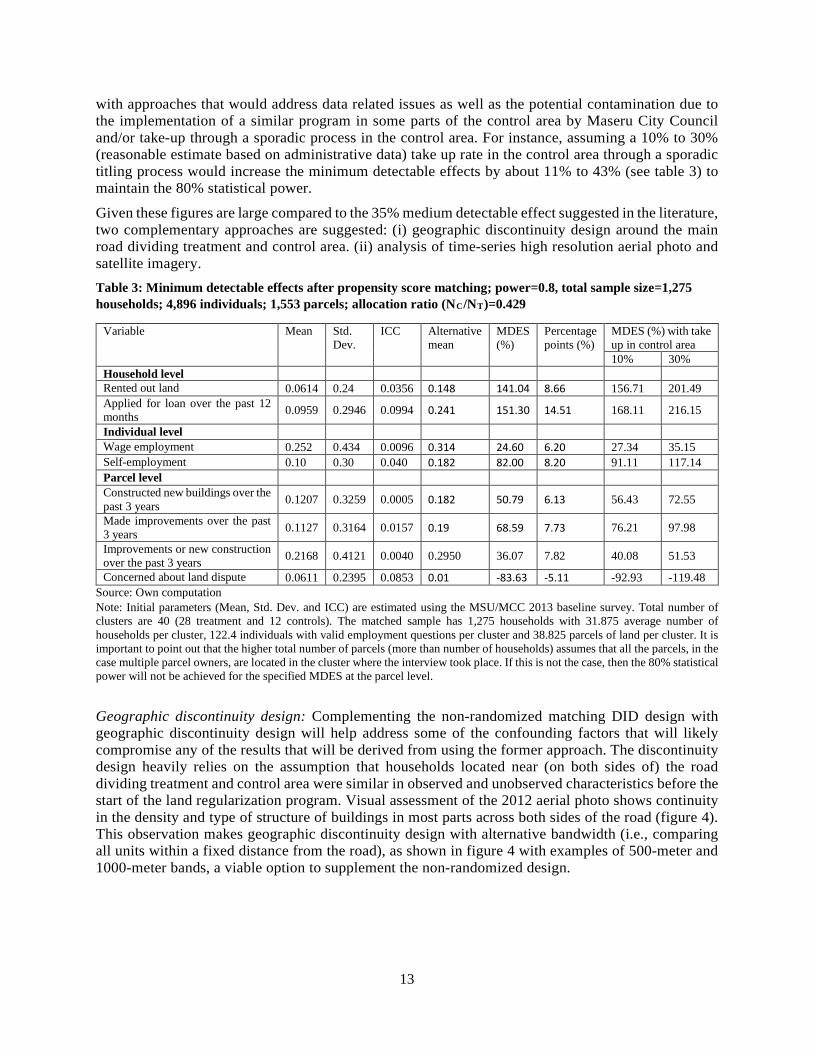
Given these figures are large compared to the 35% medium detectable effect suggested in the literature, two complementary approaches are suggested: (i) geographic discontinuity design around the main road dividing treatment and control area. (ii) analysis of time-series high resolution aerial photo and satellite imagery. Table 3: Minimum detectable effects after propensity score matching; power=0.8, total sample size=1,275 households; 4,896 individuals; 1,553 parcels; allocation ratio (NC/NT)=0.429
Variable Mean Std. Dev.
ICC Alternative mean
MDES (%)
Percentage points (%)
MDES (%) with take up in control area 10% 30%
Household level Rented out land 0.0614 0.24 0.0356 0.148 141.04 8.66 156.71 201.49 Applied for loan over the past 12 months 0.0959 0.2946 0.0994 0.241 151.30 14.51 168.11 216.15
Individual level Wage employment 0.252 0.434 0.0096 0.314 24.60 6.20 27.34 35.15 Self-employment 0.10 0.30 0.040 0.182 82.00 8.20 91.11 117.14 Parcel level Constructed new buildings over the past 3 years 0.1207 0.3259 0.0005 0.182 50.79 6.13 56.43 72.55
Made improvements over the past 3 years 0.1127 0.3164 0.0157 0.19 68.59 7.73 76.21 97.98
Improvements or new construction over the past 3 years 0.2168 0.4121 0.0040 0.2950 36.07 7.82 40.08 51.53
Concerned about land dispute 0.0611 0.2395 0.0853 0.01 -83.63 -5.11 -92.93 -119.48 Source: Own computation Note: Initial parameters (Mean, Std. Dev. and ICC) are estimated using the MSU/MCC 2013 baseline survey. Total number of clusters are 40 (28 treatment and 12 controls). The matched sample has 1,275 households with 31.875 average number of households per cluster, 122.4 individuals with valid employment questions per cluster and 38.825 parcels of land per cluster. It is important to point out that the higher total number of parcels (more than number of households) assumes that all the parcels, in the case multiple parcel owners, are located in the cluster where the interview took place. If this is not the case, then the 80% statistical power will not be achieved for the specified MDES at the parcel level.
Geographic discontinuity design: Complementing the non-randomized matching DID design with geographic discontinuity design will help address some of the confounding factors that will likely compromise any of the results that will be derived from using the former approach. The discontinuity design heavily relies on the assumption that households located near (on both sides of) the road dividing treatment and control area were similar in observed and unobserved characteristics before the start of the land regularization program. Visual assessment of the 2012 aerial photo shows continuity in the density and type of structure of buildings in most parts across both sides of the road (figure 4). This observation makes geographic discontinuity design with alternative bandwidth (i.e., comparing all units within a fixed distance from the road), as shown in figure 4 with examples of 500-meter and 1000-meter bands, a viable option to supplement the non-randomized design.
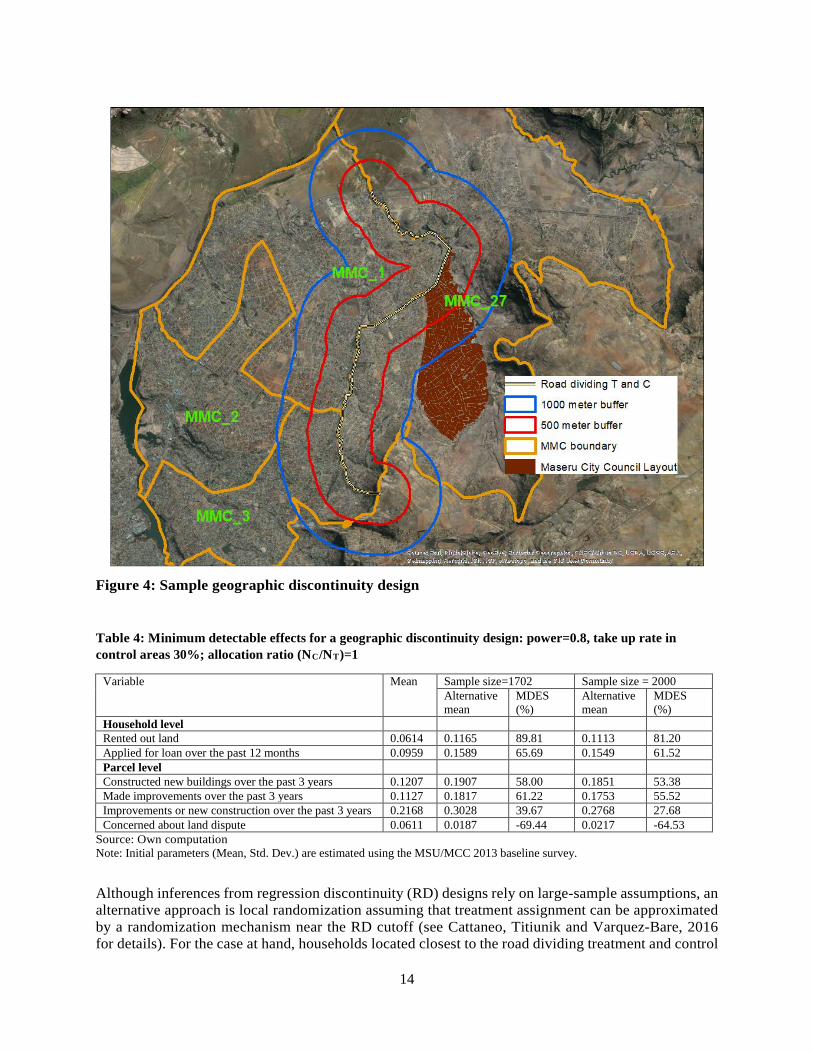
14
Figure 4: Sample geographic discontinuity design
Table 4: Minimum detectable effects for a geographic discontinuity design: power=0.8, take up rate in control areas 30%; allocation ratio (NC/NT)=1
Variable Mean Sample size=1702 Sample size = 2000 Alternative mean
MDES (%)
Alternative mean
MDES (%)
Household level Rented out land 0.0614 0.1165 89.81 0.1113 81.20 Applied for loan over the past 12 months 0.0959 0.1589 65.69 0.1549 61.52 Parcel level Constructed new buildings over the past 3 years 0.1207 0.1907 58.00 0.1851 53.38 Made improvements over the past 3 years 0.1127 0.1817 61.22 0.1753 55.52 Improvements or new construction over the past 3 years 0.2168 0.3028 39.67 0.2768 27.68 Concerned about land dispute 0.0611 0.0187 -69.44 0.0217 -64.53
Source: Own computation Note: Initial parameters (Mean, Std. Dev.) are estimated using the MSU/MCC 2013 baseline survey.
Although inferences from regression discontinuity (RD) designs rely on large-sample assumptions, an alternative approach is local randomization assuming that treatment assignment can be approximated by a randomization mechanism near the RD cutoff (see Cattaneo, Titiunik and Varquez-Bare, 2016 for details). For the case at hand, households located closest to the road dividing treatment and control
15
area can be considered as being part of a local randomized experiment. Administrative data show that there are close to 1200 parcels that were under LARP in the treated 500m band from the road. Assuming continuity in settlement in the corresponding part of the control area points towards a rate of contamination of 10% (for sporadic processes) and 30% (for the 2016 layout plan and surveying exercise by Maseru City Council). Using the most conservative assumption (i.e., 30% take up rate in control area) and a local randomized trial within a band of 500 meter, the results of the power calculation using the STATA program sampsi for proportions are given in table 4. For a total sample size of 1702 or 2000, the minimum detectable effects, on average, will be 40% or 50% less than that required for the matching design as displayed in table 3. This suggests that a complete census of households within 500-meter band of the road dividing treatment and control area can provide a sample size large enough to detect meaningful impacts of the program.
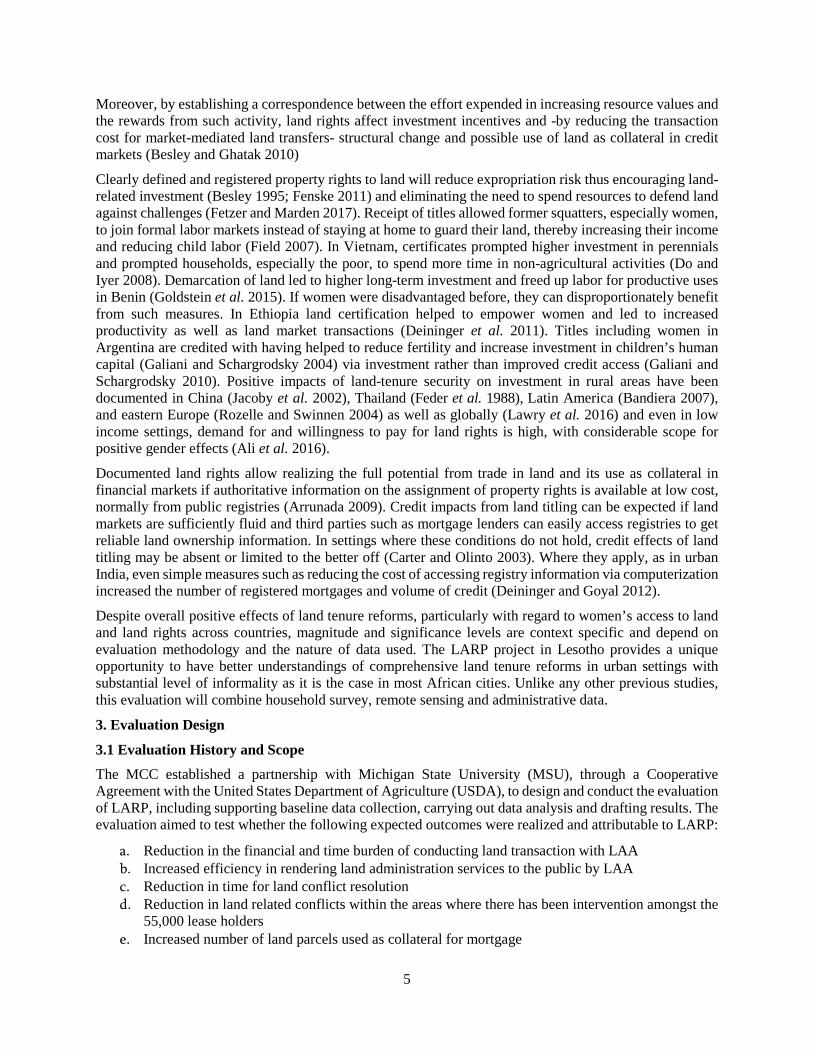
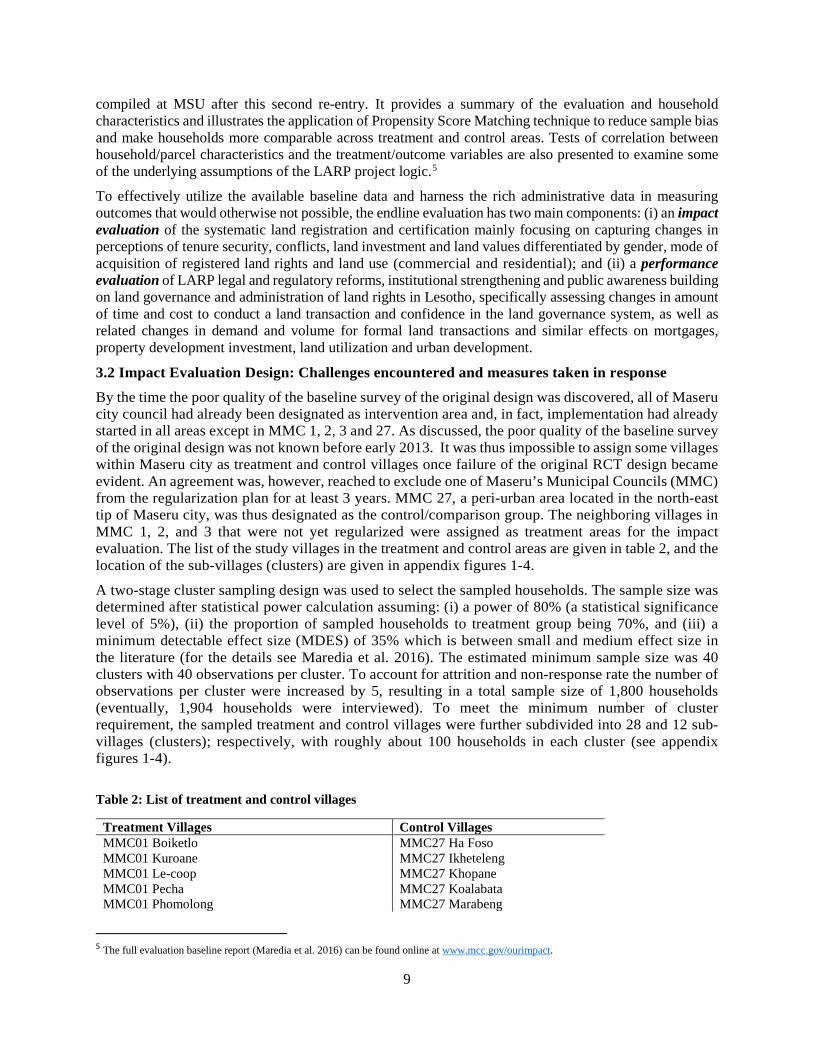
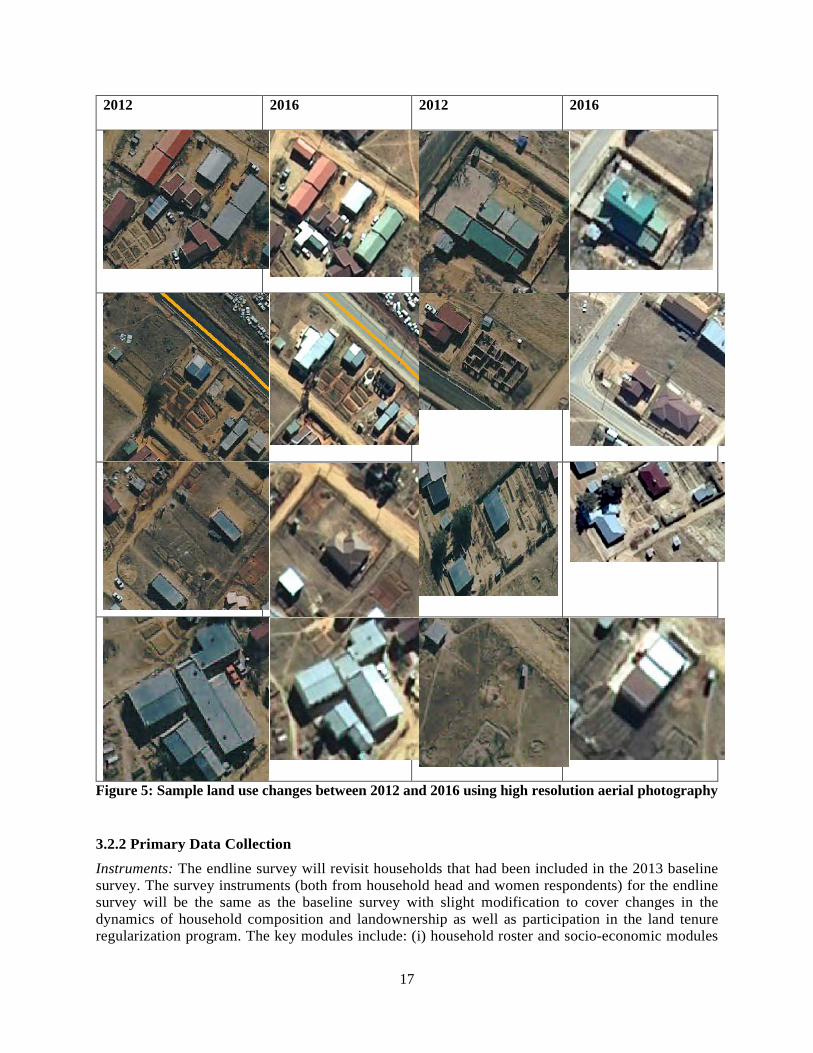
Analysis of time series aerial photos: High resolution aerial photography of our area of interest are available for two years covering pre-program (2012) and post-program (2016) period. This approach will allow identification of land use changes with a focus on changes in built-up area and possibly building characteristics (e.g. better roofs or pavement of walkways and yards) in treatment and control area. Figure 5 depicts examples of the type changes (based on 2012 and 2016 photos) that can be easily detected using aerial photography: (i) changes in roof types (color or shape); (ii) expansion of built-up area; (iii) construction of new houses (either after demolishing existing structure or conversion of vacant plots); and (iv) completing unfinished structures. While the usual approach is to use hand labelling of different land use classes (including roof type and color) to generate training data for machine learning, the limited size of our area of interest implies that full hand labeling for treatment and control is feasible to provide a reliable classification of land use change in the period of interest.
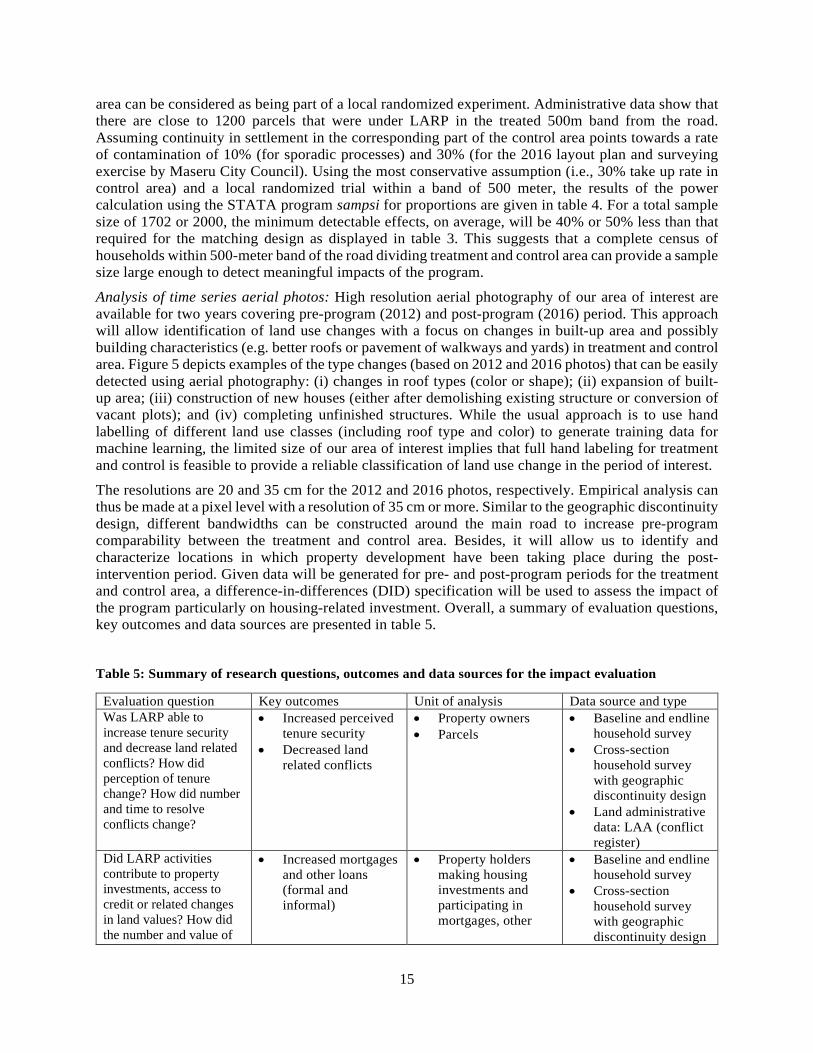
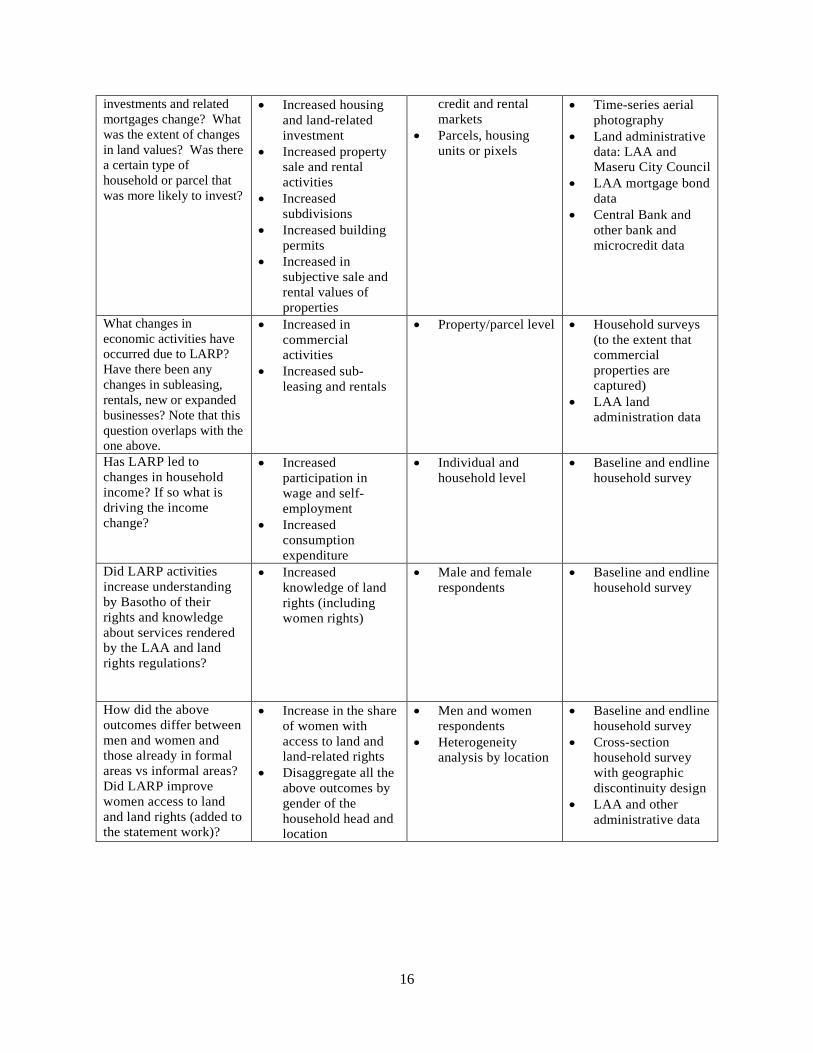
The resolutions are 20 and 35 cm for the 2012 and 2016 photos, respectively. Empirical analysis can thus be made at a pixel level with a resolution of 35 cm or more. Similar to the geographic discontinuity design, different bandwidths can be constructed around the main road to increase pre-program comparability between the treatment and control area. Besides, it will allow us to identify and characterize locations in which property development have been taking place during the post-intervention period. Given data will be generated for pre- and post-program periods for the treatment and control area, a difference-in-differences (DID) specification will be used to assess the impact of the program particularly on housing-related investment. Overall, a summary of evaluation questions, key outcomes and data sources are presented in table 5.
Table 5: Summary of research questions, outcomes and data sources for the impact evaluation
Evaluation question Key outcomes Unit of analysis Data source and type Was LARP able to increase tenure security and decrease land related conflicts? How did perception of tenure change? How did number and time to resolve conflicts change?
• Increased perceived tenure security
• Decreased land related conflicts
• Property owners • Parcels
• Baseline and endline household survey
• Cross-section household survey with geographic discontinuity design
• Land administrative data: LAA (conflict register)
Did LARP activities contribute to property investments, access to credit or related changes in land values? How did the number and value of
• Increased mortgages and other loans (formal and informal)
• Property holders making housing investments and participating in mortgages, other
• Baseline and endline household survey
• Cross-section household survey with geographic discontinuity design
16
investments and related mortgages change? What was the extent of changes in land values? Was there a certain type of household or parcel that was more likely to invest?
• Increased housing and land-related investment
• Increased property sale and rental activities
• Increased subdivisions
• Increased building permits
• Increased in subjective sale and rental values of properties
credit and rental markets
• Parcels, housing units or pixels
• Time-series aerial photography
• Land administrative data: LAA and Maseru City Council
• LAA mortgage bond data
• Central Bank and other bank and microcredit data
What changes in economic activities have occurred due to LARP? Have there been any changes in subleasing, rentals, new or expanded businesses? Note that this question overlaps with the one above.
• Increased in commercial activities
• Increased sub-leasing and rentals
• Property/parcel level • Household surveys (to the extent that commercial properties are captured)
• LAA land administration data
Has LARP led to changes in household income? If so what is driving the income change?
• Increased participation in wage and self-employment
• Increased consumption expenditure
• Individual and household level
• Baseline and endline household survey
Did LARP activities increase understanding by Basotho of their rights and knowledge about services rendered by the LAA and land rights regulations?
• Increased knowledge of land rights (including women rights)
• Male and female respondents
• Baseline and endline household survey
How did the above outcomes differ between men and women and those already in formal areas vs informal areas? Did LARP improve women access to land and land rights (added to the statement work)?
• Increase in the share of women with access to land and land-related rights
• Disaggregate all the above outcomes by gender of the household head and location
• Men and women respondents
• Heterogeneity analysis by location
• Baseline and endline household survey
• Cross-section household survey with geographic discontinuity design
• LAA and other administrative data
17
2012 2016 2012
2016
Figure 5: Sample land use changes between 2012 and 2016 using high resolution aerial photography
3.2.2 Primary Data Collection
Instruments: The endline survey will revisit households that had been included in the 2013 baseline survey. The survey instruments (both from household head and women respondents) for the endline survey will be the same as the baseline survey with slight modification to cover changes in the dynamics of household composition and landownership as well as participation in the land tenure regularization program. The key modules include: (i) household roster and socio-economic modules

18
including individual level demographics, education and health; (ii) household economy modules including income (wage and self-employment), consumption expenditure, household and business assets, transfers and remittances; (iii) perception and legal knowledge about lease, rental activities and women’s rights and institutional arrangements; (iv) credit and loan modules including access and amount of credit received; and (v) land modules consisting of parcel roster, legal documentation, subjective sales and rental values, participation in mortgages, land rights, disputes, housing and land-related investments. Data on legal knowledge and women’s access to land and land-rights will be collected separately from household head and women respondents. The content of endline survey instruments is presented in table 6. A short version of the endline survey instruments with a focus on housing and land-related investments will be administered for the geographic discontinuity design. Computer Assisted Personal Interviewing (CAPI) will be used to collect data. The preferred software is Survey Solutions developed by the data group of the World Bank.
Table 6: Table of content of the endline survey instruments
Section Title Question # MODULE A – Head of the Household -- Consent Statement -- A Household Identification A01-A29 -- List of Villages in Maseru Municipal Council 1, 2, 3 and 27 -- B, B1 Household Members at Baseline/New Members B00-B19 C1 Salaried Employment During the Last 12 Months C100-C117 C2 Self-Employment Activities in the Past 12 Months C200-C212 C3 Transfers, Remittances and Pensions in the Past 12 Months C300-C315 D4/D4A Parcel Roster at Baseline and New Parcels D08a-D27 E Characteristics of Parcels E01-E37 F Information on Parcel Documents, Land Value and Rental F00-F43 G Land Conflicts G00-G17 H Rights to the Land and Perception of Risks for Each Parcel Owned by the Household H00-H11 K Investments on Land K00-K48 J Parcels Rented In / Borrowed from Others J00-J19 L Credit L01-L31 N Knowledge, Perception and Opinion About the Lease, Renting Land, Women’s
Rights and LAA N01-N25
O Consumption O01-O07 P Ownership of Assets P00-O05 Q1 Monthly Expenditures Q100-Q101 Q2 Expenses in the Last 12 Months Q200-Q201 Q3 Sale of Household Goods in the Last 12 Months Q301-Q302 MODULE B – Head Woman of the Household -- Consent Statement -- BB Land Ownership by Women BB01-BB17 BN Knowledge, Perceptions and Opinion about Land Issues – Women of the Household BN01-BN20
Rounds and timing: The baseline survey was conducted in March-June 2013. The endline survey will be administered in January-March 2019, roughly about 5 years after the baseline and the implementation of the program in the treatment areas. To maintain data comparability, the same reference periods will be used across the two rounds for each specific module.
Staff: A data collection firm will be hired through a competitive bid process. The minimum required qualification of the firm includes experience in administering large and complex household surveys, and the use of CAPI for data collection in such type of surveys. The World Bank research team,
19
coordinating the overall evaluation, will collaborate with two academic staff from the National University of Lesotho to complement local knowledge as well as substantially increase country presence in effectively monitoring and supervising the firm conducting the household surveys.
Data processing: All primary data will be electronically collected using Survey Solutions deployed on a highly secure World Bank Cloud with geographic questions capable of capturing parcel boundaries using high resolution imagery as a basemap. Survey Solutions, by combining the interviewing component (including quality controls and checks in the form of enabling and validating conditions) with a powerful survey management system, substantially improve data quality, speed up data availability and simplify survey coordination. The data management functionality of Survey Solutions seamlessly integrates interviewers (responsible for conducting the interview), supervisors (responsible for assigning interviews and controlling the quality of incoming data) and headquarter (responsible for overall coordination of the survey and high-level quality control). An interview will not be approved before it is thoroughly checked by supervisors and the headquarter team. Data will be captured using Android Tablets.
Data quality: Data quality is critical for meaningful and successful impact evaluation. Recognizing this fact, the World Bank research team will put in place all the necessary checks and quality controls at all levels from questionnaire design to availability of final data for analysis. The following key steps will be followed: (i) set up clear protocol for recruiting sufficient number of qualified field staff and field implementation procedure; (ii) make sure that the CAPI version of the questionnaire has all the appropriate range and consistency checks (with clear error messages and warnings) and fully tested under field conditions prior to the start of the actual field work; (iii) the World Bank research team and collaborating staff from the National University of Lesotho will participate in field staff training, monitoring and supervision of field work; (iv) make sure that member of the survey team (headquarter, supervisors and interviewers) have clear understating of their roles and responsibilities and that they strictly follow Survey Solutions data management protocol of rejecting and approving completed interviews on a timely fashion so that interviewers will make corrective measures, if necessary, while they are still in the field; and (v) the World Bank and the National University of Lesotho research team will further supervise the quality of the data using Survey Solutions tools and other statistical software in real time to make sure that survey protocols are strictly followed and necessary corrections are made without delays.
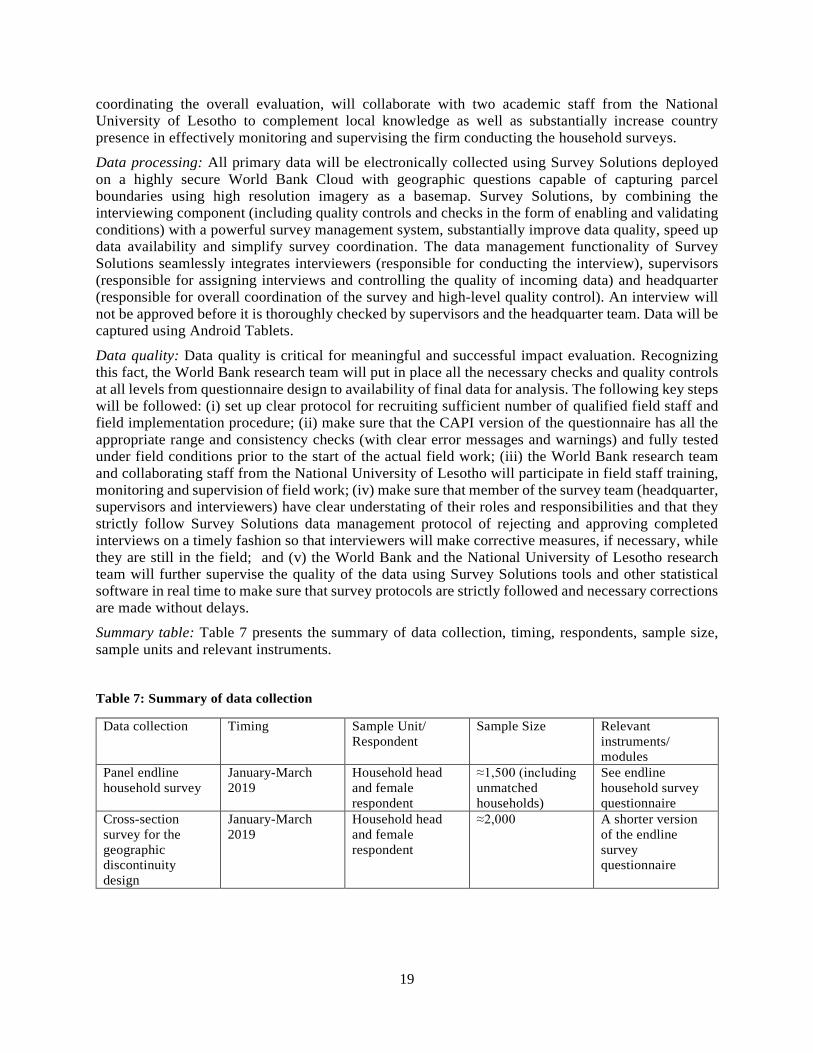
Summary table: Table 7 presents the summary of data collection, timing, respondents, sample size, sample units and relevant instruments.
Table 7: Summary of data collection
Data collection Timing Sample Unit/ Respondent
Sample Size Relevant instruments/ modules
Panel endline household survey
January-March 2019
Household head and female respondent
≈1,500 (including unmatched households)
See endline household survey questionnaire
Cross-section survey for the geographic discontinuity design
January-March 2019
Household head and female respondent
≈2,000 A shorter version of the endline survey questionnaire
20
3.2.3 Secondary Data
The research team has access to high resolution aerial photos taken in 2002 and 2016 covering the entire Maseru city. The images will be processed to extract information, at least, at a parcel level on: (i) changes built up area, (ii) changes in roof types, (iii) changes in investments such as fences and improvements to home access, and (iii) access to infrastructure.
3.2.4 Analysis Plan
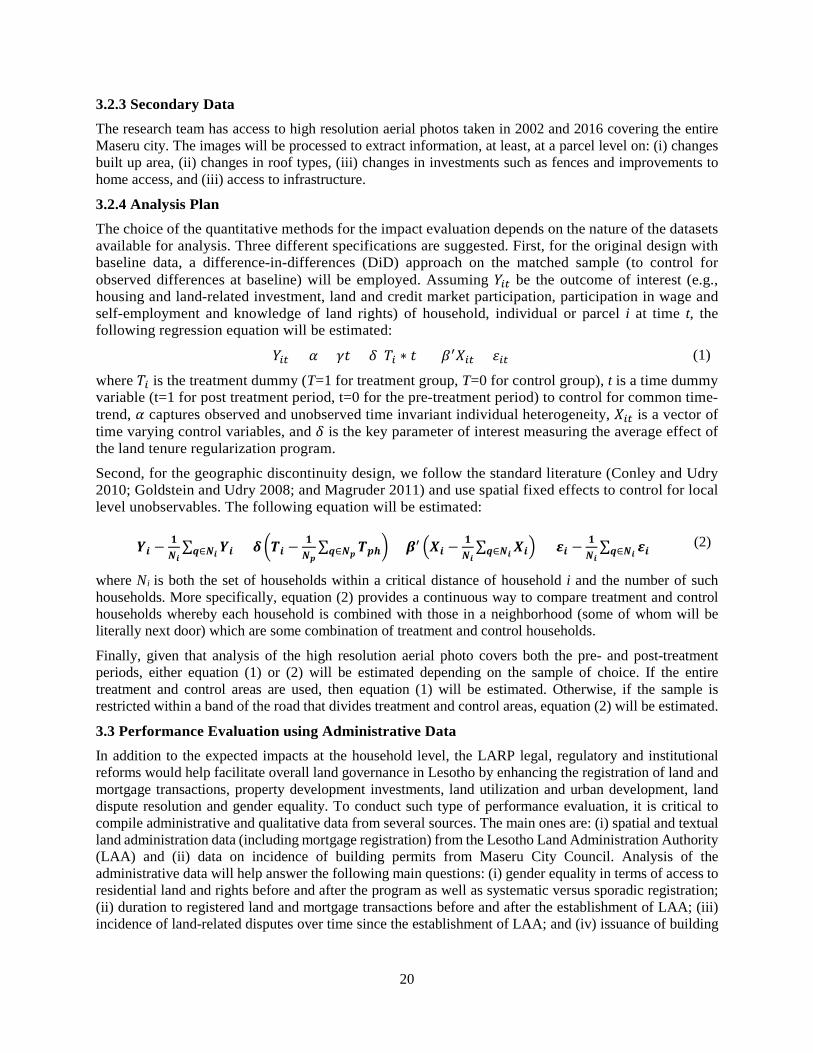
The choice of the quantitative methods for the impact evaluation depends on the nature of the datasets available for analysis. Three different specifications are suggested. First, for the original design with baseline data, a difference-in-differences (DiD) approach on the matched sample (to control for observed differences at baseline) will be employed. Assuming 𝑌𝑌𝑖𝑖𝑖𝑖 be the outcome of interest (e.g., housing and land-related investment, land and credit market participation, participation in wage and self-employment and knowledge of land rights) of household, individual or parcel i at time t, the following regression equation will be estimated:
𝑌𝑌𝑖𝑖𝑖𝑖 = 𝛼𝛼 + 𝛾𝛾𝛾𝛾 + 𝛿𝛿(𝑇𝑇𝑖𝑖 ∗ 𝛾𝛾) + 𝛽𝛽′𝑋𝑋𝑖𝑖𝑖𝑖 + 𝜀𝜀𝑖𝑖𝑖𝑖 (1)
where 𝑇𝑇𝑖𝑖 is the treatment dummy (T=1 for treatment group, T=0 for control group), t is a time dummy variable (t=1 for post treatment period, t=0 for the pre-treatment period) to control for common time-trend, 𝛼𝛼 captures observed and unobserved time invariant individual heterogeneity, 𝑋𝑋𝑖𝑖𝑖𝑖 is a vector of time varying control variables, and 𝛿𝛿 is the key parameter of interest measuring the average effect of the land tenure regularization program.
Second, for the geographic discontinuity design, we follow the standard literature (Conley and Udry 2010; Goldstein and Udry 2008; and Magruder 2011) and use spatial fixed effects to control for local level unobservables. The following equation will be estimated:
𝒀𝒀𝒊𝒊 −𝟏𝟏𝑵𝑵𝒊𝒊∑ 𝒀𝒀𝒊𝒊𝒒𝒒∈𝑵𝑵𝒊𝒊 = 𝜹𝜹�𝑻𝑻𝒊𝒊 −
𝟏𝟏𝑵𝑵𝒑𝒑∑ 𝑻𝑻𝒑𝒑𝒑𝒑𝒒𝒒∈𝑵𝑵𝒑𝒑 � + 𝜷𝜷′ �𝑿𝑿𝒊𝒊 −
𝟏𝟏𝑵𝑵𝒊𝒊∑ 𝑿𝑿𝒊𝒊𝒒𝒒∈𝑵𝑵𝒊𝒊 � + 𝜺𝜺𝒊𝒊 −
𝟏𝟏𝑵𝑵𝒊𝒊∑ 𝜺𝜺𝒊𝒊𝒒𝒒∈𝑵𝑵𝒊𝒊 (2)
where Ni is both the set of households within a critical distance of household i and the number of such households. More specifically, equation (2) provides a continuous way to compare treatment and control households whereby each household is combined with those in a neighborhood (some of whom will be literally next door) which are some combination of treatment and control households.
Finally, given that analysis of the high resolution aerial photo covers both the pre- and post-treatment periods, either equation (1) or (2) will be estimated depending on the sample of choice. If the entire treatment and control areas are used, then equation (1) will be estimated. Otherwise, if the sample is restricted within a band of the road that divides treatment and control areas, equation (2) will be estimated.
3.3 Performance Evaluation using Administrative Data
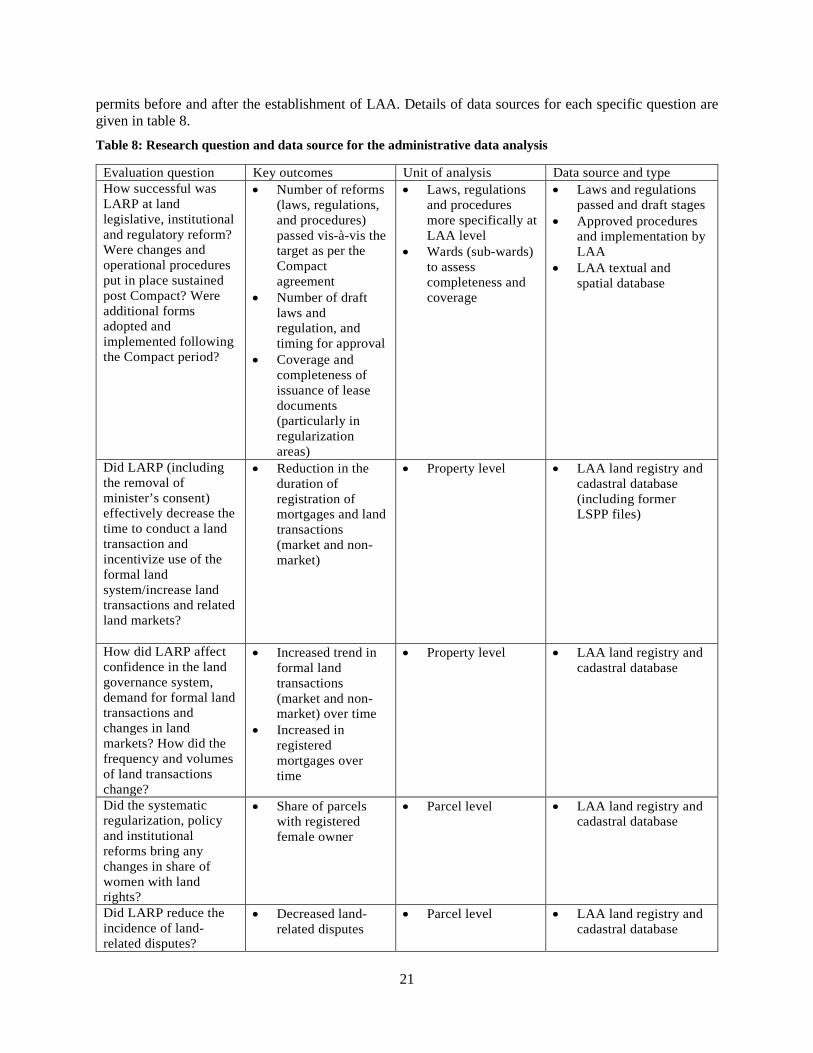
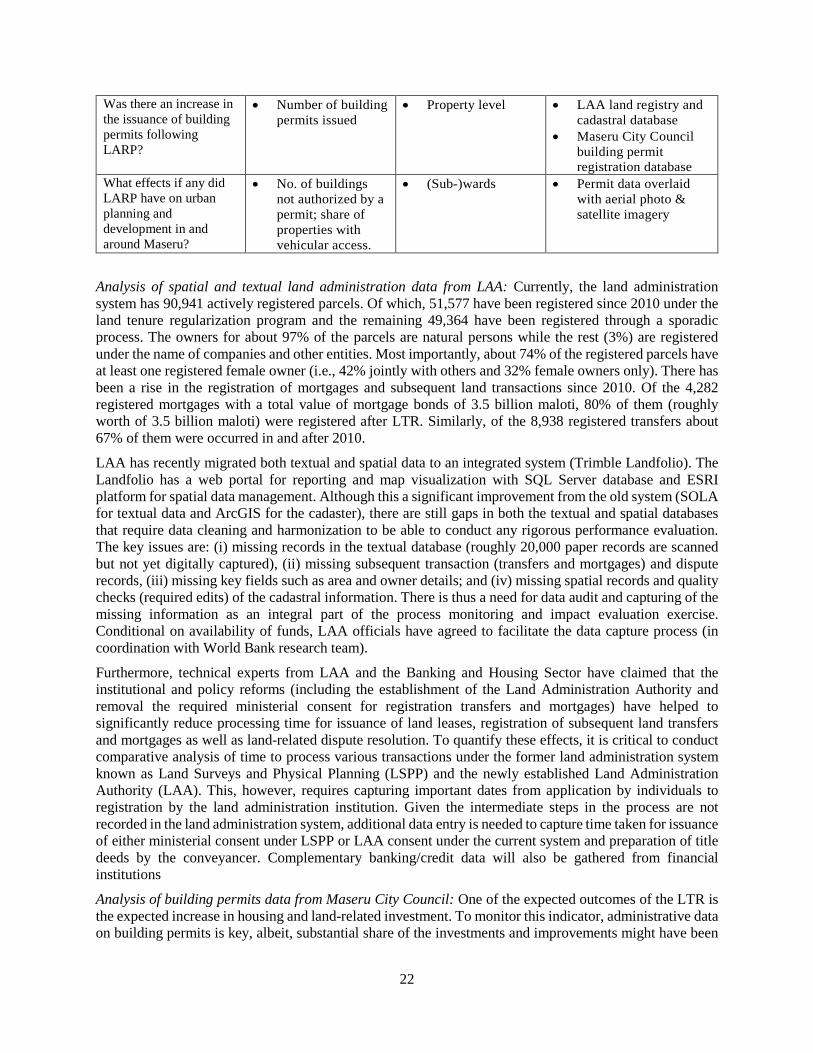
In addition to the expected impacts at the household level, the LARP legal, regulatory and institutional reforms would help facilitate overall land governance in Lesotho by enhancing the registration of land and mortgage transactions, property development investments, land utilization and urban development, land dispute resolution and gender equality. To conduct such type of performance evaluation, it is critical to compile administrative and qualitative data from several sources. The main ones are: (i) spatial and textual land administration data (including mortgage registration) from the Lesotho Land Administration Authority (LAA) and (ii) data on incidence of building permits from Maseru City Council. Analysis of the administrative data will help answer the following main questions: (i) gender equality in terms of access to residential land and rights before and after the program as well as systematic versus sporadic registration; (ii) duration to registered land and mortgage transactions before and after the establishment of LAA; (iii) incidence of land-related disputes over time since the establishment of LAA; and (iv) issuance of building
21
permits before and after the establishment of LAA. Details of data sources for each specific question are given in table 8. Table 8: Research question and data source for the administrative data analysis
Evaluation question Key outcomes Unit of analysis Data source and type How successful was LARP at land legislative, institutional and regulatory reform? Were changes and operational procedures put in place sustained post Compact? Were additional forms adopted and implemented following the Compact period?
• Number of reforms (laws, regulations, and procedures) passed vis-à-vis the target as per the Compact agreement
• Number of draft laws and regulation, and timing for approval
• Coverage and completeness of issuance of lease documents (particularly in regularization areas)
• Laws, regulations and procedures more specifically at LAA level
• Wards (sub-wards) to assess completeness and coverage
• Laws and regulations passed and draft stages
• Approved procedures and implementation by LAA
• LAA textual and spatial database
Did LARP (including the removal of minister’s consent) effectively decrease the time to conduct a land transaction and incentivize use of the formal land system/increase land transactions and related land markets?
• Reduction in the duration of registration of mortgages and land transactions (market and non-market)
• Property level • LAA land registry and cadastral database (including former LSPP files)
How did LARP affect confidence in the land governance system, demand for formal land transactions and changes in land markets? How did the frequency and volumes of land transactions change?
• Increased trend in formal land transactions (market and non-market) over time
• Increased in registered mortgages over time
• Property level • LAA land registry and cadastral database
Did the systematic regularization, policy and institutional reforms bring any changes in share of women with land rights?
• Share of parcels with registered female owner
• Parcel level • LAA land registry and cadastral database
Did LARP reduce the incidence of land-related disputes?
• Decreased land-related disputes
• Parcel level • LAA land registry and cadastral database
22
Was there an increase in the issuance of building permits following LARP?
• Number of building permits issued
• Property level • LAA land registry and cadastral database
• Maseru City Council building permit registration database
What effects if any did LARP have on urban planning and development in and around Maseru?
• No. of buildings not authorized by a permit; share of properties with vehicular access.
• (Sub-)wards • Permit data overlaid with aerial photo & satellite imagery
Analysis of spatial and textual land administration data from LAA: Currently, the land administration system has 90,941 actively registered parcels. Of which, 51,577 have been registered since 2010 under the land tenure regularization program and the remaining 49,364 have been registered through a sporadic process. The owners for about 97% of the parcels are natural persons while the rest (3%) are registered under the name of companies and other entities. Most importantly, about 74% of the registered parcels have at least one registered female owner (i.e., 42% jointly with others and 32% female owners only). There has been a rise in the registration of mortgages and subsequent land transactions since 2010. Of the 4,282 registered mortgages with a total value of mortgage bonds of 3.5 billion maloti, 80% of them (roughly worth of 3.5 billion maloti) were registered after LTR. Similarly, of the 8,938 registered transfers about 67% of them were occurred in and after 2010.
LAA has recently migrated both textual and spatial data to an integrated system (Trimble Landfolio). The Landfolio has a web portal for reporting and map visualization with SQL Server database and ESRI platform for spatial data management. Although this a significant improvement from the old system (SOLA for textual data and ArcGIS for the cadaster), there are still gaps in both the textual and spatial databases that require data cleaning and harmonization to be able to conduct any rigorous performance evaluation. The key issues are: (i) missing records in the textual database (roughly 20,000 paper records are scanned but not yet digitally captured), (ii) missing subsequent transaction (transfers and mortgages) and dispute records, (iii) missing key fields such as area and owner details; and (iv) missing spatial records and quality checks (required edits) of the cadastral information. There is thus a need for data audit and capturing of the missing information as an integral part of the process monitoring and impact evaluation exercise. Conditional on availability of funds, LAA officials have agreed to facilitate the data capture process (in coordination with World Bank research team).
Furthermore, technical experts from LAA and the Banking and Housing Sector have claimed that the institutional and policy reforms (including the establishment of the Land Administration Authority and removal the required ministerial consent for registration transfers and mortgages) have helped to significantly reduce processing time for issuance of land leases, registration of subsequent land transfers and mortgages as well as land-related dispute resolution. To quantify these effects, it is critical to conduct comparative analysis of time to process various transactions under the former land administration system known as Land Surveys and Physical Planning (LSPP) and the newly established Land Administration Authority (LAA). This, however, requires capturing important dates from application by individuals to registration by the land administration institution. Given the intermediate steps in the process are not recorded in the land administration system, additional data entry is needed to capture time taken for issuance of either ministerial consent under LSPP or LAA consent under the current system and preparation of title deeds by the conveyancer. Complementary banking/credit data will also be gathered from financial institutions
Analysis of building permits data from Maseru City Council: One of the expected outcomes of the LTR is the expected increase in housing and land-related investment. To monitor this indicator, administrative data on building permits is key, albeit, substantial share of the investments and improvements might have been
23
done without requesting official building permits. Maseru City Council with support from the World Bank has already established an electronic registration system since January 2017. The database consists of textual data (including the lease number that could be used to create the link with the land administration database and the estimated cost of the housing investment) and coordinates of the location where the investment would take place. Although this is a welcome development, most of the records are still on paper, and it is crucial to digitize the information to have a good understanding of the time trend (before and after LTR) as well as comparison of areas with and without the LTR program. If resources are available, Maseru City Council officials have agreed to facilitate the data capture process.
4. Administrative
IRB requirements and clearance: If IRB approval is needed for the endline and cross-section surveys, the World Bank team will prepare all the necessary materials (research protocol, data collection activities and survey instruments, and respondent consent statements) and will make sure all the activities meet the required ethical standards and the regulations of the government of Lesotho.
Data protection: Survey Solutions software will be used for data collection. It is hierarchical, and the database administrator and authorized users have distinct roles and responsibilities and their credentials are password protected. The administrator account will be held by the World Bank research team to make sure that completed interviews will not be damaged or deleted from the server. The administrator will also make sure that only authorized users will have access to data and reports. A password protected tablet will be assigned to each interviewer, and all the completed interviews will automatically be deleted from each tablet once it is synced to the secure server. Interviewers are expected to sync their tablets daily, and supervisors and the headquarter teams will take responsibilities to ensure that protocols are strictly followed.
Preparing data files for access, privacy and documentation: The research team will follow the World Bank as well as MCC guidelines to prepare data files for public access. Clean data in STAT format stripped of any individual identifiers will be accessed from the World Bank household survey data repository.
Dissemination plan: The World Bank research team will present the initial findings as well as final report of the impact and performance evaluation to MCC and stakeholders in Lesotho. The presentation of the initial findings will help to gather feedback from all the relevant stakeholders in preparation of the final report. In consultation with MCC and local stakeholders, the findings will be also presented in international conferences including the annual World Bank land and poverty conference. The World Bank also has a series of dissemination notes on promising innovative approaches in land policy and administration that are made available widely to the land policy community. Provided it is acceptable to MCC, some of the policy notes to be written to disseminate project results will be included in this series. A more technical version of the findings will be included in the World Bank policy working paper series and will eventually be published in academic journals.
Evaluation team roles and responsibilities: The core evaluation team includes: (i) Klaus Deininger (Lead Economist, World Bank) and Thea Hilhorst (Senior Land Specialist, World Bank) will serve as project directors providing leadership and overall guidance for all aspects of the project, (ii) Daniel Ali (Senior Economist, World Bank) will lead the impact and performance evaluation; (iii) Dr. Mamello Nchake and Dr. Ramaele Moshoeshoe (Lecturers, National University of Lesotho, Maseru) will serve as local coordinators to support the monitoring and supervision of data collection, cleaning, analysis and report writing, (iv) a competent firm will be hired to conduct the endline and the cross-section surveys, and (v) local data entry staff will be hired to electronically capture missing administrative data.
Evaluation timeline and reporting schedule: Table 9 summarizes the expected evaluation timeline and reporting schedule. Table 9: Evaluation timeline and reporting schedule

24
Year 2019 2020 Quarter 1 2 3 4 1 2 3 4 Primary data collection
Endline survey Cross-section survey
Secondary data collection Processing high resolution aerial photography Data capture of missing administrative data (LAA and Maseru City Council
Data cleaning and analysis (primary and secondary data)
First Draft Report Final Draft Report
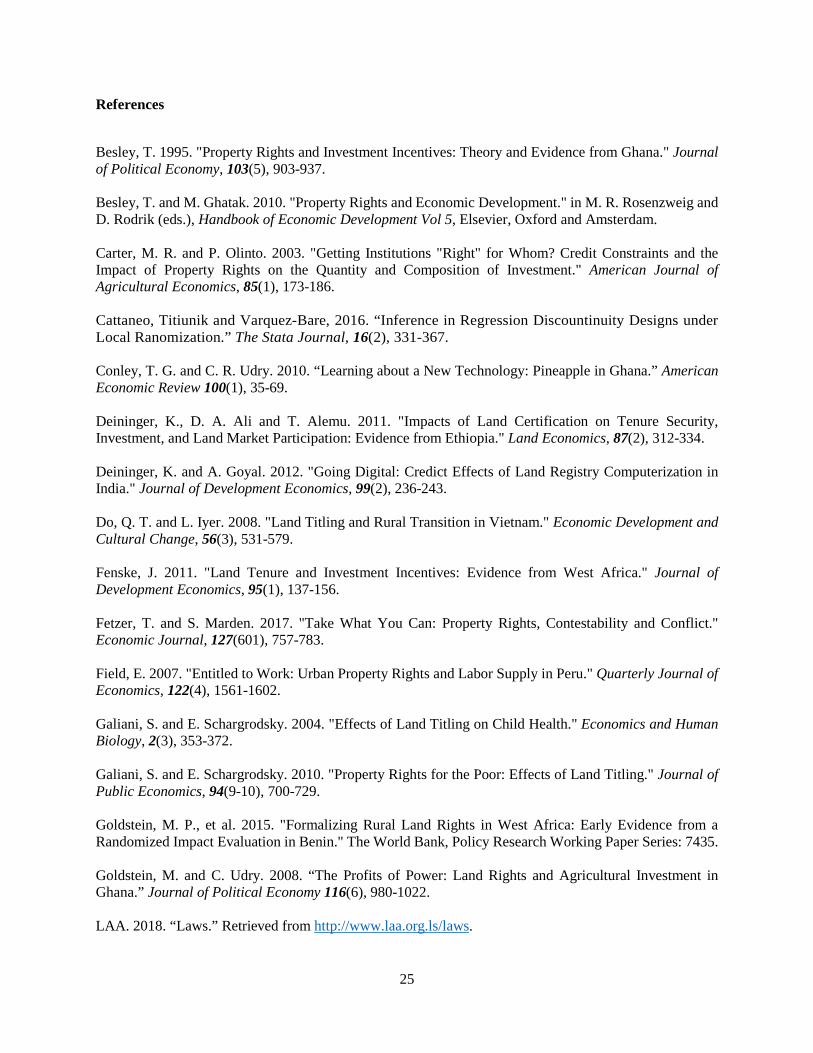
25
References
Besley, T. 1995. "Property Rights and Investment Incentives: Theory and Evidence from Ghana." Journal of Political Economy, 103(5), 903-937. Besley, T. and M. Ghatak. 2010. "Property Rights and Economic Development." in M. R. Rosenzweig and D. Rodrik (eds.), Handbook of Economic Development Vol 5, Elsevier, Oxford and Amsterdam. Carter, M. R. and P. Olinto. 2003. "Getting Institutions "Right" for Whom? Credit Constraints and the Impact of Property Rights on the Quantity and Composition of Investment." American Journal of Agricultural Economics, 85(1), 173-186. Cattaneo, Titiunik and Varquez-Bare, 2016. “Inference in Regression Discountinuity Designs under Local Ranomization.” The Stata Journal, 16(2), 331-367. Conley, T. G. and C. R. Udry. 2010. “Learning about a New Technology: Pineapple in Ghana.” American Economic Review 100(1), 35-69. Deininger, K., D. A. Ali and T. Alemu. 2011. "Impacts of Land Certification on Tenure Security, Investment, and Land Market Participation: Evidence from Ethiopia." Land Economics, 87(2), 312-334. Deininger, K. and A. Goyal. 2012. "Going Digital: Credict Effects of Land Registry Computerization in India." Journal of Development Economics, 99(2), 236-243. Do, Q. T. and L. Iyer. 2008. "Land Titling and Rural Transition in Vietnam." Economic Development and Cultural Change, 56(3), 531-579. Fenske, J. 2011. "Land Tenure and Investment Incentives: Evidence from West Africa." Journal of Development Economics, 95(1), 137-156. Fetzer, T. and S. Marden. 2017. "Take What You Can: Property Rights, Contestability and Conflict." Economic Journal, 127(601), 757-783. Field, E. 2007. "Entitled to Work: Urban Property Rights and Labor Supply in Peru." Quarterly Journal of Economics, 122(4), 1561-1602. Galiani, S. and E. Schargrodsky. 2004. "Effects of Land Titling on Child Health." Economics and Human Biology, 2(3), 353-372. Galiani, S. and E. Schargrodsky. 2010. "Property Rights for the Poor: Effects of Land Titling." Journal of Public Economics, 94(9-10), 700-729. Goldstein, M. P., et al. 2015. "Formalizing Rural Land Rights in West Africa: Early Evidence from a Randomized Impact Evaluation in Benin." The World Bank, Policy Research Working Paper Series: 7435. Goldstein, M. and C. Udry. 2008. “The Profits of Power: Land Rights and Agricultural Investment in Ghana.” Journal of Political Economy 116(6), 980-1022. LAA. 2018. “Laws.” Retrieved from http://www.laa.org.ls/laws.
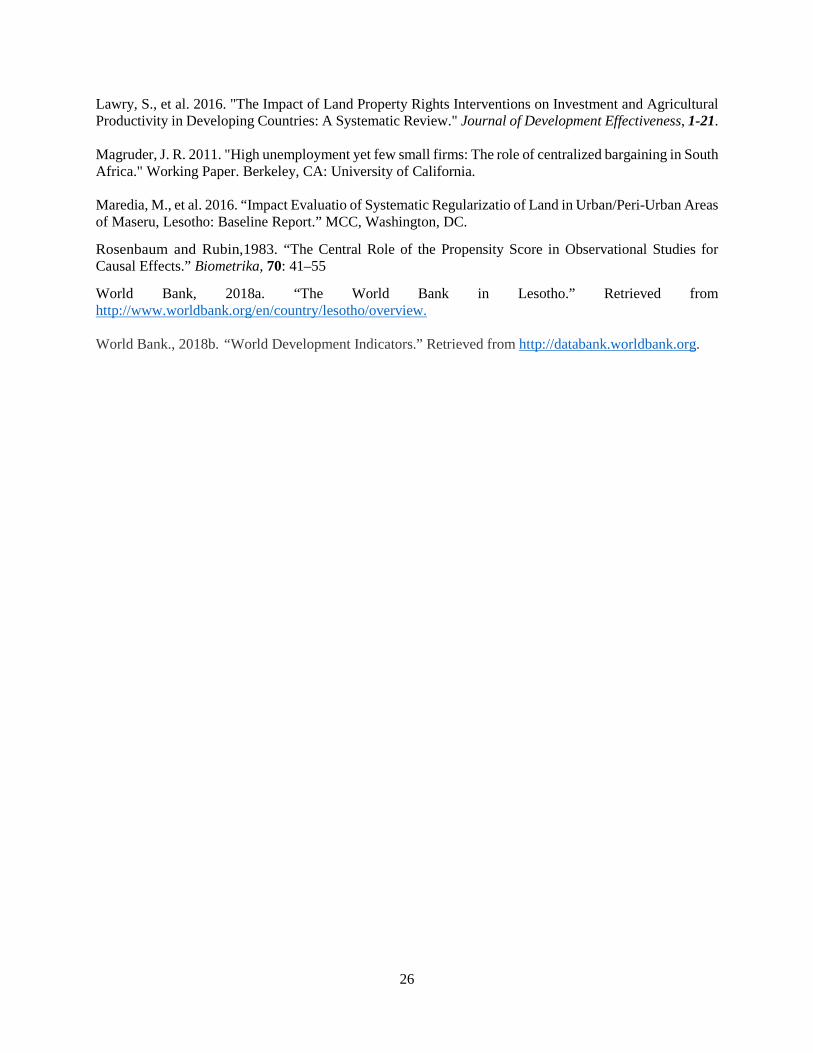
26
Lawry, S., et al. 2016. "The Impact of Land Property Rights Interventions on Investment and Agricultural Productivity in Developing Countries: A Systematic Review." Journal of Development Effectiveness, 1-21. Magruder, J. R. 2011. "High unemployment yet few small firms: The role of centralized bargaining in South Africa." Working Paper. Berkeley, CA: University of California. Maredia, M., et al. 2016. “Impact Evaluatio of Systematic Regularizatio of Land in Urban/Peri-Urban Areas of Maseru, Lesotho: Baseline Report.” MCC, Washington, DC.
Rosenbaum and Rubin,1983. “The Central Role of the Propensity Score in Observational Studies for Causal Effects.” Biometrika, 70: 41–55
World Bank, 2018a. “The World Bank in Lesotho.” Retrieved from http://www.worldbank.org/en/country/lesotho/overview. World Bank., 2018b. “World Development Indicators.” Retrieved from http://databank.worldbank.org.
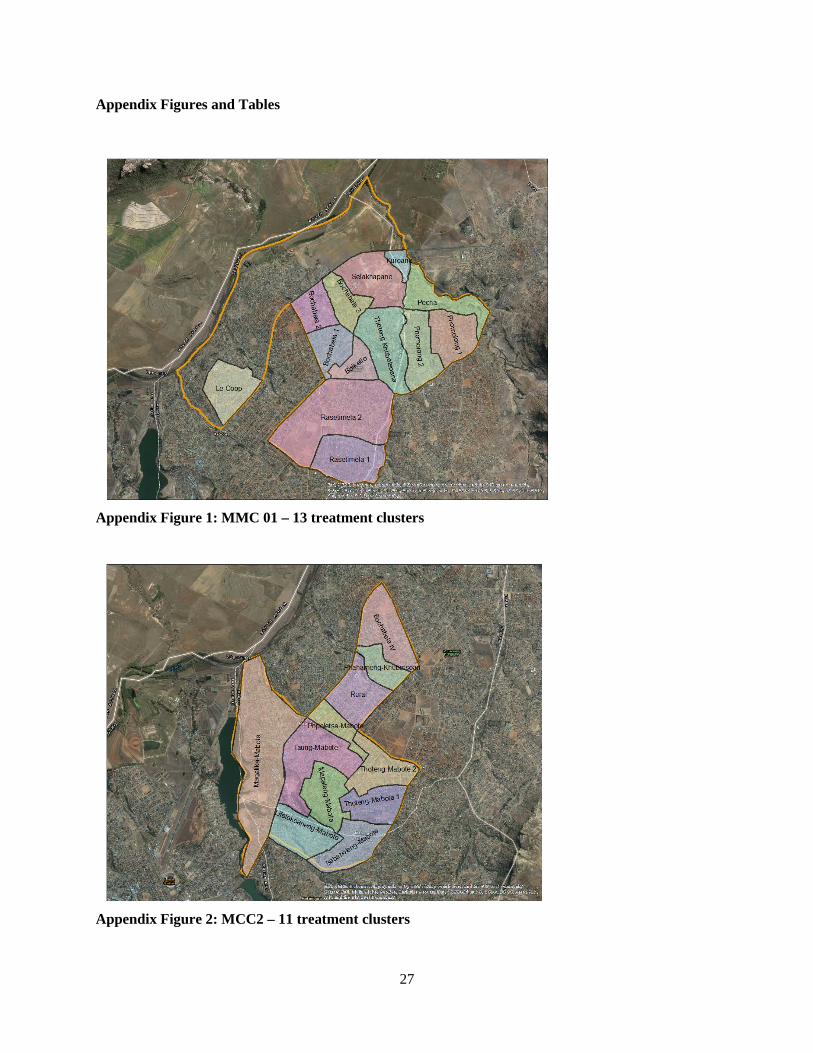
27
Appendix Figures and Tables
Appendix Figure 1: MMC 01 – 13 treatment clusters
Appendix Figure 2: MCC2 – 11 treatment clusters
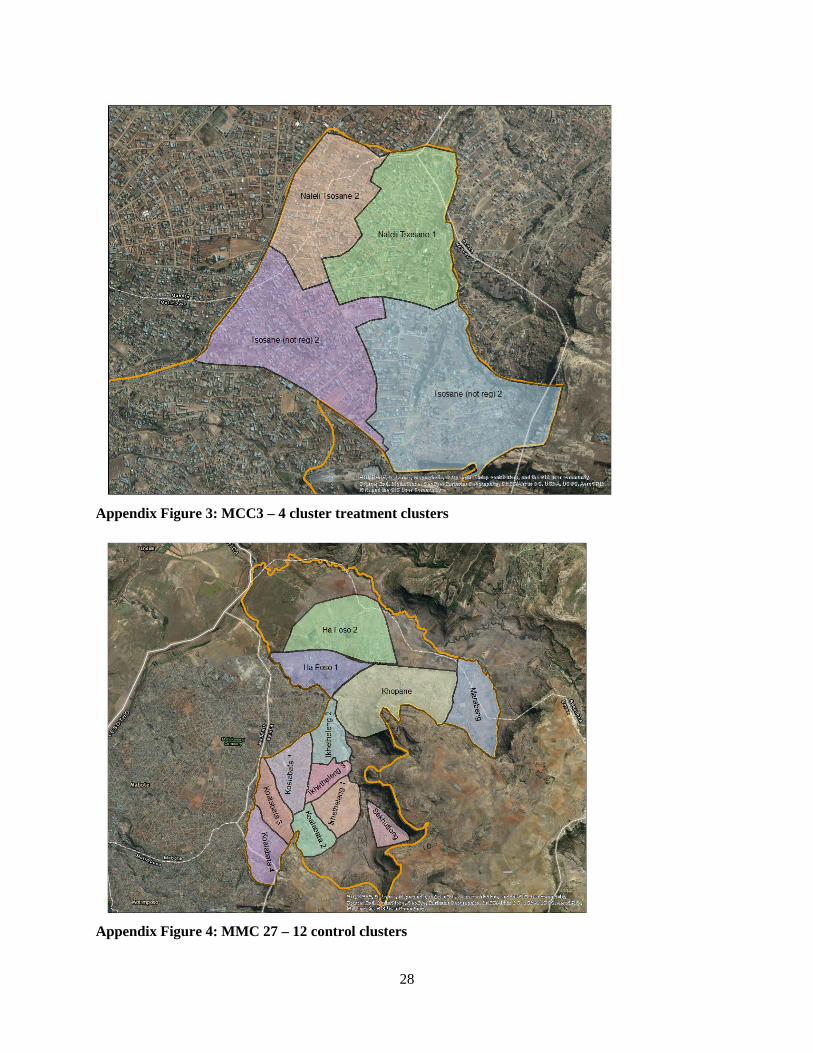
28
Appendix Figure 3: MCC3 – 4 cluster treatment clusters
Appendix Figure 4: MMC 27 – 12 control clusters
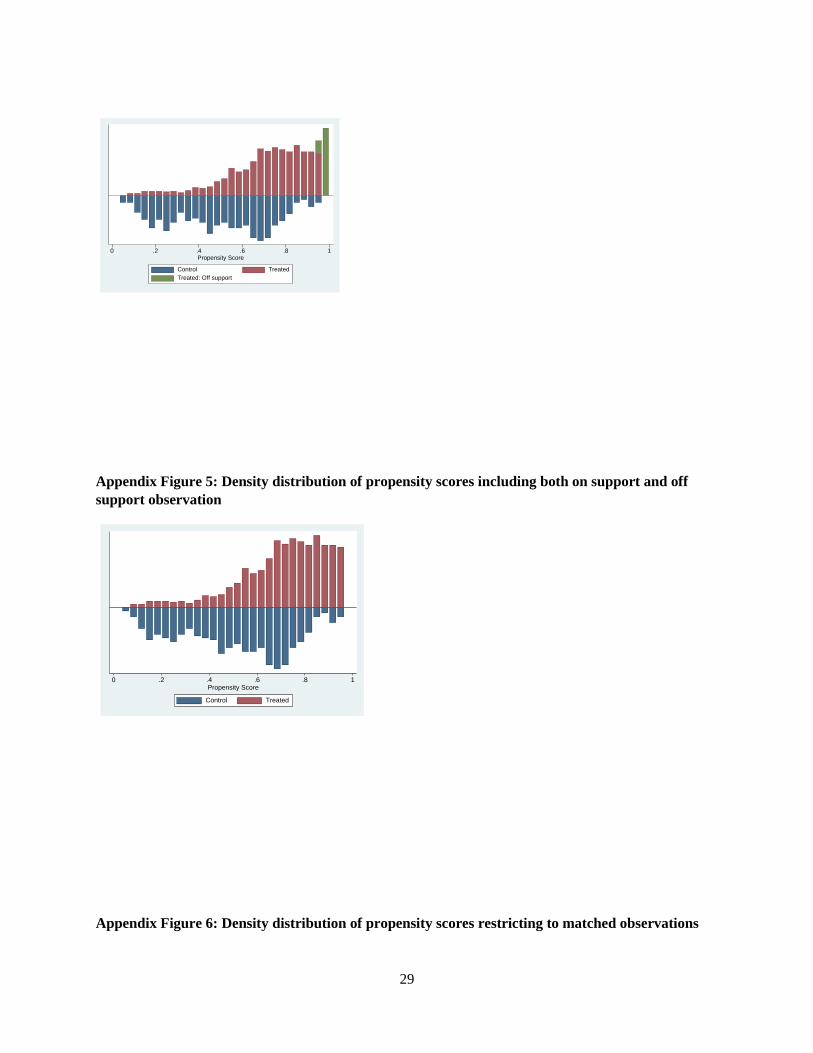
29
Appendix Figure 5: Density distribution of propensity scores including both on support and off support observation
Appendix Figure 6: Density distribution of propensity scores restricting to matched observations
0 .2 .4 .6 .8 1Propensity Score
Control TreatedTreated: Off support
0 .2 .4 .6 .8 1Propensity Score
Control Treated
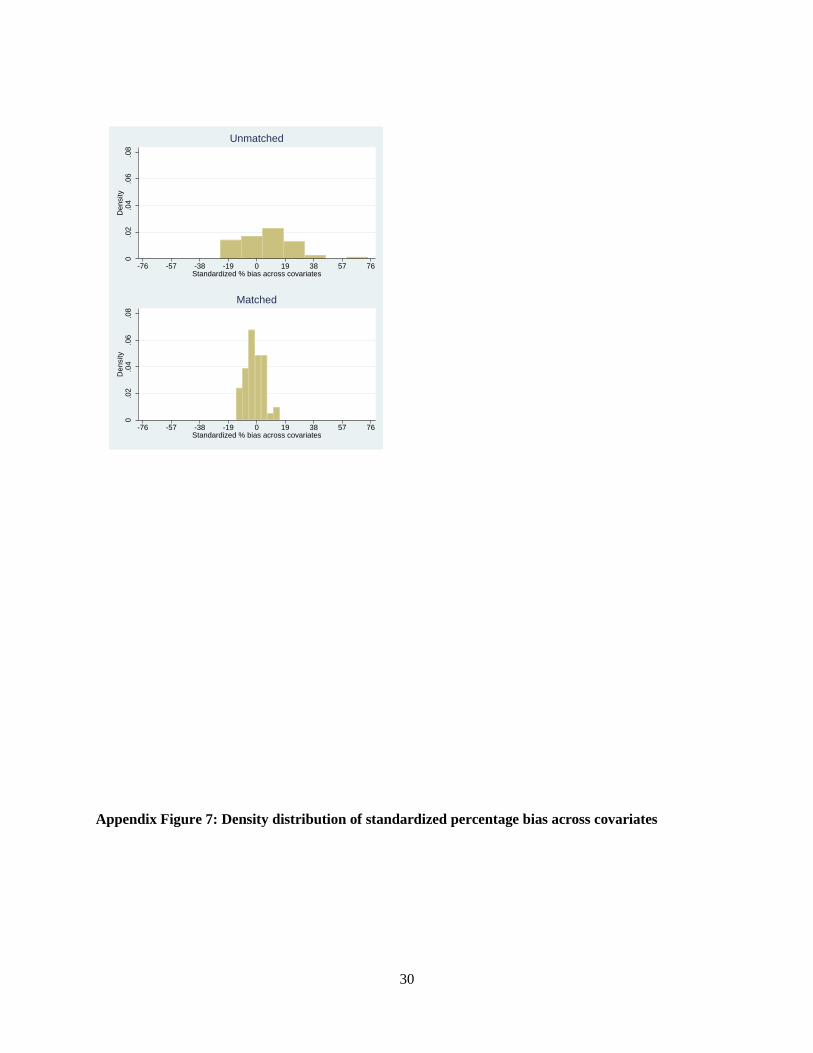
30
Appendix Figure 7: Density distribution of standardized percentage bias across covariates
0.0
2.0
4.0
6.0
8D
ensi
ty
-76 -57 -38 -19 0 19 38 57 76Standardized % bias across covariates
Unmatched0
.02
.04
.06
.08
Den
sity
-76 -57 -38 -19 0 19 38 57 76Standardized % bias across covariates
Matched
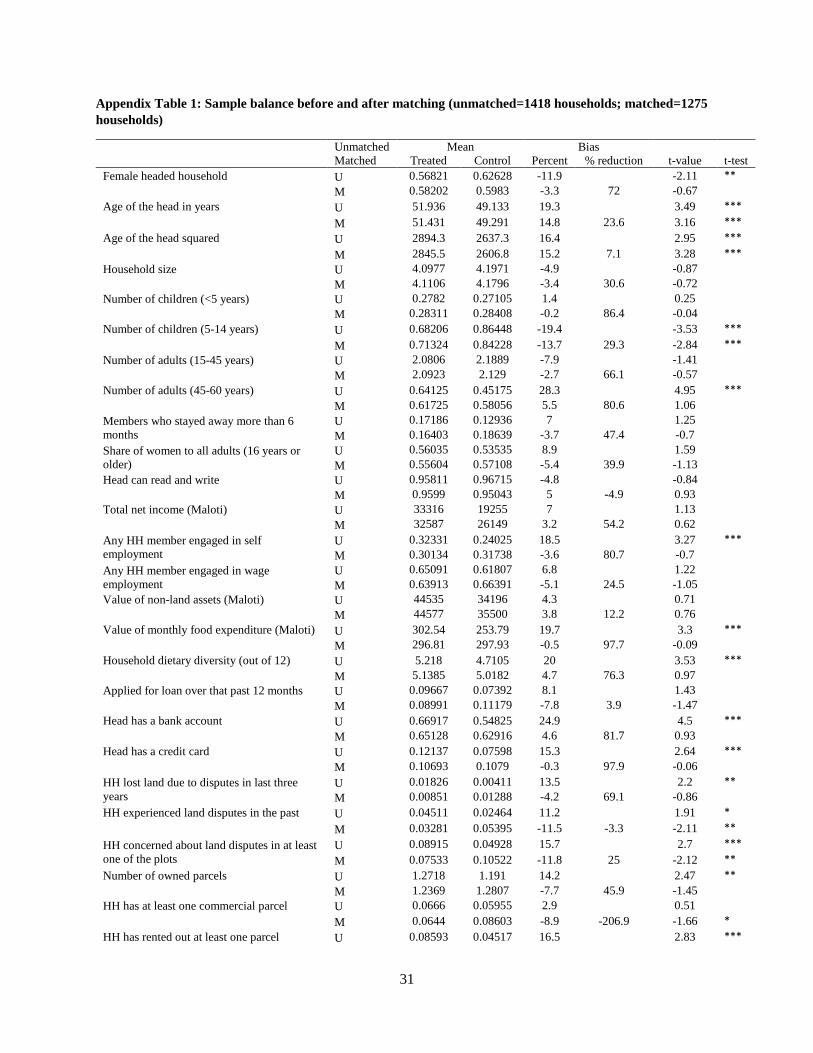
31
Appendix Table 1: Sample balance before and after matching (unmatched=1418 households; matched=1275 households)
Unmatched Mean Bias Matched Treated Control Percent % reduction t-value t-test Female headed household U 0.56821 0.62628 -11.9 -2.11 ** M 0.58202 0.5983 -3.3 72 -0.67 Age of the head in years U 51.936 49.133 19.3 3.49 *** M 51.431 49.291 14.8 23.6 3.16 *** Age of the head squared U 2894.3 2637.3 16.4 2.95 *** M 2845.5 2606.8 15.2 7.1 3.28 *** Household size U 4.0977 4.1971 -4.9 -0.87 M 4.1106 4.1796 -3.4 30.6 -0.72 Number of children (<5 years) U 0.2782 0.27105 1.4 0.25 M 0.28311 0.28408 -0.2 86.4 -0.04 Number of children (5-14 years) U 0.68206 0.86448 -19.4 -3.53 *** M 0.71324 0.84228 -13.7 29.3 -2.84 *** Number of adults (15-45 years) U 2.0806 2.1889 -7.9 -1.41 M 2.0923 2.129 -2.7 66.1 -0.57 Number of adults (45-60 years) U 0.64125 0.45175 28.3 4.95 *** M 0.61725 0.58056 5.5 80.6 1.06 Members who stayed away more than 6 months
U 0.17186 0.12936 7 1.25 M 0.16403 0.18639 -3.7 47.4 -0.7
Share of women to all adults (16 years or older)
U 0.56035 0.53535 8.9 1.59 M 0.55604 0.57108 -5.4 39.9 -1.13
Head can read and write U 0.95811 0.96715 -4.8 -0.84 M 0.9599 0.95043 5 -4.9 0.93 Total net income (Maloti) U 33316 19255 7 1.13 M 32587 26149 3.2 54.2 0.62 Any HH member engaged in self employment
U 0.32331 0.24025 18.5 3.27 *** M 0.30134 0.31738 -3.6 80.7 -0.7
Any HH member engaged in wage employment
U 0.65091 0.61807 6.8 1.22 M 0.63913 0.66391 -5.1 24.5 -1.05
Value of non-land assets (Maloti) U 44535 34196 4.3 0.71 M 44577 35500 3.8 12.2 0.76 Value of monthly food expenditure (Maloti) U 302.54 253.79 19.7 3.3 *** M 296.81 297.93 -0.5 97.7 -0.09 Household dietary diversity (out of 12) U 5.218 4.7105 20 3.53 *** M 5.1385 5.0182 4.7 76.3 0.97 Applied for loan over that past 12 months U 0.09667 0.07392 8.1 1.43 M 0.08991 0.11179 -7.8 3.9 -1.47 Head has a bank account U 0.66917 0.54825 24.9 4.5 *** M 0.65128 0.62916 4.6 81.7 0.93 Head has a credit card U 0.12137 0.07598 15.3 2.64 *** M 0.10693 0.1079 -0.3 97.9 -0.06 HH lost land due to disputes in last three years
U 0.01826 0.00411 13.5 2.2 ** M 0.00851 0.01288 -4.2 69.1 -0.86
HH experienced land disputes in the past U 0.04511 0.02464 11.2 1.91 * M 0.03281 0.05395 -11.5 -3.3 -2.11 ** HH concerned about land disputes in at least one of the plots
U 0.08915 0.04928 15.7 2.7 *** M 0.07533 0.10522 -11.8 25 -2.12 **
Number of owned parcels U 1.2718 1.191 14.2 2.47 ** M 1.2369 1.2807 -7.7 45.9 -1.45 HH has at least one commercial parcel U 0.0666 0.05955 2.9 0.51 M 0.0644 0.08603 -8.9 -206.9 -1.66 * HH has rented out at least one parcel U 0.08593 0.04517 16.5 2.83 ***
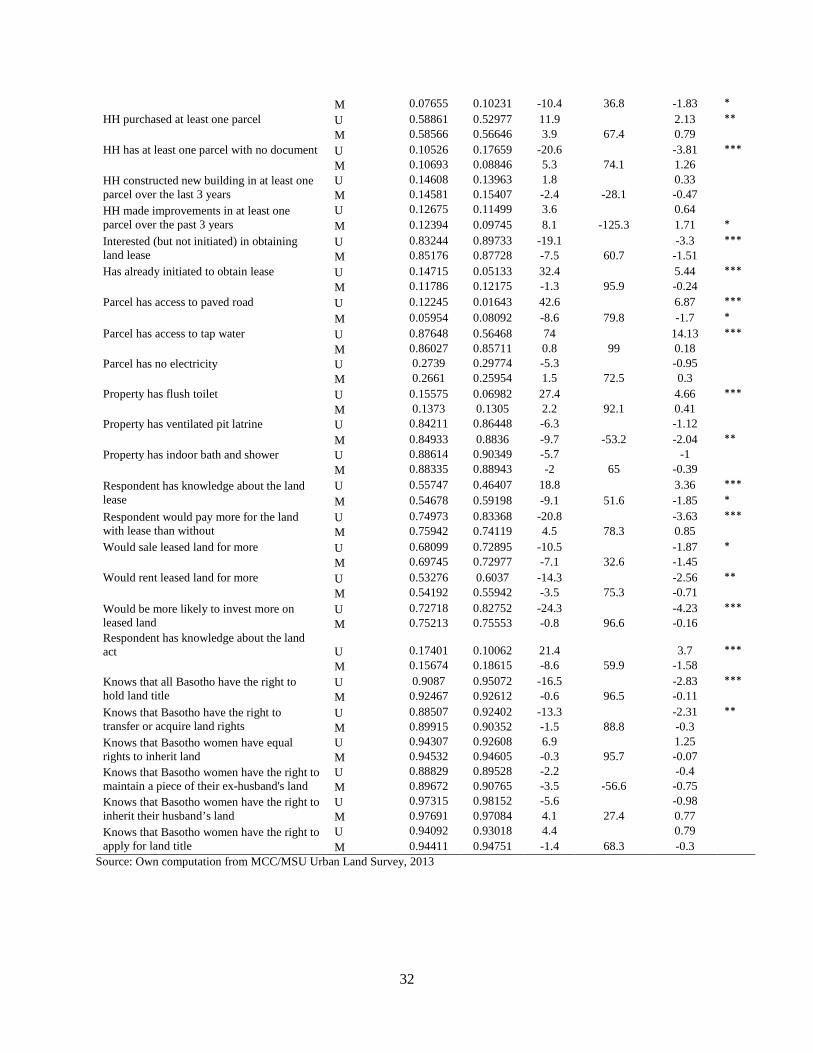
32
M 0.07655 0.10231 -10.4 36.8 -1.83 * HH purchased at least one parcel U 0.58861 0.52977 11.9 2.13 ** M 0.58566 0.56646 3.9 67.4 0.79 HH has at least one parcel with no document U 0.10526 0.17659 -20.6 -3.81 *** M 0.10693 0.08846 5.3 74.1 1.26 HH constructed new building in at least one parcel over the last 3 years
U 0.14608 0.13963 1.8 0.33 M 0.14581 0.15407 -2.4 -28.1 -0.47
HH made improvements in at least one parcel over the past 3 years
U 0.12675 0.11499 3.6 0.64 M 0.12394 0.09745 8.1 -125.3 1.71 *
Interested (but not initiated) in obtaining land lease
U 0.83244 0.89733 -19.1 -3.3 *** M 0.85176 0.87728 -7.5 60.7 -1.51
Has already initiated to obtain lease U 0.14715 0.05133 32.4 5.44 *** M 0.11786 0.12175 -1.3 95.9 -0.24 Parcel has access to paved road U 0.12245 0.01643 42.6 6.87 *** M 0.05954 0.08092 -8.6 79.8 -1.7 * Parcel has access to tap water U 0.87648 0.56468 74 14.13 *** M 0.86027 0.85711 0.8 99 0.18 Parcel has no electricity U 0.2739 0.29774 -5.3 -0.95 M 0.2661 0.25954 1.5 72.5 0.3 Property has flush toilet U 0.15575 0.06982 27.4 4.66 *** M 0.1373 0.1305 2.2 92.1 0.41 Property has ventilated pit latrine U 0.84211 0.86448 -6.3 -1.12 M 0.84933 0.8836 -9.7 -53.2 -2.04 ** Property has indoor bath and shower U 0.88614 0.90349 -5.7 -1 M 0.88335 0.88943 -2 65 -0.39 Respondent has knowledge about the land lease
U 0.55747 0.46407 18.8 3.36 *** M 0.54678 0.59198 -9.1 51.6 -1.85 *
Respondent would pay more for the land with lease than without
U 0.74973 0.83368 -20.8 -3.63 *** M 0.75942 0.74119 4.5 78.3 0.85
Would sale leased land for more U 0.68099 0.72895 -10.5 -1.87 * M 0.69745 0.72977 -7.1 32.6 -1.45 Would rent leased land for more U 0.53276 0.6037 -14.3 -2.56 ** M 0.54192 0.55942 -3.5 75.3 -0.71 Would be more likely to invest more on leased land
U 0.72718 0.82752 -24.3 -4.23 *** M 0.75213 0.75553 -0.8 96.6 -0.16
Respondent has knowledge about the land act U 0.17401 0.10062 21.4 3.7 *** M 0.15674 0.18615 -8.6 59.9 -1.58 Knows that all Basotho have the right to hold land title
U 0.9087 0.95072 -16.5 -2.83 *** M 0.92467 0.92612 -0.6 96.5 -0.11
Knows that Basotho have the right to transfer or acquire land rights
U 0.88507 0.92402 -13.3 -2.31 ** M 0.89915 0.90352 -1.5 88.8 -0.3
Knows that Basotho women have equal rights to inherit land
U 0.94307 0.92608 6.9 1.25 M 0.94532 0.94605 -0.3 95.7 -0.07
Knows that Basotho women have the right to maintain a piece of their ex-husband's land
U 0.88829 0.89528 -2.2 -0.4 M 0.89672 0.90765 -3.5 -56.6 -0.75
Knows that Basotho women have the right to inherit their husband’s land
U 0.97315 0.98152 -5.6 -0.98 M 0.97691 0.97084 4.1 27.4 0.77
Knows that Basotho women have the right to apply for land title
U 0.94092 0.93018 4.4 0.79 M 0.94411 0.94751 -1.4 68.3 -0.3
Source: Own computation from MCC/MSU Urban Land Survey, 2013
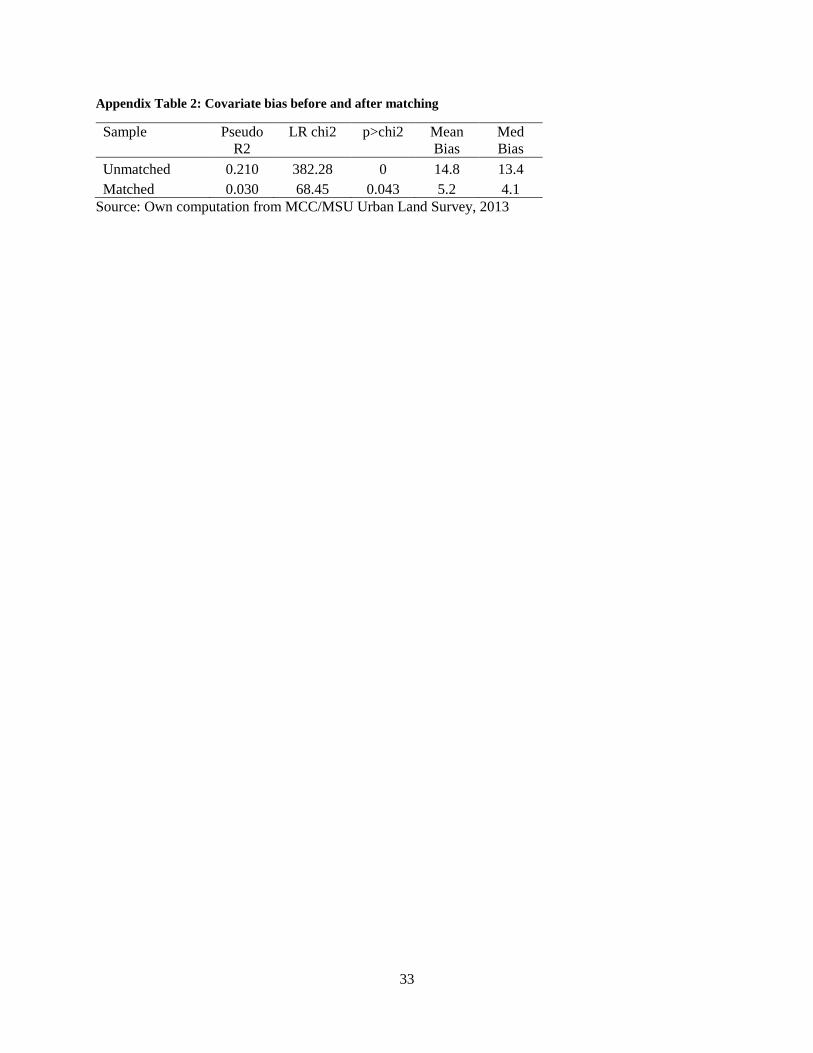
33
Appendix Table 2: Covariate bias before and after matching
Sample Pseudo R2
LR chi2 p>chi2 Mean Bias
Med Bias
Unmatched 0.210 382.28 0 14.8 13.4 Matched 0.030 68.45 0.043 5.2 4.1
Source: Own computation from MCC/MSU Urban Land Survey, 2013