lemhi river habitat final report · 2016-02-25 · lemhi river habitat improvement study final...
TRANSCRIPT

LEMHI RIVER HABITAT
IMPROVEMENT STUDY
Final Report
by
Dennis E. Dorratcaque, P.E.
Project Coordinator
Funded by
Larry Everson, Project Manager
U.S. Department of Energy
Bonneville Power Administration
Division of Fish and Wildlife
Contract No. DE-AC79-84BP17447
Project No. 84-28
February 1986

ACKNOWLEDGEMENTS
LEMHI RIVER HABITAT IMPROVEMENT STUDY
FEBRUARY 1986
Ott Water Engineers, Inc. (OTT) gratefully acknowledges the
contributions of the following individuals: Mr. Larry B. Everson,
BPA Project Manager; Mr. Dennis E. Dorratcague, Ott Water
Engineers, Inc. Project Manager; and Ms. Paula M. Arsenault, Ott
Water Engineers, Inc. Project Engineer. Dr. James W. Buell of
Buell & Associates, Inc., Dr. T.C. Bjornn, and Mr. Kim de Rubertis
also contributed significantly to the project.
We would also like to thank the Idaho Department of Fish and Game
representatives: Mr. Terry Holubetz, Mr. Herb Pollard, Mr. Mel
Reingold, Mr. Kent Ball, and Mr. Dale Robertson; Soil Conservation
Service representatives: Mr. Ralph Swift and Mr. Neil Wilton;
Shoshone-Bannock Tribes representative Dr. Rick Konopacky; U.S.
Forest Service, Salmon National Forest representative Mr. Bruce
May; Lemhi Irrigation District Board Members: Mr. Frank Logan,
Mr. Kent Smith, and Mr. Jack Powers; Lemhi Irrigation District
Attorney Mr. Jim Herndon; Watermaster for the Town Ditch Company
Mr. Bob Thomas; Salmon Recorder Herald Editor in Chief Mr. Robert
Johnson; and the entire technical team at Ott Water Engineers,
Inc. and Buell & Associates, Inc.

TABLE OF CONTENTS
PAGE
CHAPTER 1. EXECUTIVE SUMMARY
Hydrology
Enhancement Alternatives
Selection of Options
Benefits and Costs
Other Considerations
Recommendations
CHAPTER 2. INTRODUCTION
Statement of Problem
Objective of the Study
CHAPTER 3. ANALYSIS
Literature Search
Water Rights Issues
Hydrology
Cost Computation Parameters
Fish Habitat Assessment
CHAPTER 4. DESCRIPTION OF ALTERNATIVES
Alternative 1 - Flow Concentration
Alternative 2 - Fish Screen Improvement
Alternative 3 - Groundwater Augmentation
Alternative 4 - Groundwater Irrigation
Alternative 5 - Water Withdrawal Reduction
Alternative 6 - Return Flow Improvement
Alternative 7 - Sprinkler Irrigation
Alternative 8 - Storage
Alternative 9 - Trap and Haul
CHAPTER 5. BENEFITS ANALYSIS
Selection of Options
Management Alternatives
l- 3
l- 3
l- 7l- 9
1-12
1-13
2- 12- 2
3- 1
3- 2
3- 9
3-38
3-39
4- 1
4-12
4-19
4-22
4-27
4-35
4-37
4-42
4-61
5- 1
5- 2
i

TABLE OF CONTENTS(continued)
PAGE- -
Benefits to the Fishery
Economic Benefits
CHAPTER 6. BENEFIT/COST ANALYSIS
Benefits
costs
Present Worth Analysis
Benefit/Cost Ratios
CHAPTER 7. RESULTS AND CONCLUSIONS
Evaluation of Alternatives
Evaluation of Options
Conclusions
Recommendations
5- 7
5-31
6- 1
6- 2
6- 2
6- 4
7- 1
7- 1
7- 4
7- 5
REFERENCES
APPENDIX A. LEMHI RIVER DIVERSION AND FLOW MEASUREMENT LOCATIONS
APPENDIX B. TOPOGRAPHIC LOCATIONAL MAPS
APPENDIX C. ANNOTATED BIBLIOGRAPHY
APPENDIX D. HYDROLOGY TABLES AND FIGURES
APPENDIX E. UNIT COSTS
APPENDIX F. SUBREACH HABITAT DATA
ii
TABLES
TABLE NO. TITLE PAGE
1. 1 Summary of Costs, Benefits, and B/C Ratios3. 1 Minimum Required Flows for Upstream Passage,
l-11
Lemhi River3. 23. 33. 43. 53. 63. 73. 84. 14. 24. 34. 44. 54. 64. 7
Return Flows and Water Right UtilizationFlow Augmentation Quantities, SpringFlow Augmentation Quantities, SummerFlow Augmentation Quantities for ChannelizationFish Habitat StationsRearing Habitat for Anadromous SalmonidsSurface Areas of Habitat TypesSite Data for Flow ConcentrationDetailed First Cost Summary for Diversion L-5Physical Features of Storage OptionsCapital Costs for Storage Reservoir with Power
3-193-273-293-303-313-443-483-494- 34- 94-444-55
Capital Costs for Storage Reservoir without Power 4-56Costs for Storage Reservoir OptionsFlow Modification at Location of Proposed
4-57
Storage Reservoir4. 8 Augmentation Flows and Power Benefits4. 9 Capital and Annual Costs for the Juvenile Trap
4-594-60
and Haul Facility 4-684.10 Capital and Annual Costs for the Adult Trap
and Haul Facility5. 15. 25. 35. 45. 55. 65. 75. 85. 95.105.115.125.135.145.156. 1
Enhancement OptionsHabitat Quality FactorsHabitat-Type/Juvenile Fish DensitiesPotential Chinook and Steelhead ProductionAnnual HarvestEffect of Passage Conditions on ChinookSteelhead Returns and Harvestable AdultsEffect of Passage ConditionsCosts to Chinook and Steelhead FisheriesReduction in Annual HarvestSteelhead Returns and Harvestable AdultsEffect of Passage ConditionsAnnual Steelhead HarvestReduction in Annual Steelhead HarvestSummary of Economic BenefitsCapital and Annual Costs for Options A, B, C,
4-705- 35-105-115-135-155-175-215-225-235-245-285-305-325-335-37
and D6. 2 Costs and Benefits of the Four Options6. 3 Benefit/Cost Ratios for the Four Options7. 1 Evaluation of Alternatives
6- 36- 56- 67- 2
iii

FIGURES
FIGURES NO.
1.1
3.1
3.2
3.3
3.4
4.1
4.2
4.3
4.4
4.5
4.6
4.7
4.8 Area-Capacity Curves
4.9 Monthly Pool Elevation and Gross Head
4.10 Juvenile Trap and Haul Facility
4.11 Adult Trap and Haul Facility
TITLE PAGE
Location Map
Reach Definition
Steelhead and Chinook Migration Periodicity
Long-Term Data Collection Sites
Potentiometric Contour Map
Typical Plan View
Typical Sections
Fish Screen Bypass
Mean Monthly Flows at Dam Site, Option 1
Mean Monthly Flows in Hayden Creek at Mouth
Mean Monthly Flows at Dam Site, Option 2
Modified Flows in Hayden Creek at Dam Site,Option 2
l- 2
3-11
3-15
3-21
3-35
4- 4
4- 5
4-13
4-45
4-46
4-48
4-50
4-52
4-53
4-63
4-65
iv

CHAPTER 1
EXECUTIVE SUMMARY
This report was prepared tor the Bonneville Power Administration
(BPA) for the Lemhi River Habitat Improvement Project. The BPA's
efforts on this Project are in response to the Northwest Power
Planning Council's Columbia River Basin Fish and Wildlife Program
(1984). The object of this Study is to determine the feasibility
of enhancinq the stocks of salmon and steelhead which have
declined siqnificantly over the last 80 years in the Lemhi River.
The mainstem of the Lemhi River is approximately 60 miles long
with 16 major tributaries. It flows along the west flank of the
Continental Divide in Eastcentral Idaho to the Salmon River at the
City of Salmon, Idaho (Fiqure 1.1). Little is known of the
historic runs of salmon and steelhead in the Lemhi. Runs were
lost at the turn of the century, with the construction of
hydroelectric facilities near the mouth of the River. With
removal of the hydroelectric plant in the 1920s, salmon and
steelhead have returned, but to levels below the capacity of the
system to support them.
The major difficulty facing Lemhi River anadromous fish is a lack
of water during upstream and downstream migrations. Most or all
of the water in some reaches is diverted from the River for flood
irrigation. Guidance of juvenile salmon and steelhead into
irrigation works where substantial migration delays occur is also
a problem. The critical period for water diversion impacts is
typically from April through May when the irrigation season begins
and before sprinq snowmelt. During this period adult and juvenile
migrations of chinook and steelhead are at or near their peaks.
The specific objective of this Study was to develop methods for
improving anadromous fish passage in the Lemhi River. OTT
l-l

I IWASHINGTON MONTANA
OREGON
0 MISSOULA
IDAHO
I TWIN I: FALLS I
I
-
----__---------__ --T---------
1
I
J
UTAHI
INEVADA FIGURE 1.1
LEMHI R I V E R
SCALEHABITAT IMPROVEMENT STUDY
*- mi’cs LOCATION MAP
DATE: NOVEMBER 1985
E
OTTJOB NUMBER: S 1028.03

accompl ished this objective through a three-phased approach.
Phase I included defining the problem, conduct inq a literature
search, and performing a hydrologic analysis and stream survey.
Phase II developed and analyzed enhancement alternatives. Once
the fishery benefits of selected enhancement options were
determined, Phase III, a benefit/cost analysis, was conducted.
HYDROLOGY
The hydroloqy of the Lemhi River Basin is characterized by a
complex interaction between surface water runoff, irriqation
diversion practices, and qroundwater recharge. Major contribu-
tions to the stream flow are snowpack, rainfall, and return flows
from flood irrigation. Hydrologic analyses focused primarily on
the frequency and magnitude of low flows. OTT selected a low-flow
duration of 15 days for computing the frequency of periods during
which natural stream flow does not satisfy minimum fish passaqe
reauirements at critical reaches. Transect measurements helped to
determine minimum instream flows for passage under existing and
channelized streambed conditions. OTT then determined flow
augmentation quantities (the difference between actual stream
flows and fish passaqe requirements) for selected reaches and
combinations of options. OTT then used the results in the
preliminary design ot structures, such as permanent diversion dams
and levees, and to compute the economic benefits of the
enhancement options.
ENHANCEMENT ALTERNATIVES
Phase II developed nine enhancement alternatives:
0 Flow Concentration
0 Fish Screen Improvement
0 Groundwater Auqmentation
l-3

0 Groundwater Irriqation
0 Water Withdrawal Reduction
0 Return Flow Improvement
0 Sprinkler Irrigation
0 Storage
0 Trap and Haul
Descriptions of the nine alternatives and the results of the
analyses are presented below.
FLOW CONCENTRATION
Flow concentration involves constructing permanent concrete
diversion dams at several critical locations to replace temporary
dams now constructed by irrigators with dozers from streambed
materials. A fishway is provided at each site to provide upstream
passage around the diversion. Channelization downstream of each
diversion structure would be provided to concentrate flow and
allow for passage during low-flow periods.
Channelization would be performed at other locations where the
River channel is wide and passage difficulties are created by
insufficient water depths. Since diversion dams raise flood
levels, levee construction is included for flood protection.
FISH SCREEN IMPROVEMENTS
Fish screen improvement entails making recommendations for
modification or repair of existing screen and bypass facilities.
The objective of this alternative is to reduce delay and mortality
l-4

of downstream migrants. Testing should be conducted in order to
develop a suitable fish bypass system for installation at each
major diversion. To ensure that improved bypasses operate
efficiently, water rights should be sought for additional bypass
flows.
GROUNDWATER AUGMENTATION
Groundwater augmentat ion involves pumping groundwater directly
into the Lemhi River at critical fish passage points durinq
low-flow periods. Using observed specific capacities obtained
from the United States Geological Survey (USGS), 30 wells would be
required to meet a 20-cfs minimum flow at River Mile (RM) 7.2.
GROUNDWATER IRRIGATION
An alternative to diverting surface water for irrigation is to
pump groundwater. Lemhi Valley irriqators would sell partial or
complete water riqhts to BPA and install more efficient irrigation
systems. The remaining water rights would be transferred from
surface to groundwater withdrawal. Such an exchange would only be
considered for lower Lemhi Basin water riqhts, downstream of
RM 8.6, where fish passaqe problems are most critical. There are
several potential problems with this alternative including
interference of numerous wells on qroundwater recharge, uncertain
capacity of the aquifer, and the loss of priority of water riqht
when chaging from surface to groundwater rights.
W A T E R WITHDRAWAL REDUCTION
Surface water withdrawals can be reduced by improving the
efficiency of flood irriqation methods over those currently
practiced. Similar to the previous alternative, irrigators would
sell partial water riqhts to BPA and use the income to improve
flood irriqation efficiency. This would involve leveling fields,
l-5
lining canals, and laying out fields to efficiently apply
irrigation water. The beneficial use of purchased water rights
would be changed from irrigation to fish passage.
RETURN FLOW IMPROVEMENT
Another method to increase the overall efficiency of flood
irrigation is to improve return flow. Enhanced surface and
subsurface field drainage would decrease the delay associated with
deep percolation and groundwater intiltration into the River.
Considered possibilites include draining marshes and other natural
collection areas, constructing collection ditches and ponds to
drain intensely irrigated areas, or installing subsurface drains
to return excess flows to the Lemhi River through pipes or
ditches.
SPRINKLER IRRIGATION
Sprinkler irrigation involves the purchase of partial water
rights. The irrigator could use the income from this sale to
install efficient sprinkler irrigation systems. Implementation of
this alternative is concentrated on the lower Lemhi River reaches
where fish passage is most critical.
STORAGE
Several previous studies have focused on reservoir storage in the
Lemhi Valley. OTT selected a storage reservoir site on Hayden
Creek, immediately downstream from the confluence of Bear Valley
Creek. The dam would be a 250-foot high roller-compacted concrete
structure with a storage volume of 17,200 acre-feet. This dam was
studied with and without the addition of hydroelectric power.
l-6

TRAP AND H A U L
OTT developed a trap and haul system to a conceptual level to
evaluate the feasibility of transporting adult and juvenile fish
around critical passage reaches of the stream. The system would
consist of two facilities. A juvenile trap would be located at
the site of the abandoned fish counting station, immediately
upstream of Hayden Creek. This facility would guide juveniles by
means of a louver barrier to a trap. Juveniles would then be
transported to the Salmon River for release. An adult trap would
be located near the mouth of the Lemhi, and fish would be
transported to the upper watershed. Both facilities would be
temporary and used only during low-flow seasons.
SELECTION OF OPTIONS
OTT presented the nine enhancement alternatives to the cooperating
agencies at a meeting in September 1985. Participants decided the
remaining efforts should concentrate on four options for
enhancement. These options are a combination of several of the
alternatives described above. The four options are:
0 OPTION A:
Permanent Diversions, Channelization, and Levees at
L1-5, L-6, L-7
Channelization only at: SPS*-1, SPS-2, SPS-3
1 " L " signifies irrigation diversions on the Lemhi River asnumbered in the "Proposed Finding of Water Rights in the LemhiRiver Basin".
2 "SPS" signifies Supplemental Passage Stations which are areasother than diversions where fish passage is difficult or blockeddurinq low-flow periods.
l-7

0 OPTION B:
Same as Option A, with River Flow Augmentation through:
Flood Irrigation Improvement
- 5 cfs conserved between L-7 and L-6
- 12.4 cfs conserved between L-6 and mouth
Sprinkler Irrigation
- 8.4 cfs conserved between L-7 and L-6
- 20.7 cfs conserved between L-6 and mouth
0 OPTION C:
Permanent Diversions, Channelization, and Levees at:
L-5, L-6, L-7, L-20, L-22, L-31A, L-40, L-41,
L-43, L-44, L-45D, L-61
Channelization only at:
L-3, SPS-1, SPS-2, SPS-3, SPS-4
0 OPTION D:
Same as Option C, with River Flow Augmentation through:
Flood Irrigation Improvement
- 5 cfs conserved between L-7 and L-6
- 12.4 cfs conserved between L-6 and mouth
Sprinkler Irrigation
- 8.4 cfs conserved between L-7 and L-6
- 20.7 cfs conserved between L-6 and mouth
For each of the enhancement options, four fisheries management
alternatives were considered to allow the assessment of benefits
over a range of potential management scenarios. The four
management alternatives are:
0 Alternative No. 1
Allow chinook salmon runs to increase naturally from
prevailing levels without harvest until full seeding of
juvenile rearing habitat is achieved. Screened
irrigation diversion remain in their present condition.
l-8

0 Alternative No. 2
Chinook salmon are harvested at a rate that maintains a
stable escapement at prevailing population levels (i.e.,
330 fish). Full seedinq of juvenile habitat is not
achieved. Screened irrigation diversions remain in
their present condition.
0 Alternative No. 3
This management alternative is identical to Alternative
No. 1 except that there is a 75 percent basin-wide
improvement in downstream migrant passage conditions at
screened irrigation diversions.
0 Alternative No. 4
IDFG provides full hatchery supplementation with
juvenile chinook salmon to fully seed available rearing
habitat during the first return cycle only. No harvest
occurs until the first chinook return cycle is
completed. There is a 75 percent basin-wide improvement
in downstream migrant passage conditions at screened
irriqation diversions.
For all four manaqement alternatives it is assumed that IDFG
continues to release an average of 2,000 surplus hatchery
steelhead spawners in the Lemhi River annually.
BENEFITS AND COSTS
Benefits of the four options and four manaqement alternatives were
assumed to accrue from an increased number of harvestable chinook
s a lm o n a n d steelhead from the Lemhi River. Under existinq
conditions in the River, harvestable fish are lost due to critical
low-flow conditions in approximately two in nine years. If
Options A or C are implemented, the recurrence interval of
critical low-flows would be increased to one out of seven years.
l-9

Implementinq Options B or D would increase this to one out of
thirteen years. The benefit is assumed to be the difference
between harvestable fish lost under existing conditions and
harvestable fish lost with a particular option.
Cost estimates for the four options, including capital and annual
costs, are presented in Table 1.1. Also included in Table 1.1 are
the present worth of benefits and benefit/cost (B/C) ratios for
the four options for each of the manaqement alternatives.
These results indicate Option B in conjunction with Fisheries
Manaqement Alternative No. 4 produces the greatest B/C ratio.
Under this combination of actions, stream flows would be
augmented, fish screens and bypasses improved, and supplemental
stocking of juvenile chinook implemented to immediately build the
Lemhi River salmon run to capacity. Thus, greater numbers of fish
will be produced sooner than with the other alternatives leading
ultimately to substantial harvest benefits. Except for Manaqement
Alternative No. 2, Option B consistently results in the greatest
B/C ratios for a given management alternative, thus demonstrating
the importance of flow augmentation as an enhancement action that
produces significant benefits.
Analyses of project benefits derived from Management Alternatives
Nos. 3 and 4 are particularly important. They show the beneficial
effect that improved downstream passaqe conditions at irrigation
screening facilities in the Lemhi River will have on the run of
anadromous fish. By assuminq a 75 percent reduction in the
losses and delays at irrigation diversions, some of the projected
project benefits become substantial, particularly Options B and D
where the fish are manaqed for the maximum natural run.
IDFG has recently indicated it may manage the Lemhi River fish
runs as hatchery-supplemented runs on a continuing basis, rather
than on the short-term basis assumed in Management Alternative
l-10

TABLE 1.1
SUMMARY OF COSTS, BENEFITS, AND B/C RATIOS
FISHERIESMANAGEMENTALTERNATIVE OPTION
1 ABCD
2 ABCD
ABCD
ABCD
CAPITAL COST($)
1,386,000 290,700 33,400 0.0201,734,000 290,700 14,900 0.0074,219,000 1,104,000 33,400 0.0064,567,000 1,104,000 14,900 0.003
1,386,000 290,700 42,800 0.0261,734,000 290,700 32,600 0.0164,219,000 1,104,000 42,800 0.0084,567,000 1,104,000 32,600 0.006
1,386,000 290,700 94,800 0.0561,734,000 290,700 235,100 0.1164,219,000 1,104,000 94,800 0.0184,567,000 1,104,000 235,100 0.041
1,386,000 290,700 209,800 0.1251,734,000 290,700 648,800 0.3204,219,000 1,104,000 209,800 0.0394,567,000 1,104,000 648,800 0.114
PRESENT WORTH PRESENT WORTHOF ANNUAL COST OF BENEFITS
($) ($) B/C
1-11

No. 4. Specifically, the rearing juvenile population of chinook
salmon would be supplemented to full seeding with hatchery
fingerlinqs or fry whenever adult escapement is below that
necessary for full natural seeding. In addition, 550,000 chinook
smolts would be outplanted to the upper watershed each year to
imprint and move out. The adult fishery would be targeted on
hatchery fish, not naturally-reproduced fish. Such a management
program would have significant implications for the enhancement
options evaluated by OTT. The commitment to seed with hatchery
fry or fingerlings and the outplanting of 550,000 smolts per year
would eliminate the necessity for correction of upstream migration
impairment. The only benefit to the Lemhi River salmon and
steelhead stocks of the options would be increased rearing habitat
provided by Options B and D. These benefits would be marginal in
the face of the proposed smolt outplanting program. Thus, if IDFG
implements the full-scale hatchery supplementation program as
described, then the options evaluated by OTT should be considered
alternatives to the supplementation proqram, not an adjunct to it.
It is important to recognize that the costs associated with all
options and management alternatives are greater than the expected
benefits. Thus, B/C ratios are all less than 1.0.
OTHER CONSIDERATIONS
The success of any program to realize water savinqs by improved
surface irrigation or sprinklers depends on cooperation from the
irrigators. Whether an irriqator decides to sell all or part of a
water riqht depends on the cost and crop yields produced by the
improvements.
Before initiating a program to improve surface irrigation or
install sprinkler systems, it is advisable to perform an
assessment of actual achieved crop yields and effects on
groundwater recharge. A demonstration project is one method for
1-12

determining these factors. Tn addition, such a project would
provide verifiable evidence to local irrigators that improved
irrigation water application can produce larger and higher-quality
yields.
Consideration also should be given to directly purchasing land
having senior water rights. Enough land would need to be
purchased to satisfy minimum flow requirements for fish at the
most critical passage reaches downstream of diversions L-5 and
L-6. The surface water right attached to this land could be
transferred from the beneficial use of irrigation to fish
enhancement. Other benefits from this alternative could be the
conversion of grazing land to wildlife habitat or to public
recreational areas.
BPA, as a Federal agency, cannot directly purchase land or
improve irrigation systems to the benefit of an individual. The
only exception is Federal "interest" in the land under
consideration. It is most likely that both the holder of water
rights secured in an exchange, and the purchaser of land or water
rights would be the IDFG.
RECOMMENDATIONS
Based on the results of this Study, OTT recommends that
enhancement Option B in conjunction with Fisheries Management
Alternative No. 4 be evaluated in greater detail. This
recommended Option/Management Alternative results in the greatest
B/C ratio of the measures evaluated as part of the Study. Further
analysis of this option should focus on the considerations
previously noted regarding landowner cooperation, actual crop
yields, land acquisition constraints, legal limitations, IDFG's
actual fisheries management practices, and implementation of the
irripation diversion screen and bypass improvement program.
Completion of the screen improvement program, coupled with the
1-13

testing of appropriate bypass system designs, is recommeded prior
to implementation of Option B.
OTT also recommends that the complex issues of a mixed stock
fishery and hatchery versus natural production be carefully
examined, perhaps in an expanded fisheries production model of the
Lemhi River, after the IDFG has solidified its anadromous
fisheries management strategy for the River. The results of this
Study will assist in that effort.
1-14

CHAPTER 2
INTRODUCTION
The Lemhi River, located in Eastcentral Idaho, is situated between
the Continental Divide to the east, and the Lemhi Range to the
west. From its headwaters near Leadore, Idaho, the River flows
some 60 miles in approximately a northwest direction to its
confluence with the Salmon River at Salmon, Idaho.
Around the turn of the century, the Lemhi was dammed near the
mouth to provide hydropower. The dam was not constructed with
fish passage facilities and the runs of chinook salmon and
steelhead were lost. After removal of the dam in the 1920s, the
chinook and steelhead runs were re-established, and by the mid-
1960s there were an estimated 2,000 to 3,000 spring chinook in
the Lemhi. Irrigation withdrawals and low flows have since
contributed to a significant decline in the anadromous fish runs
in the Lemhi.
STATEMENT OF PROBLEM
Major uses of water from the Lemhi River include irrigation,
domestic water supply, and fish production. Irrigation
withdrawals for grazing land and hay crops occur throughout the
mainstem and its tributaries. Fish uses include rearing and
spawning for steelhead, spring chinook, and resident fish. During
the spring before snowmelt and the summer after snowmelt, flow in
the River is of ten insufficient to meet irrigation needs and
instream flow requirements for upstream and downstream migration
of anadromous fish. Since adjudicated water rights for the Lemhi
River do not provide for minimum instream flows for fish, the
stream is often over drafted and impassable to fish in the lower
reach of the River between Hayden Creek and the Salmon River.
2-1

Adult steelhead return to the Lemhi River during the period March
21 to May 30 with most of the migration occurring during the
period April 10 to May 20 (Bjornn, 1978). Juvenile out-migration
occurs in September through January and again in April through
June. Adult spring chinook salmon migration in the Lemhi River
begins as early as mid-May and continues throughout the summer
until approximately mid-September. Peaks in upstream migration
generally occur in mid-June and late August. Downstream migration
of spring chinook juveniles occurs throughout the year. True
seaward miqration, however, occurs in the months January to June
with peak migration in April (Bjornn, 1978).
The irrigation season in the Lemhi Basin runs from approximately
April 1 to November 1 of most years (seasonal variation in weather
may change this timing). Migration of anadromous fish occurs
principally within the irrigation season, especially during the
low-flow period of April and May. During low- to average-water
years, a conflict usually exists between irrigation and fish uses.
The conflict is due primarily to limited flow in the lower River
and irrigation dams at various locations on the River.
OBJECTIVE OF THE STUDY-
The need for improved migration, spawning, and rearing flows in
the Lemhi River was addressed in the Northwest Power Planning
Council's Columbia River Basin Fish and Wildlife Program (1984).
The Council directed the Bonneville Power Administration (BPA) to
fund the Lemhi River Habitat Improvement Program under Section 700
of the Fish and Wildlife Program. On August 17, 1984 the BPA
retained Ott Water Engineers, Inc. to perform this Study under
Contract No. DE-AC79-84BP17447.
The Study was performed in three phases:
0 Phase I - Literature Search, Problem Description,
Hydrology, and Stream Survey.
2-2

0 Phase II - Analysis of Alternatives for Habitat
Enhancement.
0 Phase III - Detailed Stream Survey, Estimate of Smolt
Production, and Benefit/Cost Analysis.
The objective of Phase I was to identify the problem and revise
the scope of work contained in the contract, if necessary, to
facilitate a cost-effective and thorough analysis that meets the
requirements of the cognizant agencies. Additional efforts in
Phase I, Literature Search and Hydrology, provided the background
information necessary for Phase II. Phase II was a development
and analysis of enhancement alternatives. The objective of Phase
II was to investigate enhancement alternatives to a level that
determined if they are individually feasible, or some combination
of alternatives is feasible. The objective of Phase III was to
determine the auantity and quality of spawning and rearing habitat
that would be available to anadromous fish if alternatives
developed in Phase 11 were implemented. Further objectives of
Phase III were to determine the smolt production capability of the
Lemhi River if habitat enhancement measures are implemented, and
finally to determine the benefit/cost ratio of proposed
alternatives.
Phase I of the Study is reported in Chapter 3. The description
and analysis of enhancement alternatives, Phase II, are presented
in Chapter 4. The details of the benefit analysis, benefit/cost
ratios, and results and conclusions, which comprise Phase III, are
given in Chapters 5, 6, and 7.
2-3

CHAPTER 3
ANALYSIS
In the analysis portion of the Study, data and analysis results
were compiled as input to Phases II and III of the Study. The
collection and analysis of background information was performed in
a step-wise process. Each milestone represented the completion of
a Study task, tor which OTT produced a draft task report.
Throughout the Study, and especially in developing preliminary
designs for alternative solutions, modifications and additions
were made to the approach and details of the analysis. This
chapter summarizes the details of our final assessment of
background literature, water rights, basin hydrology, materials
and construction costs, and fish habitat availability.
LITERATURE SEARCH
During the initial stages of the Study, OTT performed a
c omprehensive literature search and data collection effort:
subseuuently, OTT identified the types of essential information
that needed to be gathered from agencies, libraries, and personal
communication.
An annotated bibliography of data and information sources is
presented in Appendix C. The bibliography is divided into the
following major categories: Hydrology, Water Rights and
legislation, Fisheries, and Geology. In addition to a description
of the contents for each publication, the utility of that source
is summarized.
OTT's analyses used all the sources initially collected. Although
data were collected during the course of the Study, OTT developed
the core background materials in the initial stages. Interviews,
3-l
personal communication, and field trips provided a great amount
of supporting data for the evaluation of alternative solutions.
WATER RIGHTS ISSUES
BACKGROUND
The division and appropriation of water has created conflict in
the agriculturally-based Lemhi River Basin for over 50 years.
Topsoils are generally gravelly or sandy and quite porous,
particularly in the upper portion of the Basin. The exception is
along the lower floodplain where silty loam soils are present.
This combination of physical conditions is not conducive to
high-value row crops, so the predominant agricultural products are
alfalfa-grass hay and pasture for cattle. Water supply for
irrigation and domestic use during the summer is enhanced
(relative to the sparse amount of precipitation) by springs and
groundwater in the Basin's hydrologic system.
ADJUDICATION
Eight petitioners (water users in the Lemhi Valley) initiated the
adjudication of water rights in the Lemhi Basin by requesting the
Idaho Department of Water Administration (now the Idaho Water
Resources Department or IWRD) adjudicate the water resources of
the Lemhi River and its tributaries. Based upon claims submitted
by users, old records and files at IWRD, and field studies of the
Lemhi Valley, the Department issued a proposed finding. This
document tabulates the water right claimants as well as the
priority, purpose, period of use, and maximum rate of each
diversion. The document lists both surface water and groundwater
rights.
The "Proposed Finding of Water Rights in the Lemhi River Basin"
states several factual findings regarding the causes for dispute
3-2

among water users and the general irrigation practices of ranchers
in the Valley. These findings include:
0 There are periods during the year when the appropriated
water rights of irrigators exceed the available stream
flow in the Lemhi River and its tributaries. Thus, the
River can be diverted in its entirety at times,
especially in the spring prior to snowmelt and in the
latter part of the summer when crop demand is highest.
0 The diversion of water from Lemhi tributaries has, at
times, been without regard for the priority of rights of
mainstem users, which is contrary to Idaho's "first in
time" policy.
0 Water right quantities are set by acreage, crop
requirements, and transport losses. The allowances for
water loss due to canal and ditch leakage as well as
application inefficiency are generally high.
0 The Lemhi Basin has basically no storage facilities.
Generally, during late April or early May, irrigators
apply large quantities of water to their fields to store
water in the soil and to raise the water table. This
practice begins in the upper Lemhi Basin a few weeks
earlier than in the lower Basin.
0 There are certain minimum stream flows and required
return flows associated with fish screen facilities
that have been established as part of the adjudication.
However, the priority of these water rights is low.
0 Each user must install and maintain a suitable headgate
and measuring device.
3-3

In essence, the document outlines the major water use problems in
the Lemhi Valley and specifies the basis on which resources were
divided.
Unfortunately, there are several major discrepancies between the
requirements made in the adjudication document and the actual
practices by irrigators in the Valley. For instance, OTT
discovered that there is no watermaster monitoring water
quantities except for the Town Ditch Company. Individual users or
Board members of the Lemhi Irrigation District (LID) settle
disagreements. The LID is an association of water users whose
main function is to arbitrate water use disputes among its
members. Adjudicated quantities may not at all be related to the
amount of water actually diverted, i.e., ranchers basically take
what they need from the River. This practice is actually legal,
because according to Idaho law, unlimited quantities can be
diverted as long as there are no conflicts for usage. Based on
initial observations, the high allowance for ditch and application
efficiencies seems to be warranted. Most transport canals are
rough, porous, and inadequately maintained, and application
methods are generally not efficient. During field visits, OTT
found very few headgates were adequate for correctly measuring
diverted flow auantities.
The table in Appendix A, developed from the adjudication document,
lists all the diversions on the mainstem Lemhi River. The
significant remarks referring to "critical" and "problem"
diversions are reaches where fish migration is most compromised,
according to Idaho Department of Fish and Game personnel in
Salmon, Idaho. Appendix B gives maps of the River that identify
irrigation diversion and stream flow measurement locations.
3-4

WATER LAW
There are several facets of water law in the State of Idaho which
will affect efforts to improve conditions for anadromous fish in
the Lemhi River.
The following statements affect the general approach to the Study
or the consideration of several alternative solutions:
0 All water in natural channels, lakes, and springs is the
property of the State of Idaho and is therefore subject
to appropriation, including qroundwater. Any alterna-
tives which consider replacing or supplementing surface
diversions with spring or groundwater sources must
account for the process of securing the appropriate
water rights.
0 A water right is not a property right in itself; it
becomes an appurtenance of the land to which it is
applied. This is the reason that the status of instream
rights on the Lemhi is in question. Although the State
considers fisheries to be a beneficial use, all
currently-established minimum flow bypass rights at
screen facilities are specified for only a point source,
not for a length of river or stream. There is a
possibility that instream rights could be established.
However, instream flows would have to be associated with
prior (old) water rights in order to be beneficial to
fish on a consistent basis.
0 No user can interfere with prior right diversions, i.e.,
the first in time is the first in right. This principal
will affect any alternative which includes obtaining new
instream rights or the purchase of old water rights.
3-5
0 After a construction permit is issued to install a
diversion or storage structure or some other instal-
lation for beneficial use, work must begin within five
years. Such a law would apply to any alternatives for
building permanent diversion or dam structures.
0 It is the policy of Idaho water law to secure the
maximum use and benefit from water resources in the
State.
0 In order to obtain the water quantity to which a
claimant is entitled, claimants can alter the River bank
or bottom without obtaining the usual permits for
channel alteration. Thus, each year claimants use
bulldozers, rocks, and hay bales to build temporary dams
which sometimes extend the width of the River.
The following statements affect the consideration of specific
alternative solutions:
0 Several legalities must be weighed when assessing
groundwater irrigation or the possibility of
supplementing stream flow in the Lemhi with well water.
The method or type of diversion (surface versus
groundwater) may be changed if the rights of other
claimants are satisfied. However, changing the type of
right (i.e., from surface right to groundwater right)
does not maintain priority. When wells interfere with
each other or with surface diversions, the policy of
prior rights applies: historic pumping levels must be
maintained.
0 Purchasing land with old surface water rights and
changing the beneficial use to fisheries is one of the
alternatives under study. The IWRD must be provided
3-6

with information regarding the transfer or sale of a
water right, and all such actions are subject to
Department approval. In this case, the “new” beneficial
use (fisheries) would have the same priority as the
“old" beneficial use (irrigation) if both rights were of
the same type (i.e., a surface water right).
0 A general policy exists for using water efficiently.
Even though a water right is attached to the acreage to
which it is applied, a right can be obtained by simply
diverting flow and applying it to beneficial use. These
factors could allow water "saved" through irrigation
efficiency to be applied on different or new acreage.
However, this possibility is lessened by the fact that
there is almost no available land in the lower Valley
for expansion and that desert reclamation in the upper
Basin is expensive.
0 Installation of a storage reservoir in the Lemhi system
is an alternative that has been studied since the 1940s
by the Bureau of Reclamation and Corps of Engineers, and
is subject to numerous legal requirements. If stream
flow is interrupted by the storing of water in a dam,
downstream water claimants have a right to "ordinary"
flow if needed. Storage rights are treated separately
from other types of consumptive uses, and are considered
to be a different type of right.
ALLOCATION
The method by which water rights are allocated is site specific
and based upon consumptive use and various losses for a particular
application. In the past, a miner's inch per acre has been used
for determining allowable water requirements. For 100 acres, this
would amount to about 3 cfs throughout the irrigation season.
3-7

More recently, considerations have been qiven to crop requirements
and transport or application losses.
In the Lemhi Valley, about 1.5 to 2.0 acre-feet per acre are
reauired at the field to satisfy the consumptive use of the crops
and the evaporation loss over one irriqaton season. Depending on
the location of the field and the method of irrigation, losses are
added for application inefficiencies, percolation, and ditch
losses. On a basin-wide average, this total amounts to approxi-
mately 15-20 percent of the water right at the field. Upon
determining the land area and water requirement for the point of
diversion, a water volume can be calculated. Using the period of
irrigation, a quantity of flow is then computed which is the
maximum amount allowable for diversion.
Although this analysis is fairly detailed to evaluate the flow
actually needed by a claimant, one must remember the general law
of "beneficial use". This allows ranchers to divert virtually all
of the sprinq runoff in the Basin for intense application to their
fields in order to store water in the soil.
CONCLUSION
The water availability and allocation problems in the Lemhi River
Basin are complex and not subject to simple solution. One of the
factors complicating this Habitat Improvement Study is the water
law relatinq to irriqation and drainage. Basically, these laws
were established to favor agriculture as the most beneficial use
and to settle disputes among claimants. In evaluating the
alternative solutions for the Rasin, both the legalities and
practical application of water rights issues were considered.
3-8

HYDROLOGY
INTRODUCTION AND OBJECTIVE
The Lemhi River Habitat Improvement Study required an evaluation
of the hydrologic characteristics cf the Lemhi Valley. OTT's qoal
was to assess the interaction between surface water runoff,
groundwater influences, and irrigation withdrawals in order to
define the frequency and quantity of low flows at certain critical
reaches. In addition, OTT identified steelhead and chinook salmon
minimum flow requirements for passage. The combined products from
these analyses resulted in the stream flow quantities which must
be provided for successful fish passage.
This section presents the results of our analysis, which provided
the basis for preliminary desiqn of alternative solutions and for
OTT's recommendations for improving fish passage and habitat in
the Lemhi River.
APPROACH
In order to achieve these objectives, the work was divided into
four subtasks as follows:
Subtask 1 : Target Minimum Flows
Compute the stream flow necessary for salmon and
steelhead passage.
Subtask 2 : Existing Low Flows
Determine the quantity and f reauency of
occurrence of historical low-flow periods at
critical reaches.
3-9

Subtask 3 : Flow Augmentation
Calculate the quantity of flow which must be
added to the River in order to satisfy fish
passage requirements. Also, attach a frequency
and amount of time (duration) to these stream
flow values.
Subtask 4 : Groundwater Hydrology
Develop the groundwater and geologic parameters
necessary for evaluating alternatives that
include groundwater pumping.
REACHES AND SUBREACHES
The Lemhi River and Hayden Creek were divided into stream reaches
based on major hydrologic inflow points, observable differences in
channel type, and areas identified as historically critical to
fish passage due to extended low-flow periods. These critical
reaches have been defined through field investigations and
consultation with Idaho Department of Fish and Game (IDFG).
Eight major river reaches have been defined for the Lemhi River
and its main tributary, Hayden Creek. These are shown on
Fiqure 3.1. Each reach was numbered sequentially so that
subreaches could be identified with a lettering system (e.g., lA,
1B, lC, etc.). Subreaches for Hayden Creek were also defined with
this number-letter code system.
The eight reaches and their locations are as follows:
1. Lemhi River - Mouth (RM 0.0) to Baker (PM 12.0, at
L-11*).
* Refers to surface water diversion. See Appendix B.
3-10

SALMON
FIGURE 3.1LEMHI R I V E R
HABITAT IMPROVEMENT STUDY
REACH DEFINITIONt
DATE: NOVEMBER 1985
J O B N U M B E R : SlO28.03

2. Lemhi River - Baker (RM 12.0, at L-11) to Agency Creek
Confluence (RM 22.8, at L-30).
3. Lemhi River - Agency Creek Confluence (RM 22.8, at L-30)
to Hayden Creek Confluence (RM 30.3, at L-41).
4. Lemhi River - Hayden Creek Confluence (RM 30.3, at L-41)
to Big Eightmile Creek Confluence (RM 45.1, at L-58A).
5. Lemhi River - Big Eightmile Creek Confluence (RM 45.1,
at L-58A) to Confluence of Eighteenmile Creek and Texas
Creek (RM 52.3, at L-63).
6. Lemhi River - Headwater Streams (above RM 52.5).
7. Hayden Creek - Mouth (CM 0.0) to East Fork Confluence
(CM 9.1).
8. Hayden Creek - Headwater Tributaries (above CM 9.1).
DIVERSION AND MEASUREMENT LOCATIONS
OTT mapped and tabulated the location and flow auantities for all
diversions along the mainstem Lemhi River. These data provided a
basis for analyzing the hydrology of the Basin because of the
importance of flow diverted for irrigation. During spring and
summer of 1985, OTT made three trips (May, June, and July) to the
Lemhi Valley to measure flows in the River and collect
information. OTT also gathered records of flow measurements taken
by the Lemhi Irrigation District (LID) for several irrigation
seasons.
OTT and the LID flow measurement locations and diversions are
listed in the table in Appendix A. OTT locations are prefixed by
" LOC"" and LID measurement points are given a prefix of "LM". The
3-12

irriqation diversions have the prefix "L". These identifiers will
he referred to in the following sections addressing target and
predicted historical minimum flows.
TARGET MINIMUM FLOWS
Objective
The purpose of this subtask was to estimate minimum flows for
upstream salmon and steelhead passage in the Lemhi River system.
The results were compared with historical low-flow values of
various frequencies in order to determine the flow quantities
which must be conserved or added to the system at critical
locations.
Stream Flow Data
Flows at various points alonq the River are a function of runoff,
tributary inflow, qroundwater contribution, and irrigation
withdrawals. OTT staff took flow measurements at 28 consistent
locations along the Lemhi River and its tributaries during each
field trip. OTT also measured many other locations along the
River and in irrigation ditches during the June and July trips.
Staff then computed depths, velocities, and several other
hydraulic parameters for the transect measurements at each
location.
Minimum Flow Analysis
In determining instream flow quantities for salmon and steelhead,
OTT collected information on fish passage requirements.
Additionally, OTT reviewed literature pertaining to studies
conducted on the Lemhi River Rasin. Using selected criteria, the
results of our hydrologic studies and cross-section surveys, OTT
performed a hydraulic analysis to compute minimum flow for various
3-13

reaches of the River. Instream flows recommended by OTT's Study
are based on transect measurements within five of the Lemhi River
Basin reaches. The Study also determined a minimum flow for
Hayden Creek near its confluence with the Lemhi.
A relatively limited amount of information is available on passage
reuuirements for adult anadromous fish and smolts. Most instream
flow studies are oriented toward spawning habitat, such as those
conducted on the Lemhi River by Cochnauer (1977) and on Big
Sprinqs and Big Timber Creeks by Horton (1982, 1984). Because of
the importance of adult passage problems on the Lemhi, created by
low-flow periods combined with irrigation diversions, OTT
developed a depth-flow function.
Fish Migration
Anadromous fish in the Lemhi River Basin must maintain their flow
requirements for upstream and downstream passage, spawning,
incubation, rearing, and for maintenance of water quality
(Goodnight and Bjornn, 1971). The discussion below is directed
towards the problem of upstream passage because of the
consequences which can occur, such as decreased run size, when a
generation of adults is prevented from spawning.
Migration timing in the Lemhi River varies considerably from year
to year. This probably results from variations in temperature and
turbidity downstream from the Lemhi in the Salmon River, and flows
within the Lemhi Basin. Figure 3.2 shows average timing of adult
steelhead and chinook salmon based on data from the Lemhi weir
trap taken between 1965 and 1975 (Bjornn, 1978). During some
years, salmon returns peak as early as mid-June, while delayed
runs in other years may peak in mid-July with a secondary peak in
early September. It is therefore important that instream flow be
carefully monitored to coincide with fish periodicity each year,
3-14

UPSTREAM
STEELHEAD
S P R I N G C H I N O O K
S U M M E R C H I N O O K
DOWNSTREAM
P R E - S M O L T S
SMOLTS
CHINOOK
STEELHEAD
I\\\\\\\\\\\\\1I\\\\\\W
I\\\\\\\\\]I I I I I 1 I I I I 1 I 1
JAN FEB MAR APR MAY JUN JUL AUG SEP OCT NOV DEC
MONTH
FIGURE 3.2LEMHI R I V E R
HABITAT IMPROVEMENT STUDY* INDICATES POSSIBLE EXTENT OF MIGRATION PERIOD
STEELHEAD & CHINOOKMIGRATION PERIODICITY
DATE: NOVEMBER 1985
JOB N U M B E R : S1028.03

or that minimum flows be maintained throughout the potential
migration season.
Passage Criteria
Instream flow criteria for passage mainly involve water depth,
although the Study considered water velocity, channel width,
length of critical passage area, and other factors. Thompson
(1974) and the Oregon Department of Fish and Wildlife (Oregon
Method) proposed depth criteria in natural streams for salmon and
steelhead as 0.8 feet for chinook and 0.6 feet for adult
steelhead. These depths assume that passage is across a shallow
bar of limited length. In these studies, passage criteria had to
be met over a continuous section of channel representing at least
10 percent of the stream width. No criteria were given for length
of the passaqe blockage.
Based on OTT's measurement of stream flows at 28 transect
locations within the five River reaches, it appears that
velocities are not a limitinq factor for passaqe during low flows.
Limiting areas appear to be short blockages near irrigation
diversions or lonqer riffle areas where the fish may have to
sustain swimming for distances of several hundred feet in shallow
riffles.
Passage criteria that were utilized:
1. For passaqe blockages less than 20 feet in length:
a. Averaae channel depth must exceed 0.8 feet, or
b. Maximum channel depth should be at least 1.0 feet
over a continuous section of 10 percent of the
stream width.
3-16
2. For blockages over 20 feet in lenqth, requiring
sustained swimming:
a. Averaqe channel depth should be at least 1.0 feet,
or
b. Maximum channel depth should exceed 1.25 feet over
at least a continuous section of 10 percent of the
stream width.
OTT evaluated each measured cross section seoarately so the proper
set of criteria, 1 or 2, could be applied. Subsequently, minimum
flows were computed using the method described below.
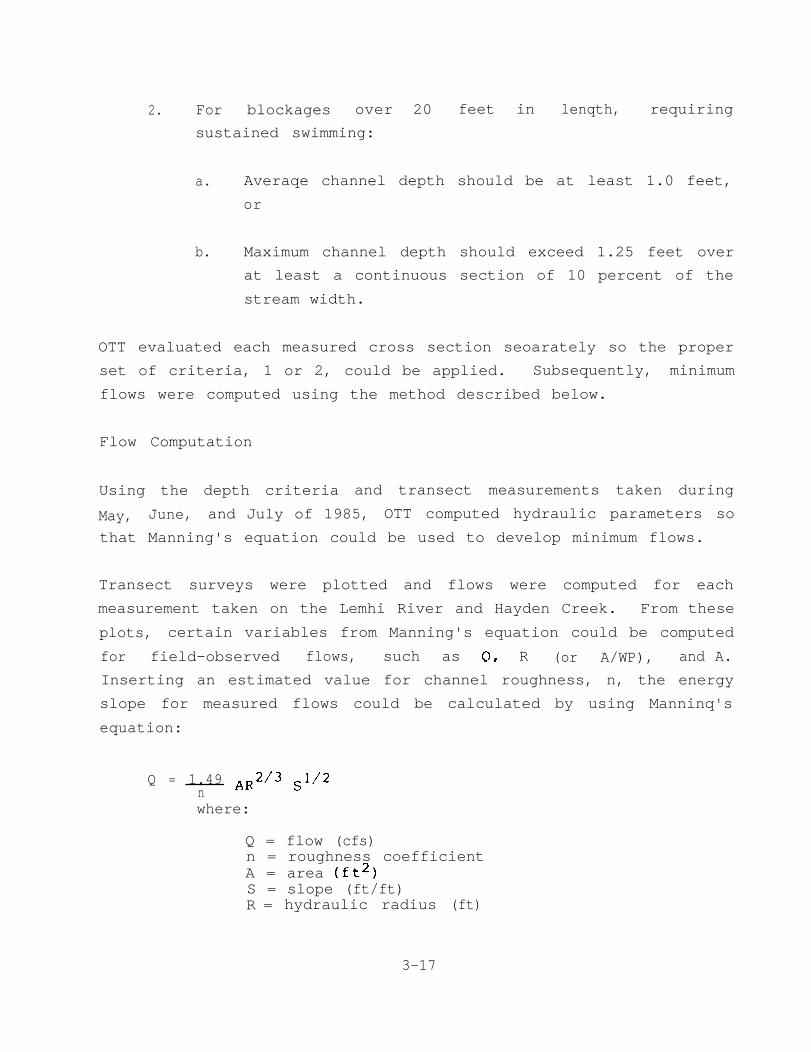
Flow Computation
Using the depth criteria and transect measurements taken during
May, June, and July of 1985, OTT computed hydraulic parameters so
that Manning's equation could be used to develop minimum flows.
Transect surveys were plotted and flows were computed for each
measurement taken on the Lemhi River and Hayden Creek. From these
plots, certain variables from Manning's equation could be computed
for field-observed flows, such as 0, R (or A/WP), and A.
Inserting an estimated value for channel roughness, n, the energy
slope for measured flows could be calculated by using Manninq's
equation:
Q = 1.49 AR2/3 S1/2nwhere:
Q = flow (cfs)n = roughness coefficientA = area (ft2)S = slope (ft/ft)R = hydraulic radius (ft)
3-17

Channel depth, stream width, and blockage length criteria were
applied to the measurement locations along the Lemhi River using
the transect plots. The criteria depths resulted in new values
for A, wetted perimeter (WP) and R. These hydraulic parameters,
combined with the previously calculated energy slopes and the
estimated roughness coefficients, allowed the computation of
minimum flows at each measurement location.
Minimum Flow for Channelization
In addition to estimating minimum flows for the existing River
channel, OTT applied passage depth criteria to the artificial
channel cross section, described in the Flow Concentration Section
of Chapter 4. Channelization is intended to concentrate low flows
in the thalweg (main flow channel) in order to enhance migration.
Using a typical river slope and roughness, the resulting minimum
channel flow is 6 cfs in the excavated channels.
Results
Based on the approach of combining depth criteria with a hydraulic
analysis, OTT developed minimum flow recommendations. These flows
are summarized in Table 3.1. Each minimum
a measurement location code (Appendix A)
selection, and reach number.
EXISTING LOW FLOWS
Objectives and Approach
The objective of performing a hydrologic analysis of the Lemhi
flow is identified with
I river mile, criteria
River was to reconstruct flows at "critical" reaches, with
particular emphasis on the low-flow regime. Low-flow guantities
and the frequency with which these occur are important because of
the impacts on chinook salmon and steelhead migration.
3-18

LOC #*
RIVERMILE(MI)
MINIMUMFLOW
(CFS) LOCATION REMARKS
1 1.20 28.1 between L-l and L-2
2 4.70 25.3 between L-3A and L-3B
8 7.07 19.0 downstream of L-5
7** 7.14 20.3 immediately downstream of L-5
4** 7.33 14.5 immediately downstream of L-6
5 7.42 11.9 immediately upstream of L-6
9 9.20 29.0 between L-8 and L-8A
10 13.10 35.2 at L-14
11 16.65 35.0 between L-19A and L-20
13 18.30 39.3 between L-23 and L-24
14 22.70 39.9 just downstream of L-30
15 25.00 26.1 at USGS gage
16 25.60 31.9 just downstream of L-31A
17 28.50 23.9 between L-38 and L-39
18 29.90 22.1 between L-39 and L-40
20 30.80 25.0 upstream of L-42A & B
21 33.50 24.9 downstream of L-49
22 37.10 25.8 upstream of L-45D
23 39.50 37.1 at L-48
19 H-0.50 16.4 Hayden Creek near confluence with Lemhi
TABLE 3.1
MINIMUM REQUIRED FLOWS FOR UPSTREAM PASSAGE
LEMHI RIVER
* These are OTT measurement location codes. See maps in
Appendix B.
** Most critical locations for passage during low flows.
3-19

The task included three steps:
0 Acquisition and evaluat
data.
ion of basic hydrometeorolog ic
0 Data analysis, including estimation of irrigation and
groundwater return flow along the Lemhi River.
0 Reconstruction of flows and derivation of flow duration
and flow frequency curves for critical reaches between
Leadore and the confluence with the Salmon River.
Data Acquisition
Stream Flow Data
The U.S. Geological Survey (USGS) has collected stream flow data
at a number of sites in the Lemhi Basin. LID and OTT also have
made numerous miscellaneous measurements of both mainstem flows
and irrigation withdrawals. Maps in Appendix B delineate OTT and
LID measurement locations. Table D.l in Appendix D gives the
station names, drainaqe area, and periods of record for the
available USGS data. The locations of the principal gag i ng
stations are shown on Figure 3.3.
On Table D.l the only USGS qaqe now in operation is gage 13305000
(Lemhi River near Lemhi). This gage provides the record OTT
utilized in correlating qaged flow with miscellaneous measurements
taken by LID and OTT to develop a flow model. The record starts
in 1938, with gaps from 1939 to 1955 and from 1963 to 1967. Data
collected prior to 1967 were taken at a site 1.4 miles upstream of
the current gage location. There are three large irrigation
diversions between the old and new gaging stations: therefore,
only data collected at the present gaging site since 1967 were of
value for use in this Study.
3-20

tP:41 x HALLx HALL CREEKCREEK
K E YK E YFIGURE 3.3FIGURE 3.3
AA STREAM FLOW GAGESTREAM FLOW GAGELEMHI R IVER
00 PRECIPITATION GAGEPRECIPITATION GAGE HABITAT IMPROVEMENT STUDYHABITAT IMPROVEMENT STUDY
LONG -TERMLONG -TERMa P R E C I P I T A T I O N A N D T E M P E R A T U R E G A G Ea P R E C I P I T A T I O N A N D T E M P E R A T U R E G A G E DATA COLLECTION SITESDATA COLLECTION SITES
XX SNOW SURVEY SITESNOW SURVEY SITE OAT E: NOVEMBER 1985OAT E: NOVEMBER 1985OTTOTT
J O 8 N U M B E R : SlO28.03J O 8 N U M B E R : SlO28.03 EE

Precipitation and Temperature Data
The National Weather Service has collected daily precipitation
data at both Salmon and Leadore and daily maximum and minimum
temperatures at Salmon. Station characteristics and periods of
record are given in Table D.2 and the station locations are shown
on Figure 3.3. Boxplots of monthly precipitation at Salmon are
given in Figure D.l.
Snowpack Data
The Soil Conservation Service operates several snow survey sites
in the higher elevations of the Lemhi Basin from which snowpack
water equivalent may be obtained for the first day of every month
from January through April. Table D.3 shows the station elevation
and period of record. Figure 3.3 shows the survey sites.
Data Analysis and Results
Reconstruction of low flows in the Lemhi River was based on the
analysis of daily stream flow data at the USGS gage near Lemhi
from 1968-1984 (a total of 17 water years). Approximate
relationships were developed to correlate low flows at the gage
with those at critical diversion points. These relationships were
established by comparing miscellaneous discharge measurements at
various locations on the River with concurrent data for the gage
using a mass balance analysis.
The mean quartiles (25 percent, 50 percent, and 75 percent
exceedances) of the monthly flows at the Lemhi gage for the period
of water years 1968 through 1984 are given in Table D.4, and
plotted in Figure D.2. Flow duration curves based on daily data
were also calculated for the Lemhi gage for the months of March
through September and are shown in Figures D.3 through D.9.
3-22

Annual 15-day low flows were then calculated from daily flow data
for two flow seasons, "spring" and "summer". These data were
ranked and plotted on probability paper. Fitted log-normal
probability distributions were developed and graphed. Curves for
the gage are presented in Fiqures D.10 and D.ll in Appendic D, and
for Hayden Creek on Figures D.12 and D-13.
Flow Seasons
Two flow seasons were defined for the irrigation period. This was
necessary to differentiate between normal groundwater return
flows, and hiqher return during the summer flows due to excessive
flood irrigation. Timing and intensity of the irrigation season
fluctuates from year to year, depending on climatic conditions and
available stream flow. Therefore, the occurrence of peak flow due
to snowmelt was selected to divide the spring and summer seasons.
The spring season extends from mid-March to the peak of River flow
due to snowmelt, while the summer season extends from peak flow
through mid-October. Mid-March and mid-October are the limits on
the period of irrigation in the Lemhi Valley.
The shape of the curves in Figures D.10 and D.11 shows that the
probability and intensity of low-flow events vary considerably
between the spring and summer seasons. Spring stream flows are
most variable because the snowmelt runoff, snowpack quantity and
quality, temperature, rainfall, and irrigation diversion
withdrawals all can interact in combinations of timing and
magnitude. This is the reason why critical low-flow events occur
relatively frequently in the lower Lemhi Valley.
Low-Flow Duration
A duration of 15 days was established as the critical low-flow
duration. This represents the approximate amount of time required
3-23

to produce a blockage to salmon and steelhead migration from the
mouth of the Lemhi to the headwaters, where habitat is most
abundant (Buell, pers. comm.). OTT developed frequency curves for
7-day and 15-day low flows. These curves were very similar.
Groundwater Return
Intense flood irrigation contributes significantly to the
groundwater return flows during the mid to late irrigation season;
therefore, groundwater returns are generally lower and more
consistent in the spring season. It was determined that different
groundwater return flow rates occurred at four reaches.
Once irrigation water percolates and moves through the aquifer,
return flows increase during the summer season. Then they become
hiqhly dependent on the soil and rock characteristics of the
aquifer along the floodplain of the Basin. Thus, six reaches
exhibiting uniaue groundwater return characteristics were
identified for summer flow analyses. Boundaries of flow reaches
were set at LID or OTT measurement locations to coincide with the
mass balance analysis.
Hayden Creek Analysis
In order to predict stream flow upstream of Hayden Creek, the
major tributary to the Lemhi River, an analysis was made of
contributing flow. Bureau of Reclamation records as well as OTT
and LID measurements of Hayden Creek flow were used to correlate
daily data at the USGS gage at Lemhi to the data taken at Hayden
Creek. Ratios were developed relating average monthly flows on
Hayden Creek at the mouth to those at the Lemhi River gage. These
ratios are presented in Table D.5 (Appendix D). A synthesized
daily flow record for Hayden Creek was then created and used in
assessing 15-day low flows (Fiqures D.12 and D.13).
3-24
East/West Channel "Split"
Several critical areas have been identified in the East Channel
upstream of the point where the River "splits" (between L-58B and
L-58C). Therefore, an estimate was developed for the average
division of flow between the East and West Channels. Field data
collected by OTT and Buell & Associates, Inc., show approximately
55 percent of total Lemhi River flow upstream of the "split" is in
the East Channel.
Lemhi River Flow Model
Groundwater return flows were estimated to develop a model for
further estimating 15-day low flows upstream and downstream of the
USGS gage. Total return flow represents the sum of groundwater
returns via the Basin aquifer (deep percolation) plus surface
returns from irrigation waste. These estimates were made using
Lemhi River and diversion canal measurements taken by OTT during
1985 and LID during 1979, 1981, and 1983. Measurements of Hayden
Creek are included also in these data.
In addition, the average utilization (percent) of adjudicated
water right was quantified. Because of the tremendous influence
that irrigation withdrawals have on Lemhi River flow, this factor
is important to the estimation of both return and stream flows.
A mass balance approach was taken in applying data gathered by OTT
and LID to estimate return flow. The general equation follows:
Q2 = Q1 - (DIVERSIONS * WRU) + (RETURN RATE * (RMl - RM2))
where: Q2 = a measured or predicted flow downstream of Ql,
(cfs)
3-25
DIVERSIONS = the sum of diverted flow between Ql,
and Q2 sites (cfs)
WRU = average fraction of water rights utilized
(%used/lOO%)
RETURN RATE = groundwater and surface return flow
rate (cfs/mile)
RMl = river mile of 01 site (mi)
RM2 = river mile of Q2 site (mi)
Values obtained for return flow rate were assessed to determine
seasonal average values. Diversion canal measurements also were
analyzed for developing water right utilization percentages for
spring and summer. Subsequently, these results were integrated
into a model for computing seasonal 15-day low flows at each
diversion. Return flow and WRU values are presented in Table 3.2
for specified reaches. These parameters were used in all
alternative solution designs.
Predicted 15-day low flows, immediately below each irrigation
diversion for return periods of 2, 10, 20, and 50 years, are shown
in Tables D.6 (spring) and D.7 (summer). Mean seasonal 15-day
low flows, which were used in assessing fisheries benefits, are
given in Tables D.8 and D.9. These were created by applying
shifts to low-flow values developed for the USGS gage.
Flood Frequency Analysis
Instantaneous high flows were obtained from the USGS for each year
of record at the gage near Lemhi. These flows were ranked and
plotted on log probability paper. Upon fitting a curve to the
data, the 50-year design flood for the River at the USGS gage was
estimated at 2,050 cfs.
3-26

TABLE 3.2
RETURN FLOWS AND WATER RIGHT UTILIZATION
SPRING SEASON
Water Right Utilization = 85%
Reach
Mouth to LM3
LM3 to USGS Gage
Gage to "split"*
Upstream of "split"
(channels)
River Mile Return Flow (cfs/mile)
0.0 to 8.9 8.0
8.9 to 25.0 7.0
25.0 to 45.9 4.0
45.9 to 52.3 4.0
SUMMER SEASON
Water Right Utilization = 100%
Reach
Mouth to LM3
L M 3 to USGS Gage
Gage to LOC21
LOC21 to LOC23
LOC23 to "split"
Upstream of "split"
(channels)
River Mile Return Flow (cfs/mile)
0.0 to 8.9 11.5
8.9 to 25.0 14.0
25.0 to 33.5 6.5
33.5 to 39.5 4.0
39.5 to 45.9 8.0
45.9 to 52.3 6.0
* Point at which River splits into two basic channels, East
Channel and West Channel, approximately seven miles north of
Leadore.
3-27

FLOW AUGMENTATION
Objective and Approach
To improve fish passage and habitat in the Lemhi River, stream
flow during dry or critical periods could be augmented through
surface water conservation, groundwater pumping, regulation, or
other alternatives. The objective of the flow augmentation
subtask is to determine the quantity of water that must be
provided, by single or combined alternatives, in order to improve
salmon and steelhead migration in the Lemhi River. The results of
the flow augmentation analysis were used in the preliminary
development of alternative solutions.
Analysis and Results
The stream flow augmentation quantity for a particular reach is
the difference between the required flow for fish passage under
present channel conditions and the historical 15-day low flow at
that location. Tables 3.3 and 3.4 present flow augmentation
quantities at critical locations for spring and summer,
respectively. Zero values indicate minimum flows for passage have
been met historically for river flows of that return period.
Several options, described in Chapters 4 and 5, include
channelization of the riverbed. Return periods were identified
for the minimum flow requirement in the design channel. Table 3.5
identifies quantities for spring and summer at the two most
critical locations, below L-5 and L-6.
GROUNDWATER INVESTIGATION
Objective and Approach
The purpose of investigating groundwater in the Lemhi Basin was to
gather information and perform a generalized analysis of soil and
3-28

TABLE 3.3
AUGMENTATION LOCATION
CRITICAL REACH RIVERDESCRIPTION MILE
Below L-5 7.14
Below L-6 7.40
Below L-7 8.30
Below L-20 16.70I2 USGS Gage 25.00
Below L-41 30.30
FLOW AUGMENTATION QUANTITIES
SPRING
MINIMUM FLOW (CFS) & LOCATION
RIVER MINIMUMDESCRIPTION MILE FLOW
LOC7 7.14 20.3 0 20.3 20.3 20.3
LOC4 7.33 14.5 0 14.5 14.5 14.5
LOC5 7.42 11.9 0 0 9.7 11.9
LOCll 16.65 35.0 0 0 0 4.85
LOC15 25.00 26.1 0 0 0 0
LOC20 30.80 25.0 0 0 0 0
STREAM FLOW AUGMENTATION (CFS)
RETURN PERIOD (YRS)2 10 20 50- P - -
Note: Augmentation quantities assume that flow added or conserved at a specified locationwill not be diverted downstream.

TABLE 3.4
FLOW AUGMENTATION QUANTITIESSUMMER
AUGMENTATION LOCATION
DESCRIPTION MILECRITICAL REACH RIVER
Below L-5 7.14
Below L-6 7.40
Below L-7 8.30
Below L-20 16.70
USGS Gage 25.00
Below L-41 30.30
DESCRIPTION
MINIMUM FLOW (CFS) & LOCATION
MILE FLOW
LOC7
RIVER
7.14
MINIMUM
20.3
LOC4 7.33 14.5
LOC5 7.42 11.9
LOCll 16.65 35.0
LOCl5 25.00 26.1
LOC20 30.80 25.0I&i
STREAM FLOW AUGMENTATION (CFS)RETURN PERIOD (YRS)
5 10 20 50- - - -
0 20.3 20.3 14.5
0 12.1 14.5 14.5
0 0 0 0
0 0 0 0
0 0 0 0
0 0 0 0

TABLE 3.5
FLOW AUGMENTATION QUANTITIES
FOR CHANNELIZATION
SPRING
RETURN PERIOD ((YRS)
LOCATION 2 10 20 50- - - -
Below L-5 (LOC7) 0 6.0 6.0 6.0
Below L-6 (LOC4) 0 6.0 6.0 6.0
(actual return period tor 6.0 cfs below l-5 is 4.5 years)
SUMMER
Below L-5 (LOC7) 0 6.0 6.0 6.0
Below L-6 (LOC4) 0 3.6 6.0 6.0
(actual return period for 6.0 cfs below L-5 is 3.3 years)
Note: A minimum flow of 6 cfs is assumed for the design channel
which is described in Chapter 4.
3-31

geologic parameters. This provided a basis for evaluating
alternatives that involve groundwater pumping. Soils analyses
also were useful in assessing all alternatives that include
irrigation, water transport, or storage.
In addition to feasibility testing, soils and geologic data were
used to estimate the interaction between Basin groundwater and the
Lemhi River. Based on field observations and measurements,
groundwater contributes significantly to Lemhi River stream flow.
Data Sources
The Soil Conservation Service provided a soils map and
interpretation records of soils in the Valley. The U.S.
Geological Survey provided geologic data and reports as well as
expert consultations. The geology of the lower Lemhi Basin has
been mapped by A.L. Anderson (1956-1961). E.T. Ruppel has recent-
ly done intensive work on the upper Valley. In addition, valuable
background information was gathered from personal conversations
with local ranchers and agency personnel in the Lemhi Valley.
Analysis
Reqional Geology
T h e Lemhi Val ley and adjacent mountain ranges lie within the
norhtern Rocky Mountain physiographic province. This northwest-
trending, broad, U-shaped, glacial-cut Valley is bounded by two
mountain ranges, the Beaverhead to the northeast and the Lemhi to
the southwest. Bedrock units in these mountain ranges are not
important aquifers and are not addressed in this section. The
Lemhi Valley floor is dominated by Late Tertiary and Ouaternary
alluvial, colluvial, and glacial deposits. These are sequences of
successive alternating sand, gravel, and clay layers. Flood plain
alluvium consists of various unconsolidated, poorly-sorted,
cobbles, gravels, sand, and silt.
3-32

Reqional Soils
The occurrence of soil types in the Lemhi Valley varies from the
upper to the lower reaches. For the purpose of this
investigation, concern is given to the soils which affect the
aquifer.
Soils on the River flood plain throuqhout the Valley consist of
the Fury-Levelton-Keele group. These are moderately- to poorly-
drained soils on bottom lands and alluvial fans. The soil profile
in the lower Valley consists mainly of the Pattee-Geertsen-Lacrol
association close to the flood plain. These are generally deep,
well-drained soils weathered from bedrock. The Pattee series is a
silt loam with gravelly sand and is the major irrigated soil in
the area. The flanks of the lower Valley contain soils of the
Dawtonia-Dacore-Cronks association and are very deep, well-drained
soils that formed in alluvium or colluvium from extrusive igneous
rocks. The upper Basin consists almost exclusively of the
Whitenob-Pahsimeroi group. These are very deep, excessively-
drained soils formed in alluvium from mixed geologic materials on
fan terraces. Percolation of irriqated water into these gravelly
sandy loam soils is rapid.
Groundwater Occurrence
Groundwater occurs in virtually all of the geological formations
in the Lemhi Basin, but varies in amount. The Quaternary Tertiary
sediments are by far the most important aquifer in the Lemhi and
adjacent basins. High yields occur in the upper Valley where
these sediments are thick and laterally extensive. The Valley
narrows near the confluence of Hayden Creek, and sediment depth
becomes less, resultinq in potentially lower yields from wells and
1 ower return flows. Complex relationships between bentonitic clay
layers and these sediments make the extent of confining beds
undefinable without geophysical examination and aquifer tests.
3-33

Groundwater Movement and Return Flow
The U.S. Geological Survey has mapped the potentiometric surface
in the Lemhi Basin, which illustrates a generalized direction of
groundwater movement. Figure 3.4 was created from the USGS map.
Groundwater tends to move from areas of high to low altitude.
The movement of groundwater in relation to the Lemhi River is
important when discussing return flow and location of wells. The
upper Valley is a broad basin with a thick sequence of sediments.
The direction of water movement is directly towards the River.
Valley width decreases in the lower Valley as does sediment depth.
The geology and soils also become more complex, which influences
groundwater movement. The direction of movement is nearly
parallel to the Lemhi River in the downstream direction. There
are sites where pumping is not possible unless irrigators up the
Valley start operations early, supplying the aquifer with
percolated irrigation water. These delicate balances in the lower
Valley dictate that careful consideration should be given to well
placement.
The return flow rates computed in the previous section were
validated by evaluating data from the Lemhi Basin, utilizing data
from similar basins, and communicating with irrigators and agency
personnel.
The Pahsimeroi Rasin to the southwest is similar in climate,
topography , and geoloqy. Water Information Bulletin No. 31
released by the Idaho Department of Water Administration recorded
groundwater levels in selected wells in the Pahsimeroi River Basin
throughout the annual cycle of 1974. When these graphs were
compared with a graph of mean monthly precipitation, a rough
estimate of the rate of groundwater movement could be derived.
The maximum precipitation in the Pahsimeroi Basin occurs in June.
3-34

/f
/,*cI:\\
- 5000 --.* POTENTIOMETRIC C O N T O U R ,S U M M E R . F A L L , 1 9 7 8 . DASHEDW H E R E A P P R O X I M A T E L Y L O C A T EC O N T O U R I N T E R V A L I S VARIABLN A T I O N A L G E O D E T I C V E R T I C A LDATUM OF 1929.
- G E N E R A L I Z E D D I R E C T I O N O F
\G R O U N D W A T E R M O V E M E N T .D A S H E D WHFRF APPRC3XlUATFl Y
+--T16N
L O C A T E D .
APPROX:IMATE B O U N D A R Y O FV A L L E Y LOWLANDS.
SCALE
FIGURE 3.4LEMHI RIVER
HABITAT IMPROVEMENT STUDY
POTENTIOMETRICCONTOUR MAP
DATE: NOVEMBER 1985JOB NUMBER: SlO28.03

The water in wells in the upper Valley reach a maximum level in
July. Maximum levels in the middle and lower Valley occur in
August. This would indicate an approximate two-month return flow
rate. Because of the resemblance between the Lemhi and Pahsimeroi
Basins, a similar correlation can be made between runoff and
groundwater recharge. This one and one-half to two-month return
rate has been confirmed through conversations with irrigators and
agency personnel.
Well Location
The exact location of wells required for groundwater alternatives
cannot be determined without an intensive examination of
geophysical characteristics and detailed aquifer tests. The type
of geophysical examination and location of aquifer tests would
have to be resolved through further study and field investigation.
However, it is obvious that the most important aquifer in the
Valley is in the Quaternary Tertiary sediments. These sediments
contain alternating layers of sand, qravel, and clay along with
silty shales which are locally bentonitic (Anderson, 1961).
Yields from wells in this aquifer depend on compaction, character
of interbeds, and sorting. Geophysical examination could define
the extent of confining beds for possible well sites by
determining yield and probable interference. The number of wells
required by an alternative depends on well yield to meet design
frequency reauirements and on drawdown. Size and type of pumps
depends on the well yield and pumpinq head at a specific site.
G r o u n d w a t e r A v a i l a b i l i t y a n d Y i e l d
In evaluating the availability of groundwater at critical sites,
Darcy's Law can be applied using generalized conditions. Since
data are insufficient for a detailed aquifer analysis, assumptions
are made to simplify the model:
3-36

Q = KIA
where: Q = auantity of water per unit time
K = hydraulic conductivity, which depends on the
size and arrangement of water-transmitting pores
I = hydraulic qradient
A = cross-sectional area measured perpendicular to
the direction of flow
By examininq drilling logs, test data from the IWRD, and field
observations, a value for (K) was selected for a medium-qrained
sand and estimated to be 1,000 gal/day/ft*. The value esti-
mated for (I) is .007 ft/ft and was determined from published
potentiometric surface contours (USGS, 1979). Cross-sectional
areas (A) were calculated by multiplying the Lemhi Valley width at
a given site by the aquifer thickness. This is, at best, an
approximate model, and the parameters are estimated.
Based on these generalized conditions, the following capacities
can be expected from the aquifer in the vicinity of critical Lemhi
River reaches (identified by proximity to diversions):
L6 - 0.87 cfs
L7 - 0.89 cfs
L20 - 0.97 cfs
GAGE - 0.32 cfs
L41 - 0.58 cfs
These values also assume noninterference between adjacent wells.
There is a wide range of capacities in wells currently operating
in the Valley. Reported well yields from the U.S. Geological
Survey are from 1 to 300 gal/min with specific capacities ranging
from l-30 (gal/min). Because of these low yields, it would take a
multitude of wells and a network of pipelines to deliver the
necessary supplemental flow to the critical sites.
3-37

Results- -
The analysis of Lemhi Basin geology and soils provided data for
adjusting qroundwater inflow values, identifying likely well
locations and areas of high return, and estimating well yields.
These results are used in the analysis of alternative solutions.
COST COMPUTATION PARAMETERS
INTRODUCTION
The purpose of developing cost computation parameters was to
establish a uniform set of unit costs used in preparing estimates
for all enhancement alternatives. This would ensure that
alternatives could be compared on a uniform basis.
Unit costs represent the price for specific quantities of
material, completely finished. Examples are costs for a cubic
yard of structural concrete or a cubic yard of rock excavation.
These are intended to be realistic and representative of actual
field costs. A realistic analysis of alternatives will be
dependent primarily on the proper estimation of auantities and
application of unit costs. Tables of unit costs for Sprinq 1985
dollars are presented in Appendix E.
The unit costs presented in Appendix F are divided into various
labor and material categories. Values for labor-intensive
operations or products have been determined using cost estimating
guides and experience. Costs for readily available items were
determined from estimates of local suppliers. For items of
variable size, such as pumps, several different sizes were priced;
intermediate sizes were estimated using a scale or equation.
Accuracies of unit costs vary. Values for off-the-shelf items are
within 20 to 30 percent of actual cost in nearly all cases.
3-38

Labor-intensive operations or products may vary greatly in price
and are expected to be within 40 percent.
FISH HABITAT ASSESSMENT
ASSESSMENT OBJECTIVES
The capacity of the Lemhi River Basin to produce spring chinook
salmon and summer steelhead could be increased by improving fish
passage and rearing conditions in the Lemhi River. The
enhancement of stream flows would result in improved upstream
passage conditions for adult fish migrating to spawning areas of
the upper Lemhi, and better downstream passage conditions for
outmigrant salmon and steelhead. Increased stream flows in the
lower Lemhi during the low-flow period could also increase rearing
habitat for juvenile fish.
In order to assess the potential benefits of enhanced stream
flows associated with alternative management options (measured by
adult returns and smolt production), Buell S Associates, Inc. was
retained to develop the data necessary to address the following
two assessment objectives:
0 To quantify the relationship between salmon and
steelhead rearing habitat and stream flow for the Lemhi
River.
0 To estimate the juvenile chinook salmon and steelhead
production that would result in the Lemhi River Basin if
problems with low flow were rectified.
To accomplish these objectives, Buell S Associates implemented a
step-wise benefit assessment procedure that included the following
elements:
3-39

0 A detailed stream survey
0 Determination of flow/hab itat re lationships
0 Estimation of habitat availabiltiy at low flow
0 Estimation of habitat availability with enhanced flow
0 Determination of rearing densities at full seeding
0 Estimation of rearing potential under present and
enhanced-flow regimes
0 Estimation of benefits of improved upstream passage
conditions
0 Estimation of increased run sizes to result from
improved downstream passage conditions
0 Estimation of increased run sizes to result from
alternative management options
ASSESSMENT METHODOLOGY
All streams in the Lemhi River Basin likely to realize significant
increases in anadromous fish production as a result of Project
implementation were surveyed at known stream flows between June 23
and August 1, 1985. St reams in the Basin were divided into a
total of eiaht major reaches, based upon hydrology, channel
characteristics, potential for fish production, and fish passage
problems (Figure 3.1). Major reach boundaries were established in
consultation with fish biologists from the Idaho Department of
Fish and Game (IDFG) and Dr. Ted Bjornn of the University of
Idaho.
3-40
l l

Fish habitat parameters in the major reaches encompassing the
Lemhi River, Hayden Creek, and Biq Springs Creek were inventoried
in an extensive stream survey. The entire length of each major
reach of these streams was walked to inventory available fish
rearina habitat, factors limiting juvenile fish production,
obstructions to fish passage, and specific opportunities for
improved fish passaqe and rearinq conditions in the Lemhi Basin.
General stream characteristics examined in each major reach
included:
Channel geometry
Shading and bank condition
Point and non-point sediment sources
Barriers to juveniles and adults
Instream cover
Overwinterinq and high flow refuge areas
Each major reach surveyed was broken into subreaches bounded by
consecutive pairs of irriqation diversions. This subdivision
broke the reaches into distinctive stream segments with generally
similar channel characteristics but frequently dissimilar flows.
Both the availability of salmonid rearing habitat and prevailing
passage conditions in each of these subreaches are substantially
affected by the withdrawal of water at their upstream ends
(diversions).
Rearing habitat puts a qreater restriction on salmon and steelhead
production in the Lemhi Basin than does spawning habitat (Bjornn,
pers. comm.). Increasing stream flow in the Lemhi River will
improve both spawninq and rearing conditions for these fish, but
3-41
0
0
0
0
0
0

the rearing habitat will continue to limit fish production. For
this reason, attention focused upon available rearing habitat in
the Lemhi River and its relationship to stream flow. Spawning
habitat for salmon and steelhead was studied qualitatively,
ascertaining where in the Lemhi Basin these fish are most (and
least) likely to spawn if their numbers increase as a result of
Project implementation.
At the recommendation of Dr. Bjornn, available rearina habitat in
each subreach was auantified using a modification of the method
described by Irving et. al. (1983) at known stream flows. Stream- -length was determined for each subreach by pacing. Proceeding
upstream from the lower end of a subreach, visual transects were
established perpendicular to stream flow at every tenth pace.
Fish habitat intersected by each transect was classified into six
habitat types compatible with available fish production data on
Idaho streams: (1) pool, (2) riffle, (3) run, (4) pocketwater,
(5) backwater, and (6) side channel. Main habitat areas were
classified as deep, slow-water areas (pools), flat shallow areas
(riffles), areas of intermediate depth and high velocites (runs),
and riffle areas interspersed with small pools (pocketwaters).
Associated habitat types were those areas situated off the main
channel and out of the current (backwater), and stream channels
containing less than 25 percent of the stream flow (side
channels). The wetted width of each habitat type intersected by
each transect was estimated to the nearest foot, often by pacing,
and recorded. The pace of each stream surveyor was periodically
calibrated.
Fish habitat in the upstream ends of irrigation ditches, between
diversion points and fish screens, also was quantified. Habitat
in ditches below fish screens was not examined during the
inventory because:
0 Fish access is limited
3-42

0 Juveniles which rear in ditches face a considerable risk
of mortality due to stranding
0 Fish production in ditches is currently minimal and is
unlikely to be increased
Following field data collection, the surface areas of the six
habitat types in each subreach of stream were calculated.
Stream flows recorded for each subreach are estimates developed
from the flow model described in the Hydrology section of this
chapter. For many subreaches the flows recorded were measured
within two days of the inventory date. Flows for subreaches not
measured by OTT were extrapolated from stream flows for the
nearest upstream and downstream subreaches, which were determined
usinq the stream flow model of the Lemhi River.
The relationship between stream flow and available fish habitat
was examined in the five major river reaches likely to be affected
by flow augmentation (Reaches l-5). Thirty-two sampling stations,
each 100 yards in length, were established along the Lemhi River
between the mouth and Leadore (Table 3.6). Stations within each
major Study reach are representative of stream conditions
prevailing within the reach and contain varied aggregations of
habitat types. Stream flow and the surface area of each of the
six habitat types identified during the detailed stream survey
were measured at the 32 stations under both moderate and low-flow
conditions. These habitat and stream flow measurements were used
to define how stream flow affects the quantity and composition of
available fish habitat in the five major Study reaches of the
l e m h i .
For each sampling station, surface area measurements for the
habitat present at two levels of stream flow were converted to
percentages of the bank-full surface area (%BF). The stream flow
3-43

TABLE 3.6
FISH HABITAT STATIONS
STATION
H-lH-5H-15L-5L-6H-20L-7H-25H-30L-20H-35H-40H-54H-55L-31AH-57H-60L-41L-43H-65L-44H-70L-45FH-75H-77H-80H-82H-85H-88L-61H-90L-63
STUDY RIVERREACH MILE NEAREST WATER DIVERSION
1 0.9 below diversion L-l1 3.9 below diversion L-3B1 5.4 below diversion L-3A1 7.2 immed. below diversion L-51 7.4 immed. below diversion L-61 8.2 below diversion L-71 8.3 immed. below diversion L-72 12.2 above diversion 1-122 14.4 above diversion 1-162 16.7 immed. below diversion L-202 16.8 above diversion L-202 19.7 above diversion l-263 24.7 above diversion L-31B3 25.7 below diversion L-31A3 25.8 immed. below diversion L-31A3 28.3 above diversion L-38A3 30.2 above diversion L-403 30.3 immed. below diversion L-414 31.9 immed. below diversion L-434 32.6 above diversion L-43C4 33.7 immed. below diversion L-444 36.6 above diversion L-45B4 36.9 immed. below diversion L-45D4 39.2 below diversion L-474 41.2 below diversion L-504 43.8 below diversion L-534 45.0 below diversion l-58A5 47.6 above diversion L-595 48.5 above diversion L-605 49.3 immed. below diversion L-615 52.1 below diversion L-625 52.3 immed. below diversion L-63
Stations with "L" prefixes were situated immediately below waterdiversions of ten causing fish passage problems, and "H" prefixstations were located elsewhere in the Lemhi River between themouth and Leadore, Idaho.
3-44

and habitat data for all the stations were then pooled by major
Study reach (l-5) for regression analysis. Both linear and
curvilinear regressions of %BF versus stream flow were performed
on the data for each specific habitat type within a major reach.
The regression equation accounting for the greatest amount of the
observed variation in %BF for each specific habitat type was used
to describe the relationship between stream flow and %BF for that
habitat type within the reach.
Regress ion equations were developed to collectively describe the
relationship between stream flow and the six identified habitat
types in the five Study reaches of the Lemhi River. These
equations then were used to create a habitat/stream flow model.
The model predicts the surface area (square yards) of each habitat
type in any diversion-bounded subreach of the Lemhi River below
Leadore, Idaho for any given stream flow. The primary basis for
these predictions is the following algorithm:
s2
Where:
Sl
s2
%BF1
= (Sl)(%BF2)/(%BFl)
= Surface area of the specific habitat type in a subreach
during the stream survey conducted by Buell &
Associates, Inc.
= Predicted surface area of the specific habitat type in
that subreach, given the stream flow of interest (flow
predicted by the stream flow model given a specific set
of assumptions regarding flow recurrence frequencies,
t low augmentation,, and season or month of interest).
= %BF for the specific habitat type predicted by the
regression eauation for the appropriate Study reach,
given stream flow in subreach at time of stream survey
(flow predicted by the stream flow model).
3-45

%BF2 = %BF for the specific habitat type predicted by the
regression equation for the appropriate Study reach,
given the stream flow predicted for the subreach under a
particular project option.
If only the algorithm above is considered, the surface area of
habitat predicted for a subreach could exceed the bank-full
surface area of the subreach. Therefore, the habitat/stream flow
model is desiqned to limit %BF to 100 percent. This was done by
reducing the projected surface areas of specific habitat types as
necessary. Surface areas of specific habitat types which tend to
disappear first as stream flow rises were reduced to zero first.
The surface areas of habitat types which tend to persist or to
increase in areas under the same conditions were reduced last.
The sequence of surface area reductions built into the model, from
first to last is: pool, side channel, backwater, "pocket" water,
riffle, and run. The results are shown by subreach in Appendix F.
This habitat/stream flow model was used to estimate the amount and
quality of rearing habitat for juvenile salmon and steelhead in
the Lemhi River under current and enhanced stream flow conditions.
It was assumed that an average annual 15-day summer low flow
represented conditions limiting the number of smolts produced at
full seeding. Available rearing area was estimated for the
following two stream flow conditions:
1. Prevailing average annual 15-day summer low flow (for
each of 81 subreaches of the Lemhi River, as predicted
by the stream flow model).
2. Enhanced average annual 15-day summer low flows (for
each of 81 subreaches of the Lemhi River, as predicted
by the stream flow model) resulting from ranchers below
diversion L-7 switching from flood to sprinkler
irrigation (Options B and D).
3-46

STREAM SURVEY RESULTS
Predicted surface areas of available rearing habitat (average
annual 15-day summer low flow) for each major reach of the Lemhi
River are qiven in Table 3.7. These predictions are for both
prevailing (Options A and C) and enhanced (Options B and D) stream
flows. These options are explained in Chapter 5. The enhanced
stream flows were determined in an effort to improve upstream
passage conditions for returninq adult fish. However, Table 3.7
shows the enhanced stream flows have no effect on the availability
of rearing habitat in Reaches 2-5; none of the four options
proposed will increase stream flows in these reaches.
Table 3.8 presents the surface areas of available rearing habitat
in the major reaches of Hayden Creek and Big Springs Creek.
3-47

TABLE 3.7
REARING HABITAT FOR ANADROMOUS SALMONIDS (SQ YD)
UNDER PREVAILING AND ENHANCED STREAM FLOW CONDITIONS
REACH POOL RIFFLE RUN POCKETWATER SIDECHANNEL BACKWATER TOTAL
2
I Preva ling
zEnhanced
3PrevailingEnhanced
1Prevailing 15,774 145,440 56,986 1,285 4,029 2,025 225,539Enhanced (15,774) (174,379) (59,770) (1,212) (3,878) (2,725) (257,738)
29,535 213,569 73,469 1,340 2,215 831 321,050(29,535) (213,569) (73,560) (1,340) (2,215) (831) (321,050 )
3,215 109,466 17,187 157 180 574 130,779(3,215) (109,466) (17,187) (157) (180) (574) (130,779 )
4Prevailing 30,000 240,469 125,612 500 4,442 950 401,981Enhanced (30,000) (240,469) (125,612) (500) (4,442) (950) (401,981 )
5PrevailingEnhanced
31,508 59,834 47,445(31,508) (59,834) (47,445)
222(222)
4,297(4,297)
2,880 146,195(2,880) (146,195 )
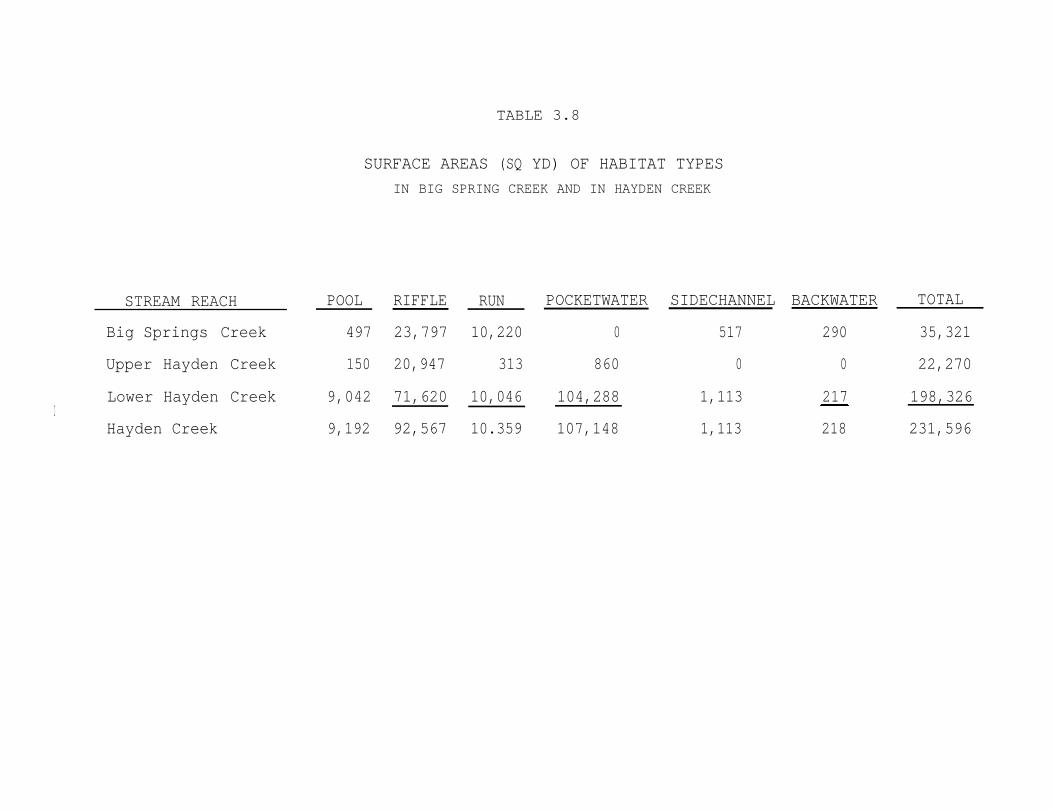
TABLE 3.8
SURFACE AREAS (SQ YD) OF HABITAT TYPES
IN BIG SPRING CREEK AND IN HAYDEN CREEK
STREAM REACH POOL RIFFLE RUN POCKETWATER SIDECHANNEL BACKWATER TOTAL
Big Springs Creek 497 23,797 10,220 0 517 290 35,321
Upper Hayden Creek 150 20,947 313 860 0 0 22,270
Lower Hayden Creek 9,042 71,620 10,046 104,288 1,113 217 198,326I Hayden Creek 9,192 92,567 10.359 107,148 1,113 218 231,596

CHAPTER 4
DESCRIPTION OF ALTERNATIVES
This chapter describes the nine enhancement alternatives, presents
potential problems, and estimates capital and annual costs. This
chapter also presents characteristics of the alternative that
would create a fisheries benefit. These characteristics are used
to calculate benefits in Chapter 5.
ALTERNATIVE 1 - FLOW CONCENTRATION
The purpose of the flow concentration alternative is to provide a
series of diversion dams and channel improvements that will
concentrate the flow of the Lemhi River into the thalweg, thereby
improving upstream and downstream passage.
ALTPRXATIVE DESCRIPTION
Present Practice
To ensure adequate flow is diverted into irriqation ditches,
present practice in the Lemhi Valley consists of creating rock
bermss in the River from riverbed materials. In many locations,
these berms extend across the River spreading the undiverted flow
over the ent ire channel width. Excess diverted water is allowed
to return to the Riverrthrouqh "wasteways," usually located a
short distance downstream of the diversions. Wasteways do not
have sufficiently defined channels to provide for fish passage.
All these factors make fish passage difficult at some of the
irrigation diversions.
4-l

Flow Concentration
The flow concentration alternative involves constructing permanent
concrete diversion structures and fishways, replacing irrigation
headgates, providing flood control levees, and channelizing River
flows at several critical locations where fish passage diffi-
culties have been observed. Table 4.1 defines the critical
passage locations addressed in this alternative. Maps in
Appendix B show locations of the structures and channelization of
the streambed.
Diversions
The diversion structure would be a permanent concrete weir placed
across the River. Figures 4.1 and 4.2 give details of a typical
diversion structure. The typical concrete weir is 4 feet high and
l-1/2 feet thick: weirs of slightly different height might be
required at some locations. Water would spill over the weir onto
a downstream apron which is 10 feet wide. Cutoff walls and riprap
armoring would be placed at the downstream edge of the apron, to
prevent undermining of the structure. A 4-foot wide sluiceway
with stoplogs placed adjacent to the fishway would be provided at
each site. The large amounts of gravel transported in the Lemhi
might require a gate instead of stoplogs t o flush gravel
downstream. This should be considered during design. Weir
dimensions for each critical location are given in Table 4.1.
Fishways
A concrete fishway would be placed at each of the proposed
diversion structures. Fishways would provide passage for upstream
adult migrants and assist downstream passage for migrating
juvenile salmon and steelhead. The fishway would be a weir and
pool design with 6-foot wide by 8-foot long pools. Pool depth
would be 3-1/2 feet, and would provide a minimum fishway flow of
4-2

TABLE 4.1
SITE DATA FOR FLOW CONCENTRATION
REF. SITE LEMHI DIVERSION LEVEENO1
CAPITAL ANNUAL COSTSNAME RIVER WIMl-d HEIGHT3 L&!!% WA FIRST& O&M CHANNEL
MILE (FT) (FT) (FT) (FT) $) ($) ($)
1 SPSl 1.30
2 L-3 3.30
3 SPS2 3.90
4 sPS3 5.40
5 L-5 7.20
6 L-6 7.40
7 L-7 8.30
8 L-20 16.70
9 L-22 17.40
10 L-31A 25.80
11 L-40 30.00
12 L-41 30.30
13 L-43 31.90
14 L-44 33.70
15 L-45D 36.90
16 SPS4 48.60
17 L-61 49.30
NA 0.0 0
NA 0.0 0
NA 0.0 0
NA 0.0 0
65 5.6 1485
65 5.6 1485
65 5.6 1485
80 5.6 1491
100 3.0 789
65 5.8 1547
75 5.4 1431
75 4.1 1094
60 2.6 694
55 2.8 752
90 2.7 733
NA 0.0 0
30 3.2 860
300
200
200
200
200
200
200
200
200
200
200
200
200
200
200
150
200
N.A. N.A. 390
N.A. N.A. 260
N.A. N.A. 260
N.A. N.A. 260
462,000 3200 260
462,000 3200 260
462,000 3200 260
470,000 3200 260
245,000 3200 260
487,000 3200 260
441,000 3200 260
318,000 3200 260
203,000 3200 260
214,000 3200 260
227,000 3200 260
N.A. N.A. 200
228,000 3200 260
1 Refer to location maps, Appendix B.
2 Diversion widths are based on bank full widths at nearhylocations.
3 Based on a SO-year flood flow extrapolated from the gatenear Lemhi.
4 Assumes an average channel slope of 0.0075 and a levee slopeof 0.00375.
5 At SPS (Supplemental Passage Stations) this channel lengthequals the riffle length (Buell in letter to OTT dated8-16-85) plus 100 feet, rounded to the nearest 50 feet. Allother stations are 200 feet.
6 Based on Figures 4.1 and 4.2 and example detailed costsummary on Table 4.2.
4-3

/ LEVEE ACCESS
LEVEE ACCESS 7 I
ACF
IRRIGATION -HEADWORKS
i ’
CHANNELIZATION
I II II 1II ’
1 I’ I
WEIR AND POOL
I FI SHWAYI
PLANS C A L E l’-10’
SLUICEWAYWITH STOPLOGSOR GATE
LEVEE
ORIGINAL -GROUND SURFACE
TYPICAL SECTIONSCALE I”. IO’
w
/
LEVEE ACCESS
WALK WAY
TYPICAL SECTIONSCALE I”= IO’
FIGURE 4.1
LEMHI RIVER
HABITAT IMPROVEMENT STUDY
TYPICAL PLAN VIEW
DATE: NOVEMBER 1985
JOB NUMBER: SlO28.03

,APPROX BANK- FULLDEPTH
EXISTING -STREAM BED
WEIR AND POOLFI SHWAY
TYPICAL SECTION f7\\ TYPICAL SECTION
T O P O FLEVEE
ORIGINAL GROUND- SURFACE
‘FISHWAY EXITTRASHRACK
-‘-ee’i _--- --- y BANK FULL W. S. ELEV.
EXISTINGSTREAM BED
SCALE I”= IO’ l4&
EXISTING RIVER BED
CHANNELIZED ARIVERBED
TYPICAL CHANNELIZATION SECTlONSCALE I”= IO’
* SITE SPECIFIC VALUES FOR HEIGHT
OF LEVEE ARE SHOWN IN TABLE 4.1
SCALE I”= IO’
TYPICAL SECTIONSCALE I”= 5 ’
FIGhE 4.2
LEMHI R I V E RHABITAT IMPROVEMENT STUDY
TYPICAL SECTIONS
DATE : NOVEMBER 1985
JOB NUMBER: SlO28.03

10 cfs. At higher fishway flows, stoplog weirs can be adjusted to
maintain the required energy dissipation in each pool. Details of
the fishway are presented in Figures 4.1 and 4.2. Water rights
for the fishways should be obtained.
Levees
Due to backwater effects the permanent diversion structures would
produce higher upstream water surfaces during flood flows. To
protect adjacent lands from increased flooding, levees would
extend upstream from each of the diversion structures. The
typical levee height was determined using a SO-year flow
extrapolated from the USGS gage near Lemhi, Idaho and a freeboard
of 2 feet. Typical levee placement and cross section are
presented on Figures 4.1 and 4.2; specific dimensions for each
levee are shown in Table 4.1. Riprap placed on the river side of
the levee would provide protection from scour. Each levee would
have a top width of 10 feet for vehicular access.
Headgates
Irrigation headgates would be constructed at each new diversion
site. These headgates would provide a more efficient and
permanent method for irrigators to adjust irrigation withdrawals,
without placing or removing stoplogs in the fishway or dam.
Typical structures would consist of a I-foot by I-foot vertical
slide gate, trashrack, and concrete wing walls, which extend into
both banks. Trashracks would be located at the upstream end of
the wing walls and placed at a 30-degree angle to vertical.
Channelization
In addition to the diversion structures, the stream channel would
be excavated downstream of each diversion structure, and at
several other reaches, to concentrate flows where passage problems
4-6

have been identified. Channels would be constructed during
critical low-flow periods. Figure 4.2 illustrates a typical
channel. A special blade on a dozer would be used to excavate the
channel. At critical reaches, other than those located at
diversion structures, it is assumed the channel length would be
100 feet longer than the identified riffle length. Total channel
lengths are given in Table 4.1.
ANALYSIS
Design Considerations
Conceptual design of the diversion structures, fishways, and
channelization is based on the following:
0 Upstream and downstream fish passage
0 Irrigation requirements
0 Operation, maintenance, and dependability
The design of flow concentration facilities is based on fish
passage requirements. Fishways would allow migration all year,
while channelization would provide both upstream and downstream
passage through impassable riffles during low-flow periods.
Passage problems for downstream migrants are not anticipated at
diversion structures during average flow periods.
Operation
Operation and maintenance costs are estimated for routine
maintenance and for adjustments to the fishway. The diversion
would require maintenance only for sluicing sediments and for
inspection. The IDFG would be responsible for maintenance and for
performing routine adjustments to fishways. Local irrigators
would maintain operational control of irrigation headgates.
4-7

Data and Assumptions
Data
Information used for the conceptual design and analysis of this
alternative includes hydrologic, cost, and field data. Much of
the hydrologic and cost data used for assessing this alternative
are presented in Chapter 3. Some additional costs were estimated,
and 15-day low flows were developed for average years and
recurrence intervals of 2, 10, 20, and 50 years. These data were
used to evaluate the benefits of flow concentration. Field data
used in the analysis include river width measurements and
observations of low-flow problem areas.
Siting
A total of 17 sites have been identified for flow concentration
and are presented in Table 4.1. Diversions L-6, L-7, L-20, L-31A,
L-41, and L-61 are all critical diversions identified by IDFG.
Diversions L-3 and L-45D were identified by OTT staff as critical
passage sites which require only channelization. The remaininq
sites are "supplemental passage stations" (SPS) and diversions
identified as critical by Buell & Associates, Inc. during their
field work.
Costs
Cost estimates were prepared using unit costs presented in
Appendix E and quantities were taken from the conceptual drawings.
cost estimates have been prepared separately for each site.
Table 4.2 is a summary of capital and annual costs for a typical
diversion structure (diversion L-5). Capital costs are those
incurred at the beginning of the Project, including construction,
engineering services, and equipment. Annual costs include
operation and maintenance (O&M) and channelization.
4-8
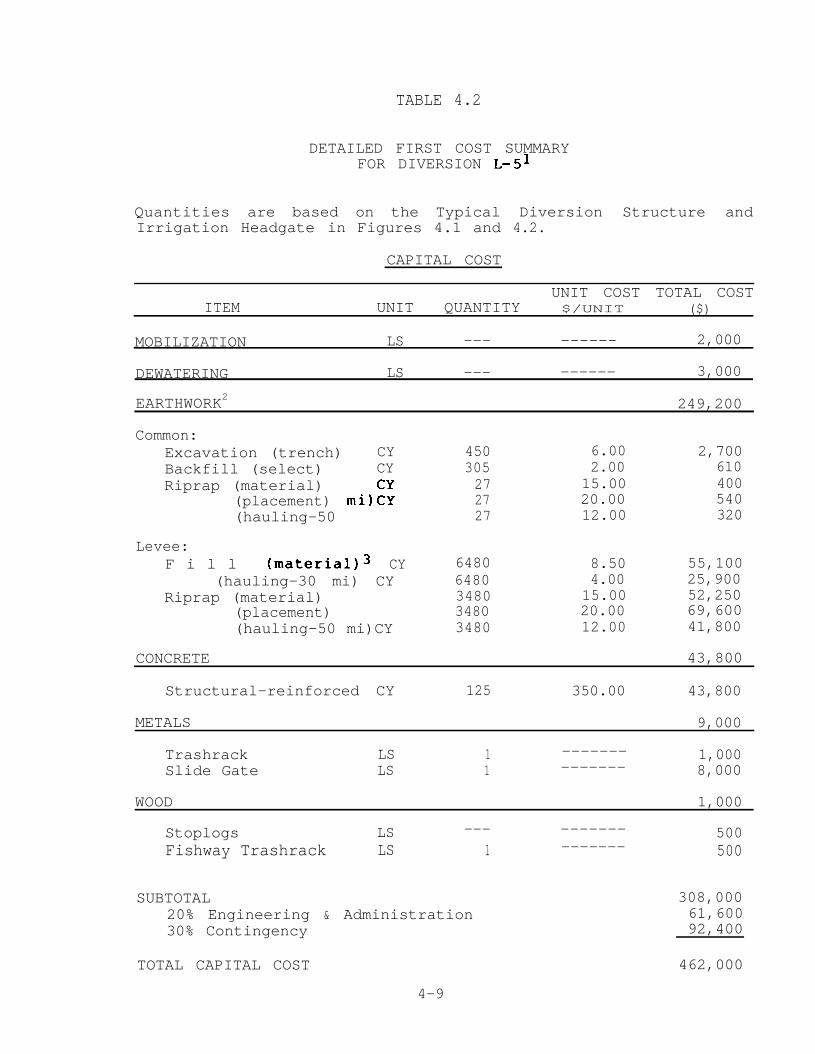
TABLE 4.2
DETAILED FIRST COST SUMMARYFOR DIVERSION L-S1
Quantities are based on the Typical Diversion Structure andIrrigation Headgate in Figures 4.1 and 4.2.
CAPITAL COST
UNIT COST TOTAL COSTITEM UNIT QUANTITY $/UNIT ($)
MOBILIZATION LS --- ------ 2,000
DEWATERING LS --- ------ 3,000
EARTHWORK2 249,200
Common:Excavation (trench) CY 450 6.00 2,700Backfill (select) CY 305 2.00 610Riprap (material) CY 27 15.00 400
(placement) rni):: 27 20.00 540(hauling-50 27 12.00 320
Levee:F i l l (material)3 CY
(hauling-30 mi) CYRiprap (material)
(placement)(hauling-50 mi)CY
6480 8.50 55,1006480 4.00 25,9003480 15.00 52,2503480 20.00 69,6003480 12.00 41,800
CONCRETE 43,800
Structural-reinforced CY 125 350.00 43,800
METALS 9,000
Trashrack LS 1 ------- 1,000Slide Gate LS 1 ------- 8,000
WOOD 1,000
Stoplogs LS --- ------- 500Fishway Trashrack LS 1 ------- 500
SUBTOTAL 308,00020% Engineering & Administration 61,60030% Contingency 92,400
TOTAL CAPITAL COST 462,000
4-9

Table 4.2(continued)
ANNUAL COST
Operation and MaintenanceChannelization (200 ft)
$3,200.00260.00
1 Diversion L-5 is used for example in this detailed summary.Site-specific information for other sites is presented inTable 4.1.
2 Unit costs for excavation and backfill are adjusted toreflect costs for small quantities.
3 Unit price for levee fill is comprised of 50% engineered-select and 50% common. Hauling applies only to theengineered-select volumes.
4-10

Operation and maintenance costs per site include installation,
major adjustments, and routine maintenance. Upstream migration
lasts for approximately 22 weeks. During this period, labor for
routine facility maintenance and adjustments to the fishway
requires an estimated 14 man-days. An additional 5 man-days per
year will be reauired for facility inspection, repair, and
sluicing. Assuming an employee rate of $128 per man-day, the
total annual O&M cost for 19 man-days per site is approximately
$2,430. Adding a 30 percent contingency results in approximately
$3,160 per site.
Annual cost for channelization accounts for bulldozer rental and
operation. It is estimated that excavating 200 feet of channel
takes one hour per site, assuming several sites are excavated per
day. Because the diversion structure is in place during high flow
periods, channel excavation might be reauired twice every year.
Assuming the rental of a bulldozer with an operator costs $100 per
hour and a 30 percent contingency, the total annual channelization
cost is $260 per site.
RESULTS
Cost
The total capital cost for developing the 12 diversion structures
at the locations given in Table 4.1 is $4,219,000. The total
annual O&M cost is approximately $38,000 in the first year.
Annual cost for channelization at 17 locations is $4,490.
Implications for Fish
Benefits from this alternative are based on the increase in fish
production through more efficient upstream passage. For this
reason the conceptual designs of diversion structures and
channelization were developed. The most critical location for
4-11

passage over the new diversion is the approach through the
channel. It is assumed that when upstream migrants reach the
fishway entrance, they are able to negotiate the fishway and
proceed upstream. The effects of icing in the pool upstream of
the dam should be addressed in future detailed analyses.
Channelization of flow during critical low-flow periods is
required for passage upstream to the fishway. Utilizing depth
criteria for passage, the computed minimum flow for the excavated
channels is 6 cfs, for a depth of 1.5 feet in the typical channel
illustrated on Figure 4.2.
ALTERNATIVE 2 - FISH SCREEN IMPROVEMENT
Historically, low flows and high irrigation demands have greatly
reduced the downstream passage efficiency of chinook and steelhead
through the Lemhi system. Fish are diverted into irrigation
intake canals where they encounter fish screens and are either
channeled back to the River or experience significant delay
because of their inability to find bypass pipes. This task
suggests ways for reducing mortality when downstream migrating
juveniles encounter screening devices.
ALTERNATIVE DESCRIPTION
Existinq Screeninq Facilities
Most diversions on the Lemhi are equipped with fish screens to
prevent the entrapment of fish in canals. Typically, water is
diverted into a canal intake adjacent to the River by a small
diversion dam. Headgates, located just upstream from the screens,
are used to control the amount of water diverted through the
screens into the irrigation canals. Figure 4.3 illustrates a
typical diversion layout. To ensure that water will not be
stopped if the screens become blocked, a bypass gate is provided
at each facility. A trip mechanism opens the bypass when the
4-12

PLAN LANDING POOLSCALE I”= 5’
TYPICAL LAYOUT OFFISH SCREEN FACILITYNO SCALE
kLANDING POOL
FIGURE 4.3
CEMHI RIVERHABITAT IMPROVEMENT STUDY
FISH SCREEN BYPASS
DATE: NOVEMBER 1985
JOB NUMBER: S102B.0 3
below the water surface, connecting the area in front of the
screens with the River. Several difficulties are associated with
these bypasses. It appears the principal difficulty is the
inability of a small bypass pipe and low bypass flow to attract
larger steelhead smolts and pass them back to the River. During
field visits, OTT found that several of the pipes were discharging
onto the River bank or were plugged.
To accommodate more flow in the bypass, it first would be
necessary to obtain a new water right. This new water right could
only be exercised in times of excess flow, because most irrigating
rights on canals have priority. During the downstream migration
periods, there often is additional flow that would be available
for the bypass.
ANALYSIS
Efficiencies of Existing Screens
Bjornn performed an analysis of the effectiveness of fish screens
on the Lemhi (Bjornn and Ringe, 1984). The data did not permit an
in-depth analysis able to quantify efficiency of the individual
screens. Bjornn's study with steelhead smolts found approximately
10 percent of downstream migrants successfully reached the Salmon
River after being released in the Lemhi, a short distance above
the Hayden Creek confluence. No studies were found estimating the
screen efficiency of chinook outmigrants at individual diversions
or screening locations.
There are approximately 40 screening systems located downstream of
Hayden Creek. A fish passage efficiency is associated with each
screen. The total efficiency is the product of each screen
efficiency. Studies to compute individual efficiencies would be
extremely difficult and costly. The best approach would be to
perform controlled experiments on different types of bypasses.
4-15

hydrostatic gradient between the upstream face and downstream face
of the screen reaches a critical level. A fish bypass pipe, four
to six inches in diameter, is placed at each screening facility.
Downstream migrants approach the screens and move laterally along
the face of the screen until they detect the entrance to the pipe
and are carried through the pipe back to the River.
The two types of screening facilities used on the Lemhi are the
perforated plate screen and the drum screen. The perforated plate
screen consists of a vertical plate aligned at an angle to the
canal flow. The screen is cleaned by vertical scrapers or brushes
that travel across the screen face. A paddle wheel which is
turned by water flowing in the canal, operates the scrapers. This
type of screen configuration does not allow debris removal:
therefore, periodic maintenance is required to keep the screen in
operation.
Drum screen facilities consist of one or more wire mesh drums.
The drums rotate about a horizontal axis and are powered by an
electric motor. Where electricity is not available, drum screens
are installed with paddle wheels. Water enters through the
upstream face of the screen. Debris is caught and lifted out of
the water by the rotation of the screen. It is then washed off
the screen as it rotates to the downstream face. These screens
require less maintenance than the perforated plate type and are
more reliable. Since debris is actually cleared from the upstream
face of these screens, it is less likely that a hydrostatic
pressure differential will be created across the screen and cause
the bypass gate to open and allow fish to move into irrigation
ditches.
Existinq Fish Bypass System
The fish bypass arrangement at the screen facilities consists of
either a 4-inch or 6-inch PVC pipe, located approximately 2-3 feet
4-14

RESULTS
Five steps are recommended for improving fish screen efficiency on
the Lemhi.
1. Controlled Experiment. A controlled experiment is
necessary to determine the most effective bypass system
for the type of screens on the Lemhi. The experiment
would take place at the trap facility upstream of the
confluence of Hayden Creek. It would involve installing
a prototype rotating drum screen and a facility for
testing different types of fish bypass structures.
Chinook and steelhead smolts would be used in the
experiments to test the efficiency of various bypass
structures (Figure 4.3).
2. Prototype Installation. After the controlled experiment
is complete and the most effective bypass alternatives
are identified, a prototype bypass system would be
installed at a drum screen installation. This bypass
system would also include training walls to provide a
better transition to the bypass conduit.
3. Prototype Experiment. An experiment would be performed
on the prototype system, testing the screen efficiencies
for various bypass systems (identified in the controlled
experiments and installed in the prototype).
4. Bypass Water Right. More flow might be required in the
bypass to ensure it operates correctly. This would
entail applying for a water right. Since this would be
a junior right, it would be only available during
periods of excess flow.
4-17

The fish trap facility, located just upstream of Hayden Creek,
would be a suitable location for these experiments. Once the most
efficient type of bypass system is identified, a prototype bypass
could be installed at a screening facility.
Present Screening Program
The screening program financed by the National Marine Fisheries
Service (NMFS) consists of installing screens at unscreened
diversions, upgrading existing perforated plate screens with
rotating drum screens, and performing daily maintenance for these
screens. During field visits to the screening facilities, OTT
noted the perforated plate screens were difficult to keep clean,
since there is no provision for bypassing debris. The drum
screens are quite reliable and relatively maintenance free. The
program also calls for a more uniform screen design to improve
maintenance. The fish screen portion of the drum screen
facilities were adequate. The best improvement alternative would
be to accelerate the replacement of perforated plate screens with
drum screens.
Bypass Structure
OTT recommends an experimental bypass structure be constructed for
experiments of bypass efficiencies. It should be installed at a
drum screen facility with a relatively short distance between the
screen and the River. The bypass would consist of a rectangular-
shaped channel prefabricated from steel or aluminum, approximately
12 inches wide and 5 feet high. The channel would be buried with
its upstream end located in the pool, upstream of the drum screen,
while the downstream end would be located in a pool excavated into
the River bank (Figure 4.3). It would have the capability of
accepting inserts to create a pressure conduit at any location in
its S-foot depth, or an open-channel chute at the top of the
bypass. This conceptual configuration could be altered, based on
the results of controlled experiments.
4-16

Other Considerations
During field investigations, many instances of poorly maintained
and operating screen facilities were identified. The perforated
plate screens at L-8A and L-9 are examples. In addition, many of
the bypass pipes are excessively long or difficult to find.
Accelerating the NMFS program would improve conditions, but for
the present, screen maintenance should be emphasized in aiding
juvenile passage.
ALTERNATIVE 3 - GROUNDWATER AUGMENTATION
The purpose of direct groundwater augmentation to the Lemhi River
is to prevent situations where steelhead and chinook migrating
upstream or downstream are blocked or excessively delayed. The
objective is to augment stream flow to a level at which minimum
flow requirements would be achieved.
DESCRIPTION
Wells for directly augmenting stream flow would be located in the
vicinity of identified "critical" or "problem" River reaches. The
actual siting of a single well or group of wells would be based on
the suitability of the aquifer to provide additional flow without
affecting existing wells. Water would then be transported through
buried low pressure or gravity flow pipelines to the critical
site. The total flow requirement of these wells would be
determined by the difference between minimum instream flows for
fish passage and stream flow available during low-flow periods.
ANALYSIS
The analysis presented in this section is basic to the
alternatives which include the use of groundwater. An evaluation
of relevant geologic and groundwater parameters is presented in
4-19

5. Upgrade Screen Program. The present fish screen program
would need to be upgraded and accelerated to incorporate
the bypass system which proves to be most efficient in
the controlled and prototype experiments.
Costs
The estimated costs for the recommended programs are given in the
table below. The contribution to the screen upgrade program would
vary with the bypass structure effectiveness determined in the
experiments.
Proqram
Controlled Experiment ConstructionControlled ExperimentPrototype ConstructionPrototype ExperimentWater Rights ApplicationContribution to Screen Upgrade
Total Cost
Cost
$ 15,00015,00020,00025,0005,000
300.000$380,000
Implications for Fish
Because of insufficient data the benefits associated with fish
screen facility improvements could not be computed. Data on the
efficiencies of possible screening alternatives can only be
assessed by controlled tests in the Lemhi. For purposes of
evaluating screen improvements as a fisheries management alterna-
tive, it was assumed that a 75 percent basin-wide improvement in
diversion passage conditions could be achieved in the Lemhi River
Basin. Chapter 5 addresses the screen improvement alternative in
greater detail.
There is sufficient evidence that a significant downstream passage
problem does exist. More efficient screening facilities could
increase significantly the proportion of outmigrants reaching the
Salmon River.4-18

RESULTS
Total Alternative Yield
Using observed specific capacity and yield values, the total
availability of flow can be estimated. Assuming that sustained
yield is equal to specific capacity, 300 wells with a specific
capacity of 0.067 cfs, pumped for 24 hours a day, would be
necessary to meet a supplemental flow of 20 cfs, which is the
minimum flow below L-5. If we assume a sustained yield equal to
the maximum yield in the Valley, 300 gal/min or .67 cfs, then 30
wells would be required to draw a total of 20 cfs. The cost
estimates given below are based on this latter assumption of
requiring 30 wells to satisfy fish passage requirements.
Cost
Assuming the average well depth is 100 feet, with a 12-inch
diameter, and using the cost equations from Chapter 3, the cost of
this alternative would be:
30 wells x $1,300.00 (cost of volume pump) = $ 39,000.00
30 wells x $ 200.00 (cost of 2 hp motors) = $ 6,000.00
30 wells x $4,000.00 (cost of drilling) = $120,000.00
Total costs for drilling, pumps, and motors = $165,000.00
These cost estimates do not include: geophysical examination,
aquifer tests, test wells, pipelines, roads, excavation, power-
lines, land, and water rights. The capital cost could be expected
to double at a minimum.
It is possible that this alternative could be implemented in
conjunction with channelization. An additional flow of 6 cfs at
critical points would be required to supplement the channelization
alternative.
4-21
Chapter 3. Well location, groundwater availability and yield, and
specific site yields are also presented in Chapter 3.
Well Location
Without intensive examination of geophysical characteristics and
detailed aquifer tests, the exact location of wells required for
alternatives involving the use of groundwater cannot be
determined. The type and location of tests would have to be
resolved through further study, field investigation, and meetings
with agency personnel.
Groundwater Availablity and Yield
Groundwater Yield
In evaluating the availability of groundwater at critical sites,
OTT applied Darcy's Law using generalized conditions. Because a
detailed aquifer analysis has not been performed, assumptions were
made to simplify the models.
Based on theoretical conditions, the following availabilities can
be expected from the aquifer in the vicinity of critical River
reaches (identified by proximity to diversions):
L6 - 0.87 cfs
L7 - 0.89 cfs
L20 - 0.97 cfs
GAGE - 0.32 cfs
L41 - 0.58 cfs
There is a wide range in well capacities at currently-operating
wells in the Valley. Reported well yields from the U.S.
Geological Survey are from 1 to 300 gal/min (0.67 cfs) with
specific capacities ranging from 1 to 30 (gal/min) (.067 cfs).
4-20

In order to achieve the objectives of this alternative, water
right purchases or formal changes in the method of withdrawal
would need to be implemented. The options available are:
1.
2.
3.
Purchase and install wells and pumps for the Town Ditch
Company to replace a portion of the total surface water
diversion into these ditches with groundwater
withdrawal. Current flood irrigation practices would be
retained.
Approach individual land owners to negotiate replacing
all or a portion of their surface water right for
groundwater withdrawal rights.
Approach individual land owners and offer to purchase a
portion of their water right, and negotiate to replace
the remaining surface water right with qroundwater.
Benefits from this exchange could then be used by the
irrigator to purchase sprinkler systems or improve field
or ditch conditions.
ANALYSIS
A major portion of the analysis for this alternative is derived
from the groundwater investigation and augmentation analyses.
Basic concepts relating to regional geology and soils are not
presented again in detail.
Geologic and Soil Factors
Deep wells would be located in the Quarternary Tertiary sediments
where available. In areas without such an aquifer source,
groundwater withdrawals would consist of percolated water
originally applied by flood irrigation. Under present conditions,
most of this water reaches the River through infiltration. Well
4-23

Other Considerations
With this alternative, there is potential for conflict between
flood irrigation in the Lemhi Valley and pumping groundwater on a
large-scale basis. Installing numerous pumps in the lower Valley,
where the aquifer is shallow, could interfere with the current
practice of raising the water table by intense flooding of fields
in the spring.
ALTERNATIVE 4 - GROUNDWATER IRRIGATION
The groundwater irrigation alternative involves replacing surface
water diverted from the Lemhi with pumped groundwater. Fields
could be irrigated by well water either through flood or sprinkler
systems. The purpose of this analysis is to assess the economic
and legal feasibility of pumping water for irrigation purposes on
a larger scale than is currently practiced in the Valley.
ALTERNATIVE DESCRIPTION
This alternative involves replacing surface water with groundwater
for irrigation on the River downstream of RM 8.6. This is because
the contribution of flood irrigation to groundwater recharge in
the upper Valley during the latter part of the irrigation season
is essential.
Water can be withdrawn from deep wells in a confined aquifer or
from shallow wells containing water recently used for irrigation.
Wells should be located to avoid interference with irrigation. If
sprinklers were installed to replace flood irrigation practices,
site placement would be less important because of lower water
requirements due to higher application efficiency. Wells could be
installed on an individual user basis or on a larger scale for the
Town Ditch Company in the Lemhi Valley. Limitations on these
options are groundwater availability, water rights law, and other
legal restrictions.
4-22

Cost to BPA
The unit cost to BPA is $17,000/cfs, based on a land value of
$50O/acre (the difference between land with and without water
rights) and a water right allocation of 0.03 cfs/acre. As the
following sections state, 12.5 cfs and 20.9 cfs could be conserved
at a point below L-6 for flood and sprinkler irrigation systems,
respectively. Therefore, the costs are $212,500 and $355,000
respectively.
Cost to Irrigator
The costs and benefits for area ranchers who sell partial or
entire water rights depend on the type of irrigation system
installed: flood or sprinkler.
For improved flood irrigation, benefits and costs per acre are as
follows:
Water Use = 0.021 cfs/acre
Income from Water Rights Sale = $153/acre
Income from Yield Increase = $130/acre
Cost for Improvements = $250/acre
Cost for Pumps, Motors, and Drilling
= ($5,500/we11)(.021 cfs/acre)(well/.67 cfs)
= $172/acre
Annual Electricity Cost
= (.03 wells/acre)(6 kW)(24 hrs)(30 days)(6 months)
($.0438/kWh)
= $34/acre/year
Therefore,
First Year
Income = $283/acre
cost = $456/acre
Annual
$130/acre
$ 34/acre
4-25

drawdown and interference is a determining factor in locating well
installations. Well location is further confined by the
site-specific nature of this alternative.
Water Riqhts
Several factors affect the feasibility of this alternative and
those which follow. They involve water law and the ability of BPA
to directly fund capital improvements for individuals or a
quasi-public entity such as the Town Ditch Company. They are
summarized as follows:
0 RPA cannot expend funds to the benefit of an individual
water user where there is no "Federal interest" in that
land. Therefore, capital expenditures for improvements
like sprinkler systems must be made by the water user in
the exchange for purchasing water rights.
0 Surface diversion water rights are an entirely
different type of right than a groundwater right. It
is uncertain how conflicts for water use would be
resolved between different types and seniorities of
water users, especially along a river such as the
Lemhi that has been entirely adjudicated.
0 When a change in the type of water right is made (i.e.,
surface water to groundwater), prior right dates are not
retained.
Costs
The following flow availability and cost analyses are identical to
those presented in the Water Withdrawal Reduction and Sprinkler
Irriqation sections, except that costs associated with wells must
be added. The cost to BPA is still based on the value of a water
right.
4-24

yeilds due to improved water application. However, this gain
probably would not offset pumping costs.
Implications for Fish
Approximately 13 to 20 cfs could be saved at L-6 and L-7 if enough
irrigated acreage or water rights could be purchased by BPA.
Other Considerations
In evaluating this alternative, consideration must be given to
water rights law. The most important aspect affecting public
support probably will be that priority of right is not retained
when changing the type of a water right from surface to
groundwater.
ALTERNATIVE 5 - WATER WITHDRAWAL REDUCTION
Surface water diversions could be reduced by purchasing water
rights directly from a landowner, or buying land with senior water
rights and not diverting that water. The purpose of this section
is to evaluate the feasibility of purchasing water rights and
increasing flood irrigation efficiency.
ALTERNATIVE DESCRIPTION
In implementing this alternative, there are several distinct
options:
1. Purchase land to which a senior water right is attached.
Transfer this right from a surface water diversion for
irrigation to an instream right for fish enhancement.
Sell the land without the water right.
4 - 2 7

For sprinkler irrigation, benefits and costs per acre are as
follows:
Water Use = 0.015 cfs/acre
Income from Water Rights Sale = $255/acre
Income from Yield Increase = $130/acre
Cost for Sprinklers = $245/acre
Cost for Pumps, Motors, and Drilling
= ($5,500/we11)(.015cfs/acre)(well/.67 cfs)
= $123/acre
Annual Electricity Cost
= (.022 wells/acre)(6 kW)(24 hrs)(30 days)(6 months)
($.0438/kWh)
= $25/acre/year
Annual O&M
= ($245/acre)(0.15) = $37/acre
Therefore,
First Year Annual
Income = $385/acre $130/acre
cost = $430/acre $ 62/acre
RESULTS
Cost
The total initial cost of the alternative to BPA is approximately
$300,000 depending on how much water can be conserved through
improved irrigation. Initial gross costs to irrigators are
$456/acre for flood irrigation and $430/acre for sprinkler
systems. Annual costs are inexact but are definitely higher for
the latter option. Net gains by participating ranchers could be
realized through an increase in the quality and quantity of hay
4-26

the Idaho Water Resources Department (IWRD), Herndon Law Office,
and local irrigators. Data were obtained from the Soil
Conservation Service (SCS) in order to assess the parameters
involved in increasing irrigation efficiency.
Available Flow Benefits
Water Rights Purchase
Flow available from the outright purchase of water rights or the
purchasing and selling of land with and without rights,
respectively, influences implementation of this option. The cost
analysis is based on the likelihood of purchasing enough senior
water rights in order to satisfy fish requirements. From this
value, a total cost was computed based on an estimate of allocated
water rights per acre.
Land Purchase
The amount of undiverted stream flow, produced by the direct
purchase of land, depends on the amount of land available for
sale. It would be preferable to obtain land with senior water
rights, so that a priority can be established for maintaining
stream flow for fish during dry periods. Cost estimates for this
option assume that enough land can be purchased to satisfy a
minimum flow of 20 cfs at diversion 1-5.
Irrigation Efficiency Improvement
The following estimates and assumptions are used in the analysis
of benefits and cost:
0 Current application efficiency in the Valley with flood
irrigation (ungraded fields, generally long runs) is
20-30 percent, not including delivery losses.
4-29

2 .
3 .
4 .
Directly purchase a senior water right in its entirety
for land parcels in the lower Lemhi Basin. Transfer to
an instream right for fish benefits.
Purchase partial water rights from individual
irrigators. Ranchers could then use the income from
this sale to improve the efficiency of flood irrigation
systems. Transfer purchased portion to an instream
right.
Purchase land having senior water rights. Instead of
selling the land without the rights, allow the acreage
to revert to a natural state for wildlife habitat or
convert the area to a park for public recreational use.
Transfer the right to an instream right for fish.
In changing the beneficial use of a water right from irrigation to
fish, the priority date remains unchanged because both are the
same type of right. However, in altering the beneficial use, the
user must conform with three basic rules: 1) no other water users
will be impaired: 2) the amount of water withdrawal cannot be
increased: and 3) the change is in the local public interest.
The only possibility for direct outlay of funds for increased
water use efficiency would be to improve properties belonging to
the Town Ditch Company. The Andrews and Town (or Slough) Ditches
which extend from L-6 and L-7 and are 6.8 and 4.6 miles long,
respectively, could be reshaped, compacted, and lined with
bentonite, gunite, or perhaps polyethelene.
ANALYSIS
Data Sources
In order to analyze the feasibility of purchasing land or water
rights, information was collected from numerous sources including:
4-28

Water Availability
If 30 percent of the current water withdrawals can be conserved
under improved flood irrigation practices and 60 percent of the
ranchers diverting from L-6 and L-7 participate, then water use
reduction can be computed as follows:
Water Savings from L-7
= (water right)(% conserved)(% participation)
= (28 cfs)(0.30)(0.60)
= 5.0 cfs
Water Savings from L-6
= (41.8 cfs)(0.30)(0.60)
= 7.5 cfs
The sum of these values, 12.5 cfs, can be used to compute the cost
to BPA.
Costs
Water Rights Purchase
The cost of a water right on a unit area basis was estimated as
$500/acre for the lower Valley. This is the difference in the
price of land with and without water riqhts. The unit price for a
water right is extremely variable and depends on site-specific
conditions. Using the estimated value for water savings
downstream of diversion L-6, the total cost to BPA for this
alternative can be calculated as follows:
Cost per cfs = (water value)(unit allocation at field)
= ($5OO/acre)(acres/0.03 cfs)
= $17,000/cfs
4-31

0 Future application efficiency with improvements (leveled
fields, shortened runs, improved layout) is
approximately SO-60 percent, depending on management
practices.
0 Approximate water rights allocation at the field (not
including amounts added for transport losses) according
to IWRD adjudication is approximately .03 cfs/acre or
1.5-2.0 acre-feet per acre during the irrigation
season.
0 Current yield with flood irrigation is about 3 to 3-l/2
tons/acre (average for two cuttings of alfalfa-grass
mixture hay in the lower Lemhi Valley under average
weather conditions). Yield for grass hay under similar
conditions is l-1/2 to 2 tons/acre.
0 Predicted yields with improvements to flood irrigation
practices are 5 tons/acre for alfalfa-grass hay and
3-4 tons/acre for grass hay.
Increased water application efficiency also increases the hay
quality. This in turn means an increase in value or greater
weight gains when fed to cattle.
Location
Because of the critical nature of the lower Lemhi River during low
flow, efforts were concentrated in the Valley north of diversion
L-8 in the low elevation areas. No consideration was given to the"benches" or bluffs which border the floodplain and Valley. These
areas are sprinkler irrigated and soils have extremely high
percolation rates.
4-30

the water rights purchase be cost effective for the participating
ranchers to improve irrigation efficiency. On a per-acre basis
for alfalfa-grass mixture hay, a feasibility analysis for the
irrigator could be performed as follows:
Current Water Use
= 0.03 cfs/acre (based on allocation)
Amount Conserved
= (Water Use)(% Conserved)
= (0.03 cfs/acre)(0.30) = .009 cfs/acre
Income from Sale of Partial Water Right
= ($17,000/cfs)(.009 cfs/acre)
= $153/acre
Annual Income Increase Due to Yield Increase
= (5-3) tons/acre ($65/ton)
= $130/acre
Cost to Improve Land and Ditches
= $250/acre
Annual cost increases due to increased labor to manage water
distribution is unknown; most ranchers do not hire workers for
flood irrigation.
Canal Improvement
The cost of lining Town Ditch with gunite or polyethelene is
approximated as follows:
Total Cost = (wetted perimeter)(length)(unit cost)
= (6 ft)(4.6 mi)(5280 ft/mi)($l.50/ft2)
= $219,000
4-33

Total Cost = ($/cfs)(flow conserved)
= ($17,000/cfs)(12.5 cfs)
= $212,500
An assessment of the total number of acres which must be directly
purchased in order to achieve this water reduction is as follows:
Total Acreage Required
= (12.5 cfs)(acre/0.03 cfs)
= 417 acres
Land Purchase
With this option, land would be purchased for the purpose of
securing water rights, and would not be resold. Thus, the total
and per unit cfs costs would be greater than for purchasing the
water right only. If we assume an approximate cost for land with
water rights of $l,5OO/acre, the total cost is calculated as
follows:
Cost per cfs = (land value)(unit allocation)
= ($l,5OO/acre/cfs)(acre/.03 cfs)
= $50,00/cfs
Total Cost = ($/cfs)(flow requirement)
= ($50,000/cfs)(20 cfs)
= $1,000,000
Acreage Required = (20 cfs)(acre/.03 cfs)
= 667 acres
Irrigation Efficiency Improvements
The cost to BPA for this option would be equal to the purchase of
a water right, $17,000 per cfs. However, it is imperative that
4-32

exchange partial water rights for income to improve flood
irrigation application. Benefits also depend on the availability
of land with water rights for sale.
Additional benefits could be realized from this option if an area
for game and nongame animals was established. If allowed to
revert to a natural state, riparian areas would improve allowing
greater benefit to the fish population.
ALTERNATIVE 6 - RETURN FLOW IMPROVEMENT
The purpose of this alternative study is to evaluate the
feasibility of improving return flows from flood irrigation
practices.
ALTERNATIVE DESCRIPTION
Return flow improvement sites would be located in areas with
marshes or perched water tables, or areas downhill of intensely
irrigated fields, suitable for catchment ponds or collection
ditches. Emphasis should be placed on the lower Valley because
critical reaches are concentrated there.
Improving the return flow process could involve several methods:
0 Draining marsh and natural collection areas by placing
pumps at these sites and installing pipes for
transporting water to critical areas.
0 Constructing collection ditches and catchment ponds to
drain heavily-irrigated areas faster. Ditches would be
parallel to the River along the floodplain in order to
catch shallow groundwater. Catchment ponds could be
drained with pipes or ditches using pumps or gravity
flow.
4-35

This cost could be reduced by lining only portions of the canal or
by using a local source of bentonite and local labor to perform
the work.
Crop Yields
As previously mentioned, the option of purchasing partial water
rights c a n n o t b e implemented without the participation of
individual irrigators. For this reason, increased crop yields and
quality are an essential factor for encouraging ranchers to
negotiate water right exchanges.
RESULTS
Cost
The cost of this alternative would be about $17,000/cfs of water
conserved, or $212,500 if 12.5 cfs can be conserved under assumed
conditions of irrigation efficiency and water use. If land was
purchased and retained by an agency, the cost would be $l,000,000
for water rights totaling 20 cfs.
A value for water rights on a per-acre basis is difficult to
predict since there are many land uses and ranch sizes in the
lower Valley. Ranches vary in size from 100-200 acres to a few
extensive cattle ranches of l,OOO-2,000 acres. Land value also
varies greatly with the appurtenances attached to the land such as
houses, barns, equipment, or land characteristics such as soil and
historic crop yields. These variables affect the cost of this
alternative.
Implications for Fish
The flow benefits for this alternative depend on the willingness
of local irrigators to participate. They must be willing to
4-34
Field surveys indicate that there are currently numerous return
flows which contribute significantly to the River. An example is
Geertson Slough, located between L-3B and L-4. During late July,
this Slough was contributing approximately 2.0 cfs. Apparently,
there are several ditches which augment the River at a nearly
constant rate.
Water Quality
Water quality is an extremely important consideration for
augmenting the River with return flows. Shallow groundwater, or
water collected in ponds or slow moving ditches, will be warm and
may contain agricultural chemicals. Since water temperatures in
the lower Lemhi are high during low-flow periods, adding water of
low quality would not be advantageous to enhancing fish
populations.
RESULTS
The implementation of this alternative may adversely affect water
quality in the River. In addition, insufficient data were
available for an in-depth analysis. As a result, this alternative
was discarded early in the Study.
ALTERNATIVE 7 - SPRINKLER IRRIGATION
The objective of this alternative study is to determine the
feasibility of replacing flood irrigation with sprinkler systems
to reduce total surface water diversion.
ALTERNATIVE DESCRIPTION
This alternative involves purchasing partial water rights in
exchange for more efficient irrigation systems. Incentives for
participation by area ranchers include increased yields and
4-37

0 Installing drainage tiling in order to capture deep
percolation and return excess flows to the River through
pipes or ditches.
Because it involves improvement to private land, the latter option
would be performed on a site-specific basis and would require an
exchange between BPA and individual irrigators.
ANALYSIS
Data Sources
The major sources of data used in this analysis were field
investigations and aerial photos. During reconnaissance surveys,
marsh and other groundwater collection areas were identified,
especially in the lower Basin. Aerial photos were used to locate
natural water storage areas.
Groundwater Interaction
The aquifer system serves as a storage reservoir. Draining
natural storage areas or installing artificial drainage could
disrupt this process. The storage process appears to be essential
for maintaining flows in the late summer. Because of the complex
nature of the system, it is impossible, given the data available,
to assess the impact on groundwater return flow when implementing
this alternative.
Flow Availability
Quantifying the flow available in marsh areas, potential
collection ponds, or ditches is difficult. In the lower Valley,
there are no evident large, concentrated sources of water that can
be easily drained. There are many small areas where the water
table appears perched, but obtaining a consistent augmentation
flow from these sources is questionable.
4-36

ANALYSIS
Data Sources
Sources of information for this analysis were included in the Soil
Conservation Service (SCS) and conversations with area ranchers.
Unit costs, shown in Appendix E, were used for evaluating this
alternative.
Water Utilization and Conservation
Method of Withdrawal
Because groundwater irrigation was considered in previous
sections, this analysis will address only the option of sprinkler
irrigation from surface water diversions.
Water Use and Savings
Currently, water rights are allocated at approximately 0.03 cfs/
acre at the field. A number of variables were considered in
determining allocations, including diversion and transport losses.
In conducting a general analysis, assumptions included:
0 Of the standard water right allocation, 100 percent is
currently required to flood irrigate a field.
0 Transport losses are not considered.
0 Future application efficiency with sprinklers (wheel
lines) is approximately 70 percent.
0 At least a 50 percent reduction in water use could be
realized if inefficient flood irrigation is replaced by
sprinklers.
4-39
monetary compensation for reduced water consumption. Proving the
feasibility of this alternative to individual irrigators is
essential to its success. To the irrigators, it is the bottom
line that will determine whether they will sell part of their
water rights.
Location
Low flows and high irrigation demand combine to create impassable
reaches, generally downstream of diversion L-8 during May, late
July, August, and September. Therefore, the lower Valley was
identified as the area where sprinkler irrigation would provide
the most benefit.
Implementation
Ranchers in the lower Basin would be solicited to participate in
the program. A detailed design then would be developed for the
specific sites, determining more accurately the required amount of
water as well as the volume that could be saved during the
irrigation season. This would indicate the amount of water right
BPA should purchase: the value of that partial water right would
determine whether the program was feasible for an individual site.
A feasibility analysis would consider increased yields for
ranchers. The site analysis during the design phase would be a
more detailed version of the evaluation presented in this report.
That analysis also should cover the interaction of applied
irrigation water and groundwater. A switch to sprinklers on an
upstream field might increase the irrigation requirements to a
downstream field. Once an agreement was reached, the water right
would be purchased and formally transferred to an instream right
for the benefit of fish.
4-38

Cost to Irrigator
Based on the analysis performed for Alternative 5, the cost to
install a sprinkler irrigation system is as follows:
Current Water Use = 0.03 cfs/acre
Amount Conserved
= (0.03 cfs/acre)(0.50) = 0.015 cfs/acre
Income from Sale of Partial Water Rights
= ($17,000/cfs)(0.015 cfs/acre) = $255/acre
Annual Income Increase Due to Yield Increases
= $130/acre
Cost of Irrigation System = $200/acre
Cost of Pumps = $45/acre
Annual O&M = (0.l5)($245/acre) = $37/acre/year
Annual Electricity Cost = $7.2/acre/year
Therefore,
First Year Annual
Income = $385/acre $130/acre
cost = $287/acre $ 42/acre
RESULTS
Cost
The total cost to BPA is approximately $348,000 assuming the
stated water savings. There would be no annual cost to BPA for
this alternative.
Implications for Fish
The total flow made available by this alternative cannot be
accurately assessed until the public interest for participating is
determined. Under the assumed conditions, approximately 20.9 cfs
could be conserved from L-6 to the mouth.
4-41

Water use reduction is calculated as follows, if 60 percent of the
ranchers diverting from L-6 and L-7 participate:
Water Savings from L-7:
= (water right)(% conserved)(% participation)
= (28.0 cfs)(0.50)(0.60)
= 8.4 cfs
Water Savings from L-6:
= (41.8 cfs)(0.50)(0.60)
= 12.5 cfs
Total Water Savings from L-6 to Mouth of Lemhi
= 8.4 + 12.5 = 20.9 cfs
Cost
Costs for this alternative are the same as the Water Withdrawal
Reduction alternative.
Cost to BPA
Total Cost to BPA
= (water value/acre)(unit allocation)(water savings)
= ($500/acre)(acre/0.03 cfs)(20.9 cfs)
= $348,300
This includes a unit cost for water of $17,000/cfs. The total
acreage required to achieve this water savings if land is
purchased directly:
Total Acreage
= (20.9 cfs)(acre/0.03 cfs)
= 697 acres
4-40
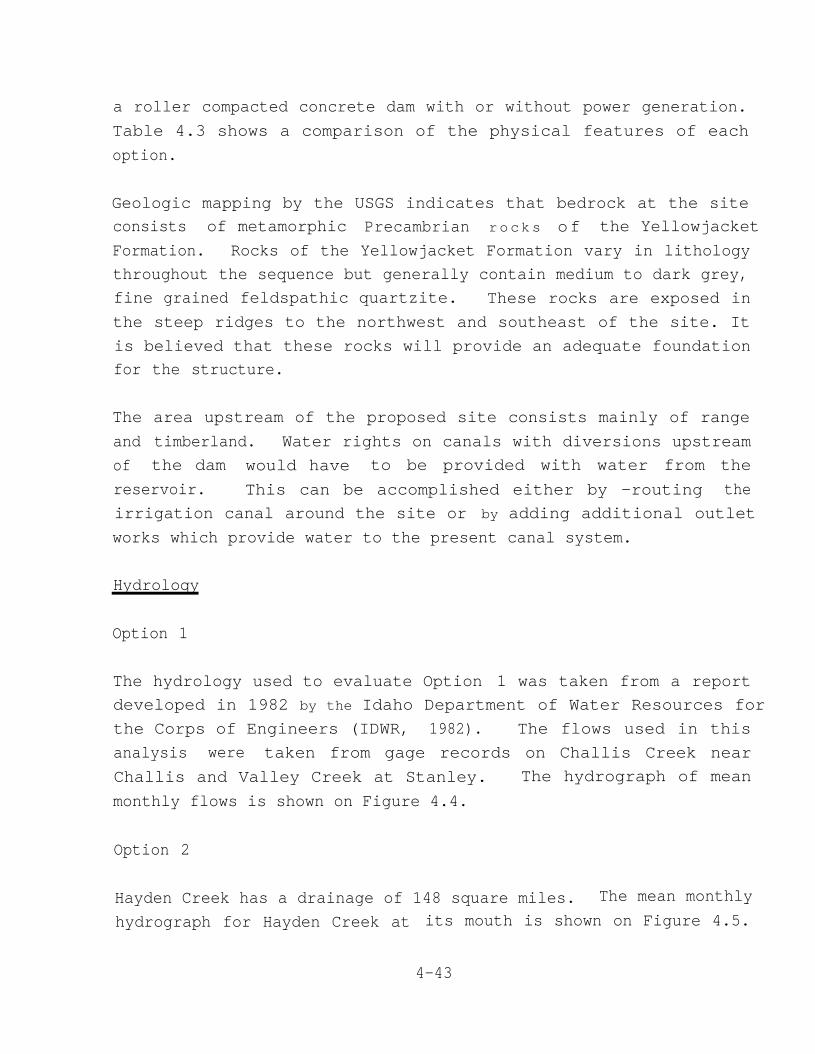
a roller compacted concrete dam with or without power generation.
Table 4.3 shows a comparison of the physical features of each
option.
Geologic mapping by the USGS indicates that bedrock at the site
consists of metamorphic Precambrian rocks of the Yellowjacket
Formation. Rocks of the Yellowjacket Formation vary in lithology
throughout the sequence but generally contain medium to dark grey,
fine grained feldspathic quartzite. These rocks are exposed in
the steep ridges to the northwest and southeast of the site. It
is believed that these rocks will provide an adequate foundation
for the structure.
The area upstream of the proposed site consists mainly of range
and timberland. Water rights on canals with diversions upstream
of the dam would have to be provided with water from the
reservoir. This can be accomplished either by -routing the
irrigation canal around the site or by adding additional outlet
works which provide water to the present canal system.
Hydroloqy
Option 1
The hydrology used to evaluate Option 1 was taken from a report
developed in 1982 by the Idaho Department of Water Resources for
the Corps of Engineers (IDWR, 1982). The flows used in this
analysis were taken from gage records on Challis Creek near
Challis and Valley Creek at Stanley. The hydrograph of mean
monthly flows is shown on Figure 4.4.
Option 2
Hayden Creek has a drainage of 148 square miles. The mean monthly
hydrograph for Hayden Creek at its mouth is shown on Figure 4.5.
4-43

ALTERNATIVE 8 - STORAGE
The objective of this alternative is to locate and size a storage
reservoir which can augment low flows in the Lemhi. The reservoir
would be used to store water during high-flow periods and release
it during critical low-flow periods. Water released from the
reservior would be used to augment natural flows to provide
passage for migrating salmon and steelhead and increase rearing
and spawning habitat.
Historically, critical low flows occur during the months of May,
July, August, and September. These months correspond with periods
of high irrigation demand. Upstream migration of chinook occurs
from May through August, usually peaking in June and July. The
Lemhi generally reaches its peak stream flow during June snowmelt
and rain.
ALTERNATIVE DESCRIPTION
Previous studies analyzing the possibility of placing a storage
reservoir in the Lemhi River Valley have been performed by the
U.S. Army Corps of Engineers (1985) and the U.S. Bureau of
Reclamation (1941 and 1942). These studies, which vary in level
of detail, have examined several locations throughout the Valley,
including Agency Creek, Bear Valley Creek, and Hayden Creek.
Using this information and data gathered through field visits, a
suitable site at stream mile 8.1 on Hayden Creek was chosen for
the proposed reservoir (Appendix B). The site is immediately
downstream of the confluence of Bear Valley Creek at the narrowest
point in the Hayden Creek Valley.
Two storage options on Hayden Creek are addressed in this report.
The first is the project under study by the Corps of Engineers, a
29,000 acre-foot impoundment. The second is a 17,200 acre-foot
impoundment evaluated as part of this task. Both options include
4-42
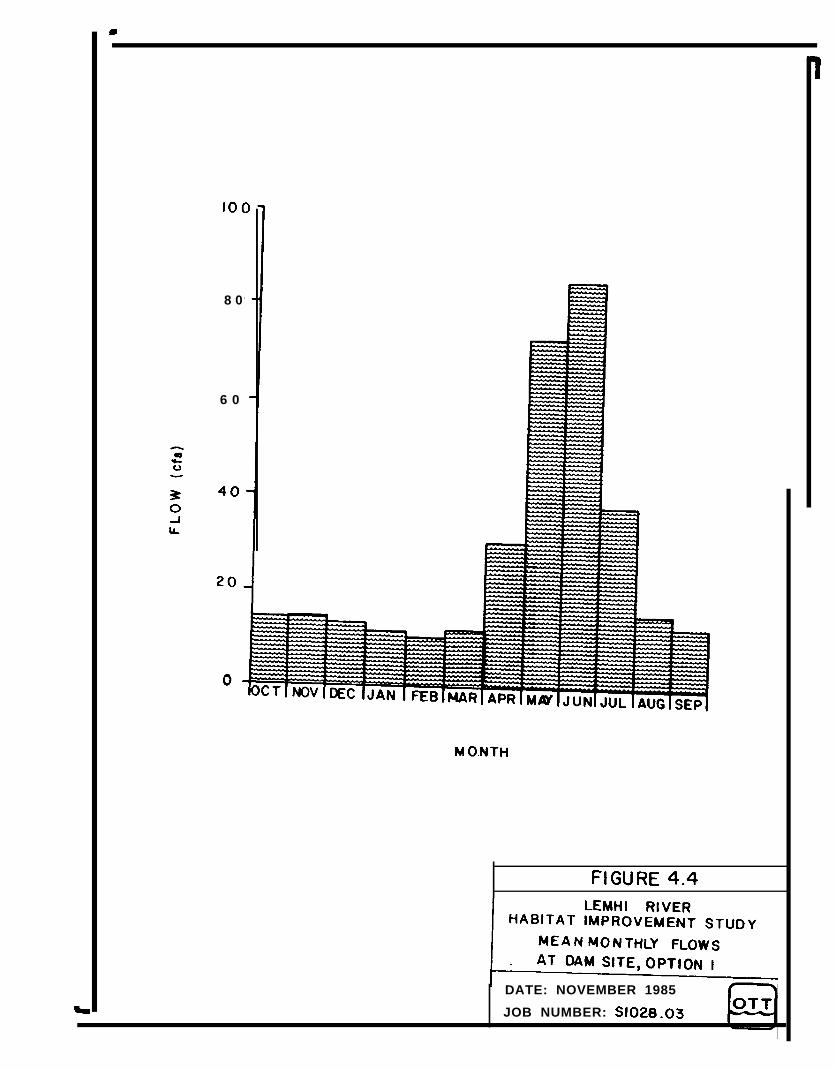
8 0
6 0
M O.NTH
FIGURE 4.4
DATE: NOVEMBER 1985
JOB NUMBER: S1028.03

PHYSICAL FEATURES OF STORAGE OPTIONS
Total Storage
Active Storage
Dead Storage
Spillway Elevation
Dead Storage Elevation
Maximum Dam Height
Approx. Crest Length
Crest Width
Spillway Capacity
TABLE 4.3
Option 1
(CORPS)
29,000 acre-feet
25,500 acre-feet
3,500 acre-feet
6,180 feet
6,040 feet
300 feet
1,300 feet
30 feet
27,600 cfs
Option 2
(OTT)
17,200
15,000
2,200
6,140
6,010
260
1,150
30
27,600
acre-feet
acre-feet
acre-feet
feet
feet
feet
feet
feet
cfs
4-44

This hydrograph was derived from the USGS gage on Lemhi River near
Lemhi and then correlated with three years of Hayden Creek data
gathered by the Bureau of Reclamation in the early 1940s. At the
proposed dam site, Hayden Creek drains 80 square miles of area. A
synthetic hydrograph has been developed using the ratio of the
drainage areas and mean monthly flows for Hayden Creek at the
mouth. This assumes that all other hydrologic factors are
constant over the drainage area. Figure 4.6 shows the mean
monthly flows in Hayden Creek at the site.
Operation
Option 1
In the reservoir analysis performed by the IDWR (19821,synthesized monthly flows from 1922 through 1971 were used. The
percentage of flows available for storage were assumed to be 100
percent for October through April, 50 percent for May, and
0 percent for June through September. A minimum instream flow of
6 cfs also was assumed. The required augmentation flows were
computed from the Lemhi River gage records adjusted to thecritical reach at the 28 Club Restaurant near diversion L-7.
These flows were subtracted from minimum required flows to derive
the required supplemental flows. The required minimum flows
estimated by the U.S. Fish and Wildlife Service were as follows:
October to March: Natural Flows
April 1 to May 15: 150 cfs
May 15 to September 30: 75 cfs
Option 2
Most of the water rights on Hayden Creek are diverted from
approximately April 1 to October 1 each year. The allocated water
rights between the proposed dam site and.the mouth of Hayden Creek
4-47

300
250
200
150
loo
5 0
MONTH
FIGURE 4.5LEMHI R I V E R
HABITAT IMPROVEMENT STUDY
MEAN MONTHLY FLOWS INHAYDEN CREEK AT MOUTH
DATE: NOVEMBER I985JOB NUMBER: SlO28.03

total approximately 63 cfs. Basin Creek, Rye Grass Creek, and
Meadow Creek all supplement flows in Hayden Creek below the
proposed site. These streams provide ample flow for water rights
allocated downstream of Meadow Creek. However, approximately
35 cfs has been allocated at points between the proposed site and
Meadow Creek and must be released from the dam.
A flow of 10 cfs would be released during reservoir recharging
periods to satisfy domestic and livestock uses and to provide an
aesthetic flow. These periods extend from November through March
when water rights are not exercised. Aesthetic flows may vary
during actual operation depending on the contribution by
groundwater and Meadow Creek, which is 2.5 miles downstream.
The reservoir would release sufficient flow to provide passage for
upstream migrants. Minimum instream flows and preferred
augmentation flows have been computed for several critical points
on the Lemhi, and are given in Table 3.1. Diversion L-6, at
RM 7.40, is historically the most critical point with respect to
passage on the River. OTT estimated that 50 cfs must be added to
the Lemhi from the reservoir in order to provide for passage and
to increase habitat. It is assumed that water released from the
reservoir would not be diverted before reaching L-6.
I n most years, critical flows can be maintained without
augmentation. In these years, the dam would release flows
according to an operating procedure that would provide an increase
in rearing habitat. For this Study, it was assumed that 50 cfs
would be released during the months of May,July, August, and
September.
Modified average monthly flows in Hayden Creek below the site of
the proposed dam can be seen on Figure 4.7. This figure shows
base flows that remain in the stream, flows reguired for storage,
and flows to be released for augmentation. Average monthly flows
4-49

2 0 0
150
,os
z 100
2
5 0
0
MONTH
I AREA RATIO = 0.541DRAINAGE AREA AT DAM SITE Vg.DRAINAGE AREA OF ‘HAYDEN CREEK
AT MOUTH
LEMHl RIVERHABITAT IMPROVEMENT STUDY
MEAN MONTHLY FLOWSAT DAM SITE, OPTION 2
DATE: NOVEMBER 1985
nlO T T
JOB NUMBER: SlO28.03

during October are less than those allocated through water rights
legislation, and cannot be used for storage. It can also be seen
on Figure 4.7 that the month of June accounts for a great deal of
the total yearly storage requirements. Actual June flows will
affect the amount of water available for augmentation during July,
August, and September.
Area-capacity curves have been developed using 1 to 62,500 scale
topographic maps with 80-foot contour intervals (Figure 4.8). The
maximum capacity of the reservoir is 17,200 acre-feet. The
minimum volume of active storage, calculated using mean monthly
flows, is 15,000 acre-feet. The remaining 2,200 acre-feet is dead
storage.
For the development of cost estimates, a 260-foot high, roller
compacted concrete dam was assumed. An 80-foot gated spillway and
outlet works are included. Maximum pool elevation in the
reservoir is 6,140 feet and the crest length of the dam is 1,150
feet and its width is 30 feet. The downstream face is sloped
0.8H:l.0V, and the upstream face is vertical
Power
Preliminary analyses have also been performed for the storage
reservoir with the addition of hydropower. Included in this
alternative are outlet works, powerhouse, transmission line, and
appurtenant electrical and mechanical equipment. The powerhouse
would contain two 1,150 kw Francis turbines. Each unit would have
a design flow of 70 cfs and a design head of 200 feet. Power
veneration will commence April 1 and extend through September 30.
igure 4.9 shows the average monthly pool elevation and gross head
ased on an estimated streambed elevation of 5,980 feet. It was
assumed that all water released from the dam would be used for
4-51
Dam
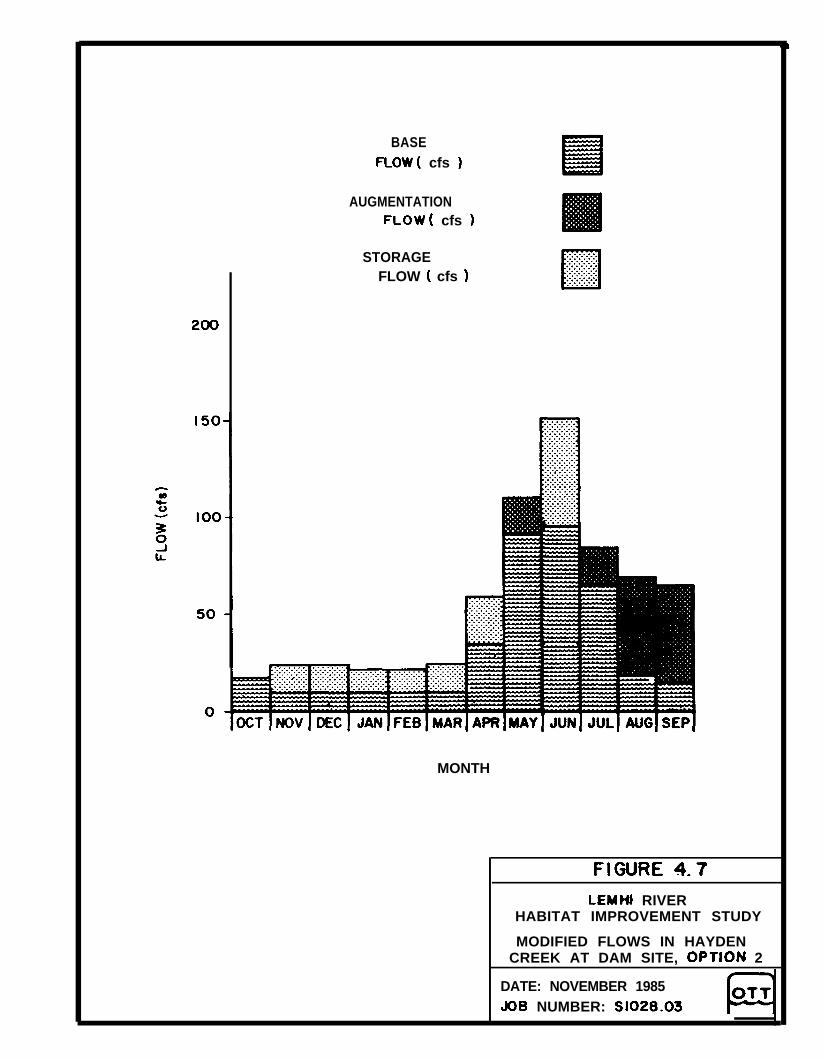
200
BASEFLOW( cfs )
AUGMENTATIONFLOW( cfs 1
STORAGEFLOW ( cfs 1
. . . . . .~.-_-::::~_-_:~.-.~.~
III
-:::::::.:.I.:.:.:.:. . . . . .
:.:.:.:.>:.I
MONTH
FIGURE 4.7
LEMHl RIVERHABITAT IMPROVEMENT STUDY
MODIFIED FLOWS IN HAYDENCREEK AT DAM SITE, OPTJON 2
DATE: NOVEMBER 1985JOB NUMBER: SlO28.03

FIGURE 4.9* ASSUMED DOWNSTREAM WATER
LEMHI RIVERSURFACE ELEVATION @ 5910 HABITAT IMPROVEMENT STUDY
MONTHLY POOL ELEVATIONAND GROSS HEAD
DATE: NOVEMBER 1985
JOB NUMBER: S 1028.03

a
SC
loa
150
200
260
300
l-7
I-
I-
I-
62006200 6160 6tOOPOOL ELEV (YS.L.-APX)
24000
22000
20000
l8ooo
16000
14000
12000
10000
8000
6ooo
4mO
2000
01
FIGURE 4.8
LEMHI RIVERHABITAT IMPROVEMENT STUDY
1 AREA-CAPACITY CURVES
DATE: NOVEMBER 1985J08: NUMBER SlO28.03

TABLE 4.4
CAPITAL COSTS FOR STORAGE RESERVOIR WITH POWER
ITEM
LAND
RESERVOIR CLEAR & GRUB
DAM SPILLWAY & OUTLET WKS
UNIT QUANTITY UNIT COST TOTAL COST
AC 225 $ 400. $ 90,000
AC 225 220. 50,000
LS -a- --- 21.100.000
POWER PLANTTurbines & GeneratorAccessory Elec. Equip.
1,420,000LS --- --- 837,000LS --- --- 583,000
SWITCHYARD LS --- --- 68,000
TRANSMISSION LINE 755,000New Line MI 8.1 45,000. 365,000Upgrade MI 26.0 15,000. 390,000
ADDITIONAL OUTLET WKS FOR POWER LS we- --- 150,000
POWERHOUSE SQ FT 975 150 146,000
BUILDINGS, GROUNDS, & UTILITES LS --- --- 240,000
ROADS 61,000Paved FT 2500 10. 25,000Gravel FT 6000 6. 36,000
CIVIL SITE WORK LS --- --- 30,000
MOBILIZATION LS --- --- 800,000
SUBTOTAL 24,910,00020% ENGINEERING & ADMINISTRATION 4,980,00015% COMPOSITE CONTINGENCY 3,740,000
TOTAL CONSTRUCTION $33,630,000
INTEREST DURING CONSTRUCTION 5,200,000
TOTAL CAPITAL INVESTMENT $38,830,000
4-55

power production. The expected average annual energy production
of the plant would be 5,060 MWh.
Costs
Several sources were used to develop cost summaries in the
following section. Unit costs developed in this Study have been
used wherever possible. Data on roller compacted concrete (RCC)
dams were obtained from the Corps of Engineers. Cost estimates
were derived using volume ratios of similar structures. Power-
plant costs were derived from cost curves developed by OTT and the
Corps of Engineers for the Northwest Power Planning Council's PNW
Hydropower Data Base. These curves estimate component costs based
on installed capacity and other physical characteristics of the
project.
RESULTS
Costs
Preliminary cost estimates have been prepared for both reservoirs
with power and the OTT alternative without power (Tables 4.4 and
4.5, respectively). Total investment represents total capital
costs plus 20 percent for engineering and administration, and a 15
percent contingency. Total investment does not include any annual
or replacement costs. Operation and maintenance costs are given
separately. Prices shown have been escalated to 1985 price
levels. The costs for both options are summarized in Table 4.6.
Implications for Fish
Benefits from the construction of a storage reservoir on Hayden
Creek would be derived in four areas: flow augmentation, power
generation, flood control, and recreation. Discharges from the
reservoir would provide the necessary flows in the Lemhi to allow
fish passage at critical points during low-flow periods. Flow
4-54

Option 1with 1155 kWPower Plant
Option 2with Power
Option 2without Power
TABLE 4.6
COSTS FOR STORAGE RESERVOIR OPTIONS
First Cost($1,000)
42,500
38,830
34,881
O&M($1,000)
162
160
40
4-57

TABLE 4.5
CAPITAL COSTS FOR STORAGE RESERVOIR WITHOUT POWER
ITEM UNIT QUANTITY UNIT COST TOTAL COST
RESERVOIR CLEAR & GRUB AC 225 $ 400. $ 90,000
DAM SPILLWAY & OUTLET WKS LS --- --- 21,100,000
BUILDINGS, GROUND & UTILITIES 213,000
ROADS 61,000
Paved FT 2500 10. 25,000
Gravel FT 6000 6. 36,000
CIVIL SITE WORK LS --- --- 30,000
MOBILIZATION LS --- --- 670,000
SUBTOTAL 22,134,000
20% ENGINEERING & ADMINISTRATION 4,427,000
15% COMPOSITE CONTINGENCY 3,320,000
TOTAL CONSTRUCTION $29,881,000
INTEREST DURING CONSTRUCTION 5,000,000
TOTAL CAPITAL INVESTMENT $34,881,000
4-56

augmentation also would increase rearing and spawning habitat. A
summary of flow modifications for the Option 2 storage reservoir
site is shown in Table 4.7. An average annual energy of about
5,060 MWh would be produced if the "with-power" alternative is
adopted. This power would be sold to local utilities.
Flood control benefits might be realized by residents of lower
Hayden Creek. Typical flooding occurs when spring rains accompany
snowmelt in the month of June. Recreation benefits such as
fishing and boating might be realized from the reservoir. Only
the potential benefits of power have been calculated here. The
average annual augmented flows on Figure 4.7 can be used to
calculate the fisheries benefit in other tasks. A summary of
augmented flows and power benefits is presented in Table 4.8. The
power benefits assume a $.O5/kWh cost for power.
Other Considerations
In addition to economic and flow benefits, there are several
considerations that have a bearing on alternative selection.
Augmented flows released from the reservoir could be diverted for
irrigation before reaching the critical reach about 31 miles below
the reservoir. The water right associated with the reservoir
could be superceded by the prior irrigation rights on Hayden Creek
and the Lemhi River. There would have to be a procedure by which
the irrigation diversions would be monitored to ensure that
augmented flows are not being diverted unnecessarily.
An alternative involving a large dam would be difficult to
implement, and it would not be completed until approximately 1992.
Public sentiment is generally against large dam projects, although
the Lemhi Valley irrigators have said they would support such a
project because there would be more water available for irrigation
during low flows.
4-58

TABLE 4.7
FLOW MODIFICATION AT LOCATION OF PROPOSED STORAGE RESERVOIR
AESTHETIC AUGMENTATION MEANMEAN INFLOW WATER RIGHT FLOW
cfs CfS* cfs cfs cfs
October 18 35 0 0 18
November 24 0 10 0 10
December 24 0 10 0 10
January 22 0 10 0 10
February 22 0 10 0 10
March 24 0 10 0 10
April 59 35 0 0 35
May 92 35 0 20 112
June 151 35 0 0 95
July 65 35 0 20 85
August 19 35 0 50 69
September 16 35 0 50 66
l Water rights flows represent allocations between the site andMeadow Creek.
4-59

TABLE 4.8
AUGMENTATION FLOWS AND POWER BENEFITS
AUGMENTATION BENEFIT:
Month Option 1 Option 2
October
November
December
January
February
March
April
MayJune
July
August
September
POWER BENEFIT:
Average Annual Energy
-5.2 cfs
-7.9 cfs
-6.8 cfs
-5.6 cfs
-5.0 cfs
-6.0 cfs
-15.2 cfs
-27.8 cfs
+6.0 cfs
+19.5 cfs
+34.8 cfs
+15.8 cfs
$136,500
-O-
-14 cfs
-14 cfs
-12 cfs
-12 cfs
-14 cfs
-24 cfs
+20 cfs
-56 cfs
+20 cfs
+50 cfs
+50 cfs
$253,000
4-60

ALTERNATIVE 9 - TRAP AND HAUL
The objective of this task is to develop a trap and haul system
that will trap upstream and downstream migrating salmon and
steelhead and transport them around critical low-flow reaches of
the Lemhi. The system includes a juvenile trap located above the
critical reaches and an adult trap located near the mouth of the
Lemhi.
Other enhancement alternatives presented involve methods to
increase the amount of flow in the stream and thereby aid fish in
their migration. This alternative does not attempt to solve the
problem of low flow in the lower reaches of the Lemhi. Rather, it
provides a method of circumventing the critical reach during
low-flow events, thereby improving upstream and downstream
passage.
ALTERNATIVE DESCRIPTION
Juvenile Facility
The site selected for a juvenile trap and haul facility is located
at RM 30.4, between diversions L-41 and L-42, immediately upstream
from the confluence of Hayden Creek. The location is shown on
Figure 8.3, Appendix B. State Highway 28 runs adjacent to the
left bank of the River providing easy access for construction and
transportation of fish. Access to the riqht bank for construction
and maintenance would require crossing the River at Lemhi and
traveling approximately 1.5 miles on unimproved roads to the
site.
Substantial improvements, including some sections of new road
would be required for adequate passage along the right bank. A
woodframe bridge exists approximately 0.3 miles upstream which
would provide closer access for foot traffic, but without
4-61

extensive structural work it is thought to be unsafe for heavy
equipment.
The stream channel at this point is approximately 60 feet wide.
Alluvium at the site is cobble to boulder size, due to the
relatively steep gradient of the River. Bank material is composed
of silts to coarse sands and gravels, typical of most of the Lemhi
Valley.
The juvenile trap facility consists of a permanent concrete slab,
louver fish barrier, juvenile fish trap, and an adult fish bypass.
Details are shown on Figure 4.10. The slab is 30 feet wide and
extends bank-to-bank. To prevent accumulation of bedload, the
slab is sloped slightly downstream. The slab also would aid in
reducing turbulence around the louver system. Cutoff walls would
extend 3 feet into the alluvium on the upstream edge and 5 feet on
the downstream edge of the slab to prevent scour during peak
runoff.
A louver fish barrier 120 feet long is oriented 30 degrees to the
direction of flow. The barrier consists of 12 separate panels,
each 10 feet in length. Panels would contain interchangeable
aluminum vanes with a 2-inch clear space between vanes.
Louver panels slide into steel braces at the joint. Braces are
pinned to permanent brackets inset in the concrete slab. Louverpanels are equipped with automatic pressure-release mechanisms.
These would allow the panels to lay down during sudden flow surges
or debris accumulation.
A juvenile fish bypass is placed at the downstream end of the
louver system on the left bank. Fish move down the bypass channel
and through a 'V' trap into a holding pool. A vertical aluminum
punched plate crowds fish into a mechanical elevator at the end of
the pool. The elevator consists of a 4-foot by 4-foot by 6-foot
4-62

ADJUSTABLE SCREENWEIR
MAXIMUM OPERATINGWATER DEPTH
4’EXISTING GROUND
LEVEL
ADULT BYPASS
CUTOFF WALL/
SECTION m
SCALE 1’120’ w
nAR RACKOR,
7 WALKWAY
FL0
’ TYPICAL BRACEI
SCALE I*a 4’
STATE HIGHWAY 28
\TRUCK LOAD
/ A R E A
FISH ELEVAT
REMOVABLE LOUVERWIFR
HINGED DEFLECTOR
InAUn noti- ,
I” CLEARANCE
ADULT PASSAGEADJUSTABLE SCREEN
WEIR \ FACILITY FIGURE 4. IO
PLANLEMHI RIVER
HABITAT IMPROVEMENT STUDYSCALE I”= 20’
JUVENILE TRAP AN) HAUL FACUTY
DATE: NOVEMBER 1985
JOB NUMBER: SlO28.03

perforated steel hopper. The upstream wall of the hopper is
hinged, allowing it to lay flat while fish enter. When the hopper
is full the wall will close. The hopper is hoisted by means of a
gantry winch, and then moved to the truck loading area. Fish are
loaded directly into a truck through a gate in the bottom of the
hopper.
Since the upstream migration period for adult steelhead coincides
with the period of operation of the juvenile fish trap, an adult
fish bypass is provided. Adult fish are guided upstream along the
louver barrier to a fishway entrance. The fishway consists of a
6-foot wide concrete channel at the right abutment of the louver
barrier. Upstream migrants would pass through the fishway
channel, over an adjustable screen weir, and back into the River
above the louver barrier. The adjustable screen weir could be a
telescoping fish screen, float-adjusted to remain 6 inches below
the water surface. The screen would allow water to pass through
the fishway while preventing most downstream migrants from passing
the louver barrier. A trash deflector, placed upstream of the
fishway exit, also would aid in diverting juveniles from the
fishway.
Adult Faciltiy
The site chosen for the adult trap and haul facility is
approximately 100 yards upstream from the mouth of the Lemhi and
downstream of diversion L-l. The location is shown on Figure B.1,
Appendix B. At this point, the river channel tends to the right
bank due to a bend in the River. Material on the right and left
banks consists of alluvial deposits, mostly sands and gravels.
The streambed is composed of cobble to boulder size alluvium.
The adult trap includes a concrete slab, removable barrier,
holding pool, and elevator. Details are shown on Figure 4.11. TO
maintain a constant cross section, a concrete slab would be
4-64

WINCH
//
FISH ELEVATOR
TRUCK LOADING, m, ENTRANCE TOAREA / FISH ELEVATOR
AUXIUARY WATERSLIDE GATE
UXILIARY WATER ’ - -LIDE GATE
HOLDING POOL
BAR RACK ORSTOPLOG BARRIER TYPICAL BRACE
RIPRAP A
TRASH RACKII - --- --. ~~
AUXILIARY WATER,
\
k,,,,
7/B-- CLEAR SINCE
‘ V - T R A P -
HOLDfNG POOL
FISH ELEVATOR
ACCESS ROAD-- --- /PLAN \- 0
SCALE I”= 20’
NATURAL CHANNELPSLOPE
TYPICAL BRACESCALE Pm 4’
FIGURE 4.1 ILEMHI RIVER
HABITAT IMPROVEMENT STUDY
ADULT TRAPAND HAUL FACILITY
DATE: NOVEMBER 1985
JOB NUMBER: S1028.03

installed and would extend 100 feet across the River. From theright bank it would run horizontally 50 feet and then change to a
10 percent slope up to the left bank training wall. This
configuration is designed to approximate the natural shape of the
River channel at this site. Cutoff walls would be placed at the
upstream and downstream edges of the slab, and extend 5 feet into
the alluvium. Cutoff walls are necessary to prevent scour during
high flows.
A removable bar rack and stoplog fish barrier would be attached to
the slab at a 45-degree angle to the direction of flow. The bar
rack panels are constructed from aluminum pipe placed with a
one-inch clear space between bars. Panels 4 feet high by 5 feet
long are placed vertically in steel braces, similar to those used
at the juvenile trap facility. Stoplogs are used to regulate and
concentrate the flow during extreme low-flow periods. To maintain
the flow near the fish trap entrance, stoplogs would be added from
the bank.
Adult fish would move upstream along the barrier to the right bank
and enter a fish trap. Auxiliary water is diffused into both
sides of the lo-foot wide and 20-foot long holding pool l
Auxiliary water would pass from the River through the trashracks
and into the holding pool. Stoplogs would be added to the barrier
if additional flow is needed. Fish in the holding pool would be
crowded into the elevator with a vertical aluminum punched plate.
Water pumped into the elevator would then raise the fish to the
elevation of the loading chute. Once loaded into the tank truck,
fish could be hauled to the upper watershed.
OPERATION
Juvenile Facility
The juvenile trap is designed to operate annually during the
downstream migration period, typically from March 1 to June 1.
4-66

Removal of the barrier is dictated by the end of the downstream
migration or by high flows from spring runoff during May or early .
June.
The louver barrier would accommodate a maximum flow of 450 cfswhile maintaining an approach velocity of less than 1 fps. This
flow is exceeded less than twenty percent of the time during the
month of May. Way is typically the highest flow month of the
downstream migration period. When flows rise above 450 cfs the
louver barrier would be removed.
Adult Facility
The adult trap would be operated only on an emergency low-flow
basis. Upstream migration of adult steelhead and chinook spans a
period from March through August. During this period, the barrier
dam would be installed only when the combination of available flow
in the River and irrigation demands cause an upstream passage .
barrier. This would occur approximately one in four years. The
average duration of operation is estimated to be one month.
RESULTS
Cost estimates have been prepared separately for each site. Total
project costs include estimates for capital and annual costs.
Capital costs include construction, engineering services, and
equipment. Annual costs include labor and materials required for
operation of facilities and trucks. Detailed cost summaries are
given in Tables 4.9 and 4.10.
Implications for Fish
The objective of this task is to provide a means by which fish can
pass critical reaches of the River. Benefits of this alternative
4-67
Cost

TABLE 4.9
CAPITAL AND ANNUAL COSTS FOR THE JUVENILETRAP AND HAUL FACILITY
UNIT COST TOTAL COSTITEM UNIT OUANTITY $/UNIT $
MOBILIZATION LS $ 10,000
DEWATERING LS 5,000
EARTHWORKExcavation (trench)Backfill (common)Riprap
(Material Placement)
12,900CY 1500 3.00 4,500CY 1000 1.00 1,000CY 210 35.00 7,400
CONCRETE 107,500Structural CY 200 350.00 70,000Slab CY 150 250.00 37,500
METALS 49,400Structural Fabricated LB 8000 2.00 16,000Bracing LB 4000 2.00 8,000Louvers LB 2600 9.00 23,400Fence LS 2,000
WOODS 1,000Stoplogs Ls 1,000
EQUIPMENT 90,000Winch 10,000Truck 80,000
MISCELLANEOUSAccess RoadCivil Site Work
12,000LS - 10,000Ls - 2,000
4-68

TABLE 4.9
(Continued)
CAPITAL AND ANNUAL COSTS FOR THE JUVENILETRAP AND HAUL FACILITY
UNIT COST TOTAL COSTITEM UNIT QUANTITY $/UNIT $
Subtotal 287,80020% Engineering and Admin. 57,60030% Contingency 86,300
TOTAL CAPITAL COST $431,700
ANNUAL COST .Labor (145 man-days @ $128/man-day)MaterialTruck Maintenance
18,600500
2,300
TOTAL ANNUAL COST $ 21,400
4-69
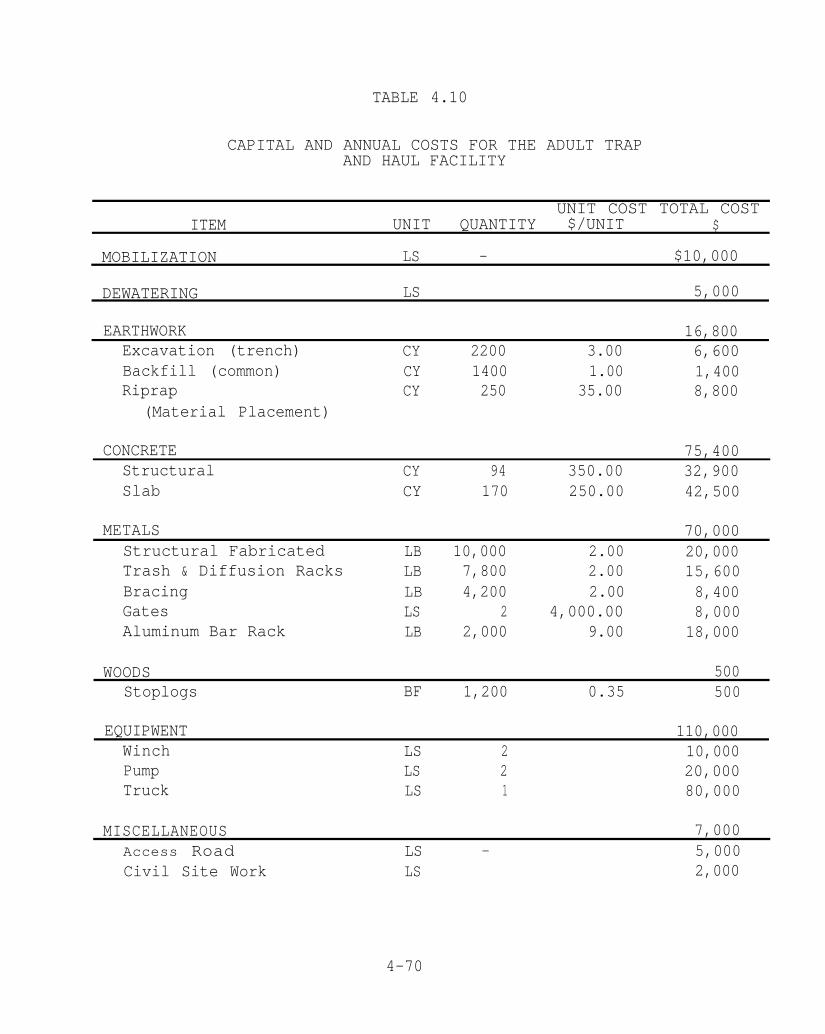
TABLE 4.10
CAPITAL AND ANNUAL COSTS FOR THE ADULT TRAPAND HAUL FACILITY
UNIT COST TOTAL COSTITEM UNIT QUANTITY $/UNIT $
MOBILIZATION LS - $10,000
DEWATERING LS 5,000
EARTHWORKExcavation (trench)Backfill (common)Riprap
(Material Placement)
16,800CY 2200 3.00 6,600CY 1400 1.00 1,400CY 250 35.00 8,800
CONCRETE 75,400Structural CY 94 350.00 32,900Slab CY 170 250.00 42,500
METALS 70,000Structural Fabricated LB 10,000 2.00 20,000Trash & Diffusion Racks LB 7,800 2.00 15,600Bracing LB 4,200 2.00 8,400Gates LS 2 4,000.00 8,000Aluminum Bar Rack LB 2,000 9.00 18,000
WOODS 500Stoplogs BF 1,200 0.35 500
EQUIPWENT 110,000Winch LS 2 10,000Pump LS 2 20,000Truck LS 1 80,000
MISCELLANEOUSAccess RoadCivil Site Work
7,000LS - 5,000LS 2,000
4-70

TABLE 4.10
(Continued)
CAPITAL AND ANNUAL COSTS FOR THE ADULT TRAPAND HAUL FACILITY
UNIT COST TOTAL COSTITEM UNIT QUANTITY S/UNIT $
Subtotal 294,70020% Engineering and Admin. 58,90030% Contingency 88,400
TOTAL CAPITAL COST $442,000
ANNUAL COSTLabor (132 man-days @ $128/man-day)MaterialTruck Maintenance
4,100100200
TOTAL ANNUAL COST $ 4,400 -
4-71

accrue solely from an increase in fish production. A trapping
efficiency of approximately 81 percent (90 percent capture and 90
percent transportaion efficiencies) is assumed for the juvenile
fish trap. The adult fish trap is assumed to be 90 percent
efficient.
4-72

CHAPTER5
BENEFITS ANALYSIS
SELECTION OF OPTIONS
At the interagency meeting of September 11, 1985, each of the nine
alternative solutions assessed in OTT's Draft Evaluation of
Alternatives Report (Chapter 4) were discussed. The following
conclusions were reached by agency personnel regarding OTT's
emphasis for the remainder of the Study:
0 The most important item to be addressed in the benefits
analysis is the improvement of upstream migration
conditions for salmon and steelhead.
0 Increased juvenile rearing habitat in the lower Lemhi
River might be created if stream flow is seasonally
augmented, but greater benefits will probably be
realized if adult upstream passage is improved.
0 Downstream juvenile migration enhancement, through
improved fish screens and bypasses, is not an integral
part of the Study and need not be addressed as a primary
assessment objective. Currently, NHFS funds and IDPG
implements a program for upgrading and maintaining
irrigation diversion screening facilities.
Based upon these conclusions, it was decided that the following
five actions should be assessed in the benefits analysis:
0 Diversion Dams. The problem of fish spawning migration
blockage is most severe at diversions L-5, L-6, and L-7.
However, all diversion dams listed on Table 2.1 should
be considered as influencing adult passage.
5-l
0 Channelization. Channelization is an important factor
in solving the upstream fish passage problem and should
be emphasized.
0 Sprinkler Irrigation. Sprinkler irrigation appears to
be a potential alternative for reducing surface water
withdrawals and should be assessed in conjunction with
direct water diversions from the Lemhi River.
0 Purchase Water Rights. Purchasing partial or entire
water rights would allow more water to remain in the
river.
0 Purchase Land. Land purchased for the purpose of
securing instream water rights could be resold without
the rights, used for fishermen access or recreation, or
reclaimed for wildlife habitat.
The benefits analysis also should consider the acceptability of
each alternative solution to landowners.
Based on the above considerations, OTT developed four ehnhancement
options (A through D). Each option is described in Table 5.1.
Option A includes permanent diversion dams and channelization to
promote fish passage at the most critical lower Lemhi Riverreaches. Option C covers both critical and problem passage
reaches (where migration blockages occur less freauently).
Options B and D are identical to A and C, respectively, except
that stream flow is augmented through water rights purchases.
Each enhancement option is analized with respect to four fisheries
management alternatives.
MANAGEMENT ALTERNATIVES
For each enhancement option, OTT evaluated four fisheries
management alternatives. These alternatives reflect OTT's
5-2

TABLE 5.1
ENHANCEMENT OPTIONS
OPTIONAUGWENTED
DESCRIPTION FLOW (cfs)
A Permanent diversion and levee construction 0.0at L-5, L-6, and L-7; riverbed channeliza-tion at L-5, L-6, L-7, SPSl, SPS2, and SPS3.
B Option A plus: flow augmentation throughpartial water rights purchase and increasedwater application efficiency (by improvingflood irrigation practices or installingsprinkler systems).
From L-7 to L-6Flood Irrigation ImprovementsSprinkler Systems
From L-6 to MouthFlood Irrigation ImprovementsSprinkler Systems
C Permanent diversion and levee constructionat L-5, L-6, L-7, L-20, L-22, L-3lA, L-40,L-41, L-43, L-44, L-45D, and L-61; riverbedchannelization at these locations plus SPSl,L-3, SPS2, SPS3, and SPS4.
5.08.4
12.520.9*
0.0
D Option C plus: flow augmentation (describedin B).
* This value is used in the fisheries and benefits analyses forOptions B & D and assumes installation of sprinkler systemsrather than flood irrigation improvements.
5-3

consultations with BPA and IDFG, and represent a range of
management alternatives that may be appropriate for the Lemhi
*River. To the extent that it was compatible with the objectives
of the Study, OTT incorporated the management strategy for the
Lemhi River identified in the Draft Idaho Anadromous Fish
Management Plan (IDFG 1984).
Although the four alternatives evaluated are not the only
fisheries management possiblities, this fisheries benefits
analysis is confined to alternatives that would result in Options
A through D having some net beneficial effect. Each alternative
evaluated by OTT assumes that at the time the project is
implemented, the expected 1995 juvenile migrant passage conditions
in the Columbia and Snake Rivers would be achieved. Thus, the
smolt-to-adult survival rate (SAR) for spring chinook is expected
to be 1.5 percent and the SAR for steelhead, 5.19 percent.
The following summaries define the evaluated fisheries management
alternatives..
.MANAGEMENT ALTERNATIVE NO. 1
Using this alternative, chinook salmon runs increase naturally
from the current population level; harvest is delayed until full
habitat seeding is reached: and juvenile migrants are impaired due
to diversion screens and bypasses remaining in their current
condition.
Assumptions:
0 The spring chinook run builds naturally from the current
run size of 330 fish. No harvest is permitted until
full seeding of juvenile rearing habitat is achieved.
5-4

0 A 30-percent and 75-percent reduction in target SAR's
exists in the Lemhi River for spring chinook and
steelhead, respectively, due to the reduction in the
return of adults caused by downstream migrant problems
at screened irrigation diversions.
0 IDFG continues to release an average of 2,000 surplus
hatchery steelhead spawners in the Lemhi River annually.
MANAGEMENT ALTERNATIVE NO. 2
Using this alternative, the chinook run is sustained at current
1evels;a limited harvest is permitted: screen and bypass
impairment continues for juvenile migrants as in Alternative
No. 1.
Assumptions:
0 Spring chinook salmon are harvested at a rate that
maintains an escapement of 330 fish. Thus, full
juvenile rearing habitat seeding is never achieved.
0 A 30-percent and 75-percent reduction in target SAR's
exists in the Lemhi River for spring chinook and
steelhead, respectively, due to the reduction in the
return of adults caused by downstream migrant problems
at screened irrigation diversions.
0 IDFG continues to release an average of 2,000 surplus
hatchery steelhead spawners in the Lemhi River annually.
MANAGEMENT ALTERNATIVE NO. 3
Using this alternative, chinook runs increase naturally from the
current population level: harvest is delayed until full habitat
5-5

seeding is reached; and irrigation diversion screens and bypasses
are improved from their current condition.
Assumptions:
0 The spring chinook run builds naturally from the current
run size of 330 fish. No harvest is permitted until
full seeding of juvenile rearing habitat is achieved.
0 There is a 75 percent basin-wide improvement in
downstream migrant passage conditions at screened
irrigation diversions in the Lemhi River.
0 IDFG continues to release an average of 2,000 Surplus
hatchery steelhead spawners in the Lemhi River annually.
MANAGEMENT ALTERNATIVE NO. 4
Using this alternative, supplemental stocking of chinook fry and
fingerlings occurs for accelerated run building; and the diversion
screens and bypasses are improved.
Assumptions:
0 IDFG provides full hatchery supplementation withoutplanted juvenile chinook salmon to fully seed
available habitat during the first return cycle, but
there is no supplementation thereafter.
0 No harvest occurs until the first chinook salmon return
cycle is completed.
0 There is a 75 percent basin-wide improvement in
downstream migrant passage conditions at screened
irrigation diversions in the Lemhi River.
5-6

0 IDFG continues to release an average of 2,000 surplus
hatchery steelhead spawners in the Lemhi River
annually.
BENEFITS TO THE FISHERY
To determine potential fishery benefits resulting from the four
enhancement options and the associated fishery management alterna-
tives, Buell & Associates, Inc. conducted an assessment of chinook
and steelhead production in the Lemhi River. The following
sections describe the assessment methodology and the application
of the assessment results to develop fishery and economic
benefits. This section is summarized from the Task 3.2 Report
prepared for OTT by Buell & Associates, Inc. (February 1986).
SMOLT PRODUCTION
A detailed stream survey was conducted to quantify and describe
rearing habitat available for juvenile chinook salmon and
steelhead in streams of the Lemhi Basin (Chapter 3). Using the
stream survey data, Buell & Associates made estimates of the
potential for natural production of spring chinook salmon and
summer steelhead smolts in the Lemhi Basin. The estimates
consider both current conditions and those that would prevail
under each of the enhancement options. The estimates are based
upon the quantity and quality of available rearing habitat and
upon probable rearing densities of juvenile fish under fully
seeded conditions.
Data on the capacity of the upper Lemhi River (Reaches 4, 5, and
6) to produce juvenile spring chinook and summer steelhead were
reported by Bjornn (1978). However, estimating the potential for
smolt production in the lower Lemhi River (Reaches 1, 2, 3) is
difficult because:
5-7

0 No data on fish production or fish densities in the
lower Lemhi River are available.
0 The lower Lemhi River has habitat of lower quality than
that found in the upper Lemhi. The quality difference
is due to stream channelization, stream dewatering, and
higher water temperatures. This makes it unreasonable
to apply data on fish production per habitat area in the
upper Lemhi directly to habitat data collected on the
lower Lemhi.
0 No data on fish production or fish densities are
available for streams similar to the lower Lemhi River.
This is because there are few, if any, other streams
which have habitat conditions like those found in the
lower Lemhi.
0 No data are available on the relative longitudinal
distribution of juvenile steelhead or chinook salmon in
the Lemhi River, or among different types of habitat.
The potential for producing spring chinook and summer steelhead
smolts in the lower Lemhi River was estimated through a five-step
process:
1. Data collected during a 14-year study (1962-1975) of
fish production in the upper Lemhi River suggests that
500,000 smolt-sized migrant chinook and 75,000
smolt-sized migrant steelhead can be produced (Bjornn,
pers. comm.). Of these smolt-sized migrants, approxi-
mately 65 percent of the chinook and 67 percent of the
steelhead will overwinter prior to smoltification and
seaward migration. Assuming a 50 percent overwintering .
survival rate for the migrants (Bjornn, pers. comm. ;
Chapman, pers. comm.), the upper Lemhi River has a
5-8

potential to produce 337,500 spring chinook and 49,988
summer steelhead smolts.
2. The total surface area of each habitat type in each
study reach of the Lemhi River and Big Springs Creek was
weighted to account for habitat quality differences
between the reaches. Weights assigned to habitat within
each of the different reaches were based upon
observations made durinq the stream survey and upon
stream temperatures measured during the summer of 1985.
The differences in habitat quality were related to
general trends of declining riparian zone conditions,
increasing water temperatures, and greater streambed
channelization in the downstream direction.
3. Factors used to weight the surface area of each habitat
type in each study reach of the Lemhi River and Big
Springs Creek are presented in Table 5.2. This includes
the factors used for both prevailing (Options A and C)
and enhanced (Options B and D) stream flow conditions.
The factor for Reach 1 (lower Lemhi River) increased
with enhancement to account for a decrease in water
temperatures expected to result. Better stream
temperature data than are presently available would
allow the development of more accurate weighting
factors.
4. The potential for smolt production in the upper Lemhi
River was apportioned to the weighted surface areas of
each habitat type using information on the relative
distribution of juvenile chinook salmon and summer
steelhead within Idaho streams (Table 5.3). This was
done to estimate the number of smolts produced per
weiqhted unit area of each habitat type.
5-9

REACH QUALITY HABITAT CONDITIONS
1 Lower Lemhi
2 Lower Lemhi
3 Lower Lemhi
4 Upper Lemhi
5 Upper Lemhi
6 Big Springs Cr.
TABLE 5.2
HABITAT QUALITY WEIGHTING FACTORS
Poor: extensive channelizationMax. summer temp. (1985) = 21.5°C
Generally fair; extensive channelizationMax. summer temp. (1985) = 21°C
Fair; moderate channelizationMax. summer temp. (1985) = 17°C
Good: minor channelizationMax. summer temp. (1985) = 19°C
Generally excellentMax. summer temp. (1985) = 17°C
Generally excellent
WEIGHTING FACTOR
Prevailinq Enhanced
l/4 l/3
l/3 l/3
l/2 l/2
3/4 3/4
l/l l/l
l/l l/l

TABLE 5.3
JUVENILE FISH DENSITIES BY HABITAT TYPE
Fish Densities (#/sq yd)
HABITATTYPE
Pool
Riffle
Run
Pocketwater
Sidechannel
Backwater
AGE 0+ CHINOOK AGE l+ STEELHEAD
0.325 0.275
0.078 0.077
0.086 0.116
0.132 0.209
0.110 0.102
4.625 0.075
5-11
5. The potential for smolt production in the lower Lemhi
River was calculated as the sum of the number which can
be produced by the weighted surface area of each of the
six habitat types. The estimated potential for spring
chinook salmon and summer steelhead smolt production in
the lower Lemhi River is given in Table 5.4. Table 5.4
also gives estimates for the upper Lemhi River and for
Hayden Creek.
The Hayden Creek estimates in Table 5.4 are based on a
direct application of the juvenile fish densities
indicated in Table 5.3 to the surface areas of rearing
habitat. The predicted potentials for production of age
l+ steelhead and age 0+ chinook were adjusted with a
SO- percent overwinter survival rate to yield the smolt
production figures given.
SPRING CHINOOK
Under current conditions, the Lemhi Basin is estimated to be
capable of producing 483,528 spring chinook smolts. Given a ratio
of 1,852 eggs per escaping spawner, and an average egg-to-smolt
survival rate of 6.89 percent (Bjornn, 1978), an escapement of
3,789 spring chinook spawners is needed to fully seed available
rearing habitat in the basin. This reflects a required
smolt-to-adult return rate (SAR) of 0.784 percent in order to
maintain the run size if all returning adults escape to spawn.
For enhancement options providing stream flow supplementation
(B and D), it is estimated that rearing habitat in the Lemhi Basin
will be capable of producing 505,223 spring chinook smolts. Using
the same eggs per escaping spawner and egg-to-smolt rates
previously noted, an escapement of 3,959 adult spring chinook will
be needed to fully seed the available habitat. The same minimum
SAR as that for prevailing conditions (0.384 percent) would be .
5-12

REACHSPRING CHINOOK SUMMER STEELHEAD
SMOLTS SMOLTSPrevailing Enhanced Prevailing EnhancedConditions* Conditions** Conditions* Conditions**
UPPER LEMHI(Reaches 4, 5 and 6)
Reach 3
Reach 2Yt; Reach 1
LOWER LEMHI TOTAL
337,500 337,500 49,988 49,988
33,999 33,999 5,624 5,624
60,105 60,105 10,173 10,173
38,741 60,436 5,260 6,786
132,845 154,540 21,057 22,583
HAYDEN CREEK 13,183 13,183 16,690 16,690
TOTAL 483,528 505,223 87,735 89,260
TABLE 5.4
POTENTIAL CHINOOK AND STEELHEAD SMOLT PRODUCTION
* Options A and C continue prevailing stream flow conditions.
** Options B and D enhance stream flows.

required to maintain a run under enhanced stream flows provided
that all returning adults escape to spawn.
A SAR, without harvest, of about 1.5 percent for Snake River
stocks of spring chinook is hoped for by 1995. The Draft
Anadromous Fish Management Plan for the State of Idaho (IDFG 1984)
calls for a SAR without harvest of 1.6 percent. Both of these
future rates are optimistic and may not be realized for some time.
The production benefits analysis for sprinq chinook presented in
this report assumes that the 1995 target SAR of 1.5 percent has
been achieved at the time of project implementation.
Fisheries Manaqement Alternatives Nos. 1 and 2
The SAR for the Lemhi River stock of spring chinook may be
substantially lower than the SAR generalized for spring chinook in
Idaho. A 30-percent lower SAR has been hypothesized for Lemhi
River spring chinook to account for the current reduction in
returns of adults caused by delays of downstream migrants at
screened irrigation diversions along the Lemhi River (Management
Alternatives Nos. 1 and 2).
Table 5.5 gives projected values for the annual harvest of chinook
salmon for Management Alternative No. 1. It also gives the
estimated harvest providing a small but stable run size at the
prevailing escapement of 330 fish in relation to the productive
capacity of the basin (Management Alternative No. 2). The number
of return cycles required to reach full seedinq if no harvest is
allowed during that run-building period is listed. In addition,
the allowable harvest of adults, after available rearing habitat
in the Lemhi Basin has become fully seeded with spring chinook, is
given. Information for both current conditions and for each of
the enhancement options is provided in the table.
5-14

APPENDIX B
TOPOGRAPHIC LOCATIONAL MAPS

LEGEND - APPENDIX B
LOC#
LM#
=
=
a-. =
p- =
@-- =
=
Ott Water Engineers, Inc. FLow Measurement
Stations
Lemhi Irrigation District Flow Measurement
Station
Diversion Number and Location
Reference Number for Critical Passage Sites
Chosen for Diversion Structures and
Channelization
Reference Number for Critical Passage Sites
Chosen for Channelization Only
Location of Noted Structures

Option
Current
cfConditions
L A
B
C
D
1995 TargetSAR if NoDownstremMigrationImpairmentat ScreenedIrrigationDivers ions
1.5%
1.5%
1.5%
1.5%
1.5%
SmoltsProducedat FullSeedinq
483,528
483,528
505,223
483,528
505,223
TABLE 5.5
ANNUAL HARVEST
SAR with (30%)Downs treamMigrationImpairmentat ScreenedIrrigationDiversions*
1.05%
1.05%
1.05%
1.05%
1.05%
SAR = Smolt-to-adult return rate.
* Fisheries Management Alternatives Nos.
Annual AdultHarvestProvidingStableRun Sizeof 330 Fish**
112
112
112
112
112
1 and 2.** Management Alternative No. 2 only.*** Management Alternative No. 1 only; 10th return cycle,
AdultReturn CyclesRequiredTo ReachFull Seeding***
10
10
10
10
10
i.e., year 46.
AllowableAnnualHarvest AfterFull Seedingis Reached***
1,286
1,296
1,344
1,286
1,344

The values given in Table 5.5 are based on a simplified model of
conditions affecting the Lemhi stock of spring chinook. The model
used to calculate the fish numbers given in Table 5.5 assumes:.
0 A 30-percent reduction in SAR due to the effects of
screened irrigation diversions on outmigrant smolts in
the Lemhi River.
0 The annual SAR's are constant.
0 All adults return at the same age.
0 No upstream passage problems present an impairment to
returning adults.
0 The fishery responds instantaneously to harvested fish
in excess of those necessary to fully seed the available
rearing habitat.
A simple model of the reductions in chinook spawner success
resulting from differing degrees of unfavorable upstream passage
conditions is presented in Table 5.6. Numbers of fish given in
the table are based upon the same run sizes for each return cycle
as those in Table 5.5. The numbers assume a 1.05 percent SAR,
which accounts for a 30-percent reduction in adult returns due to
delays of downstream migrant smolts at screened irrigation
diversions along the Lemhi River.
The model represented by Table 5.6 also assumes:
0 The annual SAR's are constant.
0 All adults return at the same age.
5-l 6

TABLE 5.6
EFFECT OF PASSAGE CONDITIONS ON SPRING CHINOOK SALMON
HypothesizedReductionin SpawnerSuccess Dueto PoorUpstreamPassageConditions*
10%
25%
50%
Reduction in Number of Successful Spawnersif Unfavorable Upstream Passage Conditions
Develop During Return Cycle
Return Cycle
1 2 3 4 5 6 7 8 9 >9---m----m-
33 44 59 79 106 142 191 255 342 379
83 111 148 199 266 356 477 638 854 947
165 221 297 397 532 712 953 1276 1709 1895
l These conditions would be experienced 2/9 years without passageimprovement, l/7 years under Options A and C, and l/13 yearsunder Options B and D.

0 Reductions in spawner success during years of poor
upstream passage conditions are not reflected by the ,
number of adults returning from the progeny year class.
0 The fishery responds instantaneously to harvest fish in
excess of those necessary to fully seed availablerearing habitat.
0 The fishery does not harvest fish which are not in
excess of those necessary to at least replace the parent
run.
Tables 5.5 and 5.6 can be used in concert to estimate the benefit
of improved adult fish passage and rearing conditions (assuming
there is continued impairment of downstream migrants at the
screened diversions) under each of the four enhancement options.
The benefit to the fishery of each option is reflected in the
harvest that would have been lost due to poor passage conditions .
without passage improvement.
Fisheries Management Alternatives 3 and 4
Management Alternatives 3 and 4 address potential improvements in
downstream migration conditions in the Lemhi River associated with
irrigation diversion screens. If outmigrant delays and direct
losses associated with irrigation diversion screening facilities
were reduced significantly, there would be an increase in the
smolt-to-adult return rate which would result in faster run
building and a greater harvestable surplus of adult fish. The
rationale for the assumption that outmigration conditions could
improve is based on a cooperative agreement between IDFG and NMFS
to install new screening systems at selected diversions. It is
not known how much improvement in outmigrant success would accrue
from fixing or replacing selected diversion screens. For the two
management alternative management evaluations, however, it was
5-18

arbitrarily decided that the outmigrant success rate could be
improved so that 75 percent of the assumed outmigrant losses would
be eliminated on a basin-wide basis. Thus, the hypothetical
Lemhi River outmigrant success rate for spring chinook would
change from 70 percent to 92.5 percent. For summer steelhead the
rate would change from 25 percent to 81.25 percent. It is
important to note however, that elimination of 75 percent of the
outmigrant loss and delay problem, by fixing or replacing some
selected screens, may not be an attainable goal: furthermore, it
may be prohibitively expensive. Nevertheless, some assumption had
to be made to demonstrate the nature of the changes in benefits
attibutable to Options A through D resulting from improved screens
and bypass systems.
With the improvement in downstream migrant survival discussed
above, the Lemhi River SAR for spring chinook would be 1.39
percent; the SAR for summer steelhead would be 4.22 percent. As a
result of these increased survival rates, the anadromous salmonid
runs in the Lemhi River would be able to sustain themselves
without hatchery supplementation.
Fishery benefits for each of the four enhancement Options A
through D, were projected for one chinook salmon hatchery
supplementation strategy. Management Alternative No. 3 is a
continuation of current IDFG activities described previously and
involves no hatchery supplementation of the spring chinook run.
Management Alternative No. 4 maximizes the value of naturally
returning adult chinook, thus increasing the benefits attributable
to implementation of the enhancement options. It does this by
bringing the Lemhi runs of spring chinook up to full strength as
rapidly as possible through intensive hatchery supplementation.
Once full run strength is attained, the run depends entirely upon
naturally returning adults to seed the system. This strategy
would require a chinook fry, fingerling, or smolt outplanting
program during (and only during) the first adult return cycle
following project implementation.
5-19

Manaqement Alternative No. 3
In order to determine the rate of run building and harvestable
surplus after full run strength is developed (assuming improvement
in downstream migration conditions), Tables 5.7 and 5.8 were
constructed. These tables are analogous to Table 5.5 and 5.6.
Table 5.7 presents the harvestable surplus with and withoutimplementation of Options A through D under good upstream
migration conditions. Table 5.8 presents the harvestable surplus
with and without implementation of the options under impairedupstream migration conditions. Both these tables assume nosupplementation of the natural chinook run with hatchery juveniles
or adults.
Fishery benefits projected for each of the four enhancementoptions are:
options A, C - +100.24 adults harvested/yr (yrs 26-50)
Options B, D - +6.19 adults harvested/yr (yrs 26-30)
+309.19 adults harvested/yr (yrs 31-50)
The increases in harvested adults for Options A and C are derived
by multiplying the difference in frequency of occurrence for run
impairment (with and without project implementation) by the
reduction in harvest that would be produced by impairment. Theincreases in harvested adults for Options B and D are derived by
adding increases due to increased rearing habitat (provided by
those options) to the benefits produced by Options A and C..
Management Alternative No. 4
Tables 5.9 and 5.10 estimate the increased spring chinook harvest .
derived from implementation of each of the enhancement options
under Management Alternative No. 4. The estimates assume full
5-20

TABLE 5.7
ANNUAL HARVEST OF CHINOOK SALMON BY RETURN CYCLE DURING
FAVORABLE ADULT PASSAGE CONDITIONS
SmoltsProducedat Full
Option Seeding
No Project 483,528
A, C 483,528
B, D 505,223
SAR if CurrentDownstream MigrationConditions in theLemhi River areImproved 75 Percent
1.39%
1.39%
1.39%
Return Cycle
1 2 3 4 5 6 >6- - - - - - -
B B B B PI 1794 2918
v g 9 g g 1794 2918
B 9 B b B 1621 3048
Note: The figures given here assume no hatchery supplementation of the chinook population.

TABLE 5.8
REDUCTION IN ANNUAL HARVEST WHEN UNFAVORABLE ADULT PASSAGE CONDITIONS DEVELOP
HyposthesizedReductionin SpawnerSuccess Option
Return CycleFrequencyof Problem 1 2 3 4 5 6 >6- p - - p - -
25% No Project 2/9 years 0 0 0 0 0 1263 1263
A, C l/7 year 0 0 0 0 0 1263 1263
B, D l/13 years 0 0 0 0 0 1320 1320
Note: The figures given here assume a 75 percentconditions
improvement of downstream migrationin the Lemhi River and no hatchery supplementation of the chinook
population.

TABLE 5.9
ANNUAL HARVEST OF CHINOOK SALMON BY RETURN CYCLE DURING
FAVORABLE ADULT PASSAGE CONDITIONS
SAR if CurrentDownstreamMigration
Smolts Conditions inProduced the Lemhi River Return Cycle Increasedat Full are Improved Annual Harvest
Option Seeding 75 Percent 1 >l Due to Project
No Project 483,528 1.39% pl 2918 PI
A, C 483,528 1.39% 0 2918 0
B, D 505,223 1.39% B 3048 130
Note: The figures given here assume hatchery supplementation during the first return cyclewhich fully seeds available rearing habitat with juvenile salmon. Full run strengthis realized during the second return cycle.

TABLE 5.10
REDUCTION IN ANNUAL HARVEST WHEN
UNFAVORABLE ADULT PASSAGE CONDITIONS DEVELOP
HypothesizedReduction inSpawner SuccessDue to Poor Return CycleUpstream PassageConditions Option 1 >l
25% No Project B 1263
A, C u 1263
B, D B 1320
Note: The figures given here assume full seeding of availablerearing habitat during the first return cycle as aconsequence of hatchery supplementation.
5-24

hatchery supplementation of the run for one adult return cycle.
Outplanted juveniles would be used to supplement and fully seed
available rearing habitat during the first return cycle, but there
would be no supplementation thereafter. Tables 5.9 and 5.10 are
analogous to Tables 5.5 and 5.6. The benefits projected for each
of the four options are:
Options A, C - +100.24 adults harvested/yr (yrs 6-50)
Options B, D - +309.19 adults harvested/yr (yrs 6-50)
STEELHEAD
Under current conditions, the Lemhi Basin is estimated to have the
capacity to produce 87,735 summer steelhead smolts. Assuming
survival rates of 50 percent for the egg-to-fry stage, and 1.93
percent for the fry-to-smolt stage, 104 steelhead eggs must be
deposited per smolt produced. Given an average fecundity of 5,500
eggs per female spawner and a spawning escapement in the Lemhi
River, which averages 64 percent females (Bjornn, 1978), 3,520
steelhead eggs will be deposited per returning steelhead spawner
(both sexes). This means each returning spawner represents the
production of approximately 34 smolts in the progeny year class of
summer steelhead. It also indicates that:
0 A spawning escapement of 2,583 summer steelhead is
necessary in order to get full production of 87,735
smolts from the basin.
0 A smolt-to-adult return rate of 2.94 percent, without
harvest, is needed to maintain the run.
For the enhancement options that provide stream flow augmentation
(B and d),, it is estimated that the Lemhi Basin will be capable of
producing 89,260 smolts. Given the SAR required for run
5-25

maintenance without harvest (2.94 percent), it is projected that
an escapement of at least 2,628 adult steelhead will be needed to
fully seed available rearing habitat in the Lemhi under Options B
and D.
The historical SAR for summer steelhead produced in Idaho streams
was about 5.0 percent (Raymond, 1980). This rate has been
substantially reduced by fish losses related to hydroelectric dams
on the Columbia and Snake Rivers. However, recent improvements in
the survival rates of steelhead migrant passage through the Snake
and Columbia Rivers have raised the hope that, for Idaho stocks,
SAR's may attain the historical condition. These hopes are
optimistic, but lacking better information on the future SAR's for
Idaho steelhead, a target SAR of 5.19 percent, without harvest, isused in this analysis of project benefits (USACE, 1985).
Manaqement Alternative Nos. 1 and 2
The SAR for steelhead in the Lemhi Basin is presently lower than
the SAR generalized for all summer steelhead in Idaho. One study
suggests that returns of adult steelhead to the Lemhi Basin might
be reduced by as much as 90 percent. This is caused by delays of
downstream migrating smolts at screened irrigation diversions
along the Lemhi River (Bjornn, pers. comm,). Given this reduction
in downstream migrant success and subsequent adult returns, the
anticipated SAR for Idaho's steelhead (5.19 percent) was reduced
by 75 percent (to 1.30 percent). It was then applied to Lemhi
Basin steelhead to account for the effects of downstream migrant
delays taking place at irrigation diversions. The 75-percent
reduction of the SAR is a generous assumption in the steelhead
production model.
The analysis presented here indicates that sustained natural
production of steelhead in the Lemhi Basin is not possible under
current conditions, or the enhanced conditions of Options A .
5-26

through D. In recent years, IDFG has supplemented the annual run
with the release of large numbers of excess hatchery spawners.
The SAR required for run maintenance (estimated at 2.94 percent)
has not been realized for many years and is not expected in the
future, either under prevailing conditions or the proposed
enhancement options, assuming Management Alternatives Nos. 1 or 2
are implemented. For the purposes of this benefits analysis, it
is assumed that the IDFG will continue to release an average of2,000 surplus hatchery spawners (1982-1984 average) of two femalesper male into the Lemhi Basin to maintain the run of steelheadreturning to the river each year.
Table 5.11 gives estimates of the annual natural adult return and
allowable harvest of summer steelhead in the Lemhi Basin, with andwithout annual supplementation of hatchery spawners, for currentand enhanced conditions.
The numbers in Table 5.11 assume:
0
0
0
0
0
0
A 75-percent reduction in SAR from 5.19 to 1.30 due to
the effects of screened irrigation diversions ondownstream migrants in the Lemhi River.
Rearing habitat is fully seeded.
The spawning run (with supplementation) is at full
strength.
No improvement in downstream passage conditions as aconsequence of habitat enhancement.
The annual SAR is constant.
All upstream passage problems have theoretically been
solved.
5-27

Option
CurrentConditions
A
TABLE 5.11
STEELHEAD RETURNS AND HARVESTABLE ADULTS
FOR FISHERIES MANAGEMENT ALTERNATIVES NOS. 1 AND 2
SmoltsProducedat FullSeeding
87,735
ReturningAdults
EL*
1.30%
NaturalAdultReturn
1,141
87,735 1.30% 1,141
89,260 1.30% 1,160
87,735 1.30% 1,141
89,260 1.30% 1,160
AnnualHarvestableSurplusWithout HatcherySupplements
AnnualHarvestableSurplus withOutplantings of2,000 Spawners
641
AnnualHarvest inExcess ofCurrentConditions
%
641 %
615 -26
641 %
615 -26
* Assumes no benefit to downstream migrant smolts as a consequence of enhancement.
. .

0 The fishery responds instantaneously to harvest fish in
excess of those necessary to fully seed available
rearing habitat.
0 Only fish in excess of those necessary to fully seed
available habitat are harvested.
The allowable harvests given in Table 5.11 indicate that there
will be no surplus of spawners for harvest unless the spawning
run is supplemented each year with excess hatchery spawners. The
figures assume that naturally-returning adult steelhead are those
harvested while all planted hatchery spawners are allowed to
escape. This means the natural stock is being continually
replaced with hatchery fish under the hatchery supplementation
scenario. This may not be a good situation biologically, but it
allows the greatest harvest of adult steelhead, and thus the
greatest benefit to the fishery in the short term.
When flow is added to the lower Lemhi River under Options B and D,
the allowable harvest is reduced. This occurs because the natural
run is not replacing itself. These options use more of the
naturally-returning adults to fully seed available habitat than
those project options not increasing stream flow in the Lemhi
River.
Table 5.12 presents a simple model of the effect of poor upstream
passage conditions for fish in the Lemhi River under prevailing
and proposed conditions. The model presented is based upon the
same assumptions as those used to develop the fish numbers
presented in Table 5.11, with the exception that upstream passage
is assumed to reduce adult escapements, and thus reduce the
allowable harvest of fish during certain years. Table 5.12
presents losses of adults attempting to return to the spawning
grounds, and consequent reductions in the allowable harvest. The
losses presented in Table 5.12 would not occur annually, but at
the frequencies of low flows discussed in Chapter 3.
5-29

TABLE 5.12
EFFECT OF PASSAGE CONDITIONS
PredictedFrequencyof PoorPassageConditions(Yrs/Yrs)
Reduction inHarvestableWults withPlants of2,000Spawners
HarvestWithPlantsof 2,000Spawners
585474141
HarvestableAdultswithoutHatcheryPlants
Hypothesized Reductionin Spawner SuccessDue to Poor UpstreanPassage Conditions (%)
NaturalReturn ofAdults
1,141
Option
CurrentConditions
v1I% A
102550
56167500
2/9 B
102550
585 56474 167141 500
l/7 1,141
102550
554 61433 18270 545
l/13 1,160 prB
102550
585 56474 167141 500
C 1,141 la
102550
554 61433 18270 545
D l/13 1,160 B

Tables 5.11 and 5.12 were used in concert to estimate the benefits
of improved fish passage and rearing conditions, with downstream
migration impairment, under each of the enhancement options. The
estimates were made in the same fashion as those for spring
chinook using Tables 5.5 and 5.6.
Management Alternative Nos. 3 and 4
These two fisheries management alternatives include a 75 percent
basin-wide improvement to the fish screening and bypass facilities
on the Lemhi River. Table 5.13 and 5.14 present the increased
summer steelhead harvests derived from implementation of each of
the enhancement options in the presence of improved downstream
migration conditions. Results depend on IDFG continuing to
release 2,000 surplus hatchery spawners in the Lemhi River each
year. The two tables are analogous to Tables 5.11 and 5.12
presented previously. Fishery benefits projected for each of the
four options are:
Options A, C - +13.25 adults harvested/yr (yrs 3-50)
Options B, D - +43.11 adults harvested/yr (yrs 3-50)
These changes in annual harvest were determined in the same way as
those for chinook salmon.
ECONOMIC BENEFITS
The economic benefits of implementing each of the enhancement
options were computed using standard economic analysis techniques.
It is emphasized that benefit/cost analyses are only one tool
available to decision makers in evaluating the merits of a
proposed project. The implementation of measures to mitigate,
restore, or enhance the Columbia Basin anadromous fishery does not
require a favorable benefit/cost determination (P.L. 96-501).
5-31

ylIWN
TABLE 5.13
ANNUAL STEELHEAD HARVEST DURING FAVORABLE ADULT PASSAGE CONDITIONS
SAR if CurrentSmolts Downstream Migration IncreasedProduced Conditions in the Annual Annualat Full Lemhi River are Adult Adult Fish Harvest Due
Option Seeding Improved 75 Percent Return Harvested to Project
No Project 87,735 4.22% 3702 1119 g
A, C 87,735 4.22% 3702 1119 %
B, D 89,260 4.22% 3767 1139 20
--
Note: The figures given here assume an annual planting of 2,000 surplus hatchery spawnersand a 75 percent improvement of downstream passage conditions in the Lemhi River.

Option
No Project
A, C
B, D
TABLE 5.14
REDUCTION IN ANNUAL STEELHEAD HARVEST WHEN UNFAVORABLEADULT PASSAGE CONDITIONS DEVELOP
in SpawnerSuccess Due to PoorUnstreamPassageconditions
PredictedFrequency ofPoor PassageConditions(Yrs/Yrs)
Adults
i!iE;z2AvailableRearing Area
NaturalReturnof Adults
25% 2/9 2583 3702
25% l/7 2583 3702
25% l/13 2628 3767
Harvest withPlants of 2,000 SurplusHatcherySpawners
3035
3035
3040
Reductionin Harvestwith Plantsof 2,000HatcherySpawners
167
167
182
Note: The figures ginen here assume an annual planting of 2,000 surplus hatchery spawnersand a 75 percent improvement of downstream passage conditions in the Lemhi River.

However, the goal of achieving sound biological objectives at
minimum economic cost is recognized by that legislation.
The analysis of economic benefits for implementing the options
analyzed for improving anadromous fish production in the Lemhi
River Basin is based on the projected increase in anadromous fish
harvest each option would produce. All of the various options
analyzed would improve upstream migration conditions for adult
spawners in certain years. Two of the four options, B and D,
would increase available juvenile rearing habitat in all years.
Based upon stream flow availability, the effects on harvestable
adult fish due to Options A and C are identical, and the effects
of Options B and D are identical (Table 5.1). Therefore, the
analysis of economic benefits of implementation considers A and C
together, and B and D together.
The benefits of anadromous fish enhancement projects are measured
by the number of adult fish available to the combined sport and
commercial fishery, and to the values attributed to harvested l
fish. The numbers of fish available to the combined fishery
(increase in harvestable surplus) were previously given for each
set of options developed.
The economic values ascribed by economists to fish taken in
various components of the combined fishery vary widely, depending
on available data and the sets of assumptions employed. In the
case of upriver anadromous fish stocks, the goal of the Northwest
Power Planning Council's Fish and Wildlife Program is to restore
production levels. This suggests that compensatory values be
used. The Economic and Environmental Principals and Guidelines
for Water and Related Land Resources Implementation Studies
acknowledges the lack of reliable empirical methods for evaluating
the willingness to accept compensation for losses. That document .indicates enhancement values be used for both losses and gains.
Values based on willingness to pay (enhancement values) and ,
5-34

willingness to sell (compensatory values), attributed by variouseconomists to Idaho steelhead trout and chinook salmon, werereviewed by McKern (pers. comm.) and discussed by the USACE(1985). Enhancement values are used for sport-caught fish andcompensation values are used for commercially-caught fish in thisanalysis. Values for each stock, each segment of the fishery, andthe combined values (adjusted for inflation) are tabulated below:
Stock $/Fish % of Catch Combined $
Spring chinook (sport) 125.00 57 89.36Spring chinook (commercial) 42.12 43Summer steelhead (sport) 75.00 82 65.43Summer steelhead (commercial) 21.81 18
The discount rate used in this analysis is three percent. This isthe risk-free rate of time preference specified by the Bonneville
Power Administration for use in analyses such as this. Reasonsfor this rate include, among others, the balance of risk or
uncertainty associated with various components of the analysis,and the level of institutional and public concern for the futureof anadromous fish runs in the region. The project life is set at50 years.
The economic analysis of benefits for implementing Options A-D isrelatively straight forward for any effects which are continuousafter implementation, or change at a constant rate over time. Theincrease in available rearing habitat for juvenile salmon andsteelhead projected by Options B and D is such an effect.However, relief from impaired upstream passage of adult fish is
not such an effect. Instead, the effect of implementing various
options is to increase the size of the recurrence interval(decrease the probability of occurrence) for upstream passageimpairment. In this case, the monetary benefits of implementingan option must be adjusted according to the probability of
5-35
occurrence of adult passage impairment due to flow. Probabilities
of the occurrence of upstream adult migration impairment
associated with present conditions, and with each of the options
evaluated are:
Existing Conditions P = 0.222
Options A, C P = 0.143
Options B, D P = 0.0769
The benefits of implementing various options arise primarily from
the avoidance of upstream passage impairment. Whenever this event
occurs, the fishery must forego the harvest of those fish needed
to e n s u r e sufficient seeding of the Lemhi Basin in spite of
passage problems. To the extent that passage problems are
avoided, the combined fishery can realize its normal harvest. The
benefit is in terms of an avoided cost.
The cost of each occurrence of upstream passage impairment is the
product of the number of fish which could have been harvested,
under unimpaired passage conditions, and the combined value per
fish for that stock. This product is termed the occurrence cost.
The product of the occurrence cost and the probability of
occurrence is the expected annual cost of passage impairment. The
present worth of passage impairment over the project lifetime is
determined by calculating the present worth of the expected annual
cost of passage impairment over that time period as a uniform
annual series. Naturally, these values are negative and represent
economic losses. The economic benefit of implementating an option
is the difference between the present value of passage impairment
(loss) under existing conditions, and the value projected for
conditions following implementation.
Table 5.15 summarizes the economic benefits of implementing the ,
four options over a project lifetime of 50 years. Benefits are
calculated separately for summer steelhead and spring chinook ,
5-36
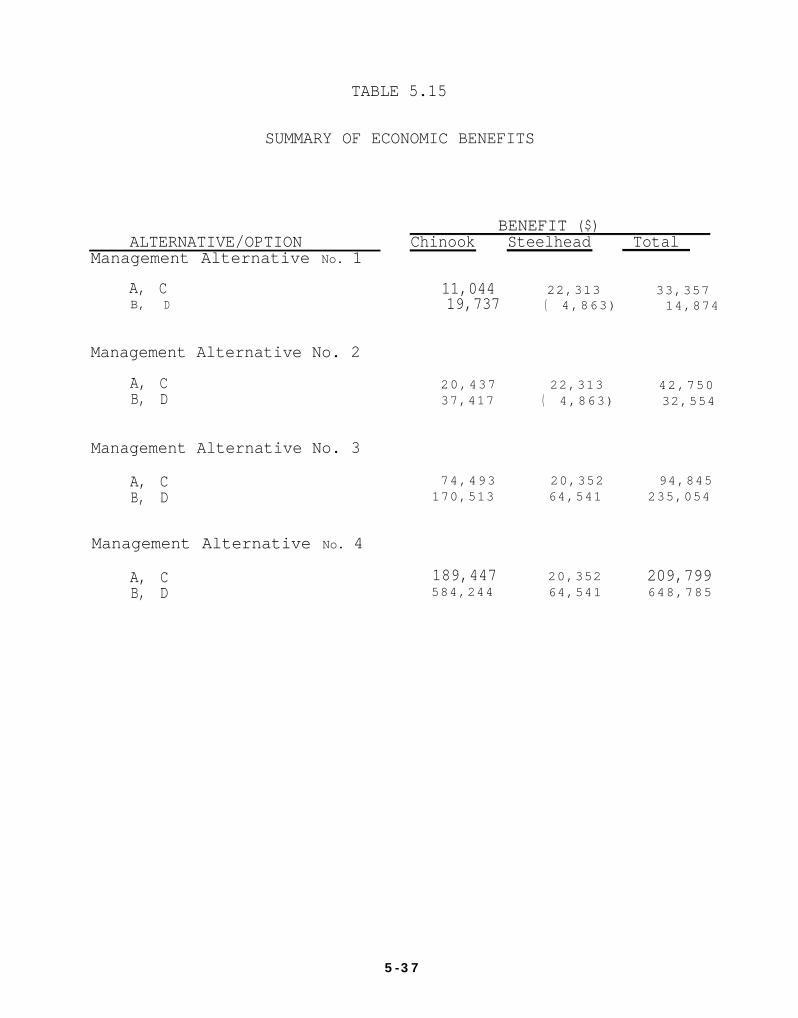
TABLE 5.15
SUMMARY OF ECONOMIC BENEFITS
BENEFIT ($)ALTERNATIVE/OPTION Chinook Steelhead Total
Management Alternative No. 1
A, C 11,044 22,313 33,357B, D 19,737 ( 4,863) 14,874
Management Alternative No. 2
A, C 20,437 22,313 42,750B, D 37,417 ( 4,863) 32,554
Management Alternative No. 3
A, C 74,493 20,352 94,845
B, D 170,513 64,541 235,054
Management Alternative No. 4
A, C 189,447 20,352 209,799B, D 584,244 64,541 648,785
5-37

salmon. The negative benefit for steelhead, with Management
Alternatives Nos. 1 and 2, represents the loss to the fishery of
26 fish annually needed to escape harvest and seed the extra
habitat provided by Options B and D. This occurs only because the
run is supplemented with a fixed number of hatchery spawners
(i.e., 2,000). If the run was supplemented with 2,026 hatchery
spawners, or self-sustaining with even a small harvestable
surplus, the negative benefit would disappear as with Management
Alternatives Nos. 3 and 4.
This analysis of project benefits assumes improved passage
conditions both upstream and downstream, throughout the Columbia
and Snake River systems. It reflects the aims of the Northwest
Power Planning Council's Fish and Wildlife Program, and the
proposed long-term salmon and steelhead production and harvest
goals of the State of Idaho. Thus, the calculated benefits of
implementing project options are contingent on the improvement of
mainstem passage conditions and, in the case of Management
Alternatives Nos. 3 and 4, improving downstream migrant success at
irrigation diversion screens and bypasses on the Lemhi River.
Analyses of project benefits derived from Management Alternatives
Nos. 3 and 4 are particularly important. They show the beneficial
effect that improved downstream passage conditions at irrigation
screening facilities in the Lemhi River will have on the run of
anadromous fish. By assuming a 75 percent reduction in the losses
and delays at screening facilities, some of the projected project
benefits become substantial, particularly for Options B and D
where the fish are managed for the maximum natural run.
Other factors regarding the Lemhi River and the future of its
anadromous fish stocks need to be considered. IDFG has recently
indicated it may manage the Lemhi River fish runs as hatchery-
supplemented runs on a continuing basis, rather than on the
short-term basis assumed in Management Alternative No. 4
5-38

(Holubetz, pers. comm., January 1986). Specifically, the juvenile
population of chinook salmon would be supplemented with hatchery
fingerlings or fry to achieve full seeding whenever adult
escapement is below that necessary for full natural seeding. In
addition, 550,00 chinook smolts would be outplanted to the upper
watershed each year to imprint then migrate. The adult fishery
would be targeted on hatchery fish, not naturally-reproduced fish.
The harvest rate is expected to range between 5 and 20 percent of
the adults returning as far as the mouth of the Lemhi River, with
other river and ocean harvests added in. This management scenario
could result in a consistent over-harvest of naturally reproducing
adults, but the commitment by IDFG to seed the Lemhi River with
hatchery fry or fingerlings is intended to keep adult returns high
enough for a significant harvestable surplus.
Such a management program would have significant implications for
the enhancement options evaluated by OTT. The commitment to seed
with hatchery fry or fingerlings and the outplanting of 550,000
smolts per year would eliminate the necessity for correction of
upstream migration impairment. Downstream migration problems are
to be addressed by NMFS. The only benefit to the Lemhi River
salmon and steelhead stocks from the enhancement options would be
increased rearing habitat provided by Options B and D. These
benefits would be marginal in the face of the proposed smolt
outplanting program. Thus, if IDFG implements the full-scale
hatchery supplementation program as described, then the options
evaluated by OTT should be considered alternatives to the
supplementation program, not an adjunct to it.
5-39

CHAPTER 6
BENEFIT/COST ANALYSIS
The objective of a benefit/cost analysis is to determine the
economic merits of a project. When the benefits and costs of the
project are determined on a consistent present worth basis, and
the benefits are greater than the costs (a B/C ratio greater than
1.01, the project is considered "in the public interest" and
therefore economically justified. It is important to emphasize
that a B/C ratio greater than 1.0 is not required for implemen-
tation of Fish and Wildlife Program projects, such as the Lemhi
River Habitat Improvement Program.
BENEFITS
Benefits of implementing any of the four enhancement options are
assumed to result from harvests of adult salmon and steelhead that
would have been lost under existing conditions in the Lemhi. It
is estimated that low flows in the Lemhi cause a loss of
harvestable fish at a recurrence interval of two in nine yearsunder existing conditions. Implementation of Options A or C would
increase this recurrence interval to one in seven years, and
implementation of Options B or D would increase it to one in
thirteen years. Benefits of the four options are the difference
between harvest lost under existing conditions, and harvest lost
under the various options.
CHINOOK
Four fisheries management alternatives are presented in Chapter 5for chinook salmon. The first alternatve involves no harvest of
fish until the run has fully seeded the available habitat, inapproximately 46 years. Then benefits begin to accrue as
6-l

discussed above. The second alternative involves a harvest of
112 fish per year and the maintenance of a small but stable run of
330 fish. Alternatives 1 and 2 do not require improvements to the
irrigation diversion screens or bypasses from prevailing
conditions. The third alternative is identical to the first
except that the screens and bypasses are improved. The fourth
alternative incorporates the third alternative plus supplements
juvenile fish production to immediately restore the fish runs to
their maximum capacity. These four alternatives will result in a
different B/C ratio for each. Chinook benefits resulting from the
proposed options are presented in Chapter 5.
STEELHEAD
Project benefits derived from steelhead are based on a loss of
harvestable fish due to upstream passage conditions. Unlike
chinook, only one management program is considered. It is assumed
that IDFG will continue to stock 2,000 surplus hatchery spawners
annually in the Lemhi. The benefit of this program under the four
enhancement options are evaluated. Steelhead benefits and the
harvest scenario are presented in Chapter 5.
COSTS
The cost of implementing the four options was determined, and
costs were separated into capital and annual costs and are
presented in Table 6.1.
PRESENT WORTH ANALYSIS
In Chapter 5, the present worth of benefits for chinook and
steelhead were determined assuming a three percent discount rate
and a SO-year project life. The same assumptions are used to
calculate the present worth of annual costs for the four options.
6-2

TABLE 6.1
CAPITAL AND ANNUAL COSTS FOR OPTIONS A, B, C, AND D
OPTION
A
B
C
D
($) ($)CAPITAL COST ANNUAL COST
1,386,000 11,300
1,734,000 11,300
4,219,000 42,900
4,567,000 42,900
6 - 3

Table 6.2 presents the capital costs, present worth of annual
costs, and present worth of benefits for the four options for each
of the four fisheries management alternatives.
BENEFIT/COST RATIOS
In Table 6.2 the total cost of the four options and the present
worth of benefits are given in columns 5 and 6, respectively. The
B/C ratios for the various options, under the four fisheries
management alternatives, are computed by dividing the value in
column 6 by the value in column 5. The results are presented in
Table 6.3.
6-4

FISHERIES
TABLE 6.2
COSTS AND BENEFITS OF THE FOUR ENHANCEMENT OPTIONS
ALTERNATIVE OPTION
1 ABCD
A 1,386,000 290,700 1,677,OOO 42,800B 1,734,000 290,700 2,025,000 32,600C 4,219,000 1,104,000 5,323,000 42,800D 4,567,OOO 1,104,000 5,671,OOO 32,600
A 1,386,OOO 290,700 1,677,OOO 94,800B 1,734,000 290,700 2,025,OOO 235,100C 4,219,000 1,104,700 5,323,000 94,800D 4,567,000 1,104,000 5,671,OOO 235,100
A 1,386,000 290,700 1,677,000 209,800B 1,734,000 290,700 2,025,000 648,800C 4,219,000 1,104,700 5,323,000 209,800D 4,567,000 1,104,000 5,671,000 648,800
CAPITAL COST($)
1,386,0001,734,0004,219,0004,567,000
PRESNET WORTHOF ANNUAL COSTS
($)
290,700290,700
1,104,0001,104,000
TOTAL COST($)
1,677,000 33,4002,025,000 14,9005,323,000 33,4005,671,000 14,900
PRESENT WORTHOF BENEFITS
($)
6-5

TABLE 6.3
BENEFIT/COST RATIOS FOR THE FOUR OPTIONS
FISHERIESMANAGEMENT
ALTERNATIVE OPTION
1 ABCD
3
4
A 0.026B 0.016C 0.008D 0.006
A 0.056B 0.116C 0.028D 0.041
A 0.125B 0.320C 0.039D 0.114
B/C
0.0200.0070.0060.003
6-6

CHAPTER 7
RESULTS AND CONCLUSIONS
The Lemhi River Habitat Improvement Study has focused on
identifying and analyzing solutions to fish passage problems in
the Lemhi River. The Study followed a process of identifying
alternative solutions, performing data collection and background
analyses, evaluating alternatives, and developing and assessing
implementation options.
EVALUATION OF ALTERNATIVES
A task report, which described the nine enhancement alterna-
tives, was produced for the BPA and participating agencies. A
meeting was held on September 11, 1985 between representatives
from the BPA, IDFG, OTT, and Buell & Associates Inc., to discuss
the nine enhancement alternatives presented in the task report.
OTT was directed to focus on alternatives to improve upstream
passage, since an existing program sponsored by NMFS is addressing
downstream passage problems. Table 7.1 presents an evaluation of
the nine enhancement alternatives. The table includes agency
comments and results of analyses performed as part of the Study.
Evaluation of the enhancement alternatives lead to the elimination
of all alternatives except flow concentration and water withdrawal
reduction by improved flood irrigation and sprinkler irrigation.
These alternatives were developed into the four options discussed
in Chapter 5. Each option was evaluated in conjunction with four
fisheries management alternatives.
EVALUATION OF OPTIONS
Options A and C would improve upstream passage conditions in the
lower Lemhi River by providing passage around critical diversions
7-l

ALTERNATIVE
1. Flow Concentration
2. Fish ScreenImprovement
3. GroundwaterAugmentation
4. Groundwa terIrrigation
TABLE 7.1
EVALUAT I ON OF ALTERNATIVES
DESCRIPTION
Construct permanent diversionsand the channelize riverbed atcritical and problem locations.
Improve fish screen systems atirrigation diversions.
Pump groundwater to directlyaugment flow in the River.
Replace partial or entiresurface water irrigation with-drawals with groundwater.
EVALUATION
The most frequent and severe blockageoccurs at diversions L-5, L-6, and L-7,and should be considered for replacement.Channelization is vital in solvingupstream passaqe problems, and should beincluded.
NMFS funds a proqram to maintain and im-prove screens and bypasses, no furtherconsideration should be given to thisalternative. However, it is recommendedthat IDFG accelerate drum screen replace-ments and conduct prototype experimentsto test various screen/bypass syst em s .
Lack of information on the aquiter and the potential low yield of wel ls makethis unfeasable.
Unfavorable because of the estimated low wellyields, interference, and cost. Noteconomically feasible for irrigators.
....J I
N

4I
W
TABLE 7.1
(continued)
ALTERNATIVE DESCRIPTION
5. Water Withdrawal Purchase partial surface waterReduction rights from irrigators in ex-
change for more efficient floodirrigation, or else directlypurchase land.
6. Return FlowImprovement
Increase drainage from irri-gated fields, drain marshareas, and perched watertables.
7. SprinklerIrrigation
Replace inefficient flood irri-gation with sprinkler systemsusing surface water.
8. Storage Construct a storage reservoir High capital cost makes this alternativeon Hayden Creek. unfeasible.
9. Trap and Haul Construct trap and haul facili-ties for upstream adult anddownstream juvenile migration.
EVALUATION
Marginally feasible to irrigators basedon general analysis. 12.7 cfs from L-6to the mouth could be conserved if 60% ofland irrigated by L-6 and L-7 were in-cluded in the program. Unless the bene-fits of converting land to wildlife habi-tat or recreational area are significant,the option of directly purchasing landand not reselling it appears expensive.
Lack of data make this alternativedifficult to evaluate. Major problemswith interrupting groundwater returnsand degrading water quality in theriver.
Favorable for conserving surface water.Considered only for the lower Lemh ireaches. 20.9 cf s could be conserved if60% of the land irrigated by L-6 and L-7were placed under sprinkler irrigation.
An upstream trapping operation is in
consider this a viable alternative due toplace for low flow years. IDFG does not
high operating costs.

and through shallow areas by means of an excavated channel. This
is estimated to increase the recurrence interval of adult
impairment from two in nine years to one in seven years. This
would result in a benefit of between approximately $33,000 and
$210,000 (present worth of benefits over 50 years) to the chinook
and steelhead stocks of the Lemhi depending on the fisheries
management alternative select. The total cost for implementing
Options A and C, including the present worth of annual costs, is
$1.7 million for Option A and $5.3 million for Option C.
Options B and D would improve upstream passage conditions similar
to A and C, however, an additional flow of approximately 21 cfs
would be available in the lower reach of the River. This is
estimated to increase the recurrence interval of adult impairment
from two in nine years to one in thirteen years. The additional
flow would increase smolt production for chinook salmon by roughly
22,000 smolts. Implementation of Options B or D would result in a
benefit of between approximately $25,000 and $649,000 (present
worth of benefits over 50 years) to the chinook and steelhead
stocks of the Lemhi depending on the fisheries management
alternative selected. Total costs for Options B and D are
approximately $2.0 million and $5.7 million, respectively.
The benefit/cost ratios of the four options and management
alternatives range from 0.003 to 0.320. The greatest ratio is for
Option B, coupled with screen improvements and supplementation of
juvenile chinook sufficient to fully seed available rearing
habitat. Details of the benefits analysis and the benefit/cost
analysis are given in Chapters 5 and 6.
CONCLUSIONS
The benefit analysis suggests that the project is not economically
attractive. A fundamentally different approach in determining
benefits may be possible, and it may show the project to be
7-4

economically attractive. An aesethic or cultural value could be
placed on adult salmon and steelhead returning to the Lemhi River
that are not harvested. The analysis presented in Chapter 5
considers only benefits from harvestable adults that would be lost
under existing conditions.
The analysis of project benefits shows the beneficial effect that
improved downstream passage conditions at irrigation screening
facilities in the Lemhi River will have on its run of anadromous
fish. By assuming a 75-percent reduction in the hypothetical
losses and delays at screening facilities, some of the projected
benefits become substantial, particularly Options B and D where
the fish are managed for a maximum natural run.
The success of augmenting stream flow by purchasing water rights
and improving irrigation efficiency will depend on the magnitude
of benefits realized by participating irrigators. The income
received from the sale of a portion of an irrigators water right
must be greater than the cost of land improvements, equipment,and operation and maintenance.
RECOMMENDATIONS
The results of this Study as reflected in the benefits and costs
of the four enhancement options and the four fisheries management
alternatives evaluated, indicate that a combination of Options B
and Management Alternative 4 will result in the greatest B/C
ratio attainable. OTT recommends this combination which
includes:
0 Permanent diversion and levee construction at L-5, L-6,.and L-7; riverbed channelization at L-5, L-6, L-7, SPSl,
SPS2, and SPS3.
7-5

0
0
0
0
0
Flow augmentation through partial water rights purchase
and increased water application efficiency throughimproved flood irrigation practices or installation of
sprinkler systems.
A 75 percent basin-wide improvement in downstreammigrant passage conditions at screened irrigationdiversions exists over prevailing conditions at the time
the project is implemented.
Chinook supplementation to fully seed juvenile rearing
habitat is implemented for the first chinook return
cycle only.
Harvest is delayed until the first chinook return cycle
is completed.
IDFG annually stocks about 2,000 surplus hatchery
steelhead spawners in the Lemhi River.
The benefits accured from this option and management alternative
derive primarily from:
0 Reduced frequency of low-flow conditions impairing fish
passage.
0 Enhanced production due to increased chinook rearing
habitat.
0 Immediate run building to chinook habitat capacity thus
allowing the benefits of harvest to be accrued over a
longer time period.
The success of this recommended option is largely dependent on
having improvements to the screened irrigation diversions in place
7-6

at the time the project is implemented. It is easy to see that
the benefits from the four options are significantly improved if
the screen improvements are made prior to project implementation.
Without screen improvements the potential project benefits are
largely lost. In OTT's view, the Study results strongly suggest
that screen improvements be completed prior to selecting and
implementing any enhancement option or fish management
alternative. OTT recommends that serious consideration be given
to completing diversion screen and bypass, after having completed
the recommended bypass prototype testing described in Chapter 4,
improvements as a prerequiste to implementing an enhancement
option or management strategy.
OTT recognizes that the success of fisheries management in the
Lemhi River depends, in part, on conditions outside of Lemhi,
(e.g., Columbia and Snake Rivers). The Fisheries Management
Alternatives evaluated were relatively simple management
strategies. The complex and complicating issues of a mixed stock
fishery and the attainability of target 1995 SAR's were not
examined. OTT recommends that after IDFG selects the fishery
management strategy it intends to pursue for the Lemhi River, that
a more detailed model of production and harvest be developed prior
to project implementation. Such a model should allow the fine
tuning of expected fisheries benefits and will be useful in
designing and implementing a successful enhancement program for
the Lemhi River.
7-7

REFERENCES

REFERENCES
Anderson, A.L. 1961. Geology and Mineral Resources of the Lemhi
Quadrangle, Lemhi County, Idaho: Moscow, Idaho, Idaho Bureau
of Mines and Geology Pamphlet 124, 111 p.
Bell, M.C. 1984. Fisheries Handbook of Engineerinq Requirements
and Biological Criteria. U.S. Army Corps of Engineers,
North Pacific Division. Portland, Oregon.
Bjornn, T.C. and R.R. Ringe, "Evaluation of Conditioning
Steelhead Trout in Cold Water after Rearing at 15°C,Technical Report 84-3", Idaho Cooperative Fishery Research
Unit, 1984.
Bjornn, T.C. 1978. Survival, Production and Yield of Trout and
Chinook Salmon on the Lemhi River, Idaho. University of
Idaho, Bulletin #27. Moscow, Idaho.
Bjornn, T.C. 1969. Federal Aid to Fish Restoration, Annual
Completion Report, Salmon and Steelhead Investigation.Idaho Department of Fish and Game. Boise, Idaho.
Cocnnauer, T. 1977. Stream Resource Maintenance Flow Determina-
tions on Idaho Streams. Idaho Department of Fish and Game.
Boise, Idaho.
Goodnight, W.H. and T.C. Bjornn. 1971. Fish Production of Two
Idaho Streams. Transactions of the American Fisheries
Society. No. 4, pp 769-780.
Horton, W.D. 1984. Instream Flow Investigations, Annual Report.
Idaho Department of Fish and Game. Boise, Idaho.
1

Horton, W.D. 1982. Instream Flow Study, Annual Report. IdahoDepartment of Fish and Game. Boise, Idaho.
Idaho Department of Fish and Game. 1984. Draft Idaho Anadromous
Fish Management Plan: 1984-1990. Idaho Department of Fishand Game, Boise, Idaho, USA.
Idaho Department of Water Resources, "Lemhi River, Alturas Lake
Creek and Carmen Creek Flow Augmentation Studies", June
1982.
Iriving, J.S., B. Shepard, T.C. Bjornn, N. Horner, and R.R.
Ringe. 1983. Fish Resources in the Gospel-Hump area of
Central Idaho and potential impacts of forest management
activities. Final Report, Intermountain Forest and Range
Experiment Station, USDA Forest Service, MOSCOW, Idaho.
Linsley, R.K. and J.B. Franzini. 1979. Water ResourcesEnqineerinq. McGraw-Hill Book Co. New York.
Oregon Department of Fish and Wildlife. 1984. Determining
Minimum Flow Requirements for Fish.
Parliman, D.J. 1982. Groundwater Quality in Eastcentral Idaho
Valleys, Boise, Idaho, U.S. Geological Survey Open-File
Report 81-1011, 55 p.
Raymond, H.J. 1980. Effects of dams and impoundments of
migrations of juvenile chinook salmon (Oncohynchus
tschawytscha) and steelhead (Salmo gairdneri) from the SnakeRiver, 1966-1975. Transactions of the American Fisheries
Society 108:505-529.
2

USACE. 1985. A methodology for estimating fishery benefits for
Galloway Dam and Reservoir, Weiser River, Idaho. Review
Draft. U.S. Army Corps of Engineers, Walla Walla District.
Walla Walla, Washington, USA.
U.S. Army Corps of Engineers. 1985. "Draft Report, Hayden
Creek-Bear Valley Creek Dam, Lemhi River Basin, Idaho",
Walla Walla District Corps of Engineers.
U.S. Bureau of Reclamation. May 1942. "Report on Lemhi Basin,
Idaho", Department of the Interior.
U.S. Bureau of Reclamation. April 1941. "Report on Lemhi Valley
Projects, Salmon River Investigation, Idaho", Department of
the Interior.
Young, H.W. and W.A. Harenburg. 1973. A Reconnaissance of the
Water Resources in the Pahsimeroi River Basin, Idaho: Boise,
Idaho, Idaho Department of Water Administration Water Infor-
mation Bulletin No. 31, 57 p.

APPENDIX A
LEMHI RIVER DIVERSION AND FLOW
MEASUREMENT LOCATIONS

TABLE A. l
LEl!HI RIVER omRSIOIIS ANO lffASlJRE"ENl LOCATIONS
OIVERSJON OR TRIBUTARY TRIBUTARY OR LOCATION WATER RIGHTS
RIVER DIVERSION ··-----~---.,. ----- -- REftARKS AND L TR HU" "!LE NAl!E DIV SEC i R fl.OW PRIORITY LOCATION CODES
--••·------T-~ --~-------- - -D.00 LEl!Hl R. l!OUTH Sf.-SE 32 22N 22E LEl!HI RIVER KOUTH 0.90 11[-SW s 21N 22[ 3.30 1932.00 I. 20 LOCI
2 1.80 NIHtll 9 2JN 22E 1. 06 1%1.00 L ZB 2. l 0 NE-NW 9 21N 22E I. 57 1689.00 TRJB ?.60 KIRTLEY CREEK SE-NII 9 ZIN 22E LOO L 2( 3.00 NII-SIi 10 21N rn: l.04 . 1963.00 L 3 J.30 NE-SW 10 ZIN 22£ 14.15 1906.00
38 4.00 SE-·SE I 0 21N 22£ 2.03 1951.00 4.10 LOC2 5.45 LIii
L 3A 5.50 SE-NE 14 ZIN 22E 3.99 1869.00 L 5.10 NE-SE " 21N 22E 4.17 ]878.00
7.07 LOC8 7. 14 LOC7
L 5 7. Zll S14-S£ 2, 2!N 22E 5 .18 1894.00 CRITICAL DIVERSION 1.33 LOC4 & ll!Z
L 6 7. 40 TOWN O lTCH SE··SE 24 WI 22E ,t .BO 1869.00 CRITICAL DIVERSION 1.42 LOC5
TR !B 8.10 GEERTSOK CREEK NE-SIi 30 2!N 23£ L 8.30 !ff -Sil 30 ZIN 23E 20.0• 1869.00 CRITICAL DIVERSION
7A 8.32 ~[ -SW 30 2iN 23E 3.52 1669.00 L 8 8.60 N~-SE 30 21H 23£ 1.59 1%1.00
8.90 Ln3 9.20 LOC9
L BA 10.50 ltW-ilW 33 ZiN 23E 26.07 1878.00 L 9 10.52 kiHtil 33 ZlN 23E 20.79 1909.00 TRIB 10.S4 BOHANNON CREEK H\1-HW 33 ZIN 23f
10 l l. 30 N\1-!i[ 33 2!H 23[ 27.16 1880.00 i ! 12. 00 S~ -SIi H ?lN 23[ 5.]6 1880.00
ms 12.20 WINPEY CREEK NE-NII 3 20M 23[ ! 12 12.•o lff-NV 3 ZON 23[ 4 .16 1880.00 TRIS 12.50 PRATT & SANDY CKS NE-KIi 20N 23E
11 !2.80 SE-HW ZON 23E 12. 72 1880.00 ms 12.82 W!TH!NGTON CREEK SE-NW 20N 2 JC'
J~
l 4 13.10 NE-SIi 3 20N 23E 2.28 1902.00 LOCIO 15 13.90 SII-N[ 10 20N 23E 6.81 1871.00 lb ! ~. •o SIi-SW II 20N 23[ 8.62 1872.00 l 7 1•.10 NW-ttlii 14 20N 23E 6.70 1872. 00 IB 15.20 ~.II-NE I~ ZON 23E 0.99 1899.00 !BA 15. 2 l ~,lHI[ 14 20N 23[ 0.32 1892.00

TABLE. A. I
lENHI R!V[N OivE~~1C~5 ~NH ~E.ASURE~~NT LOL~TION~
DIVERSION OR TRIBUTARY TRIBUTARY OR LOOT ION WATER RIGHTS
RIVER DIVERSION RE.NARKS AND LTR NUn nILE NAIIE O!V SEC T R HOW PR !OR !TY LOCATION CODES
l 19 15.70 SE-SE I 4 20N 2][ 1.30 1961.00 l 19A 16.60 NE-SW 24 20N 2JE I. 17 1%3.00
16.65 tOC l l
L 20 16.10 NW-SE 24 ZON 23£ I l.tid 1888.00 CRITICAL DIVERSION L 21 17. I 0 NW-NE Z'> 20N 23£ '>. 14 1892. O'J L 22 17. -40 SE-NE 2') 20N 23l 29.61 1889.UO L Z2A 11.•2 SE-NE 25 20N 23E 8.87 IB8B.OO TRIB 17.88 KENNEY CREEK NE-SW 30 20N 24E l Z3 17.90 N[-SW 30 ZON Z•l 2. l ! 1%Uu
18. 30 LOCl ~
L 24 19.10 SW-Sl 3 J ?ON 24E I. 48 1%1.00
L ZS 19.30 19N rn. 4.90 1909.00 L 26 19.60 SW-NE 19N 24£ 2.87 [887. 00
L 27 20.60 SE-NE t9N 24[ z. lb !899.00 I L 28 Z l .20 SW-SW e 19N 24[ 12. 38 !BBB.DO L 29 21. 50 NW-NW l J 19N 24[ 9.07 l 881. GG
TRIS 21.80 PATTEE CREEK SE-NW j l 19N 24E 22. 70 _(}( !(
L 30 22.80 NW-NW 20 19N 24E {J.07 188&. G:,
TR 1B 23.00 AGENCY CREEK SE-NE 20 l9N 24( l 30A 23. 70 SE-SW 20 19N 24£ 0.87 1961.0G
l 318 24. 70 SE-Sil 29 l9N 24£ i. 48 1 %1.00
fRlB 24.90 NCOEVlTT CREEK NE-NW 32 19N Z4E 25.00 ~ OC I~
L 31 24.10 SE-NW 29 ! 9N 24E ' . 38 1908.00 25.60 LOC!o
L 31A 25.80 SW-SE 32 19N 24( 8.28 1873.00 CRITICAL O!VERSION L 32 26 .30 SE-NE l8N 24£ ! ';. 39 19 l 4. 00 L 33 26.]0 SE-NE !8N 24£ 11 . ss 18:l) 00
L 34 26.50 NE-SE lBN 24E ,_;. c,e , ··~ tJ j : {:
L 35 27. 00 SW-SW lllN 24[ F • C ; j l t. Qi;
L 35A 27. 00 Sil-SW !AN 24l ! :%l .U~
L 36 28.20 SW-SIi i~~ 2 4r . C. J 9 i 2. IJli
l 31 28.20 :, W-511 ,titi I'. 4t ; . 46 l 880. 00
l l8 78 .70 Nil-NW lb l8N 24E !.45 101,.00 28 .50 LOC l 1
L 39 29.80 SE -NE 20 18N 24E 1. ]6 1875.00 29.90 LO': 18
L 40 30.00 NW-SW 2 l lBN 24£ 2.47 1875.00 TRIB 30.30 HAYOEN CREEK SIi-SW 21 IBN HE L •1 30.30 SIi-SW 21 IBN 24E 11.20 191•.oo CRITIC, 41: ~~~ :.~ "ti

TABL[ A.!
Lff!HI RIVER DIVERSIONS AND KfASUREf!ENT LOCATIONS
DIVERSION OR TRIBUTARY TR I BUTARY OR LOCATION WATER RIGHTS ·------ RIVER DIVERSION ------------ REIIARKS ANO LTR NUN NILE NANE DIV SEC T R HOii PRIORITY LOCATION CODES
I 42 30.50 NW-NW 28 IBN 24E 3.80 1875.00 L
L 4ZA&B 30.50 NW-NW 28 18N 24£ 40.00 1%4.00 30.80 LOCZO & U4
L 43 3 J. 90 NW-NW 33 i8N 24E 1.35 1%1.00 PROBL[II DIVERSION 43A 31. 90 NW-NW 33 18N 24E l. 50 1%1.00
L 43B 32.20 SW-NW 33 !BN 24E 1.10 1961.00 -BC 32.50 HW-Sil 33 !BN 24E 2.76 1875.00
33. 50 LOCZI mis 33.60 YEAR!AN CREEK HE-SW 17N 24E
44 33. 70 NE-SW 4 17N 24[ I. 53 [91 l.OO PROBLEII DIVERSION 45 3 3. 70 Nf-SW 4 I IN 24E 2.09 1911. 00 45A 35.60 NE -St 10 I IN Z4E 2.63 1902.00 458 36.50 NE-NW 14 !7N 24E 1. 00 1961.00
L 45C 36.90 SIHE 14 17N 24[ !. 75 1890.00 ~ 450 36.90 SW-NE 14 17N 24E 8.16 1940.00 PROBLEN DIVERSION
3 7.10 LOCZZ TRIB 37.40 REESE CREEK NE -SE 14 1/N 24E
' 46 3 l. 70 SF--SE 14 17N 24E 9.68 1889.00 46A 38.10 1i£ -NII 24 rn 24E I. 90 1892.00 47 39.30 Hi'-NE 25 I 7N 24E 6. l 0 1886.00 48 39.50 NE ·NE 25 17N 2•E 4. 77 1887.00
39.5G LOC23 I 49 39.50 NE-HE 25 l1N 2-~E 5.57 1885.00 ,_
50 41.40 SE ·SW 29 17N 25E 2.60 1919.00 5 i ~!.AO h~ · NE 32 i rn 25E l. 57 1885.00 51A 42.20 SE -NE 32 !JN 25E 3 .12 1865.00
L r) ")~ 43. 30 NII-SE 33 ( 7N 25E 5.40 1936.00 52A 43.]0 Nii -SE 33 !7N 25E 0. 78 1961.00
' 54 43.60 Sr-SE 33 l7N 25E 2.46 1888.00 L
5"l 0.80 St ·SE 33 l7N 25[ 0 .81 1868.00 57 44. IC Sw-N~ 3 t6N 25E I. 99 1888.00
~ 58 RIO Sli-NW 3 l6N 25£ 2.22 1888.00 44.60 LIIS 44.80 LN6
TRIB 45. 00 A!G f IGHf~I! t CRftK SE -SE 16N rn: 58A d 5. l 0 i'it ·NE I 0 !6N 25E S.02 1908.00
L 588 ~'i.90 !i~-NE II 16N 25£ 4.70 IB93 . 00 EAST CHANNEL
58( 0.10 HE -SW 12 16H 25[ 2.8~ 1895.00 59 4 7. JO Sf-Sf 12 16N 25E 2, 11 1887 .00 60 ~A.SO Sf -HW !8 !6N 26E 2.04 1889.00

TABLE A. I
LE"HI RIVER DIVERSIONS AND "EASURE"ENT LOCATIONS
DIVERSION OR TRIBUTARY TRIBUTARY OR LOCATION WATER RIGHTS
RIVER DIVERSION RUARKS AND LTR NU" NILE NAIi£ DIV SEC T R FLOW PRIORITY LOCATION CODES
48.75 LOC24 (SIDE CHANNEL) L 61 .C9.30 SE-5£ 18 16N 26£ 4. 13 1889.00 CRITICAL DIVERSION L 61A 50.40 SE-NW 20 16N 26£ 0.61 L 62 51.30 NE-SE 20 16N 26£ 5.29 1961.00 L 63 52.30 SE-SE 28 16N 26E 9.12 1918.00 PROBLEN DIVERSION
52.35 LOCZS WEST CHANNEL (BIG SPRINGS CREEK)
48.60 LOC27

SCALE
0 I Milt
LEMHI RIVER HABITAT IMPROVEMENT STUDY
ALTERNATIVE LOCATIONS OTT MEASUREMENT LOCATIONS
DATE: NOVEMBER 1985
JOB NUMBER= $1028.03 OTT

LEMHI RIVER . HABITAT IMPROVEMENT STUDY
ALTERNATIVE LOCATIONS OTT MEASUREMENT LOCATIONS
DATE: NOVEMBER 1985
JOB NUMBER: S1028.03 OTT

SCALE 0
FIGURE 8.3
LEMHI RIVER HABITAT IMPROVEMENT STUDY
ALTERNATIVE LOCATIONS· OTT MEASUREMENT LOCATIONS
DATE:NOVEMBER 1985
JOB NUMBER: S1028 .03 OTT

FIGURE 8.4
LEMHI RIVER HABITAT IMPROVEMENT STUDY
ALTERNATIVE LOCATIONS OTT MEASUREMENT LOCATIONS
DATE: NOVEMBER 1985
JOB NUMBER: S1028.03
OTT

"' : . • . I .. " ..... ,• ...• ~·· ····~
I Mlle ~!!!!!!1111--~l!!!!!!!!!!!!!!!!!!!!!!!!!!i
FIGURE B.5
LEMHI RIVER HABITAT IMPROVEMENT STUDY
ALTERNATIVE LOCATIONS OTT MEASUREMENT LOCATIONS
DATE: NOVEMBER 1985
JOB ,NUMBER: S1028.03 OTT

9
FIGURE 8.6
LEMHI RIVER HABITAT IMPROVEMENT STUDY
ALTERNATIVE LOCATIONS OTT MEASUREMENT LOCATIONS
DATE: NOVEMBER 1985
JOB NUMBER: S1028 .03 OTT

APPENDIX C
ANNOTATED BIBLIOGRAPHY

Bureau of Reclamation. October 1939. 141 Aerial Photographs ofthe Lemhi Basin. Scale 1:20,000.
Sterographic aerial photographs which may be useful to gain anoverview of Basin topography and layout.
Bureau of Reclamation. 1940-194s. Supporting Data for theLemhi Valley Water Conservation Projects: Leadore, Hawley,Hayden, Yearian, and Agency Creek Projects. Department of theInterior.
Contains supporting hydrologic and topographic data used inLemhi Basin reports.
Bureau of Reclamation. March 1940. Advance Report onChallis-Lemhi-Pahsimeroi Valleys, Salmon River Investigations,Idaho. Department of the Interior.
Preliminary study to determine the need for more in-depthstudies on reservoir sites for irrigation and hydropower.Provides an overview of valley characteristics but no detailedhydrologic data.
Bureau of Reclamation. 1941. Lower Lemhi Project SupportingData. Department of the Interior.
Data used to evaluate the feasibility of diverting water fromSalmon River via a canal, in order to irrigate the lower LemhiValley and to generate electricity. Hydrologic data for theSalmon and Lemhi Rivers as well as for diversions near theTown of Salmon.
Bureau of Reclamation. April 1941. Report on Lemhi ValleyProjects, Salmon River Investigations, Idaho. Department ofthe Interior.
Report elaborates on the general characteristics of the LemhiRiver Basin such as climate, soils, geology, flood control,drainage, and agriculture. Details are also given on sevenpossible solutions (reservoir locations) to the problem ofdewatering due to irrigation diversions. Project benefits aremeasured in terms of replacing diverted water and increasingcrop yield.
1
HYDROLOGY

Bureau of Reclamation. May 1942. Report on Lemhi Basin, Idaho.Department of the Interior.
This is an analysis made of similar dam and canal projects inthe Lemhi Basin. Estimates and data are presented onexisting and storable flow.
Bureau of Reclamation. May 1944. Appendix fcr Report on LemhiRiver Basin, Idaho. Department of the Interior.
Contains supporting data used in developing a report onreservoir site alternatives in the Basin, including hydrology,survey notes, and design drawings. Hydrologic data a r eparticularly valuable because of stream flow measurements madeon creeks which have never been gaged by the USGS.
Bureau of Reclamation. May 1944. Report on Lemhi River Basin,Idaho. Department of the Interior.
Presents further benefit/cost study on irrigation andhydropower sites for the Lemhi Valley.
Cheney, M.B. 1970. General Soil Map and Interpretations forBroad Resource Planning. U.S. Department of Agriculture, SoilConservation Service. Lemhi County, Idaho.
General soil characteristics, qualities, and interpretationsfor both agricultural and nonfarm use. Also containsdescriptions of each soil series and limitations for varioustypes of construction such as streets, sewers, etc. Some ASTMcompressive and strength details presented.
Cochnauer, T. 1977. Federal Aid in Fish and WildlifeRestoration. Job Performance Report: Stream Flow Investiga-tions. Project No. F-66-R-2, Job Nos. 2, 3, 10, 131, 16, 17.
Results of study on stream resource maintenance flows forvarious river systems in Idaho, including fish periodicity andpreference curves (spawning width versus discharge) for theLemhi River.
Decker, S.O., Hammond, R.E., L.C. Kjelstrom et al. 1970.Miscellaneous Stream Flow Measurements in Idaho, 1894-1967.U.S. Geological Survey, Resources Division. Boise, Idaho.1970.
A compilation of stream discharges at miscellaneous sites andpeak discharges at partial record stations. This basic datarelease was prepared by the USGS in coopertion with the IdahoDepartment of Water Administration.
2

U.S. Army Corps of Engineers, Walla Walla District, WaterDivision. 1983. Survey Field Notes of Topography Along theLemhi River, Vicinity of Salmon, Idaho.
Field notes collected by the Walla Walla Corps District for astudy initiated to solve the salmon migration problems in theLemhi River. The Corps surveyed several cross sections alongthe lower Lemhi, and examined the possibilities for creatinga more defined stream thalwag which would concentrate the flowfor anadromous fish.
Idaho Department of Water Resources. 1982. Lemhi River,Alturas Lake Creek, and Carmen Creek Flow AugmentationStudies. Boise, Idaho.
Report develops hydrologic and related data for the LemhiRiver and two unrelated creeks. These data were to be used bythe Corps of Engineers to study stream flow augmentation as ameans of improving fish passage. Low flow areas, timing andmagnitude of augmentation needs, and existing stream flowquantities are discussed.
Idaho Department of Water Resources. Well Logs, Basin No. 74,Lemhi River. Boise, Idaho. (Microfiche)
Well logs obtained from the Idaho Department of WaterResources contain information on depth, soil composition,recharge rate, and capacity. Several hundred logs areavailable, however, a sample of 50 was selected.
Lemhi Irrigation District. Miscellaneous Discharge Measurementsfor 1981 and 1983.
Matricies were obtained from the Lemhi Irrigation Districtwhich tabulate measurements of River and irrigation canalflows. Location and date of measurement are given on thesetables. Data were used to estimate return flow fromirrigation and groundwater.
National Oceanic and Atmospheric Administration (NOAA), NationalClimatic Data Center, Climatological Data for Idaho.Ashville, North Carolina.
Climatological data for Salmon, Idaho and surrounding areas.Included are temperature, evaporation, precipitation, wind,humidity, and other parameters for these stations.
3
Sisco, G. L. 1975. Miscellaneous Discharge Measurements inIdaho, Basin 74, 1964-1974. Idaho Department of WaterResources. Boise, Idaho.
Report contains discharges measured on the Lemhi River andseveral tributaries during 1964 through 1974.
Soil Conservation Service, Snow Survey Division. 1984.Information on Lemhi River Basin: Diversion Survey Locationsand Discharges for 1979-1980.
Data collected by the Lemhi Valley Irrigation District for theSCS to be used in snowmelt runoff estimation studies.Discharge measurements were made for 1979 and 1980 irrigationseasons.
U.S. Army Corps of Engineers, Walla Walla District. 1983.Photographs of Survey of Lemhi River.
Photographs taken by the Walla Walla Corps District during theSeptember 1983 survey of the Lemhi River. Because of the highwater during this year, no flow deficiencies are evident fromthese pictures.
U.S. Department of Agriculture, Soil Conservation Service. SoilInterpretation Records.
Detailed interpretation records for nearly every soil seriesin the Lemhi Valley. Each sheet tabulates data on texture,depth, permeability, water holding capacity, agriculturalcapability, etc. for a soil series. These are unpublishedrecords used by the SCS in Salmon, Idaho for design andrecommendation purposes.
U.S. Department of Agriculture, Soil Conservation Service.1962. Land Capability Classification, Agriculture HandbookNo. 210 U.S. Government Printing Office.
Provides uniform classification descriptions and applicabilityof land capability codes which are designated on SCS soilinterpretation records.
U.S. Department of Agriculture, Soil Conservation Service.1981. Soil Survey Map and Legend, Area No. 752.
Map delineates the areas along the Lemhi Valley where thevarious general soil groups are located. Each area is colorcoded, numbered, and keyed to a legend which describes thesoil series groups.
4

U.S. Department of Agriculture, Soil Conservation Service.1983. Sprinkler System Design Data.
Crop data for the Lemhi Basin climatic area and guidelines fordesigning lateral sprinkler systems.
U.S. Geological Survey. Water Resource Data. Part 13, SnakeRiver Basin.
Miscellaneous gage information for the Lemhi River andtributaries, for various years of record from 1912 topresent.
U.S. Geological Survey. Well Logs, Lemhi County, 1976-1983.
These well logs tabulate date, water level, and character-istics for three wells monitored by the USGS in the LemhiValley.
5

WATER RIGHTS AND LEGISLATION
Idaho Legislature, Irrigation and Drainage - Water Rights andReclamation. Volume 8, Title 43 Idaho Water Law. Boise,Idaho.
Water law in Idaho guiding all aspects of surface, spring, andgroundwater diversion and transport.
Idaho Department of Fish and Game. Water Rights Location Map.1960.
Approximated map developed by IDFG to determine the actual(versus decreed) location of irrigation diversions on theLemhi.
Proposed Finding of Water Rights in the Lemhi River Basin, CivilCase No. 4948.
Tabulates the adjudicated water rights and priorities of allclaimants along the Lemhi River and tributaries. Thelocation, use, and amount of irrigated acreage is also givenfor each water right.
6

FISHERIES
Bjornn, T.C. 1969. Federal Aid to Fish Restoration, AnnualCompletion Report, Salmon and Steelhead Investigations.Project F-49-R-6, Job Nos. 3, 4, 6, 8. Idaho Department ofFish and Game.
Report discusses salmon and steelhead investigations in theLemhi River and Big Springs Creek, Idaho, from January 1, 1967to December 31, 1967. Areas of study are production,escapement and harvest, embryo survival and emergence, andtemperature effects on spawning and emergence of juvenilesalmon and steelhead trout.
Bjornn, T.C. 1969. Federal Aid to Fish Restoration, JobCompletion Report, Salmon and Steelhead Investigations.Project F-49-R-7, Job Nos. 2, 3. Idaho Department of Fish andGame.
Completion report explains salmon and steelhead investigationsin the Lemhi River and Big Springs Creek, Idaho, from March 1,1968 to February 28, 1969. Areas of study are production,escapement, and harvest of juvenile salmon and trout.
Bjornn, T.C. 1970. Federal Aid in Fish and WildlifeRestoration, Job Completion Report, Salmon and SteelheadInvestigations. Project F-49-R-8, Job Nos. 2, 3. IdahoDepartment of Fish and Game.
Describes salmon and steelhead investigations in the LemhiRiver and Big Springs Creek, Idaho, from March 1, 1969 toFebruary 28, 1970. Study topics are production, yield, andescapement of juvenile salmon and steelhead trout.
Bjornn, T.C. 1971. Trout and Salmon Movements in Two IdahoStreams as Related to Temperature, Food, Stream Flow, Cover,and Population Density. Trans. Amer. Fish. Soc. 100:423-438.
The study addresses factors which might be responsible for thebiannual migration of anadromous and nonanadromous fish in theLemhi River and Big Springs Creek. Water temperature,substrate, vegetation, and stream flow are the variablesused.
7

Bjornn, T.C. 1978. Survival, Production, and Yield of Troutand Chinook Salmon in the Lemhi River, Idaho. Final Report.Project F-49-R. Idaho Department of Fish and Game.
This is the final report for the Federal Aid to FishRestoration, Salmon and Steelhead Investigations, ProjectF-49-R. It summarizes studies on the Lemhi River and presents .an assessment of the summer and winter capacity of the upperLemhi River for juvenile chinook salmon and steelhead trout.
Goodnight, W.H., and T.C. Bjornn. 1971. Fish Production in TwoIdaho Streams. Trans. Amer. Fish Soc. 100:769-780.
Article is the conclusion of the first part of a long-termstudy of fish yield and production in Big Springs Creek andthe Lemhi River.
Horner, N. and T.C. Bjornn. 1981. Status of Upper Columbia andSnake River Spring Chinook Salmon in Relation to theEndangered Species Act. U.S. Fish and Wildlife Service.
The purpose of the study is to determine whether or not springchinook salmon should be listed as endangered or threatened'under the Act. Criteria used include:
1. The present or threatened destruction, modification,or curtailment of salmon habitat or ranqe.
2. Problems with over utilization.3. Occurrence of disease and predation. ,
4. The inadequacy of existing regulatory mechanisms.5. Other natural or manmade factors.
Idaho Department of Fish and Game. 1977. Photographs ofDewatered Lemhi River.
These photographs were taken by IDFG showing the dewateringeffects of a low water year coupled with high irrigationdiversion along the Lemhi River.
Idaho Department of Fish and Game. 1984. Idaho Anadromous FishManagement Plan. Boise, Idaho.
The document presents the proposed goals, policies, andstrategies for the production and harvest of anadromous salmonand steelhead for the period 1984 - 1990.
8

U.S. Department of the Interior, U.S. Bureau of Reclamation,Pacific Northwest Region. July 1984. Idaho Anadromous Fish
Habitat Appraisal Report. Boise, Idaho.
Summary of a study by the Bureau of Reclamation to discover ameans for improving and increasing spawning andhabitat
rearingin the Salmon and Clearwater River Basins. Ten
streams were evaluated for the potential to produce salmonand/or steelhead, and the associated economic, environmentalquality, and social effects caused by developing suchpotential.
9

GEOLOGY
Anderson, A.L. 1961. Geology and Mineral Resources of the LemhiQuandrangle, Lemhi County, Idaho: Idaho Bureau of Mines andGeology Pamphlet 124. Moscow, Idaho.
Pamphlet describes minerals and geology of the Lemhi Basin,and includes a map of these resources. Used in assessingbackground conditions for an analysis of groundwater returnflow.
Young, H.W. and W.A. Harenburg. 1973. A Reconnaissance of theWater Resources in the Pahsimeroi River Basin, Idaho: IdahoDepartment of Water Administration Water Information BulletinNo. 31. Boise, Idaho.
This publication focuses on groundwater resources in thePahsimeroi Basin. Because of the similar geologic history andformations in the Lemhi and Pahsimeroi Basins, correlationscan be made for analyzing well installation and capactiy inthe lower Lemhi Valley.
Parliman, D.J. 1982. Groundwater Quality in Eastcentral IdahoValleys. Open File Report 81-1011. U.S. Geological Survey.
Report presents a reconnaissance level description of waterquality conditions in major aquifers of East-Central Idahovalleys including the Lemhi River Basin. Water quality characteristics determined include specific conductance, pH,water temperature, major dissolved cations, major dissolvedanions, and coliform bacteria. Report also contains anassessment of groundwater movement, including a map of thepotentiometric surface.
Young, H.W. and R.E. Lewis. 1982. Thermal Springs in theSalmon River Basin, Central Idaho. Open File Report 82-103.U.S. Geological Survey.
A thermal and chemical breakdown of thermal springs in theSalmon River Basin, Idaho. Analysis includes the number anddistribution within the Basin, chemical and isotropiccomposition, and the quantities of heat and water which thesesprings are presently discharging.
10

APPENDIX D
HYDROLOGY TABLES AND FIGURES

TABLE D.l
U.S.G.S. STREAM FLOW DATA
StationNumber Station Name
Drainage Period ofArea Record
13303000 Texas Creek near Leadore 71.4
13303500 Timber Creek near Leadore 57.0
13304000 West Fork Timber Creek nearLeadore 16.5
13304200 Big Springs Creek near Leadore
13304500 Eightmile Creek near Leadore 20.0
13305000 Lemhi River near Lemhi 890.0
13305500 Lemhi River at Salmon 1270.0
1938-39; 1955-63
1912; 1938-39
1912
1950-61
1912
1938-39; 1955-63;1967-present
1928-43

TABLE D.2
DAILY PRECIPITATION AND TEMPERATURE DATA
Station Station Drainage Period ofNumber Name Area Record
5177 Leadore 2 Precipitation only 10/65 - present
8080 Salmon ID Precipitation and temperature 12/67 - present

Station Name Elevation (feet) Period of Record
Above Gilmore 8240
Aspen Hall Pass 8200
Copes Camp 7520
Hall Creek 7650
Meadow Lake 9120
Schwartz Lake 8540
TABLE D.3
SNOW SURVEY SITES
1962 - present
1964 - present
1962 - present
1964 - present
1962 - present
1962 - present

TABLE D.4
MONTHLY FLOW STATISTICS OF THE
LEMHI RIVER NEAR LEMHI*
Month OCT NOV DEC JAN FEB MAR APR MAY JUN JUL AUG SEP
Minimum 208 226 197 188 216 224 206 112 232 155 78 115
25th Percentile ‘242 275 227 232 225 253 247 242 493 220 142 136
Mean 280 298 252 251 256 275 294 358 648 367 180 185
75th.Percentile 317 319 278 277 276 304 305 427 742 412 190 219
Maximum 405 379 339 319 322 330 473 816 1302 909 349 274
*Based on records for water years 1968-84 from gage 13305000.

MEAN MONTHLY FLOWS ON HAYDEN CREEK
AND LEMHI RIVER
OCT NOV DEC JAN FEB MAR APR MAY JUN JUL AUG SEP
Hayden Creek at Mouth 34 45 45 40 40 45 110 170 280 120 35 30
Lemhi River near Lemhi 280 298 252 251 256 275 294 358 648 367 180 185
Ratio 0.13 0.15 0.18 0.16 0.16 0.16 0.37 0.47 0.43 0.33 0.19 0.16
Notes: Hayden Creek data from Bureau of Reclamation
Lemhi River data based on record at gage 13305000 from 1968 through 1984
TABLB D.S

TABLE 0.6
L[NHI RIVER 15-0AY LOW FLOIIS
OIY£RS10N FLOW "EASURf"OH SPRING 15-0AY LOW FLOWS OR TRIBUTARY TRIBUTARY OR WATER RIGHTS LOCATION CODES BELOW DIVERSION
RIVER DIVERSION -----LTR NU" "ILE NA"E FLOW PRIORITY OTT l. l.O. 2-YEAR 10-YEAR 20-YEAR SO-YEAR
--~---L Zl 17 .,o 29.61 1889.00 179.68 106.68 79.68 39.68 l 22A 11. .42 8.87 1888.00 204.71 131. JI I 04. 71 64. 71 L 2} 11.90 2.11 1961.00 208.89 135.89 108.89 68.89
18.30 LOCJ3 207.68 rn.00 107.88 67.88 L 24 19.10 1.-48 1961.00 202.28 129.28 102.28 62 .28 L 25 19.30 4.90 1909.00 202 .14 129.14 102. 1' 62.14 L 26 19.60 2.67 1887.00 204.20 13 l. 20 104.20 6•.20 l 27 20.60 2.76 1899.00 199.64 126.64 99.64 59.6• L 28 21.20 12.38 1888.00 19 7. 79 124.79 91. 79 57.79 l zq 2 !. so 9.07 1887.00 206.21 lH.21 106.21 66.21
22.70 LOCI~ 205.52 rn.52 105.52 65.52 L 30 22.60 25.07 1886.00 204.82 131.82 104.82 64.82 L 30A 23.10 0.87 1961.00 219.83 146.83 119.83 79.83 l 3 ! 24.10 7.38 1908.00 211. n 144. 77 117.17 11.11 L 310 2-4.70 1.-48 1961.00 219.8-4 1-46.64 119.84 79.84
25.00 U.S.G.S. GAGE 219.00 146.00 119.00 79.00 25.00 LOCIS 219.00 146.00 119.00 79.00 25.60 LOC16 216.60 143.60 116.60 76.60
L 3lA 25.80 8.28 1813 .00 215.60 142.80 115.80 75.80 L 32 26.30 15.39 1914.00 220.84 147.84 120.84 80.84 l 33 26.30 31.58 1895.00 233. 92 160.92 133.92 93. 92 L H 26.50 0.68 1%1.00 259.96 186.96 159.% 119.96 l 35 27 .00 2.42 1912.00 258.54 185.54 158.54 118.54 L 35A 21.00 1.42 1961.00 260.60 187.60 160.60 \20.60 L 36 28.20 2.82 1912.00 25 7. 00 184.00 I 57. 00 l 17.00 l 37 28.20 I. 46 1880.00 259.40 186.40 159.40 t 19.-40 L 38 28.20 1.45 1875.00 260.64 187.64 !60.64 120.6-4
28.50 LOCIJ 260.67 187.68 160.68 120.68 l 39 29.80 1.36 1875.00 255.48 182.-48 155.48 115.-48
29.90 LOC18 256.23 183.23 156.23 l 16.23 L •O 30.00 2.-41 1875.00 255.83 182.83 155 .83 l 15.83 HAYDEN CR 30.30 LOCl9 256. 73 183.H 156.13 116.13 L 41 30.30 11.20 1914.00 256. 73 183.13 156. 73 116. 73 L •2 30.50 3.80 1875.00 265.-45 192.45 165.45 125.45 L 42UB 30.50 1964.00 268.68 195.68 168.68 128.68
30.80 LOC20 lN4 261. ,a 194 •• 8 167.48 127.48 l 43 31. 90 1.35 196 \.00 263.08 190.08 163.08 123.08 l 43A 31. 90 1.50 1%1.00 264.23 191. 23 164.23 124.23 L HB 32.20 1.10 1961.00 264.30 191. 30 164.30 124.30 l CJC 32.~o Z.16 1875 .00 264.04 191.04 164.04 124.04
33.50 LOC21 262.38 189.38 162.38 122.38

TABLE 0.6
LE"HI RIVER 15-0AY LOW FLOWS
DIVERSION FLOW "EASUREl!ENT SPRING IS-DAY LOW FLOWS 0~ TRIBUTARY TRIBUTARY OR WATER RIGHTS LOCATION CODES BELOII OIYERSION
RIVER DIVERSION LTR HU" "!LE HANE Ft OW PRIORITY OTT l.1.0. Z-Y[AR !0-YEAR 20-Y'EAR 50-YEAR
-----(). 00 lENHJ II. "OUTH 0.00 95.06 22.06 -4.94 -44.94
L 0.90 3.]0 1932.00 87.86 1'.86 -12. ,. -52.14 1.20 LOCI 88.26 15.26 -11.H -51.H
L ' L ! .80 1. 06 1961.00 8) .• 6 10.46 -16.54 -56.54 L 2B 2. 10 l. 57 18B9.00 81.% 8.% -18.04 -58.04 L 2C 3.00 l. 04 1%3.00 16.10 3.10 -23.90 -63.90 L 3 3.30 1'.15 1906.00 74.S8 I. 58 -25 . .(2 -65.42 L 3B 4.00 2.03 1951.00 81. 0 I 8.01 -18.,9 -56.99
4. 70 LOCZ 77. U (.14 -22.86 -62.86 'dS LIil 71.14 -1.86 -28.86 -68.86
L 3A 5.50 L 99 1869.00 70. 74 -2.26 -29.26 -69.26 l 4 5.70 4. J 7 1878.00 72.53 -0.47 -27.47 -67.47
7.07 LOCB 65. l I -1.89 -34.89 -7.(.89 7. I~ LOCJ 64.55 -8.45 -35.45 -75.45
l 5 7.20 S .18 1894.00 64. 07 -8.93 -35.93 - 75. 93 7. 33 LOC4 LN2 61.43 -5.57 -32.57 -72.57
6 1.40 ANDREWS OITCH 4 ! .80 1869.00 66.87 -6. 13 -33.13 -73.13 7. 42 LOCS 102.24 29.24 2.24 -37. 76
L 8.30 TOWN OITCH 28.04 1669.00 95.20 22.ZO -•.so -••.eo L 7A 8.32 3.52 [889.00 118.68 45.86 18.68 -21.12 L 8 8.60 LS9 1961.00 119.63 46.63 !9.63 -20.37
8.90 l"3 118.58 45.58 16.58 -21.42 9. 20 LOC9 116.18 43.18 16.18 -23.82
L 8A !0.50 26 ., 07 IB18.00 107.08 34.08 7. 08 ~32.92 L 9 !0.52 20 . 79 1909.00 129.10 56.10 29.10 -10.90 L l 0 l i. 3U 27. i6 IB80.00 141.31 68.31 H.31 1.31 L l l 12.00 S. 76 1880.00 159.50 86.50 59.50 19.50 L 12 [2.40 4 .16 1880.00 161. 59 88.60 ,1.60 21.60 l 13 12.80 l2. 72 1880.00 162.33 89.33 62.33 22.]3
l J . l 0 LOCIO 171.04 98.04 1 t.04 31.0• L i 4 i 3. l 0 2.28 1902.00 171. 04 98.04 71.0C 31.04
! 5 13.90 6.81 1871.00 167.38 94 .]8 67.38 27.38 16 14. 40 8.62 1672.00 169.67 96.67 69.67 29.61
11 I 4. 70 6. 70 1872.00 174.90 10 I. 90 H.90 34.90 l \B l'l.10 0.99 1899.00 177.09 104.09 11.09 37.01 l \BA l). z l 0.32 1892.00 171. 86 I U.86 71.86 37.86 l 19 15.10 !.30 1%1 .00 IH.Jl !Oi.11 14.11 H.1l
L l9A 16.60 1.17 !%3.00 169.51 %.51 69.51 2CJ. 5 l 16.6S LOCI I 110.15 97.15 70.15 30.15
l 20 l6 . 70 11.64 1888.00 169.80 %.80 69.80 29.89 L 21 17.10 'i. 74 1692.00 116. 90 103.10 76.90 36.90
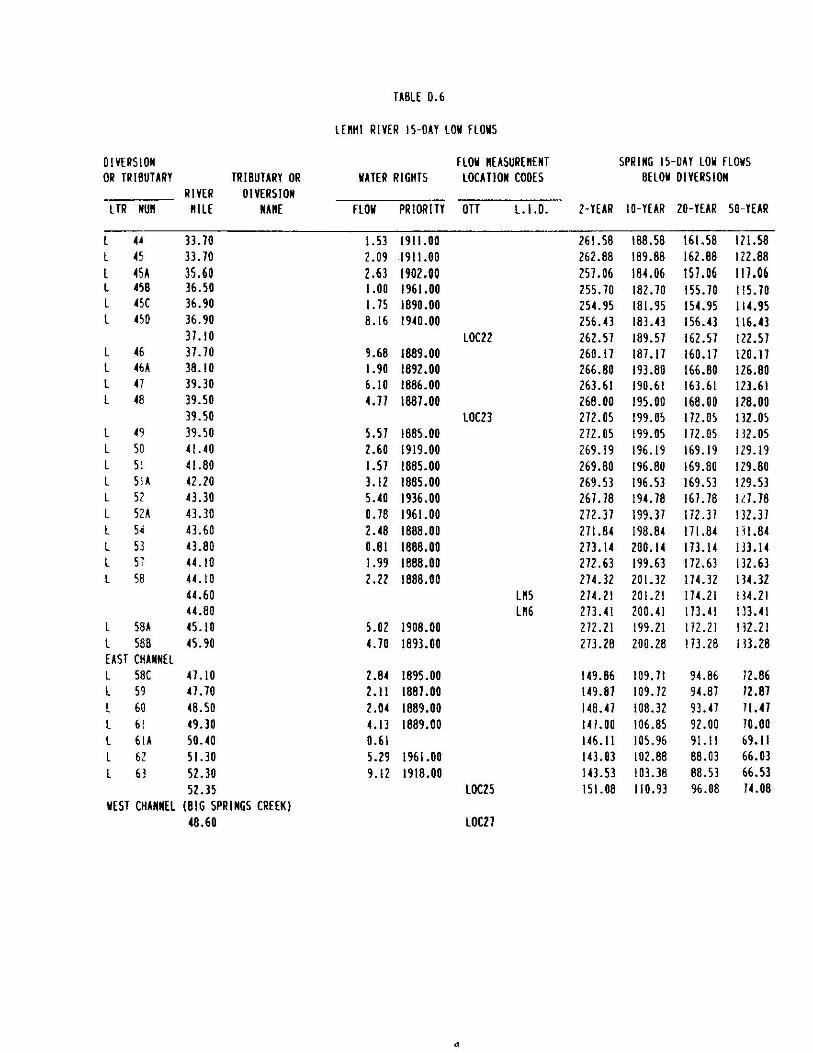
TABLE 0.6
LEftHI RIVER 15-0AY LOIi FLOWS
DIVERSION FLOW IIEASUREIIENT SPRING 15-0AY LOIi FLOWS 011 TRIBUTARY TRIBUTARY OR IIATER RIGHTS LOCA Tl ON CODES BELOII DIVERSION
RIVER DIVERSION LTR NUPI PIILE NAPIE HOii PRIORITY OTT L.1.0. 2-YEAR 10-YEAR 20-YEAR SO-YEAR
l .u 33.70 1.53 1911.00 261.58 188.58 161. 58 IZI.S8 l 45 33.70 2.09 1911.00 262.88 189.68 162.B8 122.88 l 45A 35.60 2.63 1902.00 257.06 164.06 157.06 111.06 L •se 36.50 I.OD 1%1.00 255.70 182.70 155.70 ll 5. 70 L 45C 36.90 I. 75 1890.00 254. 95 181. 95 154.95 114.95 L 450 36.90 8.16 1940.00 256. 43 183.43 156.43 116.43
37.10 LOC22 262.57 189.57 162.51 122.57 L 46 37.70 9.68 1889.00 260.17 187.17 160.17 120.17 L 46A 38.10 I. 90 1892 .00 266.80 193.80 166.80 126.80 L 47 39.30 6.10 1886.00 263.61 190.61 163.61 123.61 L 48 39.50 4.77 1887.00 268.00 195.00 168.00 128.00
39.50 LOC23 272.05 199.05 172.05 132. 05 L 4<J 39. 50 5.57 1885.00 272.05 199.05 172.05 132.05 L 50 4UO 2.60 1919.00 269.19 196.19 169.19 129.19 L 5! 41.80 1.57 1885.00 269.80 196.80 169.80 129.80 L SlA 42.20 3 .12 1885.00 269.53 196.53 169.53 129.53 L 52 H.30 5.40 1936.00 267. 78 194.78 167. 78 127. 78 L 52A 43.30 0.78 1961.00 272.37 199.37 172.37 132.37 L Soi 43.60 2.48 1888.00 271.84 198.84 171.84 IH.84 L 53 43.80 0.81 1888.00 273 .14 200.14 173.14 IH.14 L 57 KIO 1.99 1888.00 272. 63 199.63 112.63 132.63 L SB 44.10 2.22 1888.00 274. 32 201.32 174.32 lH.32
.(4.60 L"5 274.21 20 I. 21 174.21 134. 21 U.80 Lft6 273.41 200.-41 173.41 IJJ.41
L 58A 45.10 5.02 1908.00 272.21 199.21 172.21 132.21 l 588 45.90 4.70 1893 .00 273.28 200.28 113.28 IH.28 EAST CHANNEL L SBC H.10 2.84 1895.00 149.86 109.71 94.86 12.86 L 59 47.70 2 .11 1887.00 149.87 109.72 94.87 12.81 L 60 48.SO 2.0.t 1889.00 148.47 108.32 93.47 11.47 L 6! 49.30 4.1] 1889.00 147.00 106.85 92.00 10.00 L 6lA 50.40 0.61 146.ll 105.96 91.11 69.11 L 62 51. 30 5.29 1961.00 143. 93 102.88 88.03 66.03 L 63 52.30 9.12 1918.00 IH.53 103.]8 88.53 66.53
52.35 LOCZS 15 l.08 110. 93 96.08 14.08 IIEST CHANNEL (BIG SPRINGS CREEKI
(8.60 LOC2l

TABLE D.7
Ll"HI RIVER 15-0AY LOIi FLOWS
O!VERSJOH fLOII IIEASUREIIENT SUIIIIER IS-DAY LOIi FLOWS OR TRIBUTARY TR I BUTARY OR WATER RIGHTS LOCATION CODES BELOW DIVERSION
RIVER 0 I VERSION -----l TR NUI! "ILE NAIi[ FLOW PRIORITY OTT l.1.0. 2-YEAI! 10-YEAI! 20-YEAR SO-YEAR
.........,,__.,_ -------0.00 LEl!Hl R. l!OUTH 0.00 87.23 50.23 40.23 28.23 0.90 3.30 1932.00 76.88 39.88 29.88 17.88 I. 20 LOC l 76. 73 39. 73 29. 73 ll. JJ
l 2 l.80 !. 06 1%!.00 69.83 32.83 22.83 10.63 L 2B 2. IO I. S 1 1889.00 67.44 30.U 20.U 8.U L zc 3.00 I. 04 1%3.00 58.66 21.66 11.66 -0.H I. 3.30 I ~.15 1906.00 56.25 19.25 9.25 -2. 75 L 3B 4.00 2.03 1951.00 62.35 25.35 15.35 3.35
~.70 LOC2 S6.33 19.B 9.33 -2.67 5.45 LIi I '1.11 10. 7 I Q. 71 - I 1.29
L ]A 5.50 3.99 1869.00 47.13 IO .13 0.13 -11.87 L t 5.10 4.17 1878. 00 48 .82 l 1.82 1.82 -10.18
7. 07 LOC8 37.2.4 0.24 -9.76 -21. 76 Ll.4 LOC7 36.43 -0.57 -10.57 -22. 51
L 5 1.20 5.16 IB94.00 35.74 -1.26 -11.26 -23.26 7. 33 LOC4 Lll2 39.43 2.43 -7.51 -19.S7
I t 7. 40 ANDREWS DITCH 41.80 1869.00 36.62 l.62 -B.38 -20.38 L
1.•2 LOCS 80 .19 43 .19 33.19 21.19
L 8.30 TOWN OJTCH 28.04 186<J.OO 10.07 33.07 23.07 11. 0 r l. 7A 8.32 L 52 1889.00 97.88 60.88 50.88 36.88 L 8 8.60 l. 59 1961. 00 98.18 61.18 S t.18 39. 18
6.90 LN3 96. 32 59.32 49.32 31.32 9.20 LOC9 92. ! 2 55.12 45.12 33. l2
8,~ 10.50 26. 07 1878. 00 73. 92 36.92 26.92 u.n 9 10.52 20.79 1909.00 99. 71 62.71 52. 71 40. 1 I
~ I 0 11. 30 27.16 1080.00 109.58 72.56 62.58 50.58 L l I 12.00 5. 76 1880.00 126.94 89.94 79.94 67. 94 l ! 2 12.40 U6 1880.00 127 .10 90.10 60.10 68. iO l I 3 12.60 12 .12 1680.00 125.66 86.66 78.66 66.66
13.10 LOCIO 134.IB 91.18 87.18 75.18 14 13.10 2.28 1902.00 134 .18 97 .16 87.16 75.16 I 5 13.90 6.81 1871.00 125.26 88.26 78.26 66.?6 I b 14. ,o 8.62 1672.00 125.07 88.07 78.07 66.01
t 1 14.70 6.70 1012.00 !29.~9 92 .• 9 82 •• 9 J0.(9 l lB [5.20 0.99 18<J9.00 129.19 92.19 82.19 70. !9
L IBA 15.21 0.32 1892.00 130. 04 93.0t 63.04 71.0~
L 19 15.70 I. 30 1961.00 123. 50 B6.50 76.50 64.50 L 19A 16.60 l.17 1963.00 112 .20 15.20 65.20 S3.20
16.65 LOCI I I 12.61 75.67 65.61 53.67
L 20 16.70 11.64 IB88.00 111. 97 1~.91 64.91 52. 97
21 17.10 5. 74 1892.00 118.01 81.01 lt .81 59.01

TABLE 0. 7
LEftHI RIVER 15-DAY LOW FLOWS
DIVERS!Otf FLOW ft(ASUR£ft£NT SUNNER 15-0AY LOW FLOWS OR TRIBUTARY TRIBUTARY OR IIATER RIGHTS LOCATIOM CODES BELOW OIY£RS10tt
RIVER OIYERSIOtt l TR lltfft RILE NA ft[ FLOW PRIORITY OTT L.1.0. 2-YEAR 10-YEAR 20-YEAR SO-YEAR
l 22 17.40 ZCJ.61 188CJ.OO I ICJ.55 82.55 72 .SS 60.55 l 22A 17.42 8.87 1888.00 148.BB 111.88 101.88 89.88 l 23 17.90 2.11 1%1.00 151.03 114.03 104.03 92.03
18.30 LOCIJ 14 7. 54 I 10. 54 100.54 88.54 L 24 19.10 I. 48 1%1.00 136.34 99.3( 89.34 17.34 l 25 19.30 VJO 1909.00 135 .02 98.02 88.02 ,t>.02 l 26 19.60 2.87 1687.00 135. 72 98. 72 BB. 72 76.72 L 27 20.60 2.76 1899.00 124.59 87.59 77.59 65.S9 L 28 21.20 12.38 1888.00 118.95 81.95 71. 95 59.95 L 29 21.50 9.01 1887.00 127.13 90.13 80.13 68.13
22.70 LOCU 119.40 82.40 12.40 60.-'0 l 30 22.80 25.07 ]886.00 118.00 81.00 71.00 59.00 l JOA 23. 70 0.87 1%1.00 130.47 93.47 83.-'l 71 • .(7 l 31 24 .10 7.38 1908.00 125.74 88.H 78.H 66. H l 316 24.70 I. 48 1961.00 124.72 87. 72 77 .12 65.72
25.00 U.S.G.S. GAGE 122.00 85.00 75.00 63.00 25.00 LOCl5 122.00 85.00 75.00 63.00 25.60 LOCl6 118.10 81.10 71.10 59.10
L 3 IA 25.80 8.28 IB73.00 116.80 79.80 69.80 51.80 L 32 26.30 15.39 191-'.00 121.83 8-'.83 74.63 62.83 L 33 26.30 31.58 1895.00 137 .22 1011.22 ,0.22 78.22 L H 26.50 0.66 1%1.00 167.50 130.50 120.50 !OB.St l 35 27.00 2.42 1912.00 164.93 l 27. 93 117. 93 105.93 l 35A 27.00 I. 42 1961. 00 16 7. 35 130.35 120.35 108.35 L 36 28.20 2.82 1912.00 160.97 123.97 113.97 ! 0 I. 97 l 31 28.20 I. 46 1880.00 163.79 126.79 116. 79 104.79 l 38 28.20 I. 45 1875.00 165.25 128.25 118.25 I 06 .25
28.50 LOCIJ 164.75 127.75 117. 75 105.75 l J9 29.80 I. 36 IB75.00 ·156.30 119.30 109.30 97.30
29.90 LOCIB l 57. 0 I 120.01 110.0 I 98.01 l 40 30.00 2.47 1875.00 156.36 119.36 109.36 97.36 HAYDU CR 30.30 LOCl9 50.88 49.88 48.88 -'4 ,88 L 41 30.30 11.20 1914.00 50.88 49.88 48 .88 U.88 L 42 30.50 3.80 1875.00 60.78 59.78 58. 78 54.78 L 42A&B 30.50 1964.00 64.58 63.56 62.58 58.58
30.80 LOC20 LIU 62.63 61.63 60.63 56.63 l 43 31. 90 1.35 1961.00 55.46 54.48 53.48 -49."8 l 43A 3[ .90 J.50 1961. 00 56.83 55.83 54.83 50.83 l '38 32.20 1.10 1%1.00 56 . 38 55 . 38 54.38 50.38 L 43C 32.50 2.76 1875.00 55.53 54.53 53.53 49.53
33.50 LOC21 54.29 53.29 52.29 48.29

HSU 0. 7
LEIIH! RIVER 15-0AY LOW FLOWS
DIVERSION FLOW NEASURENENT SONNER IS-DAY LOW FLOWS OR TRIBUTARY TRIBUTARY OR WATER RIGHTS LOCATION CODES SfLOW DIVERSION
RIVER DIVERSION -----LTR NUii ll[lf NANE FLOW PRIORITY on L.1.0. 2-YEAR 10-YHR 20-YEAR 50-YEAR
-----·-- -------L H 33. 70 I. 53 1911.00 53.49 52.49 51.41.l H.49 l 45 33.70 2.09 191 J. 00 55.02 54.02 53.02 49.02 L •sA 35.60 2.63 1902.00 49.51 48.5[ 47.51 43.51
458 36.50 l.00 1961. 00 48.S4 41. 54 46.S4 42.54 l 45( 36.90 I. 75 1890.00 47.94 46.94 45.94 41. IJ~ l 450 36.90 8.16 1940.00 49.69 48.69 47.69 43.69
31.10 LOCZZ 57.05 56.05 55.05 Sl.05 L 46 31.10 9.68 1889. 00 54.65 53.65 52.65 48.65 L 46A 38.10 I. 90 1892.00 62. 73 61. 73 60. 73 56, 73 L 47 39.30 6.10 1886.00 59.83 58.83 57.83 53.83
48 39.50 4.17 1887.00 65 .13 64.1] 63.1] 59.tJ 39.50 LOC23 69.90 68.90 67.90 63.90
L 49 39.50 5.57 !885.00 69.90 68.90 67.90 63.90 L 50 41.40 2.60 1919.00 60.27 59.27 58.27 54.2; L Si 41 .80 I. 57 1885.00 59.67 58.67 57.67 5L67 l 51.~ 42.20 ] . ! 2 1885.00 58.04 57. 04 56.04 52.04 !_ 52 43.30 5.40 1936.00 52.36 5[. 36 50.36 46.lf
52A 43.30 0. 78 1961.00 57. 76 56.76 55.76 51. 76 54 43.60 2.48 1888 .00 56.14 55.U 54.14 50.14
L 53 (3.80 0.61 1888.00 57.02 56.02 55.02 5 I. 02 ~ 7 4(. I 0 !. 99 1888.00 55.43 54.43 53.43 49.4]
~ 58 44.10 2.22 [888.00 57. 42 56.42 55.42 51. 42 ,U.60 L"S 55.64 5L64 53.64 49 .64 K80 L"6 54.04 53 .o, 52.04 48.04
;,8A 45. l 0 5.02 [908.00 51.64 50.64 49.64 45.6• 586 45.90 ~. 70 1893.00 50.26 49.26 48.26 44.26
EAST CHAHNf.L l )8C 4 7.10 2.84 1895.00 26.27 25. 72 25.17 22.97 l ~,9 41. 70 2.11 [887.00 25.51 24. 96 24.41 22.2 !
f,O 48.50 2.04 1889.00 22 .82 22.27 21.12 :9.52 L 61 49.30 4 .13 1889.00 20 .06 19.51 !B. 96 16. Jb l 61A 50.40 0.61 l 7.59 17.04 16.49 [4.29
b2 Sl.30 5.29 I %1.00 12.80 12.25 11. 70 9.50 63 52.30 9.12 1918.00 12.09 11.54 10.99 8.7~
52.35 LOC25 20.91 20.36 19.81 17 .6: WEST CHANNEL (BlG SPRINGS CREEK)
48.60 LOC27

TABLE 0.8
L["Hl RIVER IIEAN IS-DAY LOW FLOWS
OIVfRSION FLOW IIUSUR[l!l Hl HOW BELOW FLO~ BE TWEEN OR TRIBUTARY TRIBUTARY OR WATER RIGHTS LOCATION CODES OIVERSIOHS OJ VERSIONS
RIVER O!V£RS10N --·-----LTR NU!! l!ll £ NAIi£ HOii PRIORITY OTT l. l .!l. su11m1 SPRING SUllll£R SPRING
- ++-~~.~~----++•--~~···--0.00 !. mil R. IIOUTH 0.00 IO I. 98 90.36
L l 0.90 3.30 1932.00 91. 63 B3 .16 96.81 86 .76 L 2 I .BO l. 06 1961.00 84.58 78.16 89.76 tl2.61 L ze 2.10 t. 51 1689.00 82 .19 17.26 BJ. 92 18. 54 l 2( 3.00 I. 04 1963.00 73.41 71. 40 78.59 l5. 12 L 3 3. 3 0 14.15 1906.00 71.00 69.88 72. 7J ! l.16
3E 4.00 2.03 1951.00 77.10 76.31 8 l. t 3 80 .17 L H 5.50 3.99 1869.00 61.88 66.04 70.51 12 .19 L 4 ). 70 4.17 1678.00 63.57 67.83 64.72 68.93 l 5 7.20 5.18 1894.00 50.49 59.37 59.12 65 .68 l 6 uo ANDREWS DITCH 41.80 1869.00 53.37 62 .17 54.52 63.36 L 1 8.30 TOWN DITCH 28.04 1669.00 84.82 90.50 90.00 'fl .24 l H 8.32 3.52 1889.00 112.63 l1U8 112. 75 I 16.36 L B 8.60 1.59 1961.00 112.93 114. 93 114.54 116. 31 L 8A IO. 50 26.07 1878.00 87. 92 IO I. OB 101.22 108.80 L 9 10. 52 20.79 1909.00 113. 71 123.10 113.85 115.13 L I~ 11. JO 27 .16 1880.00 123.58 135.31 129.04 139 .60
! ! 12.00 5.76 1880.00 140. 94 153.50 145 .64 I) 7. 99 L l? 12. 40 4.16 1880.00 141.10 ISS.59 143.90 l',7.43 L 13 12.80 12.12 1880.00 139.66 l 56 .33 142.46 l ()8. 04 l 14 13. I 0 2.28 1902.00 148.18 165.04 150.28 167.05 L 15 13.90 6.81 1871.00 139.26 161.38 144.86 1&4.35 L lb 14. 40 8.62 1672.00 139.07 163.67 142.51 165.93 L ! C 14. 70 6.70 1872. 00 143.49 168 .90 14S.S9 l JO. 59 L 12 1 S. 20 0.99 1899.00 143 .19 17 l. 09 146.69 l ?3. 34
L JBA J 5. 21 0.32 1892.00 IU.04 171. 86 144. \ I 1 f!. 97 L 19 1 s. 70 I. 30 1961. 00 137. 50 168. 71 140. 93 170. 44 L 19.A. 16.60 l.17 1963.00 126.20 l63 .5 l 132.50 166.76 L 20 16. 70 11.64 1888.00 125.97 163.80 126 . 67 164.24 L 2: l 1.10 5. H 1892.00 l 32. 0 I 170.90 ll4.Bl 113. l 7 l 22 17. 40 29.61 1889.00 133. 55 113.68 135.65 I 75.16 l 22A 17. 42 8.87 1888.00 162.88 198. 71 163.02 201. 00 L 23 17.90 2.11 1961.00 165.03 202.89 168.39 ZOS.23 L 2t 19. I 0 I. 48 1961. 00 150.34 196.28 158. 74 200 .64 l 25 19.30 4.90 1909.00 149.02 196.14 150.42 1%.95
l 26 19.60 2.87 1887.00 149. 72 198.20 15 l. 82 199.62 L 2' 20.60 2.76 1899.00 138. 59 193.64 145.59 191.36 L 2B 21. 20 12.38 1888.00 132. 95 191.79 137.15 19.4.09 l n 21.50 9.07 1887.00 141. ll 200.21 1(3.23 202 . 19 l 30 22.80 25.07 1886.00 132. 00 198.82 l ( I. I 0 704 . 05 L 30.A. 23.10 0.87 1961.00 144.CJ 213.83 l 50. 71 218.86

TABLE 0.8
L[~HI RIVER IIEAN 15-0AY LOW fLOWS
OlVfRSlON fLOW !ff A SURE mn FLOW BELOW fLOII BETWEEN OR TR I BUTARY TRIBUTARY OR WATER RIGHTS LOCATION CODES DIVERSIONS O!VERSIOHS
RIVER O[VERSION ··-·----- ---·· LTR NU" NIU: NAIIE HOW PRIORITY on L .1.0. SUll!ffR SPRING SUIIIIER SPRING
--·--"-··--~-·--·----- ·-----------·-3 t zuo 7. 38 1908.00 m.H 211.77 142.54 213.23 31B Z(.70 1.48 1%!.00 138. 72 213.8( 142.92 216.SO
25.00 U.S.G.S. GAGE 136.00 213.00 138. l 0 214.16 31A 25.80 8.28 1873.00 [30.80 209.80 133. •o 211. 40 32 26.30 15.39 1914.00 135.83 214.84 137. 46 216.46 33 26.30 31. 58 1895.00 151. 22 22 7. 92 151.22 229.07 34 26.50 0.68 1961.00 181. 50 253. % 182.15 256. 73 3~ 21. 00 2.42 1912.00 178. 93 252.54 180.56 253.59
l 35A 21. 00 1.42 1%1.00 181. 35 254.60 181.35 254.78 J6 78.20 2.82 1912.00 174. 97 251.00 118.87 253.51 37 28.20 I. 46 1880.00 177. 79 253.40 J 77. 79 253.61 18 78.20 1. 45 1875.00 !79.25 25 4. 64 179 .25 254.lS J9 29.80 I. 36 1875.00 !70.30 249.48 175.50 252.78 40 30.00 2.47 1875.00 l 10. 36 249.63 I 7 I. 0 I 250.33
t1A YOEN CR 30.30 SB.88 116. 73 41 30.30 11.20 1914.00 58.88 116. 73 58.88 11ti. n •2 30.50 3.80 1875.00 68.78 125.45 69.43 126.69 42H.B 30.50 1964.00 72.58 128.68 72.58 128.97 43 31. 90 I. 35 1961.00 6). 48 123.08 68.03 125.80 OA 31. 90 I. so 196!.00 6 4. 83 124.23 64.83 12,.33 438 32.20 1.10 1961.00 64.38 124.30 65.35 125.02
L 0( 32.50 2.16 1875.00 63. 5 3 124.04 64.50 12•.12 44 33.70 I. SJ 1911.00 61. 49 12 l. 58 63.89 124.19 4S 3 J.10 2.09 1911. 00 63.02 122. 88 63. 02 123.00 4':A JS.GO 2.&3 1902.00 SUI 117. 06 61. 31 121. 02
L 458 36.50 I. 00 1961.00 56.54 115. 70 58.34 117. 69 L ~5( 36.90 I. 75 1890.00 55.94 114. 95 56. 74 115.82 L 450 36.90 8.16 19~0.00 5 7. 69 116. 43 57. 69 116.57
•5 37 .10 9.68 1889.00 62.65 120 .17 64.25 122.38 4U 38 . I 0 !. 90 1892.00 70. 13 !?6.80 7!. 53 128.32 4) 39 •. rn 6.10 1886.00 6 7. 8 3 l 23. 6 l 10. 23 !26.16 48 39.50 4.17 1887.00 7 3. 13 128.00 73. 53 128.86 49 39.50 S.57 1885.00 7 7. 90 132.05 77. 90 132.41 50 ( !.(0 2.60 1919.00 68. 27 129.19 75.81 133.40 s l d ! .30 l . 51 1885. 00 67.67 [29.80 69.27 130.79 ~!A fZ.20 3. l 2 1885. 00 66.04 129.53 67.6• 130.•5 52 ,3.30 s.•o 1936.00 60.36 121. 78 64.76 130.22
l. 52A •3 .30 0. 78 1%1.00 6'.i .16 132.37 65.76 132. 78
L 54 ~3.60 2.48 1888.00 64 .14 131.8( 65.H 132.50 53 43.00 0.81 1888.00 6S.02 133.14 65.82 133.13 J 1 H.10 I. 99 1888.00 63.4] 132.63 64.63 133.29

TABLE 0.6
LE"HI RIV[R "EAN IS-OAY LOW FLOWS
01 VfJISJ ON FLOW l!EASUREl!ENT FLOW BELOW FLOW BETWEEN OR TRIBUTARY TRIBUTARY OR WATER RIGHTS LOCATION COOES DIVERSIONS DIVERSIONS
RIVER DIVERSION LTR NU ft !Ill[ NAIi[ FLOW PRIORllY OTT l.1.0. SUftl!ER SPRING SU1111£R SPRING --- ----L 58 H.JO 2.22 1888.00 65.•2 134.32 65.42 13.C.41 L SBA 45. l 0 5.02 1908.00 59.64 132.21 63.64 134.38 L 58B 45.90 4.10 1893.00 58.26 133.28 61. 46 135.26 EAST CHANNEL L 58( 4 7. I 0 2.84 1895.00 ]0.67 72.86
L 59 4 7. 70 2 .11 [887.00 29. 91 72.87 ] 1.11 14.29 L 60 48.50 2.04 1889.00 27.22 71.47 29.62 13.23 L 61 49. JO U3 [889.00 24.46 70.00 26.86 71.75 L 61A 50.40 0.61 21. 99 69.11 25.29 JI. 62 l 62 51. 30 5.29 1%1.00 17.20 66.03 19.90 67.88 l 63 SZ.30 9.12 [918.00 16.49 66.53 19.49 68.92
52.35 25.31 74.08 25.46 74.86

4 . 0
3 . 5
3 . 0
2 . 5
2 . 0
I.5
1.0
0 . 5
0
MONTH F I G U R E 0. ILEMHI R I V E R
H A B I T A T I M P R O V E M E N T S T U D Y
MEAN, QUARTILES AND RANGE OFMONTHLY PRECIPITATION
* S A L M O N , I D A H O ( G A G E 8 0 8 0 1989-83) D A T E : N O V E M B E R 1985
J O B N U M B E R : S 1 0 2 8 . 0 3

8 0 0
6 0 0
4 0 0
2 0 0
0
.4I
I I 1 I I I I I I *.I I. -..- - - -OCT NOV DEC JAN FEB MAR APR MAY JUN
M O N T H
JUL AUG SEP
F I G U R E 0. 2L E M H I R I V E R
H A B I T A T I M P R O V E M E N T S T U D Y
MEAN, QUARTILES AND RANGE OFMONTHLY FLOWS LEMHI RIVER
/ b* N E A R L E M H I , I D A H O ( U S G S GIAOE 1 3 3 0 5 0 0 0 1988-84)
-I
I D A T E : N O V E M B E R 1985
J O B N U M B E R : S 1 0 2 8 . 0 3

.
4 0 0
3 5 0
3 0 0
2 5 0
- 2000‘t-
B 150ii
100
5 0
0 I I I 1 I I I I I-
0 .I .2 .3 .4 .b .6 .7 .6 .Y
EXCEEDANCE PROBABILITY I F I G U R E 0.3
I LEMHI R I V E RH A B I T A T I M P R O V E M E N T S T U D Y
DAILY FLOW DURATION LEMHIRIVER AT USGS GAGE (MARCH)
DATEr N O V E M B E R 1985
J O B N U M B E R : SlO28.03

s
4 0 0
3 5 0
3 0 0
250
2 0 0
I50
100
5 0
0
EXCEEDANCE P R O B A B I L I T Y
,,.,,,
DAILY FLOW DURATION LEMHIRIVER AT USGS GAGEIAPRIL)
D A T E : N O V E M B E R 1985
J O 8 NWBER: S 1 0 2 8 . 0 3
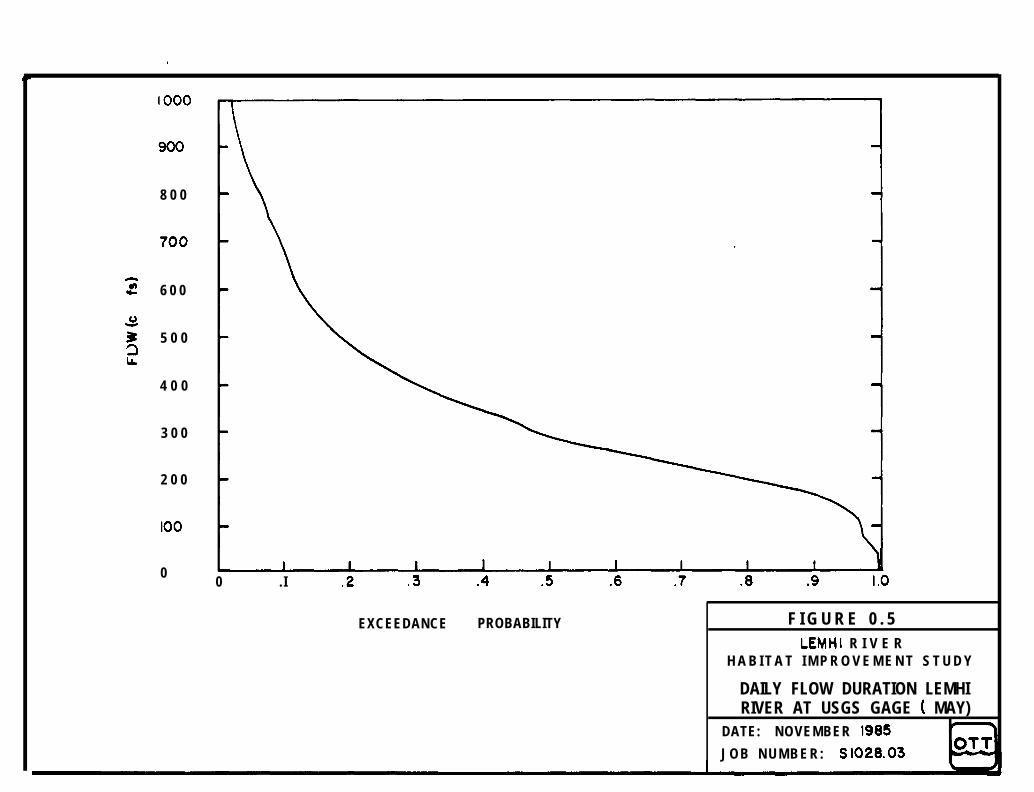
,
8 0 0
z 6 0 0
g 5 0 0
ii
4 0 0
3 0 0
2 0 0
100
00 .I .2 .3 .4 .5 .6 .7 .8 .9 I.0
EXCEEDANCE PROBABILITY F I G U R E 0 . 5LEMHI R I V E R
H A B I T A T I M P R O V E M E N T S T U D Y
DAILY FLOW DURATION LEMHIRIVER AT USGS GAGE ( MAY)
DATE: NOVEMBER 1985
J O B N U M B E R : SlO28.03
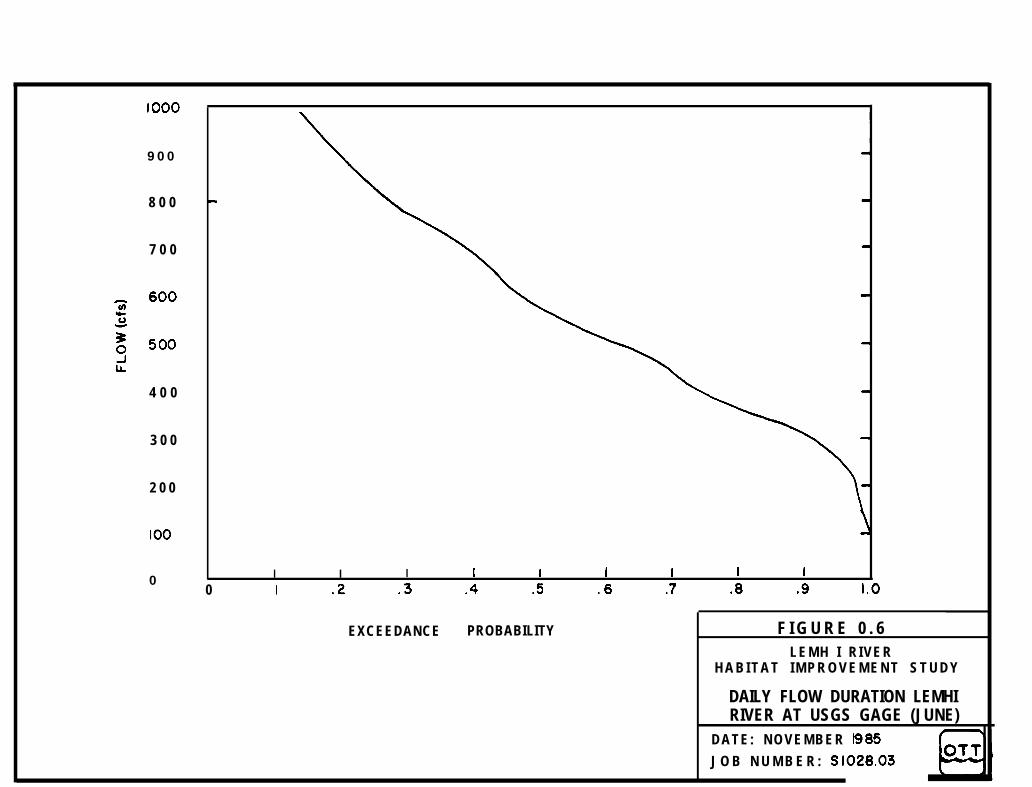
IO00
9 0 0
8 0 0
7 0 0
4 0 0
3 0 0
2 0 0
100
0
L
I I I I I I I I I
0 I .2 .3 .4 .5 .6 .7 .8 .9 I.0
EXCEEDANCE PROBABILITY F I G U R E 0 . 6L E M H I R I V E R
H A B I T A T I M P R O V E M E N T S T U D Y
DAILY FLOW DURATION LEMHIRIVER AT USGS GAGE (JUNE)
D A T E : N O V E M B E R 1985
J O B N U M B E R : SlO28.03
* . . .

IO00 \
9 0 0
8 0 0
7 0 0
0 6 0 0
fY
9 5 0 0 -
3IL
4 0 0 -
3 0 0
2 0 0 c
l o o -
00 .I .2 .3 .4 .5 .6 .7 .8 .9 1.0
EXCEEDANCE PROBABILITY F I G U R E 0 . 7LEMH I R I V E R
H A B I T A T I M P R O V E M E N T S T U D Y
DAILY FLOW DURATION LEMHIRIVER AT USGS GAGE (JULY)
D A T E : NOV---OTTJ O B N U M B E R : S 1 0 2 8 . 0 3
\,

4 0 0
3 5 0
3 0 0
2 5 0
2 0 0
150
100
5 0
0
EXCEEDANCE PROBABILI T Y F I G U R E 0 . 8LEMHI R I V E R
H A B I T A T I M P R O V E M E N T S T U D Y
DAILY FLOW DURATION LEMHIRIVER AT USGS GAGEtAUGUST)
DATE: NOVEMBER 1985
J O B N U M BER: S 1 0 2 8 . 0 3. . .

4 0 0
3 5 0
3 0 0
2 5 0
2 0 0
I50
100
5 0
0
EXCEEDANCE P R O B A B I L I T Y F I G U R E 0 . 9LEMHI R I V E R
H A B I T A T I M P R O V E M E N T S T U D Y
DAILY FLOW DURATION LEMHIRIVER AT USGS G~~SEPTEM~ER)D A T E : N O V E M B E R 1985
J O B N U M B E R : S 1 0 2 8 . 0 3

2 5 0
2 0 0
2 I503sLL
100
5 0
0001 .Ol .05 .I0 .20 .a0 99 95 ,999
(1.00) (1.01) (1.25) (5) (10) (20)
C U M U L A T I V E P R O B A B I L I T Y(RETURN PERIOD (YEARS)) FIGURE 0. IO
L E M H I R I V E RH A B I T A T I M P R O V E M E N T S T U D Y
SPRING I5-DAY LOW FLOWS AT USGSGAGE FOR LEMHI RIVER ( l968- 1984)
D A T E : N O V E M B E R 1985r 5
J O B N U M B E R : S 1 0 2 8 . 0 3pJ\ d

2 5 0
5 0
0 I I I I I I I I I I.OOl .Ol 6
,:,L~~Iv:“~~BA~IL,,:~
.80 $90 .95 .99 .999(1.00) (I .Ol) (5) (IO) fi0) (IO01
(RETURN PERIOD (YEARS))FIGURE 0. II
LEMHI R I V E RH A B I T A T I M P R O V E M E N T S T U D Y
SUMMER IS-DAY LIlW FLOWS AT USGIGAGE FOR LEMHI RIVER (l968- 1984)
D A T E : N O V E M B E R 1985
J O B NUMBERI S 1 0 2 8 . 0 3

200
5 0
0 I I I I I 1 I I I I I.OOl .Ol .05 .I0
(1.00) (1.01)ci.2os) 2 i2q 5 it) 0 $3) 0 $0) 5 .99 ,999
(100)F IGURE 0, I2CUMULATIVE PROBABILITY
( R E T U R N PERIOD ( Y E A R S ) ) LEMH I R I V E RH A B I T A T I M P R O V E M E N T S T U D Y
SPRING 150 DAY LOW FLOWSFOR HAYDEN CREEK (I968 - 1984)
D A T E : N O V E M B E R 1985
J O B N U M B E R : SlO28.03
.. 4 l

2 5 0
2 0 0
50
0 I I I I I I I I I I I
,001 -01 .05 .I0 .20 -50 -80 .90 .95 .99 .999( I. 00) (I.011
CUMUL ATlVil??OB AB,L;fi(5) (IO) (20) mo)
(RETURN PERIOD (YEARS))
I SUMMER 150DAY LOW FLOWSFOR HAYDEN CREEK (ISSS- 1984)
DATE: NOVEMBER l9B5c
JOB NUMBER: SlO28.03pJ

APPENDIX E
UNIT COSTS

APPENDIX E
UNIT COSTS
All Unit Costs are based on the assumptions and conditionspresented in the Cost Computation Parameters section of Chapter 3
CATEGORY/ITEM UNITS UNIT COST
EARTHWORKTrench ExcavationNative Trench BackfillSelect Trench BackfillCommon ExcavationCommon FillSelect FillEngineered FillRock Excavation (General)Rock Excavation (Trench)Rip Rap (Material only)Rip Rap (Placement only)Hauling
CONCRETE & BLOCK CONSTRUCTIONMass ConcreteFloors & Slabs on GradeBlock WallsNonstructural Reinforced ConcreteStructural Reinforced Concrete
PIPEFabricated Steel Pipe
150 PSI12"18"24"30"36"42"48"
Add 20% for orders under 400 ft.
250 PSI1 2"18"24"30"36"42"4 8 "
Add 20% for orders under 400 Ft.
CY $ 3.00CY 1.00CY 16.00CY 1.00CY 1.00CY 10.00CY 6.00CY 25.00CY 35.00CY 15.00CY 20.00CY (2.00+.20/mile)
CYCYSFCYCY
$ 150.00150.00
6.00250.00350.00
LF $ 16.20LF 23.40LF 30.60LF 54.00LF 64.80LF 75.60LF 104.20
LF $ 16.20LF 23.40LF 43.20LF 72.00LF 108.90LF 152.10LF 173.70

UNIT COSTS(continued)
CATAGORY/ITEM UNITS UNIT COST
Pipe cont.Concrete
12" LF $15" LF18" LF24" LF30" LF
Add 20% for orders less than 200 Ft.
Corrugated Metal12"15"18"24"30"
20 FT Section $ 24.0020 FT Section 29.0020 FT Section 32.5020 FT Section 41.5020 FT Section 53.50
PVC12"15"18"
20 FT Section $ 26.0020 FT Section 37.5020 FT Section 51.00
12.0014.5017.0022.0028.00
LANDProductive Farmland AC $1,500.00Dry "Grazing" AC 400.00
WELLS, PUMPS, AND IRRIGATION EQUIPMENTDrilling & Casing $(l0+DIA(in)x2,5)xDepth(ft)
PumpsVolume (for flood irrigation) CFS $1,300.00Pressure(for sprinkler irrigation) CFS 3,000.00
Wheel Line (complete) l/4 MI 6,800.00
ELECTRIC RATES<3,000 kwh/month>3,000 kwh/month
kWh $ .0438$2.86x(kW)+.0323253x(kWh)
MOTORS2hp5hp
EA $ 200.00EA 275.00
POWERLINE MI $45,000.00
FABRICATED STEEL LB $ 2.00

UNIT COSTS(continued)
CATAGORY/ITEM UNITS UNIT COST
WOOD PRODUCTSTimber3/8 Plywood (exterior)5/8 Plywood (exterior)
Mbf $ 350.004'x8' panel 15.004'x8' panel 18.00
GATES AND VALVES
Low Head Canal Gates $12(DIA(in))1-4Valves $ 11(DIA(in)j2
FISHSCREENSPerforated Aluminum SFWedge Wire (stainless) SFAdd 30% for quantities under 200 S.F.
$ 20.0075.00

APPENDIX F
SUBREACH HABITAT DATA

I TABLE F-l
(from Buell 1985a)
Surface areas (in square yards) of six habitat types in 19specific subreaches of the Lemhi River, Idaho.
SUBREACH DATE POOL RIFFLE POCKETWATER SIDECHANNEL BACKWATER(1985)
O-L1Ll-2L2-2BL2B-3W-3BL3B-L3AWA-5
u-7L7-7AL7A-8L8-8AL8A-9L9-10
Ll0-11Lll-12L12-13Ll3-14L14-15Ll5-16L16-17Ll7-18Ll8-19Ll9-19AL19A-20L20-21L21-22L22-22A
L22A-23L23-24L24-25L25-26L26-27L27-28L28-29L29-30L30-30AWOA-31WI-31BL31B-31A
L31A-32L32-33L33-34
6/236/236/236/236/236/236/236/236/236/236/236/246/246/246/246/246/246/236/236/236/246/246/246/246/246/246/246/246/246/246/246/246/256/256/256/256/256/256/256/256/256/256/25
133.3333.33800
3838.337826.673988.334598.17593 l 33
004.4400
50000
4001233.33116.6767066.67133.33250
066.67
1300661.67710
4338.673150
1173.3314441.67
517.5831402211.67
33.33376.67
00
133.33
16857.6715843.335083.33
21171.6739363.333595.0019479.174023.3313916.67
350539.11
112501506.67987010096.6737104366.676433.33113507216.673166.67
14283.3314283.3320733.332766.676616.675078.3344359868.33
2663013205098.332523370406945
18591.6717833767510583.332142.677166.6714004683.33
11960579045308958.3315598.331881.6750001623.339530200174.44
4163.33366.67
8393.3348601783.332843.332226.6748504966.67110023502550
20083.33300116.672271.671848.384091.677160485
1126.674036.672369.331572.6762054837573.83133.33
293.33
333.33
0126.6733.33000
235650
000
66.67116.6716.67
0"83.330
0"
0"
0"00
403.330
165388.33
00
iii
500
156.6700000
100126.67
01743.337800
3700
203.3300000
583.33000
400346.67
0166.67123.2200
50
0"180
1345.6700
156.67194
660043.33 033.33
103.33000
176.6783.3383.33
593.33973.390268.330
183.33000
183.330
133.3300033.3350
0"
.?0
11056.670
263.33888.67
00800
32i.33400.67
0003000

TABLE F-l (continued)
Surface areas (in square yards) of six habitat types in 19specific subreaches of the Lemhi River, Idaho.
L34-35 6/25L35-35A 6/25
L35A-36 6/25L36-38 6/25L38-39 6/25L39-40 6/25L40-41 6/25L41-42 6/25L42-43 6/25L43-43A 6/25L43A-43B 6/25L43B-43C 6/25LAX-44 6/25IA4-45 6/25L45-45A 6/25L45A-45B 6/26L45B-45C 6/26L45C-45D 6/26L45D-46 6/26L46-46AL46A-47 6/26L47-48 6/26
6/26
U8-49 6/26L49-50 6/26L50-51 6/26L51-51A 6/26L51A-52 6/26L52-54 6/26L54-57 6/26L57-58 6/26L58-58A 6/26L58A-58B 6/26L58B058C 6/26L58C-59 6/26L59-60 6/26L60-61 6/26Lbl-62 6/26L26-63 6/27
0133.33
067.6700
3412.58502512.51612.54912.5
051251287.51675
0605912.529753502000
0"1500
1583.33200
000
266.675243.98273015532.57735
8466.672433.3317503.33
017283.3311566.67
2;g121507755437.5850
10387.50
20987.59637.51512.5
013087.51637.5155201375837.5
411905466.677567.6710233.335936 .6727980
02203.331933.3349507283.33635522551817012582
700
433.330
43501100683.331416.671120038758187.51462.514287.5
01847549008787.56009275357513712.541251162.53000
016002783.33550
10333.330
2333.33
2ig.674666.675095.672901.6721178.3310495
00000000000
0”0000
0”0000
13016.67750
00
0”00
0”000000
2812.5000
1312.50000
26.6700500
15009066.6733.330
223.330
1600.51373.16
100043.33000
ii000000
60000 0
00 .
0"0
216.67
3i.331000000
M-i.670
117336.67
1276.67226.67

TABLE F-2(from Buell 1985a)
Surface areas (in square yards) of six habitat types and total fish habitat in five study reaches of the Lemhi River, Idaho.
REACH POOL % RIFFLE % % POCKETWATER % SIDECHANNEL % BACKWATER % TOTAL
01 20965.93 (7.4) 172945.95 (60.7) 83029.43 (29.2) 1245.01 (0.4) 3906.66 (1.4) 2678.31 (0.9) 284771.29
02 29534.59 (9.3) 205166.33 (64.8) 74337.06 (23.5) 1944.99 (0.6) 3622.90 (1.1) 1825.33 (0.6) 316431.20
03 3215.00 (2.5) 109687.33 (83.7) 17187.48 (13.1) 156.67 (0.1) 179.99 (0.1) 574.00 (0.4) 131000.47
04 30008.33 (8.4) 196922.67 (54.9) 125741.66 (35.1) 500 .oo (0.1) 444 1.67 (1.2) 950.00 (.03) 358564.33
05 31508.15 (22.5) 53528.66 (38.3) 47454.01 (33.9) 221.67 (0.2) 4296.99 (3.1) 2879.68 (2.1) 139889.16
RUN

TABLE F-3
(from Buell 1985a)
Surface areas (in square yards) of six habitat types in 14 .specific reaches of Hayden Creek, Idaho below the upper bridgecrossing.
0 H 1 6/27 0 2833.33 116.67 0 0 0Hl-H2 6/27 0 733.33 116.67 0 0 0H2-H3 6/27 0 19233.33 1200 0 0 50H3-H4 6/27 0 120 100 0 0 0H4-H5 6/27 0 14850 216.67 0 0 0H5-H6 6/27 0 483.33 0 0 0 0H6-H7 6/27 0 4466.67 0 0 0 0H7-BCr 6/27 66.67 11150 183.33 0 0 66.67
BC4-H9 6/27 2775 500 825 24300 538.5 0H9-H10 6/27 1900 2787.5 2625 32300 225 0
HlO-Hll 6/28 2475 8850 2100 25337.5 350 100Hll-H12 6/28 1600 5275 1837.5 20712.5 0 0H12-BVCr 6/28 225 337.5 725 2627.5 0 0BVCr-Bridge 7/01 150 20946.67 313.33 860 0 0
Below BVCr
Surface area 6/28percentage 6/28
POOL RIFFLE
9841.67 71619.99(4.5) (36.1)
= Basin Creek=BearValleyCreek
Bridge= upper bridge crossing
10045.84(5.1)
POCKETWATER SIDECHANNEL
106287.50 1112.5(53.6) (0.5)
BACKWATER
216.67 .(0.1)

TABLE P-4(from Buell 1985a)
Surface areas (in square yards) of six habitat types in sixspecific reaches Big Springs Creek, Idaho.
0-BSC2 7/17 100 6090 2393.33 0 10 0BSC2-BSC3 7/17 260 7416.67 3403.33 0 13.33 83.33BSC3-BSC4 7/17 0 850 216.67 0" 6.67 50BSC4-BSC5A 7/17 66.67 1933.33 683.33 20 73.33BSC5A-BSC5 7/17 0 483.33 166.67 0 0 0BSC5-BSC6 7/17 70 7023.33 3356.67 0 466.67 83.33
Surface Area 7/17 496.67 23796.66 10220.00 516.67 289.99Percentage 7/17 (1.4) (67.4) (28.9) (LO, (1.5) (0.8)