lehman sisters - tc...
TRANSCRIPT
Electronic copy available at: http://ssrn.com/abstract=2380036
1
Lehman Sisters
Renée B. Adams University of New South Wales, FIRN and ECGI
Vanitha Ragunathan University of Queensland, FIRN
This version: December, 2013
Abstract
Would the crisis have happened if Lehman Brothers had been Lehman Sisters? Evidence on population gender differences in risk-aversion suggest not. Consistent with the idea that female managers need not be more risk-averse than men, we find that listed banks with more female directors did not engage in fewer risk-taking activities around the crisis and did not have lower risk than other banks. However, banks with more diverse boards had better performances, even in instrumental variable regressions. Our results suggest that more gender diversity is not necessarily associated with less risk. However, diversity may be valuable in crisis situations. JEL Classification: G34; G38; G21; G28; J16; J78 Keywords: Women; Risk-Aversion; Risk; Crisis; Bank; Board of Directors
Adams is at the Australian School of Business, The University of New South Wales, Sydney, NSW 2052, Australia; and Ragunathan is from the UQ Business School, The University of Queensland, St. Lucia, QLD 4072, Australia. Adams: [email protected]; Ragunathan: [email protected]. We are grateful to Paola Sapienza and Luigi Zingales for providing us access to the data in Sapienza, Zingales and Maestripieri (2009). We thank Paola Sapienza and David Matsa for helpful comments. We thank seminar participants at the University of South Australia, National Taiwan University, National Dong Hwa University and brown bag participants at Kellogg Graduate School of Management, the University of Melbourne,the University of Oregon and Queensland University of Technology for helpful comments. Both authors thank the Australian Research Council for financial support. We also thank Moody’s for providing us with estimated default frequency data, Daniel Cox at the Chicago Fed for helpful advice on bank data and Keay Shen See for excellent research assistance.

Electronic copy available at: http://ssrn.com/abstract=2380036
2
At the recent World Economic Forum in Davos, Switzerland, some of the most interesting discussions revolved around whether we would be in the same mess today if Lehman Brothers had been Lehman Sisters. The consensus (and this is among the dead white men who parade annually at Davos) is that the optimal bank would have been Lehman Brothers and Sisters. (Kristof, 2009)
The “Lehman Sisters” fancy assumes that women are less risk-taking, less obsessed with money and status and generally less full of themselves than men. (The Economist, August 6, 2009) 1. Introduction
Neelie Kroes, European Union Commissioner for Competition, famously said “My
clear line is that if Lehman Brothers had been ‘Lehman Sisters,’ would the crisis have
happened like it did? No.” Her arguments were that women are more risk-averse and would
give different perspectives than those of their male colleagues (Kroes, 2009). For similar
reasons, Michel Barnier, Europe’s internal markets commissioner, proposed mandatory
gender quotas on bank boards in 2011 (Treanor, 2011). However, Lehman Brothers was
arguably already “Lehman Brothers and Sisters”. From 1996 until 2007, it had one woman on
the board and in 2004 and 2005 it had two women on the board. Moreover, newspapers are
rife with stories about female bankers who followed very risky strategies. In fact, the creator
of credit default swaps, which many blame for the crisis, was a woman: Blythe Masters, who
at the time was heading JP Morgan's Global Credit Derivatives group. Journalists describe
Erin Callan, who became the chief financial officer of Lehman Brothers in 2007 as following
a “risky, high-profile strategy” (Clark, 2010) and Jamie Dimon, the CEO of JPMorgan Chase,
famously described Ina Drew, his then chief investment officer who was later fired over a $6
billion trading loss, as “bold” (Dominus, 2012).
It is, therefore, not clear that we should expect women working in banks or sitting on
bank boards to be more risk-averse than men. While many experimental and survey-based
studies document that women are more risk-averse than men (see the surveys in Eckel and
Grossman, 2008, Croson and Gneezy, 2009 and the JEBO special issue edited by Croson,
Gneezy and Rey-Biel, 2012) most of these studies are based on samples of college students or
the general population, not top executives. Adams and Funk (2012) provide evidence that
generalizing from the population to the executive ranks may be misleading. In a survey of the
population of directors in Sweden, they show that women on boards of publicly-listed firms
are different both from women in the general population and from male directors in the
values they emphasize. Female directors are more open to change and less conservation-

3
oriented than both their population counterparts and male directors. Moreover, female
directors are less risk-averse than male directors in their sample. One explanation for their
results is self-selection. The women who choose a career leading to a directorship may be
very different from those who do not.1
This problem is likely to be particularly severe for banks. Sapienza, Zingales and
Maestripieri (2009) document that at the University of Chicago only about 36% of female
MBA students choose a risky career in finance (e.g., investment banking or trading), whereas
57% of male students do so. They argue one reason for this may be biological. Individuals
high in testosterone and low in risk aversion were more likely to choose risky careers in
finance in their study. Since these results hold even after controlling for gender, this suggests
that women who choose finance careers are less risk-averse and have higher levels of
testosterone than other women. Using the data from Sapienza, Zingales and Maestripieri
(2009), we confirm that this is true. Moreover, we show that conditional on choosing a
finance career, women are not more risk-averse than men. In fact, although the results are not
statistically significant, women in finance are less risk-averse than men in finance in the
Sapienza, Zingales and Maestripieri (2009) sample.
The data in studies such as Adams and Funk (2012) and Sapienza, Zingales and
Maestripieri (2009) are clearly very stylized. It is possible that in real life situations women
generally behave in a more conservative manner than men, even as directors, and that this
could lead to less risky firm outcomes. Moreover, for outside directors testosterone may not
affect the choice of a directorship in a bank in the same way as it affects the choice of a job in
a financial firm. Whether or not more gender diverse boards of banks engage in fewer risk-
taking activities is therefore an empirical question. We examine this in the context of roughly
300 large publicly-traded U.S. banks and bank holding companies in a 4-year period
spanning the 2007-2008 financial crisis. We focus on commercial banks and bank holding
companies because the gender policies for financial institutions have focused on these types
of banks. For example, the EU recently added quotas for the underrepresented gender in the
management body to new capital requirement directives for banks (e.g. Haslett,
2013).Beyond allowing us to directly examine the “Lehman Sisters” hypothesis, we believe
examining the role of diversity in a crisis is of broader interest. Lorsch and MacIver (1995)
suggest that boards take on a more important role in a crisis. They quote one director as
1 Another explanation could be adaptive behaviour to the requirements of the job. According to recent research, psychological differences between men and women may be influenced by the environment (e.g. Bertrand, 2010).

4
saying (p. 97): “Directors are like firemen. They sit around doing very little until there’s a fire
alarm and then they spring into action.” If the board makes more decisions during the crisis,
the role of diversity may also be more important. In a crisis, corporate performance may
depend more critically on obtaining the different viewpoints that directors with different
backgrounds may bring to the table. On the other hand, Kanter (1977) argues that trust is
more important in uncertain times and social similarity breeds trust. Thus, it is possible that
diversity is more costly during a crisis than in periods of normalcy. To shed some light on the
role of diversity in a crisis, we extend our analysis from risk to bank performance, as well as
measures of individual behaviour.
We first examine the relationship between boardroom gender diversity and various
measures of risk-taking activities in banks, such as the use of mortgage-backed securities. We
then examine the relationship between diversity and various measures of overall bank risk in
an instrumental variable framework. We believe there are several reasons why boardroom
diversity will be endogenous in risk regressions. First, if bank executives believe that women
are more risk-averse then men, they may appoint more women if risk-aversion on the board is
a concern. Second, banks may prefer a more homogenous board as their risk levels increase if
Kanter’s (1977) argument that social similarity breeds trust is true and trust is important as
risk increases.
To deal with the endogeneity problem, we instrument for gender diversity using the
average number of years bank directors interacted with women in either an executive or a
director role at firms other than banks in our sample. Our justification for this instrument is
that for male directors intergender trust should increase the more they work with female
directors. Moreover, the more connections directors have to women they know in an
executive capacity, the more they may appoint women to the board-either because of direct
connections or because of indirect connections their female acquaintances may have to other
women. But, we believe that this measure is unlikely to be correlated with bank outcomes, as
we are primarily measuring exposure of men to women in firms outside of the banking sector.
We find weak evidence that boardroom gender diversity is associated with more risk
taking activities around the crisis. For example, the likelihood that the bank issues mortgage
backed securities is higher in banks with more women and banks with more women do not
engage in more hedging activities. Moreover, total risk is not lower (or higher) when boards
are more diverse, even in instrumental variable regressions, and there is a significant negative
relationship between diversity and bank-specific Z-scores for default risk. However,

5
measures of bank performance are positively associated with diversity in instrumental
variable regressions.
Our performance results raise the possibility that diversity may add value during a
crisis. Although Kanter’s arguments suggest homogenous groups perform better during a
crisis, it is not necessarily clear along which dimension homogeneity is important. The
evidence on risk-aversion for directors in Adams and Funk (2012) suggests that in this
dimension, at least, female and male directors may not be so dissimilar. So it is not clear that
gender-diverse boards should underperform other boards in a crisis. In addition, many argue
that diversity is valuable because it leads to less complacency in decision-making (European
Commission, 2012). This aspect of diversity may be particular valuable in a crisis.
To examine whether there is evidence that more diverse boards behave differently in
ways that could enhance their performance, we follow Adams and Ferreira (2009) and
examine whether female directors seem to behave differently than male directors and whether
boards with more women are different. Consistent with Adams and Ferreira (2009), we find
that male directors are less likely to have attendance problems in banks with more women on
the board and female directors are more likely to serve on committees, especially monitoring
committees. Female directors are also less likely to resign in banks that eventually delist. This
evidence suggests that female directors do behave differently than male directors. We also
find that banks that received TARP funds in our sample were more likely to exit TARP if
they had more women on their boards. This suggests that more gender-diverse boards may
behave differently in ways that are correlated with performance around the crisis.
Although banks with more women perform better in our sample, our results do not
represent compelling evidence for the Lehman Sisters hypothesis. Our conclusions are in
contrast to several recent papers that use corporate outcomes to make inferences about the
preferences of female corporate leaders. For example, Huang and Kisgen (2013) document
that firms with more female top executives make fewer acquisitions and argue the evidence is
consistent with lower female overconfidence. In a related analysis, Levi, Li and Zhang (2013)
assume that women are less overconfident than men. They document that firms with more
female board members make fewer acquisitions and take this as corroborating evidence of
lower overconfidence of women. In a cross country study of mostly private firms, Faccio,
Machica and Mura (2012) document that firms with female CEOs have lower leverage and
less volatile earnings. They interpret their findings as evidence of female risk-avoidance. Our
results may be different because of selection. The pool of female corporate leaders in banks
may be substantially different from the pool of female corporate leaders in non-financial

6
firms. Our results using the Sapienza, Zingales and Maestripieri (2009) sample provides
suggestive evidence that this may be true.
However, our results also do not suggest the opposite, namely that banks with more
women are more risky, as Berger, Kick and Shaeck (2013) argue is the case for their sample
of German banks. As Adams and Funk (2012) argue, the characteristics of female directors
may vary across countries as a function of the institutional environment. If it is more difficult
for women to advance to the executive level in Germany, it is possible that female directors
in Germany are on average much less risk-averse than female directors in the U.S.. This
could explain the differential effect of gender on corporate risk measures across the two
samples.
But, if board-level risk-aversion levels depend on the pool directors come from, then
it is not clear that we should reject quotas on bank boards outright-at least if the rationale for
quotas is to reduce average risk-aversion. If women outside of the regular director pool are
more risk-averse than women already in the director ranks, then average board level risk-
aversion may decrease once a quota is put into place. However, it would be difficult to say
whether the women who would be next in line to fill a board quota would be more risk-averse
than women who already sit on boards. Moreover, as the literature on gender composition in
teams points out (e.g. Aspetiguia, Azmat and Iriberri, 2012), different teams may have
different ways of aggregating individual preferences. Thus, it is unclear that imposing gender
quotas on bank boards would be an effective way of increasing their levels of risk-aversion.
The rationale for quotas is even less compelling if adaptive behaviour plays a dominant role
in shaping board-level risk preferences.
Putting aside the question of whether quotas would affect board risk-preferences, we
believe that policy may still play an important role in improving the representation of women
in the financial services industry. We extend our bank sample using additional board data for
listed banks in Boardex and show that both the levels and the within-firm variation in the
proportion of women on boards appears to be smaller in banking than in a size-matched
sample of non-financial firms. We obtain similar results when we compare banks and size
matched non-financial firms in Riskmetrics data. Consistent with the arguments in Niessen-
Ruenzi and Ruenzi (2011), this suggests that barriers to female representation are larger in
banking than in other industries. More research needs to be done to uncover what these
barriers are, but the evidence in Sapienza, Zingales and Maestripieri (2009) that
proportionally fewer women enter banking than men suggests that the barriers are not
specific to the boards of banks but may already occur at lower levels of the organization.

7
2 Gender differences in risk aversion: some evidence on the importance of selection
A large experimental literature examines differences between risk-aversion between
men and women. In their survey of this evidence, Croson and Gneezy (2009) conclude that
women are indeed more risk-averse than men. But they also suggest that this conclusion may
not generalize to the managerial level or professional populations because of self-selection or
adaptive behavior to the job. Because it is difficult to get managers to participate in
experiments, the evidence on gender differences at the managerial level is scant.
An early paper in this literature by Johnson and Powell (1994) examines betting
behaviour in a random sample of the betting population in the U.K. as well as decisions in
classes of undergraduate students with and without “managerial” education. They find some
gender differences in betting behaviour in the population that they argue are suggestive that
women are more risk-averse than men. However, in their decision-making study, there are no
differences in risk-taking behaviour between male and female students with managerial
backgrounds. Johnson and Powell conclude that one cannot infer how female managers will
behave by observing women who are not managers.
Adams and Funk (2012) try to measure managerial risk-aversion directly using a
survey of corporate directors. As part of a larger survey on psychological characteristics, they
asked directors of publicly-traded companies in Sweden an investment question designed to
measure risk-aversion. They found that female directors were less risk-averse than men.
Moreover, this finding did not reverse even after they controlled for differences in individual
and firm characteristics. Because they also find that female directors and women in the
Swedish population are significantly different in other psychological characteristics, they
argue that self-selection may be important for understanding their findings. Because a career
leading to a directorship is more unconventional for women, the women who choose to
pursue a high-profile career might be precisely the women who are less risk-averse.4
The importance of selection for risk-aversion is likely to be even more important in
the financial services industry. For example, Niessen-Ruenzi and Ruenzi (2011) document
that the fraction of female fund managers in the U.S. equity mutual fund industry is low-it has 4 Self-selection may not be the only reason female directors might be less risk-averse than women in the population. They may also arise because firms only want women with certain characteristics. However, it is unclear whether they are able to screen on the basis of unobservable characteristics.

8
hovered around 10% for the last 20 years. It seems unlikely that the women who nevertheless
choose a career in this industry are very risk-averse. Consistent with this idea, Niessen-
Ruenzi and Ruenzi document that female fund managers perform as well as male managers.5
Sapienza, Zingales and Maestripieri (2009) find that fewer women choose a career in
finance in their sample of University of Chicago MBA students. They argue that one reason
for this may be biological. In their sample, women have lower levels of testosterone and
testosterone is positively correlated with the likelihood of choosing a career in finance. They
also document that testosterone is negatively correlated with risk-aversion and that women
have higher levels of risk-aversion on average.
Using their data, we can provide some evidence on the importance of selection for the
risk-aversion of women who might eventually end up being executives on the boards of
banks. In particular, we ask whether the women who choose a career in finance have different
characteristics than the women who do not choose a career in finance and what the gender
differences in testosterone and risk-aversion look like conditional on choosing a career in
finance.
<Insert Table I about here>
The sample consists of data on the entire cohort of MBA students in 2008 (550
students). Testing problems and refusal by some students to be included in the sample means
not all variables have 500 observations. The data includes the premium individuals would pay
to avoid a lottery as a measure of risk-aversion, measures of salivary and pre-natal
testosterone (Baron-Cohen eye test and Average 2D:4D Digit ratio), gender and career
choice. In Table 1 we first provide summary statistics for the full sample, stratified by men
and women. We then provide summary statistics separately for the group of students who
chose a career in finance and those that did not. We also report the differences in means
between men and women and the t-statistics for the tests of equality of means across gender,
as well as the corresponding statistics within gender but across finance and non-finance
careers.
The full sample results show that women are more risk-averse than men. On average
they will pay $20.18 to avoid the lottery; this is $7.49 dollars more than the average for men.
Women also have lower levels of salivary testosterone, 48.72 as compared to 100.91 pg/ml.
They score higher on the Baron-Cohen eye test and have larger 2D:4D ratios, both of which
indicate lower pre-natal testosterone. The full sample summary statistics are thus consistent
5 Niessen-Ruenzi and Ruenzi (2011) document that female fund managers experience fewer inflows, which they attribute to gender discrimination.

9
with the general conclusions from the experimental literature that women are more risk-
averse than men.
However, the full-sample averages mask important variation in these characteristics
for women, as is evident when we compare means within gender but across career choice.
Men in finance are not significantly different from other men in any dimension except the
2D:4D ratio, which is 0.02 lower for men in finance (significant at the 5% level). In contrast,
women in finance are significantly different from other women in all but salivary
testosterone. Moreover, these differences are relatively large as compared to the differences
between men and women. For example, women in finance would pay $10.85 less than other
women to avoid the lottery. This is a 45% larger difference in risk-aversion than the
difference between men and women in the full sample. Similarly, the difference between
women in finance and other women is 53% greater than the difference between men and
women in the full sample for the Baron-Cohen eye test and 50% greater for the 2D:4D ratio.
Since women in finance appear very different from other women, but men in finance
do not appear very different from other men, gender differences within occupations should be
different. When we compare men and women outside of finance, we observe that the gender
differences in characteristics are all larger than in the full sample. For example, women are
24% more risk-averse than men outside of finance. In contrast, gender differences almost
disappear for men and women in finance. Other than the differences in salivary testosterone,
none of the differences are statistically significant. Moreover, the magnitudes of the
differences are small. For example, the difference in the Baron-Cohen eye test goes from -
0.70 in the full sample to -0.12 in the finance sample and the 2D:4D ratio goes from -0.02 to -
0.004. Most notably, the difference in premia to avoid the lottery between men and women is
positive in the finance sample. Although the difference is not statistically significant, it
appears that, if anything, women in finance are less risk-averse than men in finance.
Depending on the context, Table 1 suggests that generalizing from characteristics of
women in the population at large to subpopulations of women may be misleading. This
should be particularly true if the characteristic under consideration plays a key role in the
selection into the subpopulation. In this case, risk-aversion and testosterone play a key role in
selection into a finance career, as Sapienza, Zingales and Maestripieri (2009) argue. Thus,
women in finance will have lower risk-aversion and higher testosterone than other women.
Since it is plausible that risk-aversion and testosterone will also play a role in women’s
choice to pursue a career leading to a bank directorship, both for executive and outsider
directors, we believe that it is not clear that female bank directors will be more risk-averse

10
than male bank directors. As such, we do not expect risk to be lower in banks with more
gender-diverse boards.
3 Data and Comparisons to Non-Financial Firms
3.1 Sample data
We obtain data on listed bank holding companies and commercial banks for the fiscal
years 2006-2009 from several sources. The initial sample includes all firms in Compustat
with SIC codes 6000 to 6300. We restrict this sample to regulated banks by matching their
CRSP permcos to the regulatory entity codes of supervised financial institutions using the
2007 CRSP-FRB Link file of the Federal Reserve Bank of New York.6 We end with a sample
of 365 banks with proxies available at some point during the sample period. This is close to
the number of banks (372) in Aebi, Sabato and Schmid (2012), who use a slightly different
sample selection procedure. In Appendix Table I, we provide basic information about our
sample for each year. The bulk of the sample consists of bank holding companies. Since a
number of banks failed since 2007, the decline in the number of banks with proxies from 350
to 296 over the four year period is not surprising.
<Insert Table II about here>
We collect a wide variety of data to proxy for bank activities that might be related to
risk-taking, bank risk, bank performance, bank capital structure and the governance structure
of banks. The financial information for our sample comes from three sources. Accounting
data comes from Compustat and the Financial Institution Reports (FR Y-9C and FR Y-9SP
Call Reports for large and small bank holding companies respectively and the Report of
Condition and Income for Commercial Banks) collated by the Federal Reserve. Stock price
data is from CRSP. In Table II, we provide summary statistics for our sample. We describe
the construction of some of the variables below; the Appendix provides detailed descriptions
of all variables as well as the data sources. Average bank size, as measured by the book value
of assets, is approximately $31 billion in our sample. The Tier one capital ratio is on average
11.40, much higher than the 4% required by the Basel II Accord. We define the loan ratio as
total loans deflated by the book value of total assets. On average, loans account for 70% of
assets. We document an average deposit-to-loan ratio of 1.16, implying that the banks lend
approximately 90 cents for each dollar they receive in deposits.
6 The version of link file we used was valid from January 1990 to December 2007. This means that Goldman Sachs which became a BHC in late 2007 is not in our dataset.

11
To measure risky activities, we obtain information on the use of derivatives from the
Financial Institution Reports (Schedule HC-D). Derivatives for trading purposes account for
approximately 35% of assets. Like Ellul and Yerramilli (2010), we find that banks use
derivatives for hedging sparingly – they only account for 4.1% of total assets. We also
measure the amount of trading assets in a bank’s trading portfolio that are considered to be
risky. Banks only need to report this data item if risky assets are more than $2m during any of
the four preceding quarters. We account for potential threshold effects by using an indicator
variable, Risky-Trading t, that is one when banks report that they have risky assets for trading
purposes and zero when risky assets are either zero or missing. We also use a variant, Risky
Trading d, that records missing values as missing.
We use stock returns to estimate proxies for bank risk, such as the standard deviation
of weekly stock returns, Idiosyncratic risk and Tail risk. For Tail risk, we follow the approach
of Acharya et al. (2010) of measuring it as the average returns for the bank estimated over the
5% worst days for the market. As measures of default risk we use the Estimated Default
Frequency (EDF) data from Moody’s Analytics and a Z-Score. Like Laeven and Levine
(2009), we compute the Z-Score as the sum of ROA and the capital asset ratio scaled by the
standard deviation of ROA over last four quarters. From the 10-K filings we collect
information on all aspects of TARP financing including the dates of repayment. From the
National Information Center dataset, we obtain delisting information.
We define Tobin’s Q, one of our proxies for performance, as the ratio of the firm’s market
value of assets (book assets minus book equity plus market value of equity) to its book value
of assets. The average Tobin’s Q is 1.035 with a range from 0.899 to 3.115. We also use the
fraction of bad loans (bad loans/total loans) as a performance measure. Roughly 2.1% of the
banks’ loan portfolios end up being classified as non-performing during this period.
Because banks are underrepresented in several common governance databases, we
obtain governance information from the banks’ proxy filings. We collect information on
board size, the number of independent directors, attendance records at board meetings, the
number of board meetings and committee memberships.11
Mean board size is eleven directors. The fact that it is lower than the mean board size
of 18 in Adams and Mehran (2003) for the period 1986-1999 is consistent with the general
downward trend in bank board size that they document. Female directors make up 9.5%
11 Since the proxy lists the names of directors standing for election in the upcoming annual meeting, we calculate board size as the number of nominees minus the number of directors newly nominated plus the number of directors that were described as having left the board during the previous fiscal year or who were not standing for re-election.

12
percent of the board, which is similar to the proportion of female directors (8.5%) Adams and
Ferreira (2009) document for industrial firms but for an earlier time period: 1996-2003. Only
0.6% of directors are female bank executives.
<Insert Table III about here>
The total number of unique directors in our sample is 4,871. We source their
individual characteristics from BoardEx, a database created by Management Diagnostics
Limited. To obtain director information, we hand-matched the names of directors in our
sample to those in BoardEx. This step is necessary to eliminate matching errors that may
arise when there are multiple directors with the same name and also because of subtle
differences in names across databases such as the inclusion of a director’s title in the
BoardEx name field. We are able to match the names of all but 57 directors. As panel A of
Table III shows, 80% of directors serve on committees. Directors are on average 61 years old
and they are on the boards of 1.23 public companies. Their tenure on the board of the sample
bank (the difference between the sample year and appointment year) is nine years.
Female directors account for 9.9 per cent of director-years. They are younger (58.63 vs.
61.57), have less board experience and shorter board tenures relative to their male
counterparts. A higher proportion of female directors sit on committees (84% vs. 79%) and
when they do serve, they are on more committees than male directors. The differences in
averages across genders for all characteristics are statistically significant at the 1% level.
3.2 Are banks different when it comes to boardroom gender diversity?
Implicit in the “Lehman Sisters” hypothesis is the assumption that women are
relatively underrepresented on bank boards and perhaps more so than on the boards of non-
financials. To put the 9.5% average representation of women in our sample into perspective,
we compare the representation of women on bank boards to their representation on a size
(book value of assets) matched sample of non-financial firms. Consistent with the literature
on board composition and diversity on boards, we measure representation in terms of
percentages. We adjust for firm size because Adams and Kirchmaier (2013) show that
women are much less likely to sit on the boards of smaller firms and our sample contains
both large and small banks.
We take the intersection of our sample with BoardEx and require that banks have at
least 4 years of data in the period 2003-2010, a period for which BoardEx coverage is
relatively representative of the US market (Adams and Kirchmaier, 2013). We end with a
sample of 321 banks. We define industrial firms in BoardEx to be firms with SIC codes

13
outside of 6000-6300 (financial firms) and SIC code 4900-4949 (utilities). We match banks
to industrial firms on the book value of assets (from Compustat) with replacement. A bank’s
control firm is the best match within 30% of the bank’s assets. In Figure 1 we plot the
percentage of women on bank and matched industrial firm boards. The percentage of women
on bank boards is lower than for industrial firms throughout the whole period except in 2008
where the percentage of women on industrial firm boards drops to the same level as in
banking.
<Insert Figure 1 about here>
To examine whether the relative underrepresentation of women on bank boards looks
different if we focus only on larger banks, we construct an alternative sample of banks and
size matched industrials in the S&P 1500 using Riskmetrics’ board data. We define industrial
firms as for the BoardEx sample and define banks as firms with SIC codes 6000-6300. We
use the same matching procedure as for the BoardEx sample. Once we restrict our sample to
banks with at least 4 years of data between 1996 and 2010, we end with a sample of 192
banks with matching control firms. Even though the banks in the Riskmetrics sample have
higher percentages of female directors than the banks in the BoardEx sample, Figure 1 shows
that women still appear to be relatively underrepresented on their boards.
What is also noticeable from Figure 1 is that there is more variation in the average
percentage of women on the boards of industrial firms both in the BoardEx and the
Riskmetrics sample. It is plausible that this is the result of greater within-firm variation in the
percentage of women on boards of industrial firms. We provide some suggestive evidence
that this is true in Figures 2 and 3. Because we are interested in within-firm changes, we no
longer restrict ourselves to matching firms whose identity may change depending on the best
match. To still ensure some degree of comparability, we focus on the 194 banks and 1,865
industrial firms with at least 4 years of data in the Riskmetrics sample. For each firm, we
calculate both the absolute value of the year-to year differences in the percentage of women
on the board, as well as the average percentage of women over all years the firm appears in
the sample. In Figure 2, we show separate boxplots of the differences and the averages for
banks and industrial firms. The line intersecting the box denotes the median. The lower/upper
edges of the box denote the 25th/75th percentiles.
<Insert Figure 2 about here>
Figure 2 suggests that the distribution of year-to-year differences is more spread out
for non-financial firms than for banks because there are more extreme values for non-
financial firms. In contrast, the maximum values for the averages are attained by banks,

14
although the difference between the 75th and 25th percentile is larger for non-financial firms.
In Figure 3, we restrict our sample to firm-year observations for which the percentage of
women on the board of the firm in the previous year was non-zero. This figure suggests even
more strongly that for firms with women on the board, there is greater within-firm variation
for non-financial firms than for banks.
<Insert Figure 3 about here>
These comparisons suggest that the implicit assumption underlying the “Lehman
Sisters” hypothesis is correct. Women are relatively less represented on the boards of banks
than on the boards of non-financial firms of similar size. While there is cross-sectional
variation in the percentage of women on bank boards, there is less within-firm variation in
their representation than is the case for non-financial firms.
3.3 Our instrument for gender diversity
Because there is little within-firm variation in gender diversity in banks, we focus on
instrumental variable methods to address endogeneity problems in our analysis of both risk
and performance instead of using firm fixed effects as in Adams and Ferreira (2009) and
Matsa and Miller (2013). Adams and Ferreira (2009) argue that connections of directors to
women help to explain the presence of women on the board. They use a measure of
connections male directors have with women through other board seats in their sample as
their instrument for the proportion of women on the board. As our sample consists only of
banks, using a within-sample measure of connections is not feasible for us. Federal Reserve
Regulation L generally prohibits a management official (including directors) from serving at
two non-affiliated depository institutions, depository institution holding companies, or any
combination thereof, in situations where the management interlock would likely have an
anticompetitive effect. Thus, bank directors will not have multiple bank directorships.
Instead, we construct a related measure using data on career experience that is available in
BoardEx.
Since BoardEx provides start dates of relationships, we focus on the average length of
the professional relationships directors have with women instead of the number of
connections. Our argument is that if directors started working with women earlier in their
careers, there is a greater chance that the board will have more women. First, directors with
longer connections to women may be more comfortable working with women. Second, they
may have more direct and indirect connections to women who could be potential nominees
for board positions. We document that our instrument is positively and significantly

15
correlated with the percentage of women on the board later in the paper. For our instrument
to be valid it also needs to satisfy the exclusion restriction. We believe it is unlikely that work
experience with women in the past should be directly correlated with bank outcomes except
through the effect of boardroom gender diversity. Since there are few women in top positions,
it is plausible that for male directors most connections to women occur by chance. For female
directors, the greater incidence of connections to women may partly be driven by industry
characteristics. While it is possible that non-banking industry experience of female directors
matters for bank outcomes, its effect should also operate through the percentage of women on
the board. 15
To calculate our instrument, relationship length, we download network information
for each director from BoardEx. The director’s network contains the names of all individuals
and the name of the organization(s) through which they are connected, the type of the
organization, the role of both individuals and the years when they overlapped. BoardEx
classifies a relationship as either current (the end date of the relationship is either missing or
occurs after the sample year) or historical (the end date predates the sample year).16 We
consider both types of relationships after excluding the names of other directors on the bank
board from the list of connected people. Because we are interested in work experience, we
only consider connections where at least one of the individuals – the director and/or the
person in his network – sits on the board of the organization on which they overlap. To
classify the gender of each person in the director’s network, we use the lists of first names
from the US census bureau. We search the web to classify remaining names.
In Table III, we provide some summary statistics for network information. On average
bank directors have 131.79 connections. The range is between 38 and 3276 individuals.
Female directors have on average more connections than male directors (161.12 versus
129.69), which suggests that connections may be relatively more important for them. On
average, directors have 15 women in their networks, but with 23.2 women in their networks
female directors are more connected to other women.
For each director we calculate the length of a relationship they have with a woman in
a professional capacity as the difference between the sample year and the start year of the
relationship. We then average this at the director level. Our instrument is the board-level
15 We exclude our sample banks from the sample of connections we consider in the construction of our instrument. Thus, the connections to women would generally not include connections established while working in a bank unless they were at a relatively small bank. 16 We lose data as BoardEx does not retain network information for deceased directors.

16
average of the individual averages. The mean value is 11.18 years with a standard deviation
of 5.251.
4. Boardroom gender diversity and bank risk
Based on the evidence from Section II, we are sceptical that female bank directors are
more risk-averse than male bank directors. But the measures of risk-aversion we examine are
obviously very stylized. Faced with real-world decisions female directors may advocate for
less risky decisions. Alternatively, the presence of female directors may lead the boards to
behave in a more conservative manner. Because of the need to reconcile differences in
opinions that arise because female directors may have different backgrounds or values (e.g.
Adams and Funk, 2012), it is possible, for example, that boards with more women spend
more time discussing optimal strategies. More deliberation could lead banks to undertake less
risky strategies if there is uncertainty about the distributions of the payoffs of investment
projects. Whether or not banks with more female directors have less risky outcomes is,
therefore, ultimately an empirical issue.
To examine the relationship between boardroom gender diversity and risk in banks,
we first examine how the presence of female directors is associated with investments in risky
assets. We then examine how they are associated with measures of overall bank risk. To
examine bank behaviour, we examine banks’ use of derivatives for hedging and trading
purposes; their risky trading and mortgage backed security positions and two measures of
non-traditional banking activities: the ratio of deposits to loans and the percentage of non-
traditional income. We expect greater hedging and more deposits to loans to be associated
with less risk, but all other measures to be associated with more risk. Because relatively few
banks have derivative positions, we examine both the presence of derivatives of a certain
type, as well as the magnitudes of the positions.
<Insert Table IV about here>
Univariate comparisons of investments in risky assets in Table IV do not provide
immediate support for the Lehman Sisters hypothesis. The banks with female directors have
larger risky trading, derivative trading and mortgage-backed security positions, but also
larger derivative hedging positions. But these differences may simply reflect differences in
bank size, since women are more likely to sit on the boards of large firms. In Table V, we
regress our investment measures on bank characteristics such as ln(assets) as a proxy for bank
size, the Tier 1 capital ratio, the deposit and loan ratios and ROA. We also add board size and
independence and the fraction of female directors. Beneath the constant, we also report the

17
coefficient on the fraction of female directors in a basic specification that only includes board
size, indpendence and bank size. All regressions include year dummies. To correct the
standard errors, we treat observations for the same bank within the 2007-2008 crisis period
and outside of that period as correlated, but uncorrelated across crisis and non-crisis years. In
columns I, III, V, VI and VIII our dependent variables are dummy variables that indicate that
the bank discloses the use of the corresponding derivative. In all other columns our dependent
variables measure the size of the position.
As expected, bank size is positively and significantly correlated with the usage of all
securities, as well as the deposit to loan ratio and the percentage of non-traditional income.
Larger banks also have larger positions in all securities except mortgage-backed securities.
The coefficient on the fraction of women is only statistically significant in columns IV, VII
and VIII. These regressions suggest that the fraction of women is positively correlated with
the natural logarithm of the ratio of the value of derivatives that banks hold in their trading
portfolios to total assets, the corresponding measure for risky derivatives and the presence of
mortgage-backed securities. If anything, the presence of more women seems associated with
more risk-taking investments rather than fewer.
<Insert Table V about here>
We use stock return volatility, idiosyncratic risk, a bank specific z-score, the
estimated default frequency from Moody’s and a measure of tail risk as measures of bank
risk. In Table VI, we regress them on bank size, Tier 1 capital ratio, ROA the loan and
deposit ratios and the fraction of non-performing loans, as well as board size and
independence and the fraction of women. Because the measures of investment behaviour we
examine in Table V are also likely to affect overall bank risk, we include the dummies for
derivative trading, risky trading, hedging and mortgage-backed securities, as well as the
percentage of non-traditional income in a second specification for each dependent variable.
We include year dummies and correct standard errors as in Table V.
Consistent with expectations, larger banks display lower idiosyncratic risk, lower
estimated default frequency and lower tail risk. The coefficient on the fraction of women is
statistically significant only for the z-score. Since larger z-scores are associated with lower
risk, the z-score regressions suggest that banks with more women have greater default risk.
Once again, our evidence appears inconsistent with the Lehman Sisters hypothesis. However,
there are at least two reasons to be concerned about endogeneity in these regressions. First,
banks may appoint women precisely because they use the evidence form population gender
gaps to infer that they are more risk-averse than men. This could lead to a positive correlation

18
between women and risk as more risky banks appoint women in an attempt to reduce risk. On
the other hand, Kanter’s (1977) argument that homogenous groups perform better in volatile
environments could lead riskier banks to appoint fewer women. This would result in a
negative correlation between risk and women.
<Insert Table VII about here>
In Table VII we replicate the specifications in Table VI using instrumental variable
analysis. Our instrument is relationship length with women. In columns I and VII we report
the first stage regressions associated with the two specifications we use for each dependent
variable. In both specifications the coefficients on the instrument are positive and statistically
significant at the 1% level. The Kleibergen-Paap statistic for weak instruments is 19.87 in
column I and 12.9 in column VI suggesting that the instrument is reasonably strong. Columns
II-VI provide the second stage regressions corresponding to the basic specifications in Table
VI and columns VIII-XII provide the expanded specifications. Even in the IV regressions, we
find no support for the Lehman Sisters hypothesis. The coefficients on the fraction of female
directors are significant only for the z-score and they are still negative.
5. Does boardroom gender diversity matter for banks?
One explanations for the lack of a correlation between the fraction of female directors
and measures of risky investments and risk is that boardroom gender diversity does not
matter at all. Thus we examine the relationship between the fraction of female directors and
our three performance measures: Tobin’s Q, ROA and the fraction of non-performing loans.
We use similar specifications as in Table VII, except that we also add volatility and the
fraction of nonperforming loans to the Tobin’s Q and ROA regressions and we exclude ROA
(the fraction of non-performing loans) from the ROA (non-performing loan) regressions. In
columns II, IV and VI of Table VIII we report the coefficients on the fraction of female
directors in OLS regressions beneath the constant. The other coefficients belong to the second
stage of IV regressions with relationship length as our instrument. Columns I, III and V
report the corresponding first-stage regressions. The coefficients on the fraction of female
directors in columns II and IV are positive and significantly significant, suggesting that banks
with more women have higher Tobin’s Q and ROA. Although the coefficient on the fraction
of female directors is not significant in column VI, it is negative which suggests that banks
with more women have fewer non-performing loans.
<Insert Table VIII about here>

19
The results from Table VIII suggest that boardroom gender diversity matters for
banks. At first glance the positive relationship appears surprising since neither Adams and
Ferreira (2009) nor Matsa and Miller (2013) find a positive relationship between board
diversity and performance in performance regressions. However, Lorsch and MacIver (1995)
suggest that boards take on a more important role in a crisis. They quote one director as
saying (p. 97): “Directors are like firemen. They sit around doing very little until there’s a fire
alarm and then they spring into action.” If the board is more important during the crisis, the
role of diversity may also be more important. In a crisis, corporate performance may depend
more critically on obtaining the different viewpoints that directors with different backgrounds
may bring to the table. Some evidence that this may be true comes from Adams and Ferreira
(2009). They find that CEO turnover-arguably a firm-level crisis event-is more sensitive to
performance when there are more women on the board.
<Insert Table IX about here>
To provide additional evidence that board with more gender diversity may behave
differently in ways that may be associated with better performance, we follow Adams and
Ferreira (2009) and (2013) and examine data on director-level behaviour. In Table IX, we
regress a measure of attendance problems (a dummy indicating that the bank’s proxy named
the director as attending fewer than 75% of the meetings he was supposed to attend) on
individual director characteristics (such as the director’s gender, the number of directorships,
her age and tenure), board characteristics (such as the number of board meetings, board size
and independence) and bank characteristics as in previous specifications. As in Adams and
Ferreira (2009) we include year and firm fixed-effects and correct the standard errors at the
director-firm level. In column I of Table IX, we use the full sample of director-level data. In
column II, we restrict the sample to male directors and use the fraction of women on the
board as the main explanatory variable.
The coefficient on the female director is negative but not significant. One reason why
the results may be different from those in Adams and Ferreira (2009 and 2013), who
document that women have better attendance records than men in both non-financial firms
and banks, is that bank directors face greater pressure to attend meetings during the crisis.
However, the coefficient on the fraction of female directors is negative and significant at the
1% level in column II, which is consistent with Adams and Ferreira’s (2009) results that male
directors have better attendance behaviour when there are more women on the board.
As an alternate measure of director behaviour that may be particularly relevant in the
crisis is director departure. In columns III and IV our dependent variable is a dummy which is

20
one if the director’s name does not appear in the following year’s proxy statement. In column
III we use the full sample, in column IV we restrict the sample to banks that were in more
difficulties than the others. We classify banks as having particular difficulties if they
eventually delisted. The coefficient on female is negative but statistically significant only in
column IV. For problem banks at least, female directors seem less likely to depart from the
board. This may be a valuable quality for troubled banks.
<Insert Table X about here>
In Table X, we examine which committees female directors sit on. Our dependent
variable is a dummy indicating whether or not a director sits on committees in columns I and
II. In columns III and IV, our dependent variable measures whether a director sits on
“monitoring” committees. In columns V and VI, our dependent variable measures whether a
director sits on the risk committee. As in Adams and Ferreira (2009), we find that women are
more likely to serve as committee members and more likely to sit on monitoring committees
than male directors. Perhaps surprisingly, but consistent with the idea that female directors
need not be more risk-averse than male directors, female directors are not more likely to sit
on the risk committee.
While the performance and individual behaviour regressions suggest that bank boards
with more women behave differently and female directors behave differently from male
directors, none of the measures we examine are specific to the crisis. In Table XI, we
examine one measure of performance that is specifically related to the crisis: the likelihood of
repaying TARP funds for banks that received TARP. The dependent variable in column II is
a dummy indicating the bank repaid TARP. Column II shows the second stage of an IV
regression with relationship length as our instrument. The corresponding first stage is in
column I. The coefficient on the fraction of women is positive and significant, which suggests
that banks with more gender-diverse boards had different crisis outcomes.

21
6. Conclusion
Women are not all the same. Because of selection, generalizing from gender
differences in the population to the management level may be stereotyping. Using data from
Sapienza, Zingales and Maestripieri (2009) we document that women who enter into a
finance career can be significantly different in their risk-aversion levels than women who do
not enter into the finance profession. As a result, women in finance may have the same
average levels of risk-aversion as men in finance. We also show that banks with more female
directors did not undertake fewer risky activities or exhibit less risk during the crisis. But this
does not mean that gender diversity does not matter at all. Banks with more women
performed better than other banks; their male directors had fewer attendance problems and
they were more likely to repay TARP. Female directors performed different committee duties
than male directors and had different resignation behaviours.
Our results highlight that we do not yet have a complete understanding of how and
why gender diversity matters for corporate outcomes. We also do not know when diversity
matters. Much more research remains to be done to fully understand the role of gender in
corporate management. As such, the consequences of policies targeting boardroom gender
policies are unclear. But we doubt that simply adding more women to bank boards will
prevent future crises.

22
References
Acharya, Viral, Pedersen, Lasse, Philippon, Thomas and Richardson, Matthew (2010), “Measuring Systemic Risk.” Working Paper, New York University.
Adams, Renée B. and Tom Kirchmaier (2013) “Making it to the top: from female labor force participation to boardroom gender diversity”, papers.ssrn.com/sol3/papers.cfm?abstract_id=2192918.
Adams, Renée B. and Daniel Ferreira (2009) “Women in the boardroom and their impact on governance and performance,” Journal of Financial Economics 94(2), 291–309.
Adams, Renée, John Nowland and Steve Grey (2011) “Does Gender Matter in the Boardroom? Evidence from the Market Reaction to Mandatory New Director Announcements,” Available at SSRN: http://ssrn.com/abstract=1953152.
Adams, Renée, Licht, Amir and Sagiv, Lilach (2011), “Shareholderism: Board Members' Values and the Shareholder-Stakeholder Dilemma.” Strategic Management Journal, doi: 10.1002/smj.940.
Adams, Renée B. and Funk, Patricia C. (2012) “Beyond the Glass Ceiling: Does Gender Matter?” Management Science 58(2), 219–235.
Ahern, Kenneth and Dittmar, Amy (2012) “The Changing of the Boards: The Impact on Firm Valuation of Mandated Female Board Representation,” The Quarterly Journal of Economics, 127, 137-197.
Albrecht, James, Bjorklund, Anders and Vroman, Susanne (2003), "Is there a glass ceiling in Sweden?" Journal of Labor Economics 21(1), 145-177.
Alesina, Alberto, Paola Giuliano and Nathan Nunn (2012) “On the Origins of Gender Roles: Women and the Plough,” Working paper, Harvard University.
Apesteguia, Jose, Azmat, Ghazala and Iriberri, Nagore (2012), “The Impact of Gender Composition on Team Performance and Decision-Making: Evidence from the Field”, Management Science 58(1), 78-93.
Berger, Allen N. & Kick, Thomas & Schaeck, Klaus, 2012. "Executive board composition and bank risk taking," Discussion Papers 03/2012, Deutsche Bundesbank, Research Centre.
Bertrand, Marianne (2010) “New Perspectives on Gender” Handbook of Labor Economics, Volume 4b, Elsevier Ltd. ISSN 0169-7218, DOI 10.1016/S0169-7218(11)02415-4. 1545-1592.
Bertrand, Marianne (2010), “CEOS”, Annu. Rev. Econ. 1, 121–49.
Bertrand, Marianne, Goldin, Claudia and Katz, Lawrence F. (2010), "Dynamics of the Gender Gap for Young Professionals in the Financial and Corporate Sectors." American Economic Journal: Applied Economics 2, 228-255.
Bertrand, Marianne, & Hallock, Kevin. (2001) “The gender gap in top corporate jobs,” Industrial and Labor Relations Review 55, 3-21.

23
Bearman, Lori, Esther Duflo, Rohini Pande and Petia Topalova (2012) “Female Leadership Raises Aspirations and Educational Attainment for Girls: A Policy Experiment in India,” Science Magazine, February 2012, Vol. 335 no. 6068.
Black, Sandra E. and Chinhui Juhn (2000) “The Rise of Female Professionals: Are Women Responding to Skill Demand?” American Economic Review, 90(2), 450-455.
Blau, Francine D. and Lawrence M. Kahn (2003) “Understanding International Differences in the Gender Pay Gap” Journal of Labor Economics, 21(1), 106-144.
Bøhren, Øyvind and Siv Staubo (2012) “Changing organizational form to avoid regulatory constraints: The effect of mandatory gender balance in the boardroom” Working paper, Norwegian School of Business.
Botero, Juan, Simeon Djankov, Rafael La Porta, Florencio Lopez de Silanes and Andrei Shleifer (2004), “The Regulation of Labor,” Quarterly Journal of Economics, 119(4), 1339-1382.
Branson, Douglas M. (2006), No Seat at the Table: How Corporate Governance Keeps Women Out of America's Boardrooms, NYU Press, New York.
Catalyst (2012) “Women on Boards,” Available electronically.
Croson, Rachel and Gneezy, Uri (2009), “Gender Differences in Preferences,” Journal of Economic Literature 47(2), 1-27.
Croson, Rachel, Uri Gneezy and Pedro Rey-Biel (2012) eds. Gender Differences in Risk Aversion and Competition, Journal of Economic Behavior and Organization, Volume 83, Issue 1, Pages 1-172
Dohmen, Thomas, Falk, Armin, Huffman, David and Sunde, Uwe (2005), "Which Representative Agent? Heterogeneity, Correlation and Determinants of Risk, Time, and Social Preferences," IZA Working Paper.
Dohman, Thomas, Falk, Armin, Huffman, David and Sunde, Uwe (2012), “The Intergenerational Transmission of Risk and Trust Attitudes,” Review of Economic Studies 79(2), 645-677.
Davies, Lord (2011) ‘Women on Boards’. Available electronically.
Doldor, Elena, Susan Vinnicombe, Mary Gaughan and Ruth Sealy (2012) “Gender Diversity on Boards: The Appointment Process and the Role of Executive Search Firms,” Equality and Human Rights Commission Research report 85, Available electronically.
Duchin, Ran and Sosyura, Denis (2012), “Safer Ratios, Riskier Portfolios: Banks’ Response to Government Aid,” Forthcoming Journal of Financial Economics.
Eckel, Catherine C. and Grossmann, Philip J. (2008), "Men, Women and Risk Aversion: Experimental Evidence," in: Plott, C., and V. Smith, Handbook of Experimental Results.
Eckstein, Zvi and Osnat Lifshitz, (2011) “Dynamic Female Labor Supply”, Econometrica, Vol. 79, No. 6, 1675–1726.

24
European Commission (2012) “Proposal for a directive of the European Parliament and of the Council on improving the gender balance among non-executive directors of companies listed on stock exchanges and related measures”. Available at http://ec.europa.eu/justice/genderequality/files/womenonboards/directive_quotas_en.pdf.
European Union (201b) “Women in economic decision-making in the EU: Progress report,” Luxembourg: Publications office of the European Union doi: 10.2838/65541, available electronically.
Faccio, Mara and Larry H. P. Lang (2002) “The ultimate ownership of western European corporations,” Journal of Financial Economics, 65(3), 365-395.
Fernandez, Raquel (2007), “Culture and Economics,” Journal of the European Economic Association 5(2-3), 305-332.
Fernandez, Raquel (2008), "Culture and Economics," forthcoming: New Palgrave Dictionary of Economics, 2nd edition, edited by Steven N. Durlauf and Lawrence E. Blume, Palgrave Macmillan.
Fernandez, Raquel and Fogli, Alessandra, (2009) “Culture: An Empirical Investigation of Beliefs, Work, and Fertility,” American Economic Journal: Macroeconomics 1(1), 146–177.
Gneezy, Uri, Niederle, Muriel and Rustichini, Aldo (2003), "Performance in Competitive Environments: Gender Differences", Quarterly Journal of Economics 118, 1049-1074.
Goldin, Claudia (1991): “The Role of World War II in the Rise of Women’s Employment,” American Economic Review, 81, 741–756.
GovernanceMetrics International (2010) “Women on Boards,” Available electronically.
Hastings, Paul (2012) “Breaking the Glass Ceiling: Women in the Boardroom Second Edition”, Tara Giunta, Lianne Labossiere, Paul Hastings (Editors), Paul Hastings, LLP, Available electronically.
Hausmann, Ricardo, Laura D. Tyson, Saadia Zahidi (2010) “The Global Gender Gap Report” World Economic Forum, Geneva Switzerland, available electronically.
Hogarth, Robin M., Karelaia, Natalia and Trujillo, Carlos A. (2012), “When should I quit? Gender differences in exiting competitions,” Journal of Economic Behavior and Organization 83(1), 136-150.
Huang, Jiekun and Kisgen, Darren, J., (2013), “Gender and Corporate Finance: Are Male Executives Overconfident Relative to Female Executives,” Journal of Financial Economics 10, 822-839.
Huffington (2003), "Would things be any different if women ran corporate America," www.commondreams.org.
Inglehart, Ronald and Christian Welzel, (2005) Modernization, Cultural Change and Democracy, New York: Cambridge University Press.

25
International Labor Organization (1997) “Part-time work: Solution or Trap?” International Labor Review, 136(4), available electronically.
Johnson and Powell (1994)
Kanter, Rosabeth, (1977) Men and Women of the Corporation. New York: Basic Books.
Kirk, Matrice Ellis and Gwin, Bonnie W. (2009), “A Diverse Corporate Board is More Important than Ever,” Corporate Board Member, April 7, http://www.boardmember.com/Article Details.aspx?id=3420.
Kluge, N., & Stollt, M. (Eds.) 2006. Die Europäische Aktiengesellschaft (SE) – Perspektiven für eine europäische Unternehmensmitbestimmung. Brussels: ETUI-REHS, Available electronically.
Kristof, Nicolas (2009), "Mistresses of the Universe," The New York Times, February 7, http://www.nytimes.com/2009/02/08/opinion/08kristof.html.
Laeven, Luc, and Levine, Ross (2009) “Bank Governance, Regulation and Risk Taking, Journal of Financial Economics 93, 259-275.
Levi, Maurice, Li, Kai and Zhang, Frank, “Director Gender and Mergers and Acquisitions,” Forthcoming Journal of Corporate Finance
Lorsch, J. and MacIver, E. Pawns or Potentates. Harvard Business School Press, Boston, Massachusetts, 1989.
Lyness, Karen and Judeisch, Michael (1999), “Are Women more Likely to be Hired or Promoted into Management Positions?,” Journal of Vocational Behavior 54(1), 158-173.
Matsa, David A. and Miller, Amalia R. (2013), “A Female Style in Corporate Leadership? Evidence from Quotas,” American Economic Journal: Applied Economics 5(3), 136-169.
Matsa, David A. and Amalia Miller (2012) “Workforce Reductions at Women-Owned Businesses in the United States”, Working paper.
Milliken, Frances and Martins, Luis L. (1996), “Searching for Common Threads: Understanding the Multiple Effects of Diversity in Organizational Groups,” Academy of Management Review 21(2), 402-433.
Morris, Nigel (2009), "Harriet Harman: If only it had been Lehman Sisters," The Independent, August 4, http://www.independent.co.uk/news/uk/home-news/harriet-harman-if-only-it-had-been-lehman-sisters-1766932.html.
Niederle, Muriel, Segal, Carmit and Vesterlund, Lise (2008), “How Costly is Diversity? Affirmative Action in the Light of Gender Differences in Competitiveness,” Working Paper.
Niessen-Ruenzi, Alexandra and Ruenzi, Stefan (2011),
Norris, Pippa and Ronald Inglehart, (2008) “Cracking the Marble Ceiling: Cultural barriers facing women leaders,” Harvard University Report. Available electronically.

26
Osterloh, Margit, Bruno S. Frey and Hossam Zeitoun (2011) “Voluntary Co-determination produces sustainable competitive advantage,” Corporate Social Responsibility and Corporate Governance: The Contribution of Economic Theory and Related Disciplines (International Economic Association), Editors: Lorenzo Sacconi, Margaret Blair, R. Edward Freeman, Alessandro Vercelli, Palgrave MacMillan, New York, NY.
Pande, Rohini and Dianna Ford (2011) “Gender Quotas and Female Leadership: A Review” Background paper for World Development Report 2012 on Gender Equality and Development. Available electronically.
Psacharopoulos, George and Zafiris Tzannatos “Female Labor Force Participation: An International Perspective” (1989) World Bank Research Observer 4(2), 187-201.
Sapienza, Paola, Zingales, Luigi and Maestripieri, Dario (2009), “Gender Differences in financial risk aversion and career choices are affected by testosterone,” Proceedings of the National Academy of Sciences of the United States 106(36), 15268-15273.
Sagiv, Liliach, Sverdlik, Noga and Schwarz, Norbert (2011), “To compete or to cooperate? Values' impact on perception and action in social dilemma games,” European Journal of Social Psychology 41(1), 6477.
Sanders, Melanie, Jayne Hrdlicka, Meredith Hellicar, Dale Cottrell, and Joanna Knox (2011) “What stops women from reaching the top? Confronting the tough issues,” Bain & Company, Inc.
Schwartz, Shalom H. (1992), “Universals in the content and structure of values: Theoretical advances and empirical tests in 20 countries.” In M.P. Zana (Ed.), Advances in experimental social psychology, New York, Academic Press.
Soares, Rachel, Jan Combopiano, Allyson Regis, Yelena Shur, and Rosita Wong (2010) 2010 Catalyst Census: Fortune 500 Women Board Directors, Catalyst, Available electronically.

Figure 1. Trends in the Average Proportion of Women on Boards for Banks and Matched Samples of Non-financial Firms
This figure shows the average proportion of women on boards for banks and size-matched samples of non-financial firms. We use two different samples. The first dataset consists of the intersection of our sample with Boardex and size-matched industrial firms in Boardex from 2003-2010. The second dataset consists of all banks in Riskmetrics and size-matched industrial firms from 1996-2010. Banks in Riskmetrics are firms with SIC codes 6000-6300. In both datasets, the industrial sample excludes banks and utilities (SIC 4900-4949). We match banks to industrial firms on the book value of assets (from Compustat) with replacement. We require that the control firm’s assets are within 30% of the bank’s assets and retain only the best match. We plot the average proportion of women only for the 321 banks in Boardex and the 192 banks in Riskmetrics who have at least 4 years of data and their corresponding matches. In the legend below, RM stands for Riskmetrics and BX stands for Boardex.
7
9
11
13
15
Aver
age
% W
omen
on
Boar
ds
1995 1997 1999 2001 2003 2005 2007 2009 year
RM Non-banks RM Banks BX Non-banks BX Banks

Figure 2. Boxplots of Changes and Averages of Boardroom Diversity for Banks and Non-financial Firms in Riskmetrics
This figure shows boxplots of changes and averages of boardroom diversity for banks and non-financial firms in Riskmetrics 1996-2010. We identify banks and industrial firms as for Figure 1. We restrict the sample to firms that have at least 4 years of data over this time period. There are 194 banks in the sample with 1,698 observations and 1,865 industrial firms with 17,789 observations. We calculate year-to-year changes in diversity as the absolute value of the difference in the percentage of women on the board minus the percentage of women on the board the previous year. We also calculate firm-level averages of the percentage of women over all years the firm is in the sample. We display boxplots of changes and firm-level averages. The lower/upper edges of the box denote the 25th/75th percentiles. The line intersecting the box denotes the median. The whiskers are set at the most extreme observed data value within 1.5 times the interquartile range from the edges of the box.
0
20
40
60
Bank changes Bank average
Non-bank changes Non-bank average

Figure 3. Changes in Boardroom Diversity for Banks and Non-financial Firms in Riskmetrics For Firms with Women on their Boards
Figure 3 replicates the changes in the percentages of women on boards shown in Figure 2 for firm-years observations for which the percentage of women on the board of the firm in the previous year was non-zero.
0
10
20
30
40
Bank changes Non-bank changes

Appendix: Definition of Variables
Our sample consists of both Bank holding companies and Commercial Banks. In this appendix, we only report the mnemonics and item numbers for bank holding companies. Item numbers for commercial banks are identical, but the mnemonics can either be RCFD, RIAD or RCON. Financial data are sourced from COMPUSTAT and the Federal Reserve Bank of Chicago’s Financial Institution Reports dataset (FR Y-9C Call Reports). Board characteristics such as Board Size, Number of Independent directors, Number of Female Directors, Committees and Committee Assignments are hand-collected from the firm’s proxy filing (form DEF 14A) filed with the SEC and obtained through EDGAR. We use Boardex data to measure Relationship length.
Financial Variables:
Bad Loans: Bad or Non-performing loans is the sum of loans that are past due 90 days (BHCK5525) and loans that have nonaccrual status (BHCK5526)
Bank Size: Natural log of Total Assets (BHCK2170)
Deposit Ratio: Total Deposits/Total Assets
Derivative Trading: Sum (BHCKA126, BHCKA127, BHCK8723 and BHCK8724)
Derivative Hedging: Sum (BHCK8725, BHCK8726, BHCK8727 and BHCK8728)
Fraction of Bad Loans, Fr(Bad Loans): Bad Loans/Loans
Fr(Risky Trading): Risky Trading Assets/Total Assets
Fr(Derivative Trading): Derivative Trading/Total Assets
Fr(Derivative Hedging): Derivative Hedging/Total Assets
Hedging: 1 if Derivative Hedging is non-zero and zero otherwise
Loan Ratio: Loans (BHCK2122)/Total Assets
Mortgage-backed Securities (MBS): Sum of (BHCK1709, BHCK 1733, BHCK 1713, BHCK 1736 and BHCK 3536)
Percentage Non-Traditional Income (% NonTrad Inc): Non-Traditional Income/Total Income
Repaid Tarp: 1 if the bank mentions in 10-K that it had repaid the TARP funding and zero otherwise. Return on Assets (ROA): Net Income (BHCK4340)/Total Assets
Risky Trading Assets: BHCK3545 - BHCK3531 - BHCK3532 - BHCK3533 - (BHCK3534 + BHCK3535)
Risky Trading t: The amount of risky assets in the bank’s trading book is a threshold variable and is reported in Schedule HC-K conditional on a bank holding company having BHCK3401 (HC-K item 4a) greater than $2 million or more in any of the preceding four quarters. If this variable is missing, we assume it is below the threshold and code all missing values as zero.
Risky Trading d: A dummy variable that is 1 if Risky Trading Assets is non-zero; zero otherwise. All missing values are coded as missing.
Tier 1 Capital Ratio: Tier 1 Capital (BHCK8274)/Total Assets

Tobin’s Q (TQ): (Total Assets – Book value of Equity + Market Value of Equity)/Total Assets
Total Deposits: Sum of (BHDM6631, BHDM6636, BHFN6631 and BHFN6636)
Total Income: Sum of Interest Income (BHCK4107) and Non-Interest Income (BHCK4079)
Non-Traditional Income: Sum (BHCKA220, BHCKC888, BHCKC386, BHCKB491, BHCKB493)
Trading: 1 if Derivative Trading is non-zero and zero otherwise
Measures of Risk:
EDF: Expected Default Frequency from Moody’s Analytics
Capital Asset Ratio: Equity/Average Total Assets
Idiosyncratic Risk: Annualized standard deviation of the residuals from a market model regression estimated using daily returns over the fiscal year.
Tail Risk: Negative of the average bank’s stock return estimated over the 5% worst days for the S&P500 in a given year.
Volatility: Standard deviation of excess weekly returns, estimated relative to the value-weighted market index for the 52 weeks preceding the fiscal year end date
Z-Score: (ROA + Capital Asset Ratio)/Standard Deviation (ROA)
Board Characteristics:
Board Size: Number of Directors
Fr(Women): No. of women directors/Board Size
Independence: No. of Independent Directors/Board Size
Missed Meetings: 1 if the proxy mentions that a director has attended less the 75% of meetings; 0 otherwise.
Monitoring Committee: 1 if a director on any of the following committees – audit, compensation, governance, nominating, proxy, stock option, human resource, risk, loan, regulation, succession, trust, director search, and subsidiary; and 0 otherwise.
Relationship Length: To estimate the length of relationship between a director and a person in his or her network, we restrict connections to non-social relationships external to the bank and where at least one is a board member. It is calculated as the difference between the sample (fiscal) year and the start year of a relationship. We use the aggregate measure estimated across all directors on the board for a given year. For each person in the director’s network, we use census data to identify gender based on the first name. For ethnic or epicene names, we identify gender by searching the full name using google.
Risk Committee: If a director sits on the risk or loan committee, it is coded as 1; 0 otherwise.

Appendix Table I: Bank Sample description
We collect board and committee information from the proxies (form DEF 14A) filed by commercial banks and bank holding companies with the SEC. We download DEF 14A URLs for all firms from the SEC’s EDGAR website. We then match the CIK number with those provided in COMPUSTAT. We retain institutions with SIC codes 6000-6300. Using PERMCOs we match the banks in our sample to the regulatory entity code in the Fed’s 2007 CRSP-FRB Link file. This forms the sample for each of the four years. In each step we are likely to have duplicates as some firms file multiple proxy statements.
2006 2007 2008 2009
Number of DEF 14A filings for firms in SIC codes 6000-6300
729 720 701 655
Number of DEF 14A filings after matching to CRSP-FRB link file
367 342 336 316
Number of (Small and Large) Bank-Holding Companies with DEF 14A filings
332 309 296 281
Number of Commercial Banks with DEF 14A filings
18 16 16 15
Total Number of Financial Institutions 350 325 312 296

Table I: Gender Variation in Risk Aversion and Testosterone
This table presents descriptive statistics for measures of risk aversion (the premium paid to avoid a lottery), salivary and pre-natal (Average Digit Ratio and Simon Baron-Cohen’s “Reading the Mind in the Eyes” test) measures of testosterone levels used in Sapienza, Zingales and Maestripieri (2009). For each gender, we report the difference in means and the t-statistics (in brackets) for students who chose finance and those who did not forto the right of the table. Underneath the table, we report the differences in means and the t-statistics (in brackets) for men and women in the full sample and for each occupational choice. We estimate the significance of the difference in means between male and female MBA students using the Welch t-test.
Full Sample Finance = 1 Finance = 0 Men Men Men Mean SD N Mean SD N Mean SD N Diff
Risk Aversion 12.69 16.40 335 12.70 16.19 165 14.18 16.10 122 -1.48 (0.77)
Testosterone (pg/ml) 100.91 31.84 320 100.86 32.54 159 98.58 31.17 118 2.28
(0.59)
Baron-Cohen Eye Test 26.60 3.64 328 26.69 3.56 165 26.55 3.46 122 0.14
(0.339)
Average Digit Ratio 0.95 0.03 117 0.95 0.03 62 0.97 0.03 40 -0.02** (2.52)
Women Women Women
Risk Aversion 20.18 18.23 140 12.62 14.78 42 23.47 19.04 72 -10.85***
(3.392)
Testosterone (pg/ml) 48.72 23 140 51.74 20.57 40 44.96 24.60 71 6.78
(1.550)
Baron-Cohen Eye Test 27.31 3.28 140 26.81 3.12 42 27.88 3.28 72 -1.07* (1.727)
Average Digit Ratio 0.97 0.03 64 0.96 0.02 15 0.98 0.04 38 -0.03*** (3.147)
Diff Diff Diff
Risk Aversion -7.49*** (4.204)
0.08
(0.030)
-9.29*** (3.473)
Testosterone (pg/ml) 52.19*** (19.797)
49.12*** (11.832)
53.62*** (13.097)
Baron-Cohen Eye Test -0.70** (2.503)
-0.12
(0.214)
-1.33*** (2.664)
Average Digit Ratio -0.02*** (4.076)
-0.004 (0.637)
0.02** (1.965)

Table II: Sample Characteristics
This table presents summary statistics of financial characteristics for an unbalanced panel of 365 bank holding companies (BHCs) and commercial banks for fiscal years 2006-2009. Financial variables are sourced from COMPUSTAT and the Federal Reserve Bank of Chicago’s Financial Institution Reports dataset (FR Y-9C Call Reports). Board characteristics such as Board Size, Number of Independent directors, Number of Female Directors, Committees and Committee Assignments are hand-collected from the firm’s proxy filing (form DEF 14A) filed with the SEC and obtained through EDGAR. Gender of directors is manually assigned based on director names. For gender neutral and ethnic names we assign gender after checking BoardEx. We use Boardex data to measure relationship length (with Women).We provide definitions of all variables in the Appendix.
Obs. Mean Std. Dev. Min Median Max
Panel A: Financial Characteristics
Total Assets ($ billions) 1,280 31,708.99 191,795.5 163.241 1,907.09 2,223,299
Tobin’s Q 1,221 1.035 0.106 0.899 1.023 3.115
Tier One Capital Ratio 1,260 11.404 2.709 0.220 11.040 23.200
Deposit Ratio 1,158 0.743 0.099 0.056 0.757 0.923
Loan Ratio 1,259 0.694 0.138 0.001 0.713 0.948
Deposits/Loans 1,158 1.116 0.521 0.507 1.051 12.289
Fr(Bad Loans) 1,158 0.021 0.028 0 0.012 0.500
Risky Trading/TA 364 0.011 0.031 0 2.62*10-3 0.234
Derivative Trading/TA 1,158 0.357 2.996 0 0 49.178
Derivative Hedging/TA 1,158 0.041 0.103 0 0.004 1.586
MBS/TA 1,158 0.009 0.021 0 0 0.286
ROA 1,261 0.003 0.016 -0.162 0.007 0.037
Z-Score 1,174 3.318 1.151 -3.594 3.508 7.013
EDF (%) 1,282 1.90 4.051 0.01 0.322 28.906
Tail Risk 1,283 0.039 0.044 -0.154 0.027 0.224
Volatility (weekly) 1,283 0.057 0.037 0.012 0.045 0.279
Idiosyncratic Risk 1,283 0.030 0.021 0.006 0.022 0.153
Panel B: Board Characteristics
Board Size 1,283 11.554 3.121 3 11 23
No. of Independent Directors 1,283 9.099 2.710 2 9 18 No. of Independent Directors (%)
1,283 0.787 0.109 0.375 0.800 0.941
No. of Female Directors 1,283 1.142 1.017 0 1 5
Fraction of Female Directors 1,283 0.095 0.083 0 0.091 0.444 Fraction of Female Directors (Non-Independent)
1,283 0.011 0.032 0 0 0.222
No. of Board Meetings 1,283 11.315 7.003 1 12 153 Fraction of Directors who know women
1,278 0.879 0.167 0.090 0.923 1
Relationship Length (with Women)
1,272 11.184 5.251 0.4 10.501 33.338

Table IV Bank Characteristics (With and Without Women)
This table documents bank characteristics based whether the bank board had a female director or not. The total number of observations is 1,283. In 387 bank firm-years, banks had no female directors.
With Women
Directors No Women Directors
Diff
(t-stat)
Total Assets ($ billions) 44351.85 2318.449 42033.4***
(3.61)
Tobin’s Q 1.039 1.026 0.013** (1.99)
ROA 0.0029 0.0026 .0003
(0.271)
Tier One Capital Ratio 11.3 11.643 -0.003** (2.068)
Fr(Bad Loans) 0.021 0.022 -0.001 (0.807)
Risky Trading/TA 0.013 0.001 0.012*** (2.906)
Derivative Trading/TA 0.496 0.003 0.493*** (2.550)
Derivative Hedging/TA 0.048 0.021 0.027***
(4.15)
MBS/TA 0.0095 0.0061 0.0034 (2.492)
Z-Score 3.350 3.239 0.111
(1.503)
EDF (%) 1.772 2.193 -0.421* (1.710)
Tail Risk -0.043 -0.031 -0.012***
(4.547)
Volatility (weekly returns) 0.056 0.058 -0.002 (0.910)

Table III: Bank Director Characteristics
This table presents summary statistics of director characteristics for an unbalanced panel of 365 bank holding companies (BHCs) and commercial banks for fiscal years 2006-2009. Board characteristics such as Board Size, Number of Independent directors, Number of Female Directors, Committees and Committee Assignments are hand-collected from the firm’s proxy filing (form DEF 14A) filed with the SEC and obtained through EDGAR. The total number of director firm year observations is 14,824. Director level variables such as Director Age, Tenure in the sample firm and the Number of directorships in public firms are from BoardEx. We also obtain the list of all people in the director’s network from BoardEx. To calculate Relationship length (with Women) we restrict connections to non-social relationships external to the bank where at least one person is the member of a board. For each person in the director’s network, we use census data to identify gender based on the first name. For ethnic and epicene names, we identify gender by searching the full name using google. We define the length of an individual’s relationship with a woman as the difference between the sample (fiscal) year and the start year of a relationship. We average all individual-level relationship lengths and then average this measure across board members. The significance of the difference in means between male and female directors is estimated using the Welch t-test.
Obs. Mean Std. Dev. Min Median Max
Panel A: Director Characteristics
Female Director Dummy 14,824 0.099 0.298 0 0 1 Committee Assignments: All Directors
14,824 0.796 0.403 0 1 1
Male Directors 13,362 0.790 0.407 0 1 1
Female Directors 1,462 0.843*** 0.364 0 1 1 Missed Meetings: All Directors
14,824 0.016 0.125 0 0 1
Male Directors 13,362 0.016 0.125 0 0 1
Female Directors 1,462 0.018 0.132 0 0 1
Director Age: All Directors 14,401 61.671 8.642 28 62 96
Male Directors 12,979 62.965 8.635 28 62 96
Female Directors 1,422 58.984*** 8.238 36 58 88
Tenure: All Directors 14,544 8.992 7.521 0 7 52
Male Directors 13,122 9.216 7.658 0 7 52
Female Directors 1,422 6.920*** 5.718 0 5 30 Number of Directorships (Public Companies): All Directors
12,261 1.231 0.639 1 1 7
Male Directors 11,021 1.226 0.633 1 1 7
Female Directors 1,240 1.279*** 0.689 1 1 6
Panel B: Network Characteristics
Network Size (All ties) 13,562 131.791 244.764 1 38 3276
Male Director Network 12,297 128.629 242.057 1 37 3276
Female Director Network 1,298 161.117 265.530 2 48 2419
Relationship Length (with Women)
12,522 10.567 8.676 0 8 50

Table V: Female Directors and Risky Activities
This table shows the OLS regressions of various measures of trading and risky activities undertaken by banks on the fraction of women directors on the board, Percentage of independent directors, Board size, Bank Size, Tier 1 capital ratio, Deposit and Loan ratios and ROA. The dependent variables in columns I, III, V, VI and VIII are dummy variables that indicate whether or not the bank undertook the corresponding risky activity. Fr(Women)basic is the coefficient in the OLS regression that only includes percentage of independent directors, Board size and Bank Size. All variables are as defined in the Appendix. All regressions include year dummies. All standard errors are clustered at the “crisis id” level. “Crisis id” groups identifiers of banks according to whether they are in the 2007-2008 crisis or outside of the crisis. Heteroskedasticity robust t-statistics are reported in parentheses. Asterisks indicate significance at 0.01 (***), 0.05 (**), and 0.10 (*) levels.
Hedging 𝐿𝑛 �
𝐻𝑒𝑑𝑔𝑖𝑛𝑔𝑇𝐴
� Trading 𝐿𝑛 �𝑇𝑟𝑎𝑑𝑖𝑛𝑔𝑇𝐴
� Risky
Tradingd Risky
Tradingt 𝐿𝑛 �𝑅𝑖𝑠𝑘𝑦𝑇𝑟𝑎𝑑𝑖𝑛𝑔
𝑇𝐴� MBS 𝐿𝑛 �
𝑀𝐵𝑆𝑇𝐴
� 𝐷𝑒𝑝𝑜𝑠𝑖𝑡𝑠𝐿𝑜𝑎𝑛𝑠
%NonTradIncome I II III IV V VI VII VIII IX X XI
Fr(Women) 0.259 0.003 -0.032 4.438** 0.149 -0.061 4.121* 0.676*** 0.538 0.122 0.000
[1.11] [0.00] [0.21] [2.33] [0.48] [0.45] [1.79] [3.09] [0.45] [0.62] [0.08]
Independence -0.069 2.057*** -0.125 0.760 -0.143 0.130 2.149 -0.072 2.617** 0.224* 0.001***
[0.43] [2.68] [1.04] [0.41] [0.68] [1.19] [0.89] [0.46] [2.07] [1.66] [3.30]
Board Size 0.074 -0.569* 0.070 1.193 -0.138 -0.051 0.448 0.066 0.419 -0.024 -0.000
[1.04] [1.66] [1.49] [1.44] [1.24] [1.22] [0.54] [0.95] [0.95] [1.26] [0.20]
Bank Size 0.105*** 0.412*** 0.163*** 0.625*** 0.151*** 0.159*** 0.385*** 0.052*** -0.046 0.021** 0.000***
[7.85] [7.12] [16.35] [5.47] [8.75] [16.70] [2.77] [3.80] [0.66] [2.32] [5.96]
Tier 1 Capital Ratio -0.783 -1.136 0.365 -14.617* -0.092 -0.485 -15.467 -0.881 -8.739* 0.012 -0.001
[1.00] [0.30] [0.77] [1.75] [0.07] [1.02] [1.61] [1.14] [1.82] [0.03] [0.21]
Deposit Ratio -0.165 -2.885*** 0.159 -5.827*** 0.214 0.113 -2.014 -0.983*** -2.497** 1.790*** -0.001
[0.67] [3.17] [0.90] [2.91] [0.71] [0.65] [0.73] [4.37] [2.04] [11.42] [0.92]
Loan Ratio -0.320* 2.691*** -0.010 -2.719** 0.126 -0.168 -1.871* -0.547*** -4.917*** -2.681*** -0.002**
[1.86] [3.84] [0.09] [2.30] [0.72] [1.48] [1.85] [3.06] [5.26] [6.25] [2.14]
ROA -1.166 -4.714 1.323* -5.828 0.717 0.289 1.233 -1.307 -6.734 -0.782 0.003
[0.99] [1.00] [1.84] [0.62] [0.52] [0.37] [0.10] [1.16] [1.15] [1.21] [0.79]
Constant 0.037 -6.882*** -1.360*** -6.193* -0.588 -1.006*** -9.245** 1.144*** -2.034 1.369*** -0.001
[0.10] [4.31] [5.45] [1.73] [1.35] [4.24] [2.06] [3.34] [0.94] [9.80] [-1.14]
Fr(Women)basic 0.300 0.332 -0.066 4.125* 0.182 -0.026 5.086** 0.775*** 0.917 0.013 0.013
[1.29] [0.35] [0.43] [1.92] [0.59] [0.20] [2.12] [3.45] [0.74] [0.05] [1.31]
N 1,112 670 1,112 217 347 1,135 191 1,112 593 1,135 1,135
R2 0.167 0.212 0.394 0.544 0.440 0.414 0.322 0.171 0.113 0.544 0.217
Adjusted R2 0.159 0.199 0.388 0.520 0.422 0.408 0.281 0.163 0.0959 0.539 0.209

Table VI: Boardroom Gender Diversity and Bank Risk
This table reports OLS regressions relating boardroom gender diversity to measures of bank risk. Volatility is the standard deviation of weekly stock returns. Idiosyncratic risk is the annualized standard deviation of the residuals of a regression of excess bank stock returns on (excess) returns on the S&P 500. Z-Score and EDF, the estimated default frequency, are measures of default risk. Tail Risk, which captures the higher probability of big losses, is based on the worst performing days of the S&P 500. Hedging is a dummy variable that is one if a bank uses derivatives to hedge its risk. Hedging is a dummy variable that is one if a bank uses derivatives to hedge its risk. Trading is a dummy variable that is one if a bank’s off-balance sheet derivative trading activity is non-zero. Risky Trading Assets is estimated as the difference between book value of assets and safe securities. Risky Trading is one if the variable is non-zero. MBS is one if the total value of private-label mortgage-backed securities held in both trading and investment portfolios is greater than zero. Fr(women) is the number of female directors relative to board size. All other control variables are as defined in the Appendix. All regressions include year dummies. All standard errors are clustered at the crisis id level. Heteroskedasticity robust t-statistics are in parentheses. Asterisks indicate significance at 0.01 (***), 0.05 (**), and 0.10 (*) levels.
Volatility Volatility
Idiosyncratic Risk
Idiosyncratic Risk
Z-Score Z-Score EDF EDF Tail Risk Tail Risk
Fr(Women) 0.006 0.004 -0.001 -0.002 -1.030*** -1.034*** 1.001 0.987 -0.004 -0.003
[0.77] [0.49] [0.30] [0.46] [2.85] [2.85] [1.05] [1.06] [0.34] [0.24]
Independence 0.003 0.002 0.001 0.000 0.190 0.211 -0.657 -0.749 0.002 0.001
[0.48] [0.28] [0.53] [0.17] [0.84] [0.93] [0.96] [1.09] [0.19] [0.12]
Board Size -0.005** -0.005** -0.002 -0.002 0.334*** 0.324*** -0.360 -0.290 -0.002 -0.002
[2.22] [1.98] [1.63] [-1.45] [3.10] [2.99] [-1.14] [0.91] [0.35] [0.33]
Bank Size 0.000 0.000 -0.002*** -0.002*** -0.022 -0.027 -0.298*** -0.297*** -0.016*** -0.017***
[0.59] [0.38] [4.26] [4.31] [0.92] [0.86] [3.84] [2.81] [13.99] [13.06]
Tier 1 Capital Ratio 0.013 0.022 -0.050** -0.046** 4.513*** 4.457*** -27.267*** -26.841*** -0.309*** -0.309***
[0.31] [0.53] [2.40] [2.31] [3.24] [3.24] [4.66] [4.66] [5.74] [5.67]
ROA -0.748*** -0.736*** -0.370*** -0.367*** 53.780*** 53.561*** -116.238*** -115.592*** 0.264** 0.259**
[6.03] [6.04] [5.62] [5.68] [12.13] [12.16] [5.37] [5.34] [2.11] [2.07]
Loan Ratio 0.019** 0.021*** 0.003 0.005 1.133*** 1.118*** -0.824 -0.786 -0.044*** -0.043***
[2.36] [2.67] [0.85] [1.31] [3.97] [3.89] [0.97] [0.91] [3.88] [3.78]
Deposit Ratio 0.001 0.004 -0.000 0.001 -1.433*** -1.421*** 2.017** 2.033** -0.035*** -0.037***
[0.08] [0.33] [0.00] [0.23] [3.82] [3.70] [2.04] [2.00] [2.66] [2.69]
Fr(Bad Loans) 0.296*** 0.298*** 0.140*** 0.143*** -1.067 -1.139 44.547*** 44.783*** -0.222*** -0.216***
[2.63] [2.69] [2.98] [3.09] [0.55] [0.59] [3.95] [3.98] [3.88] [3.77]
Trading
-0.006***
-0.002*
0.127
-0.476*
0.004
[2.88]
[1.78]
[1.51]
[1.76]
[1.32]

Risky Tradingt
0.006*
0.004**
-0.056
0.611
0.004
[1.65]
[2.46]
[0.53]
[1.58]
[1.09]
Hedging
-0.000
0.000
-0.065
-0.133
0.000
[0.03]
[0.32]
[1.17]
[0.77]
[0.02]
MBS
0.003***
0.001
0.033
0.084
-0.001
[2.61]
[1.44]
[0.61]
[0.53]
[0.48]
%NonTradIncome
-0.246
0.239
-2.875
-30.884
0.425
[0.53]
[1.03]
[0.22]
[0.55]
[0.58]
Constant 0.024 0.018 0.036*** 0.037*** 2.036*** 2.099*** 6.874*** 6.716*** 0.207*** 0.219***
[1.42] [1.03] [4.67] [4.68] [3.50] [3.53] [3.56] [3.39] [8.90] [9.09]
N 1,140 1,140 1,140 1,140 1,075 1,075 1,139 1,139 1,140 1,140
Adjusted R2 0.704 0.708 0.734 0.737 0.452 0.452 0.672 0.673 0.515 0.516
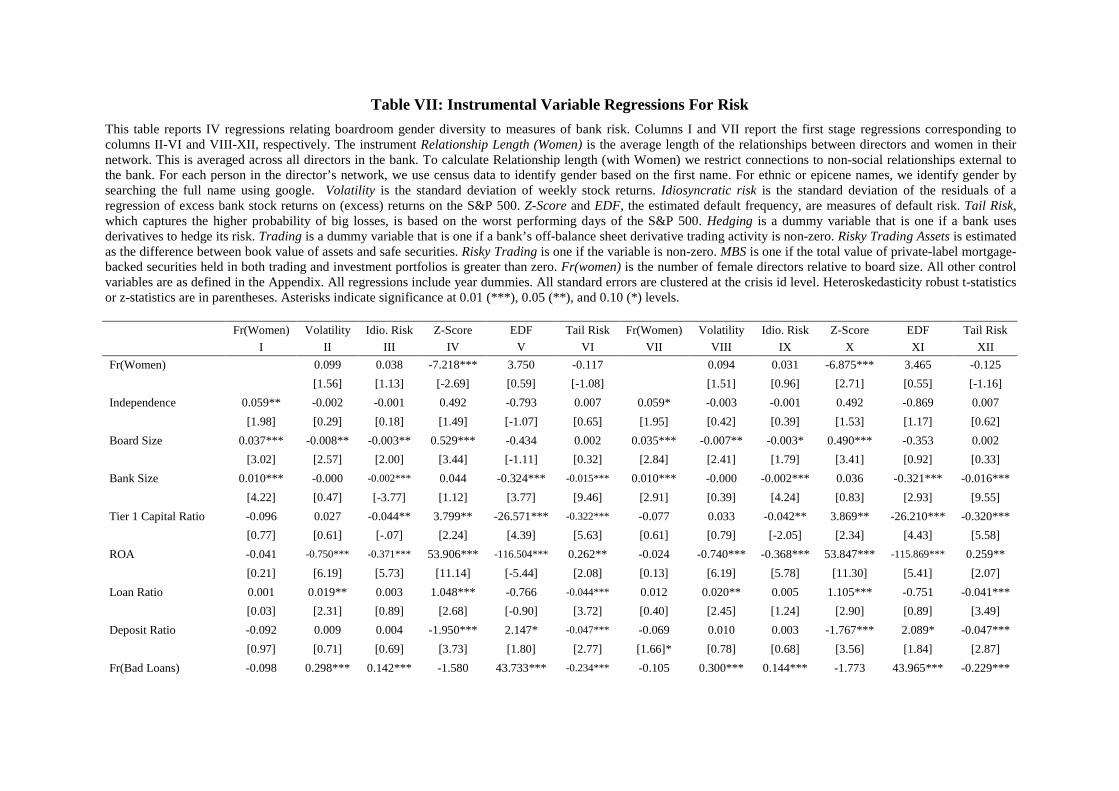
Table VII: Instrumental Variable Regressions For Risk
This table reports IV regressions relating boardroom gender diversity to measures of bank risk. Columns I and VII report the first stage regressions corresponding to columns II-VI and VIII-XII, respectively. The instrument Relationship Length (Women) is the average length of the relationships between directors and women in their network. This is averaged across all directors in the bank. To calculate Relationship length (with Women) we restrict connections to non-social relationships external to the bank. For each person in the director’s network, we use census data to identify gender based on the first name. For ethnic or epicene names, we identify gender by searching the full name using google. Volatility is the standard deviation of weekly stock returns. Idiosyncratic risk is the standard deviation of the residuals of a regression of excess bank stock returns on (excess) returns on the S&P 500. Z-Score and EDF, the estimated default frequency, are measures of default risk. Tail Risk, which captures the higher probability of big losses, is based on the worst performing days of the S&P 500. Hedging is a dummy variable that is one if a bank uses derivatives to hedge its risk. Trading is a dummy variable that is one if a bank’s off-balance sheet derivative trading activity is non-zero. Risky Trading Assets is estimated as the difference between book value of assets and safe securities. Risky Trading is one if the variable is non-zero. MBS is one if the total value of private-label mortgage-backed securities held in both trading and investment portfolios is greater than zero. Fr(women) is the number of female directors relative to board size. All other control variables are as defined in the Appendix. All regressions include year dummies. All standard errors are clustered at the crisis id level. Heteroskedasticity robust t-statistics or z-statistics are in parentheses. Asterisks indicate significance at 0.01 (***), 0.05 (**), and 0.10 (*) levels.
Fr(Women) Volatility Idio. Risk Z-Score EDF Tail Risk Fr(Women) Volatility Idio. Risk Z-Score EDF Tail Risk
I II III IV V VI VII VIII IX X XI XII
Fr(Women)
0.099 0.038 -7.218*** 3.750 -0.117
0.094 0.031 -6.875*** 3.465 -0.125
[1.56] [1.13] [-2.69] [0.59] [-1.08]
[1.51] [0.96] [2.71] [0.55] [-1.16]
Independence 0.059** -0.002 -0.001 0.492 -0.793 0.007 0.059* -0.003 -0.001 0.492 -0.869 0.007
[1.98] [0.29] [0.18] [1.49] [-1.07] [0.65] [1.95] [0.42] [0.39] [1.53] [1.17] [0.62]
Board Size 0.037*** -0.008** -0.003** 0.529*** -0.434 0.002 0.035*** -0.007** -0.003* 0.490*** -0.353 0.002
[3.02] [2.57] [2.00] [3.44] [-1.11] [0.32] [2.84] [2.41] [1.79] [3.41] [0.92] [0.33]
Bank Size 0.010*** -0.000 -0.002*** 0.044 -0.324*** -0.015*** 0.010*** -0.000 -0.002*** 0.036 -0.321*** -0.016***
[4.22] [0.47] [-3.77] [1.12] [3.77] [9.46] [2.91] [0.39] [4.24] [0.83] [2.93] [9.55]
Tier 1 Capital Ratio -0.096 0.027 -0.044** 3.799** -26.571*** -0.322*** -0.077 0.033 -0.042** 3.869** -26.210*** -0.320***
[0.77] [0.61] [-.07] [2.24] [4.39] [5.63] [0.61] [0.79] [-2.05] [2.34] [4.43] [5.58]
ROA -0.041 -0.750*** -0.371*** 53.906*** -116.504*** 0.262** -0.024 -0.740*** -0.368*** 53.847*** -115.869*** 0.259**
[0.21] [6.19] [5.73] [11.14] [-5.44] [2.08] [0.13] [6.19] [5.78] [11.30] [5.41] [2.07]
Loan Ratio 0.001 0.019** 0.003 1.048*** -0.766 -0.044*** 0.012 0.020** 0.005 1.105*** -0.751 -0.041***
[0.03] [2.31] [0.89] [2.68] [-0.90] [3.72] [0.40] [2.45] [1.24] [2.90] [0.89] [3.49]
Deposit Ratio -0.092 0.009 0.004 -1.950*** 2.147* -0.047*** -0.069 0.010 0.003 -1.767*** 2.089* -0.047***
[0.97] [0.71] [0.69] [3.73] [1.80] [2.77] [1.66]* [0.78] [0.68] [3.56] [1.84] [2.87]
Fr(Bad Loans) -0.098 0.298*** 0.142*** -1.580 43.733*** -0.234*** -0.105 0.300*** 0.144*** -1.773 43.965*** -0.229***

[0.97] [2.76] [3.13] [-0.73] [4.07] [3.89] [1.09] [2.81] [3.21] [0.83] [4.10] [3.79]
Trading
-0.001 -0.006*** -0.002* 0.116 -0.471* 0.004
[0.06] [2.75] [1.72] [1.13] [1.73] [1.27]
Risky Tradingt
-0.007 0.007* 0.004*** -0.117 0.628 0.003
[0.80] [1.75] [2.60] [0.93] [1.60] [0.84]
Hedging
0.004 -0.000 0.000 -0.049 -0.125 0.001
[0.53] [0.21] [0.20] [0.70] [0.71] [0.29]
MBS
0.019*** 0.002 0.000 0.145* 0.045 0.001
[3.11] [0.93] [0.41] [1.67] [0.23] [0.40]
%NonTradIncome
0.775 -0.354 0.200 5.626 -34.925 0.553
[0.51] [0.75] [0.86] [0.37] [0.63] [0.75]
Relationship Length (Women)
0.020***
0.020***
[3.65]
[3.69]
Constant -0.072 0.025 0.036*** 1.900*** 6.912*** 0.207*** -0.101 0.021 0.038*** 1.790** 6.815*** 0.215***
[1.19] [1.38] [4.54] [2.68] [3.57] [8.54] [1.64] [1.14] [4.71] [2.49] [3.47] [8.57]
Observations 1,135 1,135 1,135 1,070 1,134 1,135 1,135 1,135 1,135 1,070 1,134 1,135
R-squared 0.122 0.667 0.713 0.224 0.672 0.482 0.135 0.675 0.723 0.255 0.675 0.479
Adjusted R-squared
0.663 0.710 0.215 0.668 0.476
0.670 0.719 0.243 0.670 0.471 Kleibergen-Paap rk statistic
19.87 12.90
[Stock-Yogo 10%] [16.38] [16.38] Hausman [p value]
0.142 [0.71]
1.47 [0.22]
8.29 [0.00]
0.21 [0.5]
1.103 [0.29]
2.75
[0.09] 1.12
[0.29] 7.71
[0.01] 0.18
[0.67] 1.32
[0.25]

Table VIII: Instrumental Variable Regressions for Bank Performance
This table reports IV regressions of measures of bank performance on boardroom gender diversity. Columns I, III and V report the first stage regressions corresponding to columns II, IV and VI, respectively. The instrument Relationship Length (Women) is the average length of the relationships between directors and women in their network. This is averaged across all directors in the bank. ROA is the bank’s Return on Assets; TQ is Tobin’s Q; Fr(Bad Loans) is the ratio of Bad Loans to Total Loans. Fr(women)OLS is the coefficient on the Fr(women) in the corresponding OLS regression. All control variables are as defined in the Appendix. All regressions include year dummies. All standard errors are clustered at the crisis id level. Heteroskedasticity robust t-statistics or z-statistics are in parentheses. Asterisks indicate significance at 0.01 (***), 0.05 (**), and 0.10 (*) levels.
Fr(Women) TQ Fr(Women) ROA Fr(Women) Fr(Bad Loans)
I II III IV V VI
Fr(Women)
0.573***
0.060*
-5.537
[3.06]
[1.75]
[1.50]
Independence 0.059* -0.030 0.059* 0.001 0.059* 0.169
[1.90] [1.34] [1.95] [0.24] [1.97] [0.41]
Board Size 0.033*** -0.021** 0.035*** -0.004** 0.036** -0.158
[2.62] [2.33] [2.80] [2.41] [2.90] [0.85]
Bank Size 0.010*** 0.003 0.009*** 0.001 0.009** 0.176***
[2.88] [0.95] [2.81] [0.98] [2.79] [3.52]
Volatility -0.005 -0.316*** 0.008 -0.254*** -0.03 8.222***
[0.04] [2.94] [0.07] [8.35] [0.25] [5.53]
ROA -0.018 0.591**
0.021 -11.859***
[0.09] [2.28]
[0.11] [3.32]
Loan Ratio 0.014 -0.057** 0.013 0.006 0.015 1.306***
[0.04] [2.37] [0.40] [1.39] [0.46] [3.13]
Deposit Ratio -0.079 0.179*** -0.074* 0.001 -0.075 -1.149*
[1.83]* [5.00] [1.76] [0.17] [0.63] [1.73]
Tier 1 Capital Ratio -0.106 0.048 -0.091 0.124*** -0.079 -0.785
[0.82] [0.48] [0.73] [5.79] 0.63] [0.44]
Fr(Bad Loans) -0.115 -0.162 -0.103 -0.122***
[1.15] [1.41] [1.05] [3.45]
Trading 0.003 -0.006 0.001 -0.000 0.0001 -0.052
[0.27] [0.94] [0.06] [0.15] [0.05] [0.54]
Risky Tradingt -0.008 0.003 -0.008 0.001 -0.007 -0.127
[0.85] [0.46] [0.87] [0.51] [0.80] [1.21]
Hedging 0.004 -0.006 0.004 -0.001 0.004 0.118
[0.62] [1.14] [0.53] [0.81] [0.53] [1.40]
MBS 0.019*** -0.011* 0.020*** -0.001 0.020*** 0.091
[3.01] [-1.82] [3.13] [0.56] [3.15] [0.87]
%NonTradIncome 1.664 0.701 0.594 0.073 0.56 3.310
[0.85] [0.54] [0.40] [0.24] [0.37] [0.20]
Relationship Length (women)
0.020***
0.020***
0.020***
[3.46]
[3.62]
[3.62]
Constant -0.086 -0.008 -0.092 -0.001 -0.095 -6.302***
[1.37] [0.19] [1.49] [0.11] [1.53] [7.78]
Fr(women)OLS
0.066***
-0.000
-0.832**
[3.03]
[0.68]
[2.44]
N 1,075 1,075 1,130 1,130 1,130 1,130
R2 0.136 0.038 0.134 0.442 0.133 0.420 Kleibergen-Paap rk statistic
11.371
12.373
12.372
[Stock-Yogo 10%]
[16.38]
[16.38]
[16.38]

Hausman [p value]
13.30 [0.00]
3.55 [0.06]
1.68 [0.19]
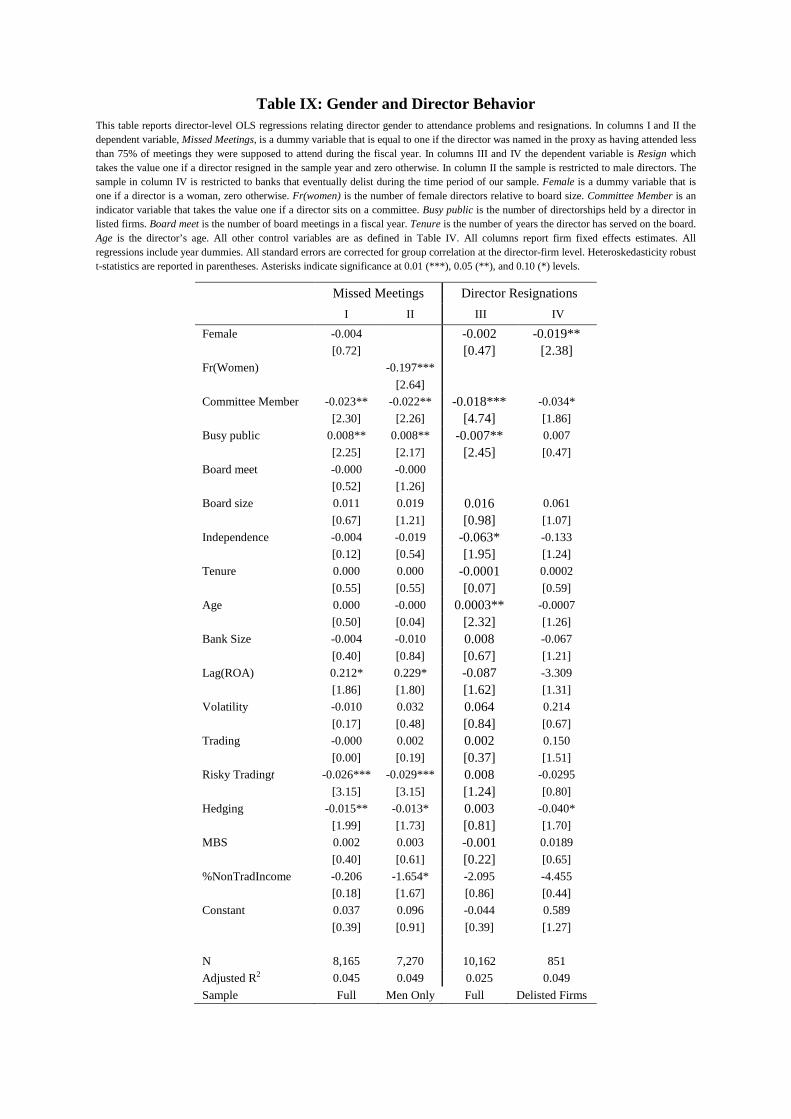
Table IX: Gender and Director Behavior
This table reports director-level OLS regressions relating director gender to attendance problems and resignations. In columns I and II the dependent variable, Missed Meetings, is a dummy variable that is equal to one if the director was named in the proxy as having attended less than 75% of meetings they were supposed to attend during the fiscal year. In columns III and IV the dependent variable is Resign which takes the value one if a director resigned in the sample year and zero otherwise. In column II the sample is restricted to male directors. The sample in column IV is restricted to banks that eventually delist during the time period of our sample. Female is a dummy variable that is one if a director is a woman, zero otherwise. Fr(women) is the number of female directors relative to board size. Committee Member is an indicator variable that takes the value one if a director sits on a committee. Busy public is the number of directorships held by a director in listed firms. Board meet is the number of board meetings in a fiscal year. Tenure is the number of years the director has served on the board. Age is the director’s age. All other control variables are as defined in Table IV. All columns report firm fixed effects estimates. All regressions include year dummies. All standard errors are corrected for group correlation at the director-firm level. Heteroskedasticity robust t-statistics are reported in parentheses. Asterisks indicate significance at 0.01 (***), 0.05 (**), and 0.10 (*) levels.
Missed Meetings Director Resignations
I II III IV
Female -0.004 -0.002 -0.019**
[0.72] [0.47] [2.38]
Fr(Women) -0.197***
[2.64]
Committee Member -0.023** -0.022** -0.018*** -0.034*
[2.30] [2.26] [4.74] [1.86]
Busy public 0.008** 0.008** -0.007** 0.007
[2.25] [2.17] [2.45] [0.47]
Board meet -0.000 -0.000
[0.52] [1.26]
Board size 0.011 0.019 0.016 0.061
[0.67] [1.21] [0.98] [1.07]
Independence -0.004 -0.019 -0.063* -0.133
[0.12] [0.54] [1.95] [1.24]
Tenure 0.000 0.000 -0.0001 0.0002
[0.55] [0.55] [0.07] [0.59]
Age 0.000 -0.000 0.0003** -0.0007
[0.50] [0.04] [2.32] [1.26]
Bank Size -0.004 -0.010 0.008 -0.067
[0.40] [0.84] [0.67] [1.21]
Lag(ROA) 0.212* 0.229* -0.087 -3.309
[1.86] [1.80] [1.62] [1.31]
Volatility -0.010 0.032 0.064 0.214
[0.17] [0.48] [0.84] [0.67]
Trading -0.000 0.002 0.002 0.150
[0.00] [0.19] [0.37] [1.51]
Risky Tradingt -0.026*** -0.029*** 0.008 -0.0295
[3.15] [3.15] [1.24] [0.80]
Hedging -0.015** -0.013* 0.003 -0.040*
[1.99] [1.73] [0.81] [1.70]
MBS 0.002 0.003 -0.001 0.0189
[0.40] [0.61] [0.22] [0.65]
%NonTradIncome -0.206 -1.654* -2.095 -4.455
[0.18] [1.67] [0.86] [0.44]
Constant 0.037 0.096 -0.044 0.589
[0.39] [0.91] [0.39] [1.27]
N 8,165 7,270 10,162 851
Adjusted R2 0.045 0.049 0.025 0.049
Sample Full Men Only Full Delisted Firms


Table X: Director Gender and Committee Membership
This table reports director-level OLS regressions relating director gender to committee service. Committee Member is an indicator variable that takes the value one if a director sits on a committee. Monitoring (Risk) Committee is one if a director sits on a monitoring (risk) committee. Busy public is the number of directorships held by a director in listed firms. Board meet is the number of board meetings in a fiscal year. Tenure is the number of years the director has served on the board. Age is the director’s age. All other control variables are as defined in Table IV. All columns report firm fixed effects estimates. All regressions include year dummies. All standard errors are corrected for group correlation at the director-firm level. Heteroskedasticity robust t-statistics are reported in parentheses. Asterisks indicate significance at 0.01 (***), 0.05 (**), and 0.10 (*) levels.
Committee
Member Committee
Member Monitoring Committee
Monitoring Committee
Risk Committee
Risk Committee
Female 0.036** 0.030* 0.093*** 0.089*** -0.006 -0.006
[2.02] [1.67] [3.74] [3.44] [-0.45] [-0.41]
Busy public 0.028*** 0.031*** 0.045*** 0.046*** -0.006 -0.006
[3.32] [3.70] [3.14] [3.15] [-0.52] [-0.52]
Board size -0.006** -0.005** -0.009*** -0.009** -0.002 -0.002
[-2.48] [-2.08] [-2.72] [-2.36] [-0.91] [-0.70]
Independence 0.060 0.052 0.087 0.090 0.076 0.062
[1.01] [0.86] [1.18] [1.18] [1.62] [1.25]
Tenure -0.003*** -0.003*** -0.009*** -0.009*** 0.000 0.000
[-3.15] [-3.01] [-7.39] [-7.29] [0.71] [0.64]
Age 0.005*** 0.005*** 0.007*** 0.007*** 0.001 0.001
[5.36] [5.40] [6.30] [6.30] [1.31] [1.40]
Bank Size -0.003 0.001 -0.023 -0.014 0.019 0.018
[-0.14] [0.02] [-0.76] [-0.42] [0.59] [0.52]
Lag(ROA) 0.054 0.049 0.109 0.113 -0.761** -0.742**
[0.20] [0.19] [0.24] [0.25] [-2.30] [-2.24]
Volatility 0.024 0.043 0.215 0.232 0.147 0.125
[0.16] [0.29] [1.13] [1.17] [0.89] [0.74]
Loan Ratio
0.062
0.057
-0.028
[0.79]
[0.59]
[-0.35]
Deposit Ratio
-0.010
0.086
0.114
[-0.11]
[0.86]
[1.54]
Tier1 Capital Ratio
0.391**
0.028
0.878***
[2.34]
[0.13]
[4.69]
Constant 0.591*** 0.470** 0.450* 0.235 -0.136 -0.292
[3.14] [2.08] [1.74] [0.72] [-0.51] [-0.89]
N 11,218 10,372 11,218 10,372 11,218 10,372
Adjusted R2 0.134 0.137 0.070 0.069 0.338 0.337

Table XI: Gender and TARP Repayments
This table reports firm-level IV regressions relating the fraction of women directors to the probability a TARP recipient repays CPP funds. We identify recipients of funding under Capital Purchase Program of TARP from the list provided by the U.S. Treasury. We also confirm receipt and repayment of TARP funding from each bank’s 10-K filings in subsequent years. The sample consists of banks that received TARP funds in 2008 or 2009. Column I reports the first stage regression corresponding to the IV regression in column II. The instrument Relationship Length (Women) is the average length of the relationships between directors and women in their network. This is averaged across all directors in the bank. ROA is the bank’s Return on Assets; Fr(Bad Loans) is the ratio of Bad Loans to Total Loans and Repaid Tarp is a dummy variable if a TARP recipient repaid funds and exited TARP and 0 otherwise. All control variables are as defined in the Appendix. All regressions include year dummies. All standard errors are clustered at the crisis id level. Heteroskedasticity robust t-statistics or z-statistics are in parentheses. Asterisks indicate significance at 0.01 (***), 0.05 (**), and 0.10 (*) levels.
Fr(Women) Repaid Tarp
Fr(Women) 4.410*
[1.72]
Independence 0.089 0.247
[1.25] [0.52]
Board Size 0.071*** -0.193
[2.95] [0.74]
Bank Size 0.012* 0.05
[1.86] [1.10]
Volatility -0.203 -2.41
[0.92] [1.50]
ROA -0.204 -0.936
[0.57] [0.35]
Loan Ratio 0.045 0.03
[0.74] [0.07]
Deposit Ratio -0.142 -0.256
[1.32] [0.32]
Tier 1 Capital Ratio 0.778*** -0.121
[2.86] [0.05]
Fr(Bad Loans) 0.429 -5.490**
[1.56] [2.41]
Trading -0.015 0.089
[0.97] [0.77]
Risky Tradingt 0.002 -0.174
[0.11] [1.50]
Hedging 0.003 0.040
[0.18] [0.39]
MBS 0.014 0.007
[0.89] [0.07]
%NonTradIncome -3.631*** 14.027
[2.64] [1.05]
Relationship Length (women)
0.029***
[2.64]
Constant -0.308** 0.569
[2.22] [0.52]
Fr(women)OLS 0.220
[0.88]
N 163 163
Adjusted R2 -0.036 Kleibergen-Paap rk statistic
6.11 [16.38]

[Stock-Yogo 10%]
Hausman [p value]
3.157 [0.08]