lehigh universitydigital.lib.lehigh.edu/fritz/pdf/359_6.pdf · lehigh university libraries ......
TRANSCRIPT

LEHIGH UNIVERSITY LIBRARIES
11111111111111111111111111111111111111111111111111111111111111113 9151 00897706 4
LEHIGH UNIVERSITY
Design Criteria for Continuous Composite
Steel-Concrete Bridges
DEVELOPMENT OF DESleN CRITERIA FOR
CONTI NUOUS CalM PO;SITE
STEEL-CONCRETE BRIDCES - FINAL REPO,RT
by
J. W. Fisher
J. H. Daniels
R. C. Slutter
Fritz Engineering Laboratory Report No. 359.6

CONTINUOUS COMPOSITE BEAMS FOR STEEL-CONCRETE BRIDGES
by
John W. FisherJ. Hartley DanielsRoger G. Slutter
Final Report for Research Project 68-28
"Development of Design Criteria for Continuous CompositeSteel-Concrete Br~dgestt
This research was conducted byFritz Engineering Laboratory
Lehigh University
for
Pennsylvania Department of Transportationin cooperation with the
Federal Highway Administration
FRil~Z Ef'JC:il"-H:ERtNGLAS-ORA1"OO'( UBRARY
The opinions, findings and conclusions expressedin this publication are those of the authors and notnecessarily those of the Pennsylvania Department ofTransportation or the Federal Highway Administration.
Fritz Engineering LaboratoryDepartment of Civ~l Engineering
Lehigh UniversityBethlehem, Pennsylvania
April 1972
Fritz Engineering Laboratory Report No. 359.6

TABLE OF CONTENTS
2. Present Status in the United States 3
1. Introduction 1
3. Parameters Influencing Beam Behavior in the NegativeMoment Region 5
iiAbstract
4. Theoretical Studies 6
5. Experimental Studies 9
6. Influence of Reinforcement and Perimeter Ratios 11
7. Influence of the Free Slab 13
8. Influence of Connector Concentration 15
9. Prestressing the Negative Moment Region 16
10. Design Recommendations 18
11. Conclusions 19
12. Acknowledgments 19
13 . References 19
Appendix A:
Appendix B:
Implementation Statement 21
Examples of Calculation of Stress Range f 26r
Figures 36·

ABSTRACT,
Composite design for bridges 'in the United States has
been limited primarily to simple spans or to the positive moment
(slab in compression) regions of continuous spans. Connectors
are usually omitted from the negative moment regions over interior
supports for basically two reasons: (1) the allowable live load
stress range in the top (tension) flange of the beam conside~ing
fatigue requirements for connectors in this region is substantially
reduced, and (2) there are presently no simple design rules which
consider important factors such as connector strength, influence
of slab cracking, optimum reinforcement, effective width and time
effects (creep and shrinkag~). As a result, most 'designs ignore
any contribution of the slab and reinforcement in the negative
moment regions and consider the steel beam alone.
The basic design criteria and method of proportioning
shear connectors for composite bridge members were developed from
studies at Fritz Engineering Laboratory. When connectors are
omitted from the negative moment regions, overstressing and pre
mature fatjgue failures of connectors can occur well before the
design life of the member has been reached. On the basis of
these findings, AASHO required that additional anchorage connectors
be placed in the vicinity of the dead load inflection points.
A further analytical and experimental research program
was initiated at Fritz Engineering Laboratory in 1968. The pro
gram had four general objectives: (1) to evaluate the extent to
ii.

which connectors can be omitted in the negative moment region;
(2) to determine the necessary requirements for longitudinal
reinforcement in the negative moment region; (3) to evaluate the
effective width in the negative moment region; and (4) to examine
the feasibility of utilizing prestressing in the negative moment
region to improve slab behavior as well as overall composite beam
behavior.
This paper summarizes the results of these studies.
It includes the mathematical models developed to describe behavior
and a summary of the experimental work. The major parameters
examined include the free slab length over which connectors are
omitted, the area and perimeter of the longitudinal reinforcement
in the negative moment region, and the influence of connector
concentration. Design recommendations are given.
iii.

1. INTRODUCTION
Composite steel and concrete beams for bridges have
been used extensively in the United States for a number of years.
The popularity of composite bridge construction led to the adoption
in 1944 of general specifications covering this type of construc
tion. Extensive research leading to practical design rules for
shear connectors and the introduction of stud shear connectors
resulted in the widespread use of composite design in bridges by
the end of the 1950 f s. Today composite construction is used in
bridges primarily for medium span overpass structures. A report
outlining the present worldwide state of the art is contained in
Ref. 1.
Experience on the whole with composite construction has
been satisfactory. However, today more than ever before there is
a need for a more efficient use of material, more reliable pre
dictions of structural behavior, better design procedures, and more
realistic specifications. This need has resulted in further re
search into all aspects of composite construction. Among them
has been considerable research on continuous composite members for
bridges with particular emphasis on the use of stud shear connectors.
Composite design for bridges in the United States has
been limited primarily to simple spans or to the positive moment
(slab in compression) regions of continuous spans. In the latter
case, even though.the steel beam and the concrete deck are con
tinuous, connectors are usually omitted from the negative moment

2.
regions over interior supports for basically two reasons: (1) the
allowable live load stress range in the top (tension) flange of
the beam considering fatigue requirements for connectors in this
region is substantially reduced(2) and (2) there are presently no
simple design rules which consider important factors such as con
nector strength, influence of slab cracking, optimum reinforcement,
effective width and time effects (creep and shrinkage).
As a result, most designs ignore any contribution of the
slab and reinforcement in the negative moment regions and consider
the steel beam alone. Continuous composite designs with discon-
tinuous shear connection are permitted by the AASHO bridge speci
fications providing that additional connectors are placed in the
vicinity of the dead load inflection points to prevent overstress
ing of the shear connectors in the positive moment regions. The
1969 AASHO specifications provide an interim means of improving
designs of this type. There are no provisions which consider the
influence of, or control of slab cracking.
A full scale fatigue test of a two-span continuous com
posite tee beam designed according to the 1969 AASHO specifica-
tions and employing discontinuous shear connection did in fact
result in fatigue failure in the top layer of longitudinal rein
forcement over the support at about half the design life based on
fatigue of the connectors.(3) Bridges in service are experiencing
deterioration of the slabs over the supports due in part to the
presence of cracks resulting from shrinkage of the concrete as
well as from live load stresses.

3.
The balance of this paper will be devoted to a more de
tailed discussion of some of the points just raised. Emphasis will
be given to the results developed on PennDOT Project 68-28, rtDevelop
ment of Design Criteria for Continuous Composite Steel-Concrete
Bridges,Tt which was undertaken at Fritz Engineering Laboratory,
Lehigh University. Among the major variables examined in this study
were: (1) spacing of shear connectors in the negative moment region;
(2) steel reinforcement requirements for the negative moment regions;
(3) evaluation of effective width in negative moment regions; and
(4) prestressing the longitudinal reinforcement of continuous beams.
Details not covered in this report are given in Refs. 3, 7, 9, 10,
13 and 14.
2. PRESENT STATUS IN THE UNITED STATES
The basic design criteria and method of proportioning
shear connectors for simple span composite bridge members were
developed from recent studies at Fritz Engineering Laboratory.( 4)
These studies suggested that the same criteria are also applicable
to the design of shear connectors for continuous composite bridge
beams. This was confirmed in a subsequent investigation. C5 ,6)
However, this investigation indicated that for beams in which
connectors were omitted from the negative moment regions, over
stressing and premature fatigue failures of connectors can occur
in the positive moment regions well before the design life of the
member has been reached.
On the basis of these findings, AASHO required that

4.
additional anchorage connectors be placed in the vicinity of the
dead load inflection points. The purpose of these anchorage connec
tors is to develop the tension force in the continuous longitudinal
slab reinforcement in the negative moment region. The number of
connectors required by AASHO is based on both static and fatigue
requirements. To satisfy fatigue requirements, the range of shear
taken by the connectors is computed using the area of longitudinal
reinforcement associated with the beam over the interior support
and the computed range of stress in the reinforcement due to live
loads plus impact.
The value of 10,000 psi suggested by AASHO for the rein
forcement in lieu of more accurate computations of stress range was
based on the investigation reported in Ref. 6. This permitted a
rapid evaluation of' the additional shear connectors. In Ref. 6 a
two-span continuous composite tee beam was fatigue tested using a
single concentrated pulsating load in each span. The maximum stress
range measured in the reinforcement over the center support'was
20,000 psi, which was also equal to the maximum and allowable stress.
The probability of attainment of a stress range of this magnitude
in an actual bridge was believed low and corresponds to the occur
rence of a design truck in each of two adjacent spans. It is more
likely that the design range of stress will correspond to the re
quired number of passages of a single design truck. On this basis
the reduced stress range was adopted by AASHO. The number of con
nectors required is also based on the assumption that the range of
shear is uniformly distributed within the group of anchorage
connectors.

5.
Additional specification requirements are needed to assure
more satisfactory designs of continuous composite beams with discon
tinuous shear connection. Continuity of the beams and slab brings
many of the advantages of continuous construction. But the omission
of shear connectors over large lengths of the beams introduces addi
tional problems, many of which can be avoided through improved de
sign procedures and specifications.
3. PARAMETERS INFLUENCING BEAM BEHAVIOR
IN THE NEGATIVE MOMENT REGION
Based on the research results reported in Refs. 5 and 6
a further analytical and experimental research program was initiated
at Fritz Engineering Laboratory in 1968. The objective of this
research program was to develop a comprehensive design procedure
for continuous composite beams. The program had four general ob
jectives which were treated as four phases of study. They were:
(1) to evaluate the extent to which connectors can be omitted in
the negative moment region; (2) to determine the necessary require
ments for longitudinal reinforcement in the negative moment region;
(3) evaluation of effective width in the negative moment region;
and (4) to examine the feasibility of utilizing prestressing in the
negative moment region to improve slab behavior as well as overall
composite beam behavior. Some of the significant results of the
studies will be discussed in this paper.
In the detailed investigation of the negative moment
region, three parameters were isolated for study and evaluation:
(1) Ratio of the length 2d T (Fig. la) over which connectors are

6.
omitted (called the free slab length) to the length 2d of the
negative moment region as defined by the dead loads,
(2) Reinforcement ratio P, or the ratio of the area of the longi-
tudinal reinforcement (Fig. Ib) in the negative moment region
to the area of the slab cross section b x t expressed in pere
centage where be is the effective width, and
(3) Perimeter ratio 4, or the ratio of the total perimeter of the
longitudinal reinforcement in the negative moment region to
the area of the slab cross section.
4. THEORETICAL STUDIES
Two methods of analyses were developed for continuous com-
posite beams. One method considered the composite beam as a series
of one-dimensional elements.(7) Nodal points were assumed at each
shear connector location and at intermediate points when connectors
were omitted from portions of the negative moment region.
The analysis considered both elastic and inelastic behav-
ior of all components; i.e. the steel section, concrete slab, rein-
forcement, and shear connectors. The analysis provided the distri-
bution of stress resultants at any arbitrary cross section in both
positive and negative moment regions. From the stress resultants
acting on the cross section of an element (such as element i in
Fig. 2), equilibrium of the element can be established. Since the
elongation of the slab relative to the steel beam is fi(8 s-8b)ds
and is equal to the slip that occurs in element i, this yields
[ .(8 -sb)dst l S
= u. 1 - u.l+ l
( 1)
For a linear load-slip relationship, a system of equations in terms
of the unknown element forces is therefore obtained as follows:

7.
1 (~ + -l- Ll s . ) F. 1Fi +1 M. ~. ~s. ( 2)K Fi _1 + a. +-- - -K. K. 1 1. 1. 1. K. 1 1 1. 1.
1. 1+ l+
where 0:.I 1 1
- E A +-- +EsI s Eblb1. s s EbAb +
~ . = Zl E I + E
b1 bs s
Equation 2 is identical to the simultaneous equations that result
from NewmarkTs differential equation(B) for incomplete interaction
when expressed in finite difference form.
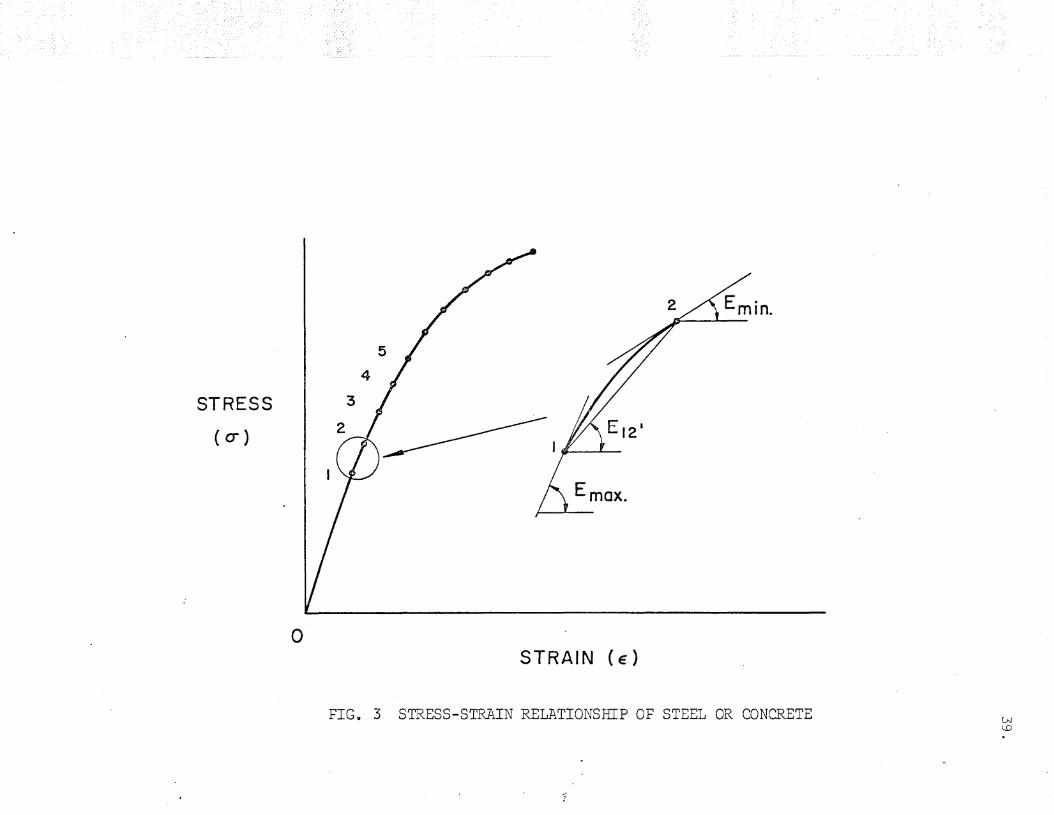
An incremental load procedure was used to obtain solu-
tions in the inelastic region of various components. Different
stiffnesses were assigned to each element by determining the tan-
gent modulus for the concrete and steel at each increment of load
as illustrated in Fig. 3. Incremental strains and stresses were
determined for each load increment and were used to approximate
the tangent modulus for successive load increments.
The non-linear load-slip behavior of the connectors was
also accounted for by the incremental load method. For the load-
slip relationship given in Fig. 4, an incremental connector stiff-
ness K. can be determined for each point on the curve.1
ment u. can be expressed as1
Q.ll.
_ ld.
1 -r - 1l
The displace-
( 3)
This value can be readily incorporated into Eq. I.and results' in
a correction (d. 1 - d.) that must be added to the right side of1+ 1
Eq. 2.

8.
To account for the cracked slab that existed in the nega-
tive moment region, an equivalent uncracked slab with decreased
stiffness was assumed. The magnitude of this stiffness was esti-
mated from the evaluation made by the second method of analysis.
The second method of analysis considered the stress resul-
tants in the negative moment region of a continuous beam with a
length of free slab(9). It provided a means of estimating the
cracked slab stiffness and was more suited to developing a simpli
fied design procedure.
The composite tee beam used in the theoretical studies
is shawn in Fig. 5. The cross section through the free slab is as
shown in Fig. lb. This beam represents a symmetrical two-span
continuous beam with symmetrically placed live loads P equi-distant
from the exterior supports. The negative moment region of this
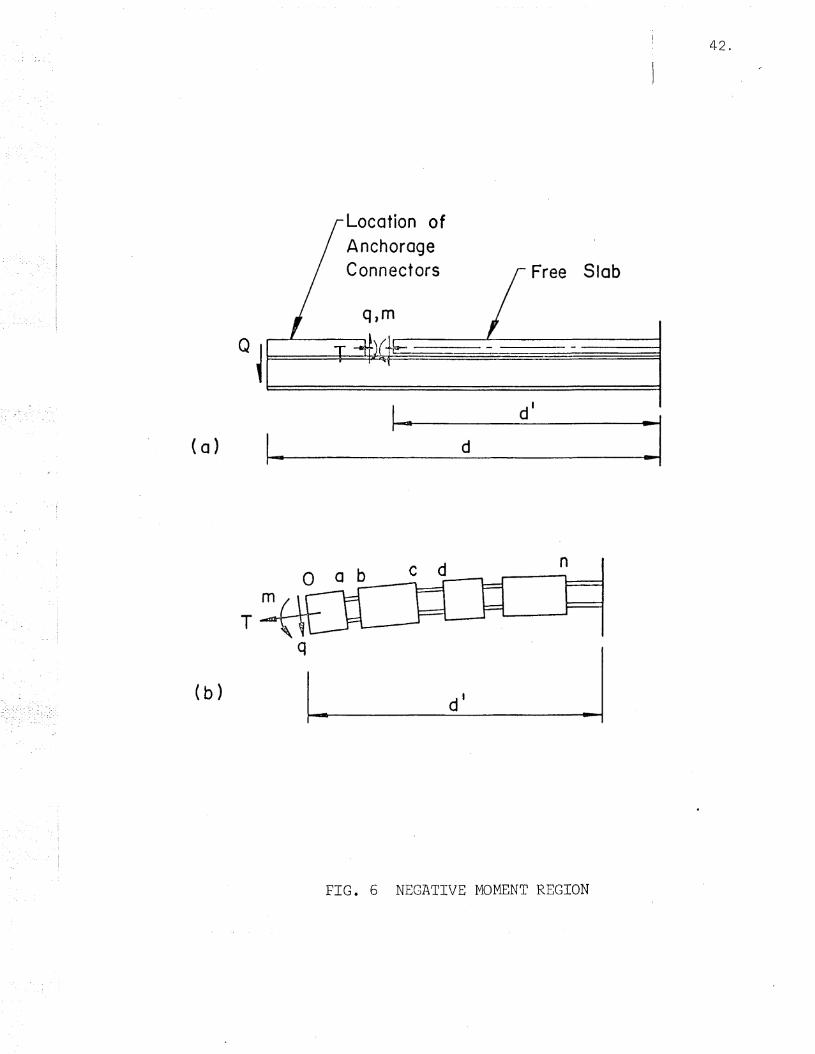
beam which contains the free slab is shown in Fig. 6. The beam in
this figure is subjected to a live load shear force Q at the inflec
tion point where Q is a function of P. The corresponding stress
resultants at the end of the free slab are shear q, moment ill, and
axial force T as shown in Fig. 6a.
A first-order flexibility (force) analysis was used 'for
Method 2 and expressions derived relating Q (or P) to q, m and T
within three domains which are defined by the variable ~ (Fig. 5)
which can vary between 0 and 1. The free slab (portion of slab
with no shear connection) stress resultants cause random trans-
verse cracking of the free slab. For'ana~ysis purposes, the free

9 .
slab was idealized by a series of uncracked slab elements and rein
forcing bar segments of random lengths as shown in Fig. 6b. The
flexibility of the free slab therefore is a function of the flexi
bilities of the slab elements a-a, b-c, etc. and reinforcing seg
ments a-b, c-d, etc.
The axial flexibility of the free slab can be expressed
in terms of a coefficient of participation of the free slab which
can be designated CI . This coefficient is unity for an uncracked
slab and zero for a fully cracked slab. The latter case corresponds
to the assumption normally used in a simple tie-bar analysis. Eval
uation of the coefficient C1
which is a function of magnitude and
position of the live loads as well as other factors such as exis
tence of shrinkage cracks, length of free slab, reinforcement
and perimeter ratios, and concrete strength required experimental
evaluation.
5. EXPERIMENTAL STUDIES
The experimental phase of the investigation was in effect
an extension of the test program reported in Refs. 5 and 6. The
purpose of the experimental investigation was to (1) evaluate the
assumptions used in the analysis, (2) determine the magnitudes of
the stress resultants in the negative moment region, (3) evaluate
the coefficient Cl , and (4) compare actual and predicted behavior.
Two two-span tee beams were tested. They were designated beams
CC-3F and CC-4F. Details of these beams are shown in Fig. 7a.

10.
These beams were similar to beams CC-IF and CC-2F reported in Refs.
Sand 6 except for variations in the three parameters previously
mentioned.
In addition, six shorter test beams designated SC-38 to
8C-8S inclusive and consisting only of the negative moment regions
of two-span beams were tested. Details of these beams are shown
in Fig. 7b. Cross-section details for all test beams are shown in
Fig. 7c .. Beams SC-38 and SC-48 were made identical to the negative
moment regions of beams CC-3F and CC-4F. These two beams were
nearly identical to beam CC-IF differing only in the use of anchor
age connectors and the reinforcement ratio for the longitudinal bars.
The experimental design for the six shorter test beams is shown
in Table 1. The reinforcement shown in the table was placed only
in the top layer (Fig. 7c).
The two-span beams were first tested ~o 2,000,000 cycles
of load application that subjected the shear connection to the
average allowable values permitted by AASHO for the loading con
dition. Connectors were also placed so that the nominal tensile
stresses in the.beam flange would not be critical for fatigue of
the base metal adjacent to the connectors. The beams were also
tested statically to their maximum load carrying capacity. The
shorter beams were also loaded statically to their maximum load.
The loads were" applied to produce negative bending moment or a
slab in tension as shown in Fig. 7b. The beams under test are
shown in Fig. 8.
The complete results of this investigation are presented

11.
in Refs. 3, 7, 9, .10, 13 and 14. The more significant results will
be discussed with emphasis on the parameters affecting the behavior
of the negative moment region.
6. INFLUENCE OF REINFORCEMENT AND PERIMETER RATIOS
The AASHO bridge specifications require that for main
slab reinforcement perpendicular to traffic, distribution rein
forcement is to be placed transverse to the main reinforcement and
in the bottom of the slab. Assuming that the effective slab width
of the test beams (Fig. 7c) is controlled by the beam spacing of
60 in. then for a 6 in. slab supporting an HS 20-44 wheel load,
the maximum distribution steel requirement results in a reinforce
ment ratio of about 0.61 or 11 - No.4 bars all placed near the
bottom of the slab. Satisfactory control of cracking in the top
surface of the slab requires reinforcement near the top surface.
Also, investigations to date indicate that a larger reinforcement
ratio than that determined by AASHO distribution steel requirements,
most of which is near the top surface is desirable.(3,6)
Reinforced concrete research has also established the
effectiveness of a larger number of smaller diameter bars in mini
mizing crack widths. (11) In this investigation, the reinforcement
ratio p was varied from 0.61 to 1.02. The perimeter ratio r was
varied from 0.026 to 0.054 as shown in Table 1. The bottom layer
of reinforcement was constant at 5 - No.4 bars for all six test
beams as shown in Fig. 7. The top layer of reinforcement was
varied as shown in Table 1.

12.
The cracking behavior of the slab for the six negative
moment test beams is shown schematically in Fig. 9 for the working
load level which was defined previously. The crack patterns in the
negative moment regions of beams CC-3F and CC-4F were similar to
those shown in Fig. 6 for beams SC-3S and SC-4S. The measured
average crack widths were 19.5 x 10- 3 and 4.8 x 10- 3 for beams
CC-3F and CC-4F, respectively (Ref. 11). It is apparent that the
average observed crack width decreases with an increase in both
the reinforcement and perimeter ratios. The greatest reduction,
however, was associated with increases in reinforcement ratio.
A rule of thumb often used by designers is that for con-
crete in tension, the yield strength of the reinforcement should
not be less than the cracking strength of the concrete. Applying
this rule to the test beams would require a reinforcement ratio of
crete and f = 40,000 psi for the reinforcement. The test resultsy
which show a sharp reduction in crack width for p = 1.02 support
about 1.0 percent. This is based on £T = 4,000 psi for the cone
the validity of such a rule. On the basis of this and previous
investigations, a reinforcement ratio not less than 1.0 percent and
perhaps as high as 1.5 percent should be used in the negative
moment region for effective crack control. A considerable amount
of this longitudinal reinforcement should be near the top of the
slab. It is of interest to note here that in the United States
the Federal Highway Administration (FHWA) requires a somewhat higher
reinforcement ratios for slabs in the negative moment regions of
typical continuous concrete T-beam and box girder bridges. (12 ) The
recommended ratios are about 2.5 percent for the T-beam and about
13.
4 percent for the box girder bridges. The respective ratios for
top slab reinforcement alone are about 2 percent and 3.5 percent.
7. INFLUENCE OF THE FREE SLAB
In the investigation'reported in Ref. 6, the ratio dtjd
was 1.0 for beam CC-IF and about 0.28 for beam CC-2F. For this
investigation, the ratio dtjd was chosen as 0.44 or 0.80 for all
test beams. The smaller value corresponds to placing connectors
approximately at the point where the allowable stress in the base
metal is governed by the AASHO fatigue requirements. (2) The larger
value corresponds to placing the required anchorage connectors
within the limits specified by AASHO. (All anchorage connectors
were placed on the negative moment side of the inflection point.)
Examination of Fig. 9 shows that the effect of the reduced free
slab length is to reduce average crack widths. These beams also
exhibit a larger number of narrower cracks compared with beams
with the longer free slabs.
One of the purposes of the experimental phase of the
investigation was to evaluate the coefficient of participation of
the free slab C1
. The value of C1
was influenced considerably by
the level of axial force T carried by the free slab which is a
function of the applied loads P. For loads close to zero, Cl varied
from about 0.80 to 0.90 for all test beams. As the loads increased,
the values of C1
decreased nearly linearly. For most of the beams,
C1
varied from 0.25 to 0.60 when the maximum load carrying capacity
was reached. The minimum value of C1 was 0.25 for all tests. At

14.
the working load level, C1
varied from 0.40 to 0.77 with an average
value of 0.60 for those beams with reinforcement ratios of 0.89 and
1.02.
These studies indicate that the behavior of the free slab
can be adequately represented by a tie bar whose length is about
60 percent uncracked concrete and 40 percent reinforcing steel.
Such a model can be used to calculate the average stress range in
the longitudinal reinforcement. Such a calculation was performed
for beams CC-3F and CC-4F. The allowable stress range for the re
inforcement in these two beams for 2,000,000 cycles of load appli
cation is about 20,000 psi.(9) The predicted stress range for
beam CC-3F using a calculated value of C1 for that beam of 0.59
was approximately 25,000 psi. On this basis fatigue failure of
reinforcing bars could be expected and was observed at about
1,000,000 cycles. On the other hand, the predicted stress range
for beam CC-4F using the value of C1
for that beam of 0.46 was
about 17,000 psi. No fatigue failures of the reinforcement in
beam CC-4F were observed prior to reaching 2,000,000 cycles of load
application.
This analysis was further confirmed by the mathematical
model (Method 1) using a series of discrete elements. A coefficient
of participation C1 = 0.6 is equivalent to a slab with an effective
axial stiffness equal to about 20% of the uncracked slab. The
predicted variation in slab force throughout the length of com
posite beam CC-4F is given in Fig. 10. In the negative moment
region two conditions were evaluated. One considered the stiffness

of the reinforcement alone (the dashed line) and the second used
the effective stiffness. The predicted slab forces are compared
with the meas~red values and show good agreement when the effective
stiffness was considered.
A more detailed examination of the negative moment region
is given in Fig. 11. This illustrates that cyclic loading did not
significantly change the response of the negative moment region.
Also better agreement is apparent when the actual stiffness of the
slab is considered. Good agreement was also observed when the
predicted results were compared with the test results from other
continuous beam tests.(7)
Method 2 was also used to calculate the stress range in
the free slab reinforcement for several typical three span bridges
considering the passage of an AASHO HS20-44 truck or equivalent
lane loading. (9 ) Main spans were varied from 50 to 240 ft. and
C1 was varied from 0.4 to 0.8. Reinforcement ratios were 0.61
and 1.0. The resulting stress ranges varied from about 2,000 psi
for the 240 ft. main span with C1 = 0.40, p = 1.0 and lane loading
to about 6,000 psi for the 50 ft. main span with C1 = 0.80, p = 0.61
and truck loading. The AASHO stress range provision of 10,000 psi
based on test results reported in Ref. 6 for a 25 ft. span thus
appears to be conservative for most practical bridge beams when
used to proportion anchorage shear connectors.
8. INFLUENCE OF CONNECTOR CONCENTRATION
The influence of the degree to which connectors are

16.
concentrated or spread out in the negative moment region on the
free slab behavior, and the individual connector behavior, is quite
complex. Although additional analytical studies are needed, some
tentative comments are possible based on the investigations reported
in Refs. 7 and 9. These investigations indicate that as the free
slab length decreases, the total shear taken by the anchorage con
nectors may increase or decrease depending in part on the rein
forcement ratio. A decrease in free slab length tends to increase
the axial force carried by the free slab because of the increased
stiffness of the negative moment region. However, this results in
a greater degree of cracking of the free slab (Fig. 9) which has
the effect of reducing the value of C1
. A decrease in C1 will in
turn result in a decrease in the axial force in the free slab.
The predicted distribution of force acting on individual
connectors confirmed that connectors adjacent to the free slab were
more highly stressed than expected if the concrete slab were ne
glected altogether. Design procedures must account for this force
if satisfactory connector behavior is to be provided.
Investigations also indicate that the assumption of uni
form distribution of stress range to connectors within the anchorage
connector group is fairly realistic. This appears to be because
of the redistribution of forces which occur within the connector
group during cyclic loading.
9. PRESTRESSING THE NEGATIVE MOMENT REGION
A pilot study was undertaken to investigate the feasibility
17.
of longitudinal prestressing of the concrete slab in the negative
moment region of continuous composite beams.(13) There are several
possible advantages. The most obvious advantage is that sufficient
prestress can be introduced to eliminate transverse cracking of the
slab. A reduction in the requirements for ordinary longitudinal
reinforcement is therefore possible. Sufficient prestress can also
be introduced to enable the design to be based on a constant flex
ural stiffness providing that continuous shear connection is used,
thereby reducing the cross-section requirements in the positive
moment regions.
With a proper proportioning of the negative moment cross
section, the live load stresses in the top flange of the steel beam
can be reduced below the allowable stress range for fatigue, thereby
enabling connectors to be placed continuously through the negative
moment region. A disadvantage is the extra time and cost involved
to prestress the slab. However the extra cost involved may well
be offset by the increased durability of the slab in the negative
moment region and subsequent reduction in maintenance or replace
ment costs. Costs related to the prestressing itself can be mini
mized through proper design and construction procedures. An impor
tant consideration is whether or not to post-tension the slab be~
fore or after the slab is made composite with the steel beam.
This would depend to some extent on whether the slab is cast-in
place or precast. It also depends on the desired state of stress
in the steel beam under live loads.
18.
10. DESIGN RECOMMENDATIONS
These studies have confirmed the desirability of increas-
ing the amount of longitudinal reinforcing steel in the slab over
the negative moment region to at least 1% of the cross-section area
of the concrete. It is desirable for most of this reinforcement
to be placed near the top surface of the slab. This will assist
with controlling the cracking behavior of the negative moment region
and provide a more favorable stress state in the longitudinal rein-
forcement. A suggested change to Art. 1.7.100 is shown in Appendix A.
The magnitude of slab force was greater than predicted
from the steel reinforcement alone when shear connectors were
omitted from the negative moment region. The connectors placed near
the points of contraflexure and the reinforcement were overloaded.
This condition was partially corrected with an increase in the
amount of longitudinal reinforcement to 1% of the cross-section
area of the concrete.
If it is desired to make a more accurate estimate of the
stress f in the longitudinal reinforcement, methods for makingr
these estimates have been developed. These studies indicate that
the longitudinal slab force can be reasonably approximated from 20%
of the uncracked area of the concrete slab in the negative moment
region when the percentage of reinforcement is 1%. Alternately,
the free slab can be represented by a tie bar whose length is com-
posed of 60% of the uncracked concrete slab and the remaining 40%
the longitudinal reinforcement. Appendix B shows examples of this
computation.

19.
The study has confirmed the suitability of other provi-
sions of the AASHO specifications.
11. CONCLUSIONS
The need today for more economic structures, more effi-
cient use of materials, and more precise methods of analysis for
predicting the behavior of structures has resulted in increased
activity in the area of composite beam research. A significant
development has been the consideration of continuous composite
beams for bridges and the results of recent research investigations
in this area. Recent research has provided the designer with in-
creased opportunities to take advantage of the inherent stiffness,
strength and economy of continuous composite construction.
12 • ACKNOWLEDGMENTS
The research described in this paper was conducted at
Fritz Engineering Laboratory, Lehigh University, Bethlehem, Penn-
sylvania. The Pennsylvania Department of Transportation (PennDOT)
and the Federal Highway Administration sponsored this program. The
authors are indebted to Yo Co Wu, Ie Garcia and F. W. Sarnes who
worked as research assistants on this program.
13. REFERENCES
1. McDEVITT, C. F. and VIEST, I. M., - Interaction of DifferentMaterials. Introductory Report, Ninth Congress, InternationalAssociation of Bridge and Structural Engineering (IABSE), 1971,pp. 55-79 (Prepared for the 9th Congress, May 8-13, 1972).
*
20.
2. AMERICAN ASSOCIATION OF STATE HIGHWAY OFFICIALS - StandardSpecifications for Highway Bridges. AASHO, Tenth Ed., Washington, D~ C., 1969.
*3. WU, Y. C. and SLUTTER, R. G., - Continuous Composite Beams underFatigue Loading m Fritz Engineering Laboratory Report No. 359.2,Lehigh University, Bethlehem, Pa., 1971.
4. SLUTTER, R. G. and FISHER, J. W., - Fatigue Strength of ShearConnectors. Highway Research Record No. 147, Highway ResearchBorad, Washington, D. C., 1966.
5. DANIELS, J. H. and FISHER, J e W., - Static Behavior of Continuous Composite Beams. Fritz Engineering Laboratory ReportNo. 324.2, Lehigh University, Bethlehem, Pa., 1967.
6. DANIELS, J. H. and FISHER, J. W., - Fatigue Behavior of Continuous Composite Beams. Highway Research Record No. 253, Highway Research Board, Washington, D. C., 1968.
*7. WU, Y. C., SLUTTER, R. G., and FISHER, J. W., - Analysis ofContinuous Composite Beams. Fritz Engineering Laboratory ReportNo. 359.5, Lehigh University, Bethlehem, Pa., 1971.
8. NEWMARK, N. M., SIESS, Co Po and VIEST, I. M., - Test andAnalysis of Composite Beams with Incomplete Interaction, Proc.Society for Experimental Stress Analysis, Vol. 9, No.1, 1951.
*9. GARCIA, I. and DANIELS, J o Ho, - Negative Moment Behavior ofComposite Beams. Fritz Engineering Laboratory Report No. 359.4,Lehigh University, Bethlehem, Pa., 1971.
*10. GARCIA, I. and DANIELS, J. H., - Tests of Composite Beams underNegative Moment. Fritz Engineering Laboratory Report No. 359.1,Lehigh University, Bethlehem, Pa., 1971.
11. GERGELY, P. and LUTZ, Le A., - Maximum Crack Width in ReinforcedConcrete Flexural Members; Causes, Mechanisms, and Control ofCracking in Concrete. SP-20, American Concret~ Institute, ACI,1968.
12. U. S. DEPARTMENT OF TRANSPORTATION - FEDERAL HIGtMAY ADMINIS-"TRATION - Standard Plans for Highway Bridges a Volume IV,Typical Continuous Bridges, Washington, Do Co, 1969.
*13. SARNES, F. C. and DANIELS, J. H., - Prestressing the NegativeMoment Region of Composite Beams. Fritz Engineering LaboratoryReport No. 359.7, Lehigh University, Bethlehem, Pa., 1971.
*14. GARCIA, I. and DANIELS, J. H., - Variables Affecting the Negative Moment Behavior of Composite Beams, Fritz EngineeringLaboratory Report No. 359.3, Lehigh University, Bethlehem, Pa.,1971.
These reports were completed as a portion of Research Project 68-28

21.
APPENDIX A: IMPLEMENTATION STATEMENT
A.I: Preface
Since the provisions for Composite Girders (Art. 1.7.97
to 1.7.101) were ~evised and adopted in 1967, further research on
continuous composite steel-concrete members has indicated that
additional provisions and criteria are desirable. In addition,
the ultimate strength of individual shear connectors has been more
accurately defined. As a result suggested changes in the AASHO
Specifications are detailed in Section A.2 of this Appendix,
A.2: Proposed Specification
Add the following corrections and additions to Articles
1.7.100 and 1.7.101,

1.7.100
"
DESIGN 131
anchorage
I
In the n~gative moment regions of contin-uous spans, the minimum longitudinal reinforce-ment including the distribution reinforcementmust equal 1% of the cross-section area of theconcrete slab. Two-thirds of this required r---reinforcement is to be placed in the top layerof slab within the effective width. Placementof distribution steel as specified in Art.1.3.2E is waived.
When shear connectors are omitted fromthe negative moment region, the longitudinalreinforcement shall be extended into thepositive moment region beyond the anchorageconnectors at least 40 times 'the reinforcementdiameter.
'Yvith effective intern1cdiate supports \vhich are kept in pltlce until the concrete has attained 75 percent of its required 28-day strength, the QC.1d andlive load stresses shall be computed on the basis of the composite section.
In continuous sp~lns, the positive mon1ent portion may be designedwith conlposite'sections as in simple spans.. Shear connectors shall be provided in the negative moment portion in \vhich the reinforcement steelen1bedded in the concrete is considei~ed a part of the composite section. Incase the reinforcement steel embedded in the concrete is not used in COll1
puting section properties for negative moments, shear connectors need notbe provided in these portions of the spans, but additional\connectorsshall be placed in the region of the point of dead load can trarlcxure inaccordance \vith Art. 1.7.101 (.l~) (3). Shear connectors shall be providedin accordance \vith Article 1.7.101.
/\
·1.7.101 - SHEAR
(Al Horizontal Shear
The maximum pitch of shear connectors shall not exceed 24 inches,except over the interior snpports of continuous bealTIS "\vhere \viclerspacing may be used to avoid placing connectors at locations of highstresses in the tension flange.
Resistance to horizontal shear shall be provided by mech~nic3.1 shearconnectors at the junction of the concrete slab and the steel girc:cr. Theshear connectors shall be mechanical devices placed trans\'el'sely acrossthe flange of the girder spaced at regular or variable interval;:;. Theshear connectors shall be designed for fatigue -x- and checked for ultimate strength.
(1) Fatigue
The range of horizontal shear shall be computed by theformula:
s == VrQr I
\vhere Sr== the range of horizontal shear per linear inch at thejunction of the slab and gird8r at the point in the spanunder consideration.
Vr == the range of shear due to live loads and impact. At anysection, the range of shear shall be taken as the difference in the n1inimum and maximum shear en\"clopes(excluding dead loads).
Q== The statical moment about the neutral axis of the composite section, of the transformed compre3sive concrete area or the area of reinforcement embedded inthe concrete for negative moment.
• Reference iB made to the paper titled "Fatigue Stl'c:ngih of Shear Conncctors" by Hogc'r G.Slutter a.nd John W. Fisher in HIGH\VAY RESEARCH RECORD, ~o. 147, pu!JJishcd by theIiiJ:hwny Research Board, \Vnshington. D.C., 1966.
Nr'0

122 fIIGH\VAY nH.IDGES . 1..7.101
I =: 'rile 1l10rnent of inertia of the transformed compositegirder in positive mOll1cnt regions or the mOTIlent ofinertia provided by the steel beam including or excluding the :trca of reinforcement embedded in the concrete in negative moment regions.
(In the nbove, the compressive concrete area is transformedjnto an equivalent area of steel by dividing the effective concreteflange \vidth by the modular ratio, "n".) ,
The allo\yable range of horizontal shear, HZ/', in pounds op. anindividual connector is as follo\vs:
Channels Zr::::B'\v\Velded studs (for ratios of Hid equal to or greater than 4)
Zr==c:dz
\vhere \y =; the length of a channel shear connector in inchesmeasured in a transverse direction on the flange ofa girder.
d == di~l1ncter of stud, in inches
cc == 1;3-,000 for 100,000 cycleslO,GOO lor 500,000 cycles7,850 for 2,000,000 cycles
B =: 4,000 for 100,000 cycles3,000 for 500,000 cycles2,4DO for 2,000,000 cycles
I-I == height of stud in inche.s
The l'equired pitch of shear connectors is determined by dividing the allo\vablc range of hori'Zontal shenr of all connectors at onetransverse girder crossection (2:Z r ) by the horizontal range of shearSI' pel' linear ineh. Over the interior supports of continuous~b"'T"ea_n_l_s_- _the pitch may be modified to avoid placing the connectors/at loca-tions -of high stresses in the tension flange provided that the totalnumbcl' of connectors remains unchanged.
(2) Ultimate Strength
T\he nUTIlbcr of connectors so provided for fatigue shall bechecked to ensu rc that adequate connectors are provided for ultirnate strength. The number of shear connectors required betVv"eenthe points of nlaximum positive moment and the end supports ~.,ae:1d lo'H:1 pgin IT of contl'tJ flGXblrQ, aI=ld 'bGt'3'ggn pQiyt~ Qt' l+lQximnmnegHtive H}Ofrlcnt and tRo dend load points of eontraflOJEUre rcihal1'equal 01' exceed the number given by the. formula:
p1i== d.Sl' 't' u
N1
N1
1'VLN

1,7.101 . DESIGN 1")')lJ·J
or
The number of connectors N2
required betweenthe points of maximum positive moment and pointsof adjacent maximum negative moment shall equalor exceed the number given by the formula:
N2
P + P3
- cp Su .
N1
,,,here'" == the nU111bcr of connectors bet\VeCll rJoints of ln~l.XlrnUm
positive moment and adjacent end supports or (:i_~ad loadpoints of -contraflexure, or b8t\Veen points of lraxinlUJl1negative- nl0mcnt and adjacent dead load points of C.Olltraflexure~
Su =the ul timnte strength of the shear connecter as givenbelo\v~
</J== a redn~tion factor == 0.85.
P:;::: force in the 31~b as defined hereafter as P 1,jP~1~
...J:\.t points of maXin1l.1ffi positive moment, the force in the slab istaken as the srnallcl' value of the fornlulas:
p 1:::: p....s F).
orP2=O.85 f'c be
where As==' total area of the steel section including coyerplates.
F J.:::: specified Ininimum yield point of the steel being used.
f/e= compressive strength of concrete at age of 28 days.
b= effective flange '\vidth given in Art. 1.7.99.
c == thickness of the concrete slab.
At'points of maximum negative moment the force in the slabis tn-ken as:
P3==A;F~
Modulus of Elasticity of the concrete,
0.0004 d2 Jf' E
c csu
Ec
psi (Ec
33 w3
/2 ~)
c
---,
J
,vhere A ~ == total area of longitudinal reinforcing steel at the interior support \vithin the effective flange \vidth.
F; == specified ll1inimum yield point of the reinforcing steel.
The ultimate strength of the shear connecter is given ~s fol1o\ys:Channels:
8u==550 (h+t/2) 'v \/f'r
\\Telded Studs (Hid ~ 4) :
Su 930 dt) vrrc'\vhcre Su == ultimate strength of individual shear connector, in
pounds.
h == the average flange thickness of the channel flange, ininches.
t== the thickness of the \veb of a channel, in inches.
\v== length of a ch:lnnel shear connector, in inches.
f'c:::: compressive strength of the concrete at 28 days, psi.
d== diameter of stud, in inches.
rv~
j :~.l. IJIGI-I\V1\Y BRIDGES 1,:7.101
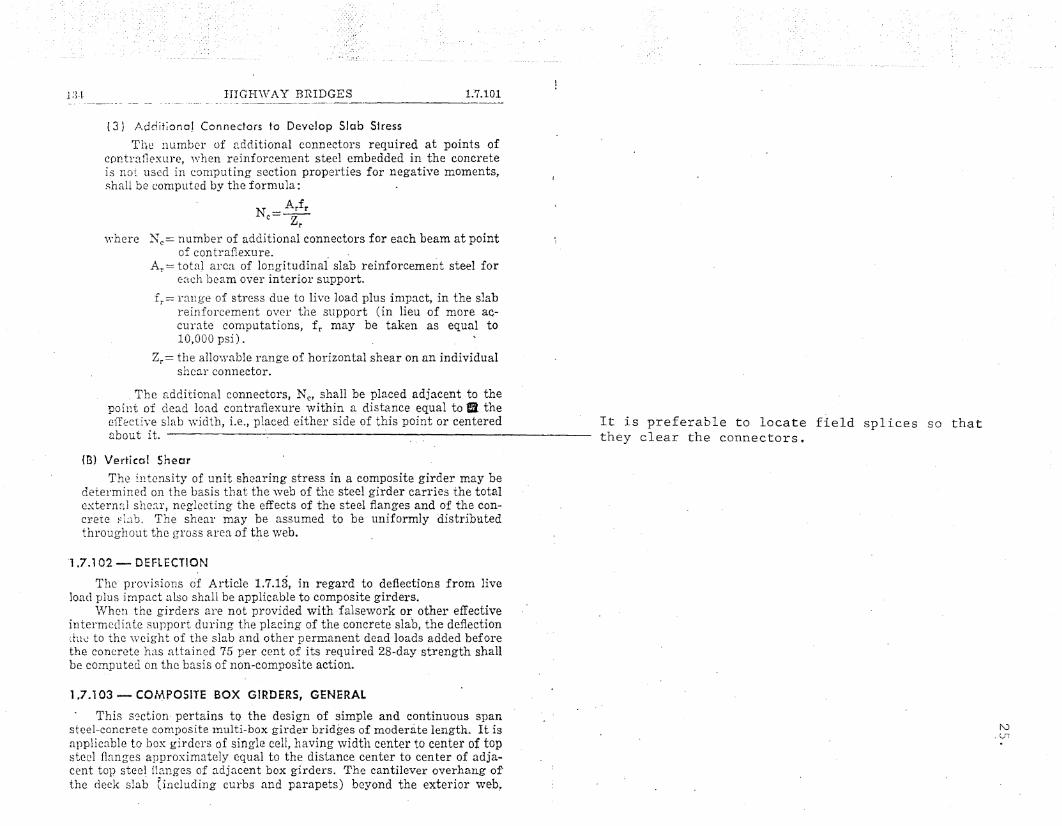
(3) j.l,Oc1it;onaJ Connectors to Develop Slab S1ress
The nUlnber of ~ldditional connectors required at points ofcontral1exure, \vhen reinforcenlent steel embedded in the concreteis not used in c.onlputing section properties for negative moments,shall be conlputed by the fornlula:
N == ArfrC Zr
v;here Nc == number of additional connectors for each beam at pointof con traflexu reo .
A r == total area of longitudinal slab reinforcement steel foreach b0am over interior support.
I r == range of stress due to live load plus imp~ct, in the slabreinforcement over the support (in lieu of more accurate conlputations, f r rnay be taken as equal to10,000 psi) .
Zr == the allo~,Yable range of horizontal shear on an individualshear connector.
The additional connectors, N C' shall be placed adjacent to thepoint of dead load contral1exure \vithin a distance equal to il theefIective slab \vidth, i.e., placed either side of this point or centered~bout it. ------------------------------
(B) VerHcoI SheaT
The intensity of unit shearing stress in a composite girder may bedetermined on the basis that the \veb of the steel girder carries the totalextern~d shc~r, neglecting the effects of the steel flanges and of the concFete flab. The shear may be assumed to be uniformly distributedthroughout the gross area .of the \veb.
'1.7.102 - DEFLECTION
".fhc provisions of Article 1.7.13, in regard to deflections from liveload plus impact also shall be applicable to composite girders.
\VhCIl the girders are not provided with false\vork or other effectiveintern1cdiate support during the placing of the concrete slab, the deflectiondui..: to the \veight of the slab and other permanent dead loads a.dded beforethe concrete h~lS attained 75 per cent of its required 28-day strength shallbe computed on the basis of non-composite action.
1,7.103 - COf,~POSITE BOX GIRDERS, GENERAL
This s?ction' pertains to the design of simple and continuous spansteel-concrete COll1posite Inulti-box girder bridges of moderate length. It isapplicable to box girders of single cell, having \vidth center to center of topsteel flanges approximately equal to the distance center to center of adjacent top steel. flanges of adjacent box girders. The cantilever overhang ofthe deck slab (including curbs and parapets) beyond the exterior \veb"
It is preferable to locate field splices so thatthey clear the connectors.
N. Ln

APPENDIX B: EXAMPLES OF
26.
(n=8)
CALCULATION OF STRESS RANGE fr
The following two examples indicate the proposed rational
method of calculating the range of stress f in the longitudinalr
free slab reinforcement of continuous bridge beams. Further details
are presented in Ref. 9.
EXAMPLE NO.1 (For Truck Loading)
In this example f will be calculated for a 3-span conr
tinuous composite bridge beam with AASHO HS20-44 truck loading.
Composite Beam Parameters:
Spans - 80 T - lOOT - 80 T
Stringer Spacing - 7 T - lOT
Slab thickness - 7-1/2 TT
Slab fT ~ 4 000 psic '
Effective slab width - 90 TT
Steel beam section - W36 x 245 (cover plates are omitted for
simplicity in this example)
Range of C1 - 0.4 to 0.8
Longitudinal reinforcement - 1.00% (e1
= coefficient of participation
Ref. 9)
Following the notation used in Ref. 9:
bs
=
=
6.75 in. 2
90 in.

27 .
t .- 7-1/2 in.
p = 1.00%
A2
72.03 in. 2=
L :::: 100 ft.
12
16,092 in. 4=
E IE = 8s c
b = 21.75 in.
d f = 22 T-6 rt (minimum value recommended by AASHO)
2P = 67.3 kips (AASHO wheel load times lateral distribution
factor times impact for HS20-44 truck)
Calculation of 13
: (Moment of inertia of composite section)
•1
= 72.03x18 + (90 x 7.5) (8) (36 + 7.5/2)
72.03 + (90x7.5) ~= 29.7 in. (referred
to bottom flange)
21
3= 16,092 + 72.03(29.7-18.0)2 + (90~7.5) (36.0+7.5/2-29.7)
1 3 = 36,612 in. 4
Calculation of constants
= 36,61216,092 = 2.280

36,612(16,092-36,612) = -1.785
28.
In this example C1
will be taken as 0.8. The solution
follows similarly for Cl = 0.4. Ac
= area of free slab.
90 x 7.5 2= 8 x 0.8 + (1-0.8);0.010 = 25.6 in.
Al 25.60~ = = 0.356A2 72.03
~2 = 0.5 (See Art. 9.3, Ref. 9) For load 2P @midspan a 2 = 0.5
2
1 + P2 (1 1) = 1 + (14.95) (1 + 1 ) = 3.62= ~ + - 21.75 0.356alB
= d t = 22.5 =L 100
0.225
From Eq. CIO Ref. 9 neglecting the influence of slip (R = 0) the
location of the dead load inflection point is:
2 2 2(0.225)3 -6(0.225)2 31-(0.5) 3(0.225) - + 3(0.225)
d = 2.280 -1.785 +. 2 x 3.62L 2
3(0.225)2 - 6(0.225) 23- (0. 5)
+12(0.225) - 6(0.225)
2.280 -1.785 2 x 3.62
d = 0.238L

29.
The ratio of the axial force in the free slab to the midspan load is
=:
TP = O.5xlOOx12 X 2.0(0.238) - 0.225
2 x 21.75 (1-0.238) 3.62 = 1.15
Lateral distribution factor = 7.833/5.5 = 1.44
The force 2P is the sum of the wheel loads on one girder for an HS20
,loading times the impact and distribution factors
2P = 36 X 1.3 x 1.44 = 67.3 kips
T = 67;3 x 1.15 = 38.8 kips
f = 38.80 = 5.65 ksir 6.75
If C1
= 0.4 in this example
f = 3.65 ksir
EXAMPLE NO.2 (For Lane Loading)
In this example f will be calculated for a 3-span continI'
uous composite bridge beam under H820-44 lane loading. The bridge
beam is taken from Ref. 24.
Composite Beam Parameters:
Spans - 190 r - 240 t - 190 t

Stringer spacing - 8 t -8
Slab Thickness - 7-1/2 1T
Slab ft = 4,000 psic
Effective slab width - 90 ft
Steel beam section - Plate girder -
29" x 1-1/2 tl flanges
1141T x 7/16 tT web
Range of C1
- 0.8
Longitudinal Reinforcement - 1.00%
Following the notation used in Ref. 9:
A = 6.75 in.2
s
b = 90 in.s
L = 7-l/2 tT
P = 1.00%
A293.3 in. 2
=
12 295,500 in. 4=
n = 8
255.8 in.P2 =
b = 62 in.
d f = 45 ft.
w = 640 pIf.
2P = 18 kips
30.

31.
Calculation of 13
:
93.3 x'S8.S + (90 x 7.5) ~ (117 + 7;5)"13 = 1
93.3 + (90 x 7.5) 8= 88.2 (referred to
bottom flange)
1 3 = 295,500 + 93.3(88.2-58.5)2 + (90x7.S) ~ (124.5-88.2)2 = 489,200 in. 4
Calculation of Constants
== 1.66
= -4.90
In this example C1
will be taken as 0.8. The solution follows
similarly for C = 0.4.1
A90 x 7.5 2
Alc 25.60 in.=:
+ (1-C1 )!O.01p = + (0.2)/0.010 =nel
8x.8
a l = 0.274
(55.8) (1 + 15.18B ::: 1 + 0.274) =62.0
0,3 = 0.187
0,2 = 0.5

32.
1-0.25 +3(0.187)2_(0.187)3 6(0.187)2+3(0.187)3
d 1.66 -4.90 2 X 5.18L
=:
3(0.187)2_ 6 (0.187) 12(0.187)-6(0.187)23- O. 251.66 + -4.90 2 x 5.18
d 0.335L=:
T __ O.Sx240x12 x 2.0(0.335)-0.2~ =: 1.60p 2x62 (1-O.335)xS,·.18 (
The additional concentrated load that is to be placed
along with the uniform lane load is P = 18 kips
If f, = longitudinal reinforcement stress range f due to therc r
concentrated load
then f = 1.60x18 = 4.37 ksirc 6.75
For the lane loading case it can be conservatively
assumed the main span is fixed at both ends. It follows then that
kthe vertical shear force at the inflection point is Q = 22.2
per Tee beam and the distance d to the inflection point is d =O.21L = 50. 5 ft.
Hence;
(1-45/2X50.5) (50.5x12!62)5.18
T =Q
TQ = (2-d f /2d) (d/b)
B
= 1.042
Since f rd = longitudinal reinforcement stress range fr
due to the distributed loading, then

1.042 X 22.2::::6.75 = 3.44 ksi
33,
Thus the total range of stress in the reinforcement will be
f = f + f = 4.37 + 3.44 = 7.81 ksir I'C rd

34.
A.3: Commentary on Proposed Specification
The results of this study and the earlier tests of con-
tinuous composite beams have both indicated that an increase in
the amount of longitudinal reinforcing steel in the slab over the
negative moment region is desirable. This increase is needed for
beams with continuous shear connectors and those with shear connec-
tors omitted from the negative moment region. It is recommended
that the AASHO Specifications be amended to indicate that the
longitudinal reinforcing steel in the negative moment regions of
continuous composite beams be at least 1% of the cross-section area
of the concrete and that most of this reinforcement should be
placed near the top surface of the slab.
It was also found that the magnitude of the slab force
in the negative moment region was greater than predicted from the
steel reinforcement alone when shear connectors were omitted from
the negative moment region. Both the longitudinal reinforcement
and the shear connectors placed near the points of contraflexure~
were overloaded. This condition was corrected when the reinforce-
ment area was increased to 1% of the slab area.
To provide satisfactory anchorage of the longitudinal
reinforcement present in the negative moment region, an anchorage
length beyond the anchorage connectors is suggested.
Changes in Art. 1.7.101 (2) are being suggested to clar-
ify the intent of the ultimate strength provisions for connector
distribution. Odd span configurations have led to impossible

35.
connector densities that are not necessary. The suggested re
visions provide a satisfactory means of overcoming the connector
placement difficulties.
A new formula for ultimate shear strength of stud shear
connectors is proposed based on recent research (see Ollgaard, J. G.,
Slutter, R. G. and Fisher, J. W., nShear Strength of Stud Connectors
in Lightweight and Normal-Weight Concrete," AISC Journal, Vol. 8,
No.2, April 1971). The proposed formula provides a better esti
mate of the shear strength of welded studs in both lightweight and
normal weight concrete.
Finally the suggested placement of anchorage shear con
nectors specified in Art. 1.7.101 (3) is changed to reflect the
more recent findings by increasing the length within which the
anchorage connectors must be placed. The analytical and experi
mental studies both indicated that increasing the anchorage length
was desirable. It prevented extreme bunching of the anchorage
connectors and improved the free slab behavior in the negative
moment region.

36.
TABLE 1
EXPERIMENT DESIGN FOR
THE NEGATIVE MOMENT BEAMS
.. ~......
'L P0.61 0.89 1.02
dtjd
r = 0.026 r = 0.036 4 = 0.048 r = 0.054
6#4 11#3 11#4 6#4, 5#5
0.8 SC-3S Be-58 SC-78 SC-4S
CC-3F CC-4F
11#3 11#40.44
Be-68 SC-8B
p = percentage of longitudinal reinforcing steel equal to
ratio of area of reinforcement to the area of concrete slab
dtjd = ratio of distance between connectors of negative moment
and distance between dead load contraflexure point (see
Fig. 1)
r = perimeter ratio equal to the perimeter of the longitudinal
reinforcement to the area of concrete

Longitudinal Reinforcement
37.
d d
Anchorage Shear
Connectors
L
(a )
L
Longitud ina IReinforce ment
1~ b-....:=...e_~_1 ~
o 0000000000000
t
Section AA
( b)
FIG. 1 CONTINUOUS BEAM WITH DISCONTINUOUS SHEAR CONNECTION

I TI I
Cb .) Mi (
Fi ) Mbi Mbi0-i
Uj+1r
)Mi+1
~Fi+1
Fj---
-I-
-=u
Z
H
MSiQ"i
~
OJ
Fi-I--.
Cs
I-LFi)MSi
rMi-Il
Fi-I
FIGo 2 STRESS RESULTANTS ACTING AT ELEMENT (i)
wco
5
4
STRESS I 3
( CT)
Emax.
Emin.
oSTRAIN (e)
FIG$ 3 STRESS-STRAIN RELATIONSHIP OF STEEL OR CONCRETE LNlD

CONNECTORLOAD
(Q )
br
Q1
°2
U2
u,
dOl =k· =0----. Idu I
02 =f2 (U 2 )
0, =f, (U I )
Q =f (u )
SLIP (u)
FIG. 4 LOAD-SLIP RELATIONSHIP FOR STUD SHEAR CONNECTORS'~o

aL
od'
79rDead LoadInflection Point
L
------
d
~/
~
FIG. 5 COMPOSITE TEE BEAM FOR SECOND METHOD OF ANALYSIS
~}-J
42.
Location ofAnchorageConnectors Free Slab
qJm
Q~
~ d l
~(a ) I.. d
T
FIG. 6 NEGATIVE MOMENT REGION

10'p Free Slab
lSI i-Ip
10'
43.
s' r ...6~~:'~(a) Test Beams CC-3F ¢ CC-4F
Free
i_LUI II
1611
6 1-411 6 1
- 4"
Anchorage Connectors
Load
(b) Test Beams SC-3S to SC-8S
60"
Long it udinal Reinforcement:
Bottom Layer: 5- No.4 Bars(c) Section AA Upper Layer: See Table I
FIG. 7 DETAILS OF TEST BEAMS

, FIG. 8 TEST BEAMS
44.

45.
AverageCrack Width(in x 10- 3 )
9.2
SC -35
p = 0.61
r = 0.026
SC-5S
p=0.61 9.16r =0.036
-IFree Slab1-
SC-6S
p = 0.61 5.96r =0.036
1_ Free Slab _ISC - 8S
p =0.89 4.88r=0.048
FIG. 9 CRACK PATTERNS AT WORKING LOAD

~{7I ---.J
---I
--I"-
I;:::
I
~-
I-
~~r-
I
;J7.
A Experimental Results
50 Effective Stiffness20 % of Uncrocked
Slab",.------
/
~.~EffectiveStiffness 0% ofUncracked Slab( Re - bars Only)
217 14
DISTANC-E FROM END SUPPORT (Fl:)
-150' I , , I, , ,
o
FIG. 10 SLAB FORCE DISTRIBUTION IN CONTINUOUS COMPOSITE BEAM~
m

~-......J
2 4
DISTANCE FROM CENTER SUPPORT (FT.)
a
'4-8
enCL 36-~
z-wua::: 240IJ.. I
Experimenta I Results:
A a Cycl.es
12~ 6. 2, 000, 000 Cycles
0,....
FIG. 11 SLAB FORCE CURVE FOR BEAM CC-4F

DEPARTMENT OF CIVIL ENGINEERING FRITZ ENGINEERING LABORATO,RY
ADDENDUM - SEPTEMBER 25, 1972
Fritz Engineering Laboratory Report 359.6
"CONTINUOUS COMPOSITE BEAMS FOR STEEL - CONCRETE BH.IDGES"
Page 27
Page 30
p = JI!:'Z/AZ = 14.95 in.2
2 .A.j.1.?/l:\.
t = 7-1/2"
p =2
55.8 in. 2

21.
APPENDIX A: IMPLEMENTATION STATEMENT
A.l: Preface
Since the provisions for Composite Girders (Art. 1.7.97
to 1.7.101) were revised and adopted in 1967, further resear?h on
continuous composite steel-concrete members has indicated that
additional provisions and criteria are desirable. In addition,
the ultimate strength of individual shear connectors has been more
accurately defined. As· a result suggested changes in the AASHO
Specifications are detailed in Section A.2 of this Appendix.
A.2: Proposed Specification
Add the following corrections and additions to Articles
1.7.100 and 1.7.101.

1~7.100 DESIGN 131
anchorage
I .
In the n~gative moment regions of contin-uous spans, the minimum longitudinal reinforcement including' the distribution reinforcementmust equal 1% of the cross-section area of theconcrete slab. Two-thirds of this requiredreinforcement is to be placed in the top layerof slab within the effective width. Placementof distribution steel as specified in Art.1.3.2E is waived.
l~1en shear connectors are omitted fromthe negative moment region, the longitudinalreinforcement shall be extended into thepositive moment region beyond the anchorageconnectors at least 40 times 'the reinforcement I·
diameter. ,
",'"ith effective intermediate supports \vhich are kept in pl~ce until the concrete has attained 75 percent of its required 28-day strength, the dc~d andlive load stresses shall be computed on the basis of the composite scction~
In continuous sp<lns, the positive monlent portion may be designedwith con1posite- sections as in sin1ple spans.. Shear connectors shal1 be provided in the negative moment portion in vvhich the reinforcement steelelnbedcled in the concrete is considei'ed a part of the con1posite section~ Incase the reinforcement steel ernbeddcd in the concrete is not used in COlTI-
uting section pro crties for negative moments, shc0.i~ connectors need notbe provided in these portions of the spans, but additional connectors,shall be placed in the region of the point of dead load contrafiexure inaccordance \vith Art. 1~7.101(A) (3). Shear connectors shall be providedin accordance'\vith Article 1.7~101~
1.7.i 01 - SHEAR
tAl Horizontoi Shear
The maximum pitch of'shear connectors shan not exceed 24 inches,except over the interior supports of continuous beams Yy?here \vic1erspacing may be used to avoid placing connectors at locations of highstresses in the tension flange.
Resistance to horizontal shear shall be provided by mechanical shearconnectors at the junction of the concrete slab and the steel girder. Theshear connectors shall be mechanical devices placed transversely acrossthe flange of the girder spaced at regular or variable intervals~ l"heshear connectors shall be designed for fatigue ~\. and checked for ultimate strength..
(1) Fatigue
The range of horizontal shear shall be computed by thefOrlTIula:
Sr~ VrQI
\vhere Sr= the range of horizontal shear per linear inch at thejunction of the slab and girder at the point in the spanunder consideration.
Vr = the range of shear due to live loads and impact~ At anysection, the range of shear shall be taken as the difference in the' n1inimum and maximum sh2ar envelopes(excluding dead loads).
Q= The· statical moment about the neutral axis of the ·composite section, of the transformed cOTI1pr.essivc concrete area or the area of reinforcement embedded inthe concrete for negative moment.
,. Reference is mnde to the pf'~pcr titled uF~tigue Strength of Shcn~ Connectors" b:t RoseT G.Slutter and John W. Fisher in HIGHYlAY RESEARCH RECORD. :No. 1.17. published by theliir:h'v,ny Research Board, \Vn.shington. D.C., HIGG.
N ,C
f\.)
1'V

1':'1)0 .... HIGI-IvVAY BRIDGES ' 1.7.101
I='rhe monlent of inertia of the transfornled compositegirder in positive monlent regions or the moment ofinertia provided by the steel beam including or excluding the area of reinforcement embedded in the concrete in negative moment regions.
(In the above, the compressive concrete area is transformedinto an equivalent area of steel by dividing the effective concreteflange \vidth by the modular ratio, Jin".) ,
The allol,vable range of horizontal shear, HZ/', in pounds op. anindividual connector is as follovvs:
Channels Zr=B'v\Velded studs "(for ratios of Hid equal to .or greater than 4)'
Zr= ccd2
\vhere vV=; the length of a channel shear connector in inchesmeasured in a transverse direction on the flange ofa girder.
d= diameter of stud, in inches
ex: = 13-,000 for 100,000 cycleslO,GOO for 500,000 cycles7,850 for 2,000,000 cycles
B = 4,000 for 100,000 cycles3,000 for 500,000 cycles2,400 for 2,000,000 cycles'
H = height of stud in inche,s
Th~ required pitch of shear connectors is determined by dividing the alIo\vablc range of hori'Zontal shear of all connectors at onetransverse girder crossectjon (2:Zr ) by the horizontal range of shearSt. per linear inch. Over the interior supports of continuous pe;rrns'the pitch may be modified to avoid placing the connectors. zit ioeation;;; .of high stresses in the tension flange provided that the totalnumber' of connectors remains unchanged.
(2) Ultimate Strength
The nun1bcr of connectors so provided for fatigue! shall bechecked to ensure that adequate connectors arc provided for ultimate strength. The number of shear connectors required bet'\veenthe pointR of n1aximum positive moment and the end supports ~-6ead 19ad })ointg of c6nlraflo}"lll"Q, and bet\\'Qon points ot· maxi~nega:ive n}oment nnd the dead load points of contraflcJEure r$Dcl"ll'equal or exceed the number given by th~ forll1ula:
i·
~
(
1'0W
N1

1..7.101 . DESIGN 1:33
or
,N1
\vhere _=the. r:-umbcr of connect~rs betvv'ccn point~ of r~axi~umposItIve moment and adjacent end SUPPOl'ts,'tfP-"-·u.1~H·J9{-;-cP-..}1.
.poilit s --ef -e CntrafJ c.. cJ 1 re, 0r=ee:f;Vr:fr~Lt3=of=n:"l&d-ttH±B-1:.~1ega Li vB -:niuIll: ~ III a ncL::ad:j:ac:cx:d;:::d.-czd=l~"-d:-r~o.f.:::.c.olI'
b::a£lr:XLlrc.
Su=the ultimate strength of the shear connecter as givenbelo'\v.
t/J= a reduction factor=- 0.85.
P;::: force in the slab as defined hereafter as P l',Pz,~4.
A~ points of maximum positive moment, the force in the slab istaken as the snlaller value of the fornlulas:
Pl=As F y
or
P3=A;F~,
P2=O.85 f'e be
where As = total area of the steel section including coverplates.
F y = specified minimum yield point of the steel being used.
f'c= ~ompressivestrength of concrete at age of 28 days.
b= effective flange \vic1th given i.n Art. 1.7.09.
I c:::: thickness of the concrete slab.
Alpoints of maximum negative moment the force in the slabis taken as:
IP + P3
cp Su 'NZ
The number of connectors N2 required betweenthe points of maximum positive moment and pointsof adjacent maximum negative moment shall equal .or exceed the . l1.umber given by the ,formula:
s = 0.0004 d2~f' Eu c c
Ec
= Modulus of Elasticity of. the con~rete,
psi (E = 33 ~3/2 ~)c c
,vhere A~ =total area of longitudinal reinforcing steel at the interior support \vithin the efIcctb/e flange \vidth.
F;-'= specified nlinim1?-m yield point of the reinforcing steeL
The ultimate strength of the shear connecter is given 3.S follo\vs:Channels:
Su=550 (h+t/2) wylf/c
Welded Studs (Hid ~ 4) :
Su 939 dt) v!f2C
,vhere Su= ultinlate strength of individual shear connector, inpounds.
h= the average flange thickness of the chnnnel flange, ininches.
t= the thickness of the ,veb of a channel, in inches.
w= length of a channel shea.r connector, in inches.
f/c= compressive stren-gth of the concrete at 28 days, psi.
d= diameter of stud) in inches.
f\..)
~

1:3-1 HICI-I\VAY BRIDGES 1;7.101I.
(3) Additional Connectors to Develop Slab Stress
The numb.er of additional connectors required at points ofcontra-flexure, '\vhen reinforceluent steel embedded in the concreteis not used in c.onlputing section properties for negative n1oments,Rhall be computed by theformul~
, -=N"' ~--fr: --~--------_-_I
~~_r-:-~-\vhere N c=number of additional connectors for each beam at point
of con traflexu re.. A S /' ~= total area of longitudinal' slab· reinforcement steel- for
r each beam over in terior support.
f r =range of stress due to live load plus impact, in the slabreinforcement over the support (in lieu of more accurate con1putations, f r may be taken as equal to10,900 psi).
Zr= the allo\vnble range of horizontal shear on un individualshear connector.
N =c
A sf_r r
Zr
. The additional connectors, NN shall be placed adjacent to thepoint of dea.d load contra11exure within a. distance equal to a theeffective slab vlidth, Le., placed either side of this point or centeredabout it..· .
{S} Vertical Sh-ear
The intensity of unit shearing stress in a composite girder may bedetermined on the basis that the ,veb of the steel girder carries the totalexternal shear, neglecting the effects of the steel flanges 'and of the concrete sl:lb. The shear may be assumed to be uniformly distributedthrough0ut the gross area of the \veb.
1.7~102 - DEFLECTION
T1hc provisions of Article 1.7.13, in regard to deflections from liveload plus impact also shall be applicable to composite girders.
VI/hen the girders are not provided with falsework or other effectiveiutern1cdiate support during the placing of the concrete slab, the deflectiondue to the \veight of the slab and other permanent dead loads added beforethe concrete has attained 75 per cent of its required 28-day strength shallbe computed on the basis of non-composite action.
1,7..103 - COi\,\POSITE BOX GIR.DERS, GEr..JERAl
This section pertains to the design of simple and continuous spansteel-concrete COlllposite !nnlti-box girder bridges of moderate length. It isapplicable to box girders of single cell, having \vidth center to center of topsteel flanges approximately equal to the distance center to center of adja;..,cent top stec~ flanges of adjacent box girders. The cantilever overhang of'the deck slab (including curbs and parnpets) beyond the exterior yveb;,
It is preferable to locate field splices so thatt~ey clear the connectors.
i\.)
_ltl

34.
A.3: Commentary on Proposed Specifica!ionf
The results of this study and the earlier tests of con-
tinuous composite beams have both indicated that an increase in
the amount of longitudinal- reinforcing steel in the slab over the
negative moment region is desirable. This increase is needed for
beams with continuous shear connectors and those with shear connec-
tors omitted from the negative moment region. It is recommended
that the AASHO Specifications be amended to indicate that the
longitudinal reinforcing steel in the negative moment regions of
continuous composite beams be at least 1% of the cross-section area
of the concrete and that most of this reinforcement should be
placed near the top surface of the slab.
It was also found that the magnitude of the slab force
in the negative moment region was greater than predicted from the
steel reinforcement alone when shear connectors were omitted from
the negative moment region. Both the ~ongitudinal reinforcement
and the shear connectors placed near the points o~ contraflexure-were overloaded. This condition wa~ corrected when the reinforce-
ment area was increased to 1% 'of the slab area.
To provide satisfactory anchorage of the longitudinal
reinforcement present in the negative moment .region, an anchorage
length beyond the anchorage connectors is suggested.
Changes in Art. 1.7-.101 (2) are being suggested to clar-
ify the intent of the ultimate strength provisions for connector
distribution. Odd span configurations have led to impossible

35.
connector densities that are not necessary. The suggested re-
visions 'provide a satisfac·tory means of overcoming the connector
placement difficulties.
A new formula for ultimate shear strength of stud shearI
connectors is proposed based on recent research (see Ollgaard, J. G.,
Slu't'ter) R. G. and Fisher, Jo W., "Shear Strength of Stud· Connectors
in Lightweight and Normal-Weight Concrete,tt AISC Journal, Vol. 8,
No.2, April 1971). The proposed formula provides a better esti-
mate of the shear stl'"\ength of welded studs in both lightweight and
normal weigh't concrete.
Finally the suggested place~ent of anchorage sh~ar con-
nectars specified in Art. 1.7.101 (3) is changed to reflec·t the
more recent findings by increasing the length within which the
anchorage connectors must be placed. The analytical and experi-
men"tal s·tudies both indicated that increasing the anchol"age length
was desirable. It-prevented extreme b~nching of the anchorage
connectors and improved the free slab behavior in the negative
mOlnent region.
It is suggested that it is preferable to slightly relocate
the field splice from the usual location (at point of dead load<.
inflection) to a few feet into the negative moment area in order to
locate the anchorage connectors near the point of inflection and
keep the stresses in the flanges as low as possible for allowable
fatigue stresses.