leeward flow visualization of a multi-mw wind turbine
TRANSCRIPT

1
14th International Conference on Wind Engineering – Porto Alegre, Brazil – June 21-26, 2015
Leeward Flow Visualization of a multi-MW Wind Turbine Tower 1:75 scale
Anabel Apcarian1, Jorge Luis Lässig
2
1Department of Civil Eng., Faculty of Engineering, Universidad Nacional del Comahue, Neuquén, Argentina
2Department of Applied Mechanics, Faculty of Engineering, Universidad Nacional del Comahue, Neuquén, Argentina
email: [email protected], [email protected]
ABSTRACT: In the Northern part of the Neuquén Province in Argentina an Aeolic Energy Generation Park is currently under
design. The winds blowing across this territory are mainly characterized by their great intensity and turbulence. The wind
turbines to be installed will be multi-MW type, for which the most usual support structure typology features a series of tubular
tapered cylinder-shaped towers. The flow pattern of these structures, usually exposed to local winds, has not yet been studied.
Thus, prior to the structural design, it is necessary to determine its characterization. The main purpose of this study was to
visualize the leeward flow of a tower for a multi-MW aerogenerator subjected to a wind profile of atmospheric boundary layer,
and the rotor detained on feathered pitch position. The test setup was performed with an open-loop indraft wind tunnel that
supports uniform flow and atmospheric boundary layer flow conditions. Standard-tower scale models of 1:75 were built for a
3MW turbine. Visualizations of flow with smoke and weather vanes for Reynold numbers based on a mean diameter between
8,7x10³ and 4,4x10
4 were made. Vortex shedding shown in the tower being tested is three-dimensional phenomenon and the
flow pattern of the wake features variations related to the incidental flow velocity. For Reynold numbers between 3,1x10³ and
4,4x10⁴, lateral and leeward vertical flow currents are shown. Additionally, a cyclical variation in the flow angle of incidence for
wind velocities from 5m/s to 15 m/s was observed. The methods chosen for visualization provide a first approach in the
qualitative description of the wake flow. Future research should aim to find correlation between the vortex shedding patterns
observed in this study and spectral analysis from the fluctuating components of wind velocity.
KEY WORDS: Tapered Cylinders; Oblique Vortex Shedding; Wind Turbine Tower; Vortex Patterns
1 INTRODUCTION
In the Northern part of the Neuquén Province in Argentina an Aeolic Energy Generation Park is currently under design. The
winds blowing across this territory are mainly characterized by their great intensity and turbulence [1].
The wind turbines to be installed will be multi-MW type, for which the most usual support structure typology features a series
of tubular tapered cylinder-shaped towers.
The non-uniformity of the inflow or the tower geometry may cause three-dimensional effects in the vortex shedding such as
oblique vortex shedding, cellular vortex shedding, vortex dislocations and vortex splitting [2][3]. Currently, these effects are not
totally understood and during the last years empirical models have been created in order to explain them. Most of these records
can be found in the Williamson and Govardhan Review [4].
A permanent aerodynamic instability such as vortex shedding may cause structural deflections, instigating an aeroelastic
phenomenon. Fluid-elastic interaction is a function of the structural characteristics and the fluid. Even with moderate wind
velocities great oscillations can appear on the structure, subjecting it to a great number of load cycles that may wear out the
material. Fatigue may cause structural collapse before the material reaches its ultimate failure and this is why structural design
should rely on a realistic description of the vortex shedding pattern.
The main purpose of this study was to visualize the leeward flow of a tower for a multi-MW aerogenerator subjected to a wind
profile of atmospheric boundary layer, and the rotor detained on feathered pitch position.
2 METODOLOGY
2.1 Test setup
The test setup was performed with an open-loop indraft wind tunnel that supports uniform flow and atmospheric boundary
layer flow conditions. The tunnel is located in the “Boundary Layer & Fluid Dynamic Environmental Laboratory” at the
Department of Aeronautics, School of Engineering of the National University of La Plata. The tunnel is 24 m long and has a

2
14th International Conference on Wind Engineering – Porto Alegre, Brazil – June 21-26, 2015
constant cross-sectional area of 2.60 m by 1.80 m. It operates by aspiration and consists of nine fans of 1.25 m diameter and15
HP power each. The maximum speed for tensile testing is 15 m/s.
The airflow conditions in the wind tunnel were similar to the ones of the local region under study. As prototype, a standard
sized tower for a 3MW wind turbine was chosen (Figure 1). The height of the tower was 80 m and its minor and major
diameters were 3 m and 6 m respectively. Wood-based 1:75 scale models were constructed to be used during the testing (Figure
2).
Figure 1: Prototype dimensions
Figure 2: Test setup
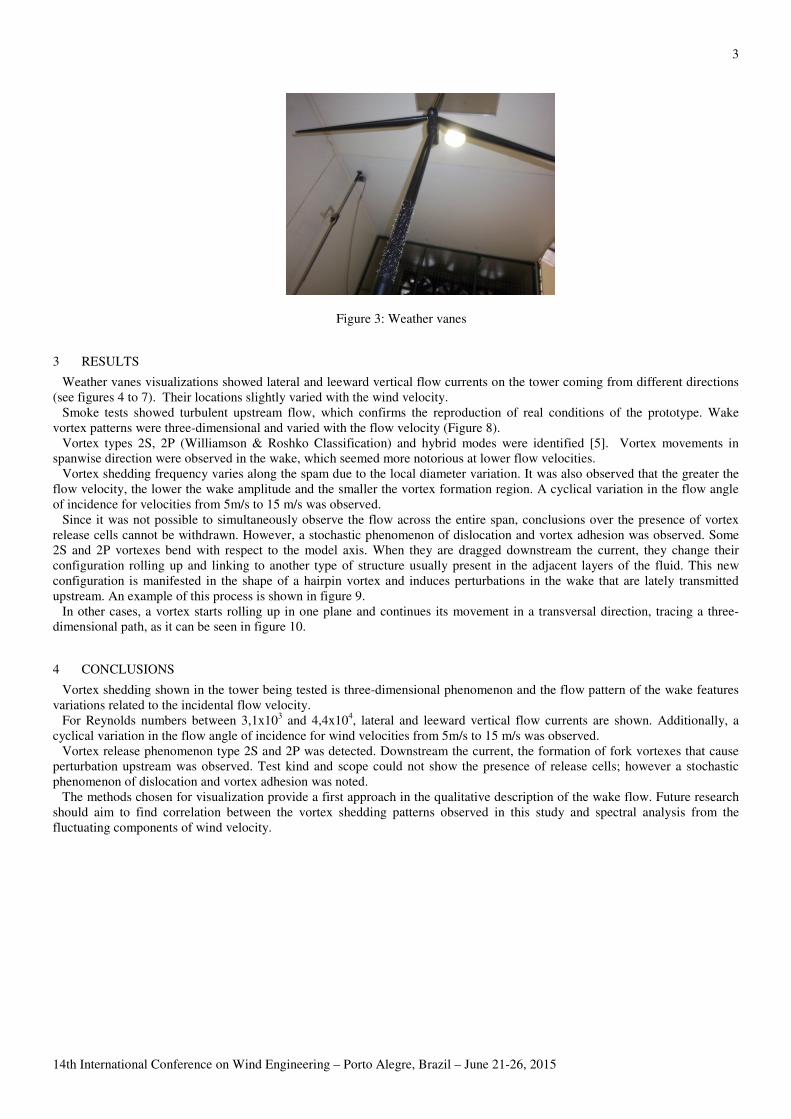
2.2 Weather vanes visualization
Weather vanes made with 1cm-length white threads were placed in the middle of the tower as shown in figure 3. Movements
for flow velocities of 10 m/s, 12 m/s, 13 m/s and 15 m/s were observed. These speed rates were correlated to Reynolds numbers
between 3.1x10⁴ and 4.4 x10
4 based on the tower mean diameter.
2.3 Smoke visualization
Smoke tests at increasing wind velocities were performed to visualize the flow structure around the tower. Reynolds numbers
for these tests were between 8,7x10³ and 4,4x10
4.
2.4 Record and data process
Tests were recorded with the use of 60 fps and 30 fps cameras. Videos were analyzed and photograms were extracted in order
to examine in detail the types of vortexes being released and also to perform measurements over the images graphically.
Ø90,00m
4,18m
80,0
0m
2,36m
3
14th International Conference on Wind Engineering – Porto Alegre, Brazil – June 21-26, 2015
Figure 3: Weather vanes
3 RESULTS
Weather vanes visualizations showed lateral and leeward vertical flow currents on the tower coming from different directions
(see figures 4 to 7). Their locations slightly varied with the wind velocity.
Smoke tests showed turbulent upstream flow, which confirms the reproduction of real conditions of the prototype. Wake
vortex patterns were three-dimensional and varied with the flow velocity (Figure 8).
Vortex types 2S, 2P (Williamson & Roshko Classification) and hybrid modes were identified [5]. Vortex movements in
spanwise direction were observed in the wake, which seemed more notorious at lower flow velocities.
Vortex shedding frequency varies along the spam due to the local diameter variation. It was also observed that the greater the
flow velocity, the lower the wake amplitude and the smaller the vortex formation region. A cyclical variation in the flow angle
of incidence for velocities from 5m/s to 15 m/s was observed.
Since it was not possible to simultaneously observe the flow across the entire span, conclusions over the presence of vortex
release cells cannot be withdrawn. However, a stochastic phenomenon of dislocation and vortex adhesion was observed. Some
2S and 2P vortexes bend with respect to the model axis. When they are dragged downstream the current, they change their
configuration rolling up and linking to another type of structure usually present in the adjacent layers of the fluid. This new
configuration is manifested in the shape of a hairpin vortex and induces perturbations in the wake that are lately transmitted
upstream. An example of this process is shown in figure 9.
In other cases, a vortex starts rolling up in one plane and continues its movement in a transversal direction, tracing a three-
dimensional path, as it can be seen in figure 10.
4 CONCLUSIONS
Vortex shedding shown in the tower being tested is three-dimensional phenomenon and the flow pattern of the wake features
variations related to the incidental flow velocity.
For Reynolds numbers between 3,1x10³ and 4,4x10
4, lateral and leeward vertical flow currents are shown. Additionally, a
cyclical variation in the flow angle of incidence for wind velocities from 5m/s to 15 m/s was observed.
Vortex release phenomenon type 2S and 2P was detected. Downstream the current, the formation of fork vortexes that cause
perturbation upstream was observed. Test kind and scope could not show the presence of release cells; however a stochastic
phenomenon of dislocation and vortex adhesion was noted.
The methods chosen for visualization provide a first approach in the qualitative description of the wake flow. Future research
should aim to find correlation between the vortex shedding patterns observed in this study and spectral analysis from the
fluctuating components of wind velocity.

14th International Conference on Wind Engineering
Figure 4: Weather Vanes visualization for 1
Figure 5: Weather Vanes visualization for 1
14th International Conference on Wind Engineering – Porto Alegre, Brazil – June 21-26, 2015
: Weather Vanes visualization for 10 m/s incoming flow (Re =2.9x10⁴). Time frame between each photogra
is 0.02s
Weather Vanes visualization for 12 m/s incoming flow (Re =3.5x10⁴). Time frame between each photogra
is 0.02s
4
Time frame between each photogram
Time frame between each photogram
14th International Conference on Wind Engineering
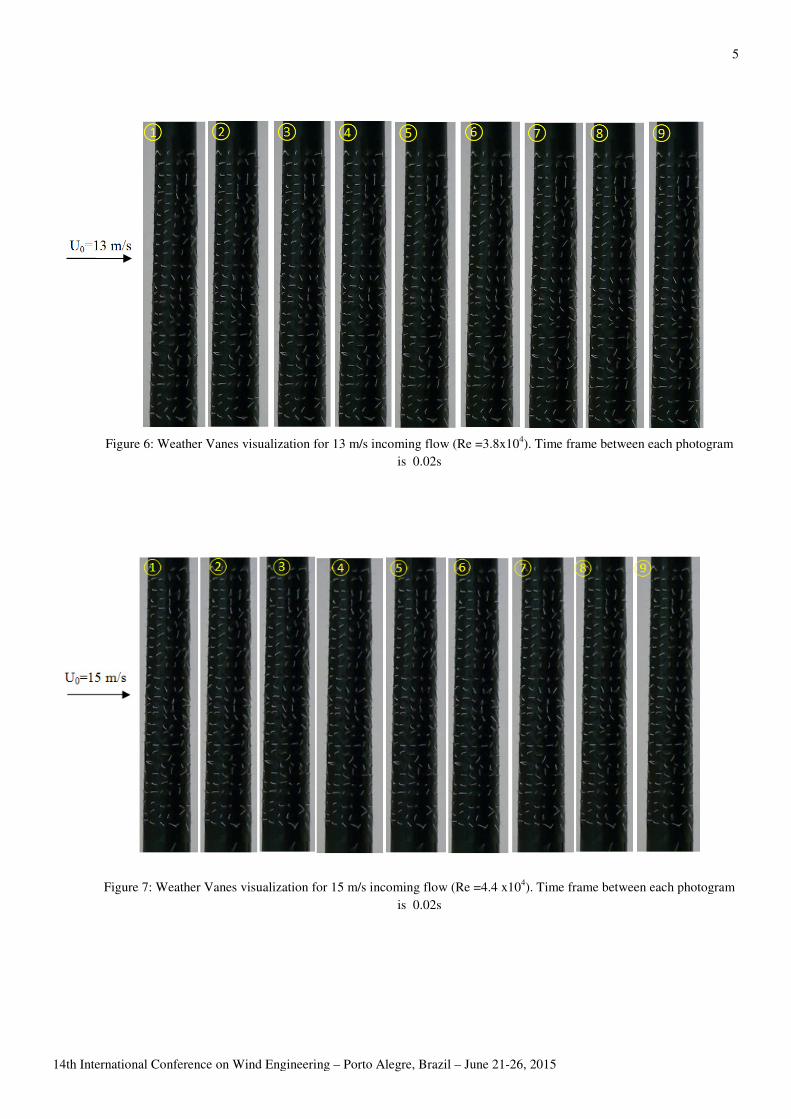
Figure 6: Weather Vanes visualization for 1
Figure 7: Weather Vanes visualization for 1
14th International Conference on Wind Engineering – Porto Alegre, Brazil – June 21-26, 2015
Weather Vanes visualization for 13 m/s incoming flow (Re =3.8x10⁴). Time frame between each photogra
is 0.02s
Weather Vanes visualization for 15 m/s incoming flow (Re =4.4 x10⁴). Time frame between each photogra
is 0.02s
5
Time frame between each photogram
Time frame between each photogram

14th International Conference on Wind Engineering
Figure
Figura 9: Secuence of vortex splits and adhesions for Re =
14th International Conference on Wind Engineering – Porto Alegre, Brazil – June 21-26, 2015
Figure 8: Smoke visualization for 5 m/s incoming flow
ortex splits and adhesions for Re = 1.45 x 10⁴, based on mean diameter.
each photogram is 0.09 seconds.
6
diameter. Time frame between

14th International Conference on Wind Engineering
Figura 10: Structural 3D evolution in
ACKNOWLEDGMENTS
The authors gratefully acknowledge the support
Department of Aeronautics, School of Engineering of the National University of La Plata
contribution.
REFERENCES
[1] Lässig, J. L., Palese, C., & Apcarian, A.
Meteorológica , 36 (2), 83-93, 2011.
[2] Vallès, B., Andersson, H.I. and Jenssen, J.B., Oblique Vortex Shedding behind Tapered Cylinders. Journal of Fluids and
Structures, Vol. 16, pp. 453-463, 2002.
[3] Narasimhamurthy, Vagesh D. et al., Simulation of Unsteady Flow pa
Boundary Method, European Conference on Computational Fluid Dynamics, Delft, 2006.
[4] Williamson, C.H.K. and Govardhan, R., A brief review of recent results in vortex
Engineering and Industrial Aerodynamics, 96, pp. 713
[5] Williamson, C.H.K. and Roshko, A., Vortex formation in the wake of an oscilating cylinder,
Structures, Vol. 2, pp. 355-381,1998.
14th International Conference on Wind Engineering – Porto Alegre, Brazil – June 21-26, 2015
evolution in the wake, at Re = 1.45 x 10⁴, based on mean diameter.
photogram is 0.06 seconds.
gratefully acknowledge the support of the “Boundary Layer & Fluid Dynamic Environmental Laboratory” at the
Department of Aeronautics, School of Engineering of the National University of La Plata, and
Lässig, J. L., Palese, C., & Apcarian, A. Vientos Extremos en la Provincia de Neuquén. (C. A. Meteorólogos, Ed.)
] Vallès, B., Andersson, H.I. and Jenssen, J.B., Oblique Vortex Shedding behind Tapered Cylinders. Journal of Fluids and
] Narasimhamurthy, Vagesh D. et al., Simulation of Unsteady Flow past Tapered Circular Cylinders u
Boundary Method, European Conference on Computational Fluid Dynamics, Delft, 2006.
Govardhan, R., A brief review of recent results in vortex-induced vibrations, Journal of Wind
Engineering and Industrial Aerodynamics, 96, pp. 713-735, 2008.
] Williamson, C.H.K. and Roshko, A., Vortex formation in the wake of an oscilating cylinder,
7
, based on mean diameter. Time frame between each
“Boundary Layer & Fluid Dynamic Environmental Laboratory” at the
, and Msc. Lynn Van Broock’s
Vientos Extremos en la Provincia de Neuquén. (C. A. Meteorólogos, Ed.)
] Vallès, B., Andersson, H.I. and Jenssen, J.B., Oblique Vortex Shedding behind Tapered Cylinders. Journal of Fluids and
st Tapered Circular Cylinders using and Immersed
induced vibrations, Journal of Wind
] Williamson, C.H.K. and Roshko, A., Vortex formation in the wake of an oscilating cylinder, Journal of Fluids and