led lighting in a performing arts building · led lighting in a performing arts building at the...
TRANSCRIPT
LED Lighting in a Performing Arts Building
July 2014
Prepared for:
Solid-State Lighting ProgramBuilding Technologies OfficeOffice of Energy Efficiency and Renewable EnergyU.S. Department of Energy
Prepared by:
Pacific Northwest National Laboratory
Host Site: University of Florida, Gainesville, Florida
PNNL-23514
LED Lighting in a Performing Arts Building at the University of Florida
Final report prepared in support of the U.S. DOE Solid-State Lighting
Technology Demonstration GATEWAY Program
Study Participants:
Pacific Northwest National Laboratory
University of Florida
NJ Miller
SM Kaye1
PM Coleman2
AM Wilkerson
TE Perrin
GP Sullivan3
July 2014
Prepared for
the U.S. Department of Energy
under Contract DE-AC05-76RL01830
Pacific Northwest National Laboratory
1 Professor of Lighting Design, Head of the Graduate Lighting Design Program,
University of Florida, Gainesville FL. 2 Graduate Assistant, Lighting Design, University of Florida, Gainesville FL.
3 Principal, Efficiency Solutions, Inc., Richland WA


iii
Preface
This document is a report of observations and results obtained from a lighting demonstration project
conducted under the U.S. Department of Energy (DOE) GATEWAY Demonstration Program. The
program supports demonstrations of high-performance solid-state lighting (SSL) products in order to
develop empirical data and experience with in-the-field applications of this advanced lighting technology.
The DOE GATEWAY Demonstration Program focuses on providing a source of independent, third-party
data for use in decision-making by lighting users and professionals; this data should be considered in
combination with other information relevant to the particular site and application under examination.
Each GATEWAY Demonstration compares SSL products against the incumbent technologies used in that
location. Depending on available information and circumstances, the SSL product may also be compared
to alternate lighting technologies. Though products demonstrated in the GATEWAY program have been
prescreened for performance, DOE does not endorse any commercial product or in any way guarantee
that users will achieve the same results through use of these products.
Acknowledgements
This GATEWAY report is the result of the collaboration of many. The University of Florida and the
School of Theatre and Dance provided access to buildings and facilities professionals as a learning
opportunity for the campus, but also a means to communicate about sustainable lighting with other
campuses across the U.S. The graduate lighting design program developed lighting concepts and
specifications, and collected user data before and after the change. The dance professors enthusiastically
embraced a test of LEDs in their performance schedule, even choreographing a special piece as a visual
test for differences in LED lighting compared to conventional sources in their public fall and spring dance
performances. Students, staff electricians, instructors, and performers contributed time for interviews and
surveys. John Lawson and his facilities group staff developed lighting and controls layouts, procured
pricing, provided electrical and energy data, and installed metering equipment to monitor energy use over
an 8-month period.
Duke Energy was an active participant and provided partial funding through their rebate incentive
program for indoor lighting improvements.


v
Executive Summary
This report describes the process and results of a 2013-2014 GATEWAY demonstration of solid-
state lighting technology in the Nadine McGuire Theatre and Dance Pavilion at the University of Florida,
Gainesville, FL. Four interior spaces—the Acting Studio, Dance Studio, Scene Shop, and Dressing
Room—were fitted with light-emitting diode (LED) luminaires or retrofit lamps, along with dimming
controls. In addition, the Dance Studio, normally converted to a dance performance space several times
per year, was equipped with LED theatrical instruments used for sidelighting effects during performances.
In each case, energy use was monitored before and after the lighting’s circuits were converted, so that
power and energy savings could be documented. Students, instructors, and audience members completed
questionnaires to provide feedback on the quality of both the conventional lighting and the LED lighting
and controls. Interviews with instructors and staff were especially helpful in identifying the most (and
least) successful aspects to the changes.
The LED solutions combined with dimming controls received high marks from instructors,
students/performers, and reduced energy use in all cases. In the Scene Shop, safety was a special
criterion; in the dressing rooms, color rendering closely matching that of the stage lighting was important.
Goals for relighting the Acting and Dance studios included improved switching and dimming control,
better illuminance uniformity, brighter walls, and higher vertical illuminances for seeing faces, bodies,
and gestures. Notably, vertical illuminances were increased with no increase in glare because of careful
luminaire selection.
Luminaires that incorporated 0-10 V dimming drivers included recessed downlights, linear
wallwashers, edge-lit linear products, and linear industrial luminaires with indirect optics. High color
rendering index LED A-19 lamps were used for mirror lighting in the dressing room, dimmable with a
forward phase-cut wallbox dimmer. The LED versions of conventional halogen ellipsoidal theatrical
instruments were equipped with sophisticated multi-channel dimming drivers receiving signals from a
DMX-512 theatrical control system that had been modified with an interface for the LEDs. All of the
dimming controls worked well, except for an incompatible wallbox dimmer that caused audible buzzing
from the dressing room mirror lighting. All of the LED lighting systems saved energy and were embraced
by users for their improved functionality, especially in classrooms. One disappointment was a daylight
dimming system that was never commissioned properly, so it was found to effect no dimming of the
controlled luminaires, and thus, no energy savings.
The LED theatrical lighting reduced power use by 50% to 90% in lighting cues that would otherwise
employ conventional colored theatrical gels in halogen instruments. Audience visual impressions of the
halogen and LED sidelighting were almost identical, although the lighting designers observed that skin
tones may not be as naturalistic under some LED color selections. This will vary according to the design
of the LED instrument.
vi
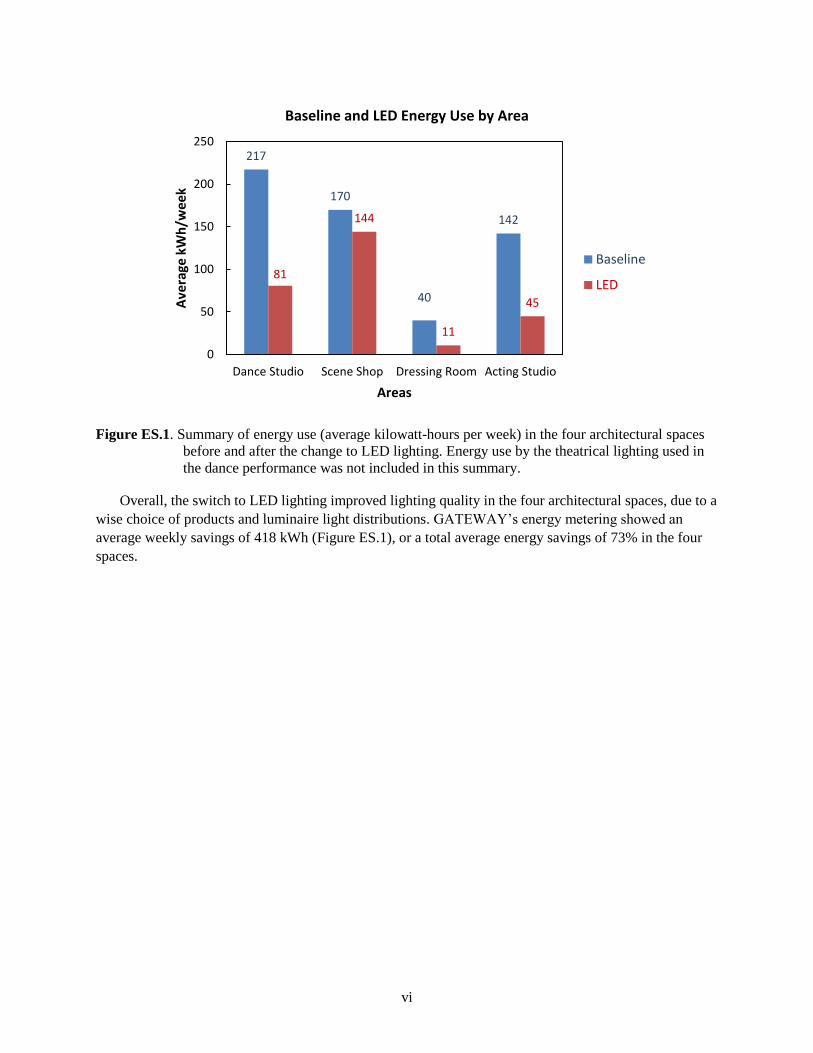
Figure ES.1. Summary of energy use (average kilowatt-hours per week) in the four architectural spaces
before and after the change to LED lighting. Energy use by the theatrical lighting used in
the dance performance was not included in this summary.
Overall, the switch to LED lighting improved lighting quality in the four architectural spaces, due to a
wise choice of products and luminaire light distributions. GATEWAY’s energy metering showed an
average weekly savings of 418 kWh (Figure ES.1), or a total average energy savings of 73% in the four
spaces.
217
170
40
142
81
144
11
45
0
50
100
150
200
250
Dance Studio Scene Shop Dressing Room Acting Studio
Ave
rage
kW
h/w
eek
Areas
Baseline and LED Energy Use by Area
Baseline
LED

vii
Acronyms and Abbreviations
A ampere(s)
CCT correlated color temperature
CFL compact fluorescent lamp
CRI color rendering index
DOE U.S. Department of Energy
fc footcandle(s)
K kelvin
kWh kilowatt-hour(s)
LED light-emitting diode
lm lumen(s)
LPW lumen(s) per watt
lx lux
PAR parabolic aluminum reflector (number following PAR indicates maximum
diameter of lamp in eighths of an inch)
PNNL Pacific Northwest National Laboratory
R reflector-shape lamp (number following R indicates maximum diameter of lamp
in eighths of an inch)
SSL solid-state lighting
UF University of Florida


ix
Contents
Preface ......................................................................................................................................................... iii
Acknowledgements ...................................................................................................................................... iii
Executive Summary ...................................................................................................................................... v
Acronyms and Abbreviations ..................................................................................................................... vii
1.0 Introduction .......................................................................................................................................... 1
2.0 Project Description ............................................................................................................................... 2
3.0 Field Measurement of Technology ....................................................................................................... 6
4.0 Results .................................................................................................................................................. 7
4.1 G15 Acting Studio – Illuminance, Energy, and User Feedback ................................................... 7
4.1.1 Acting Studio Energy Use ................................................................................................. 9
4.1.2 Acting Studio Questionnaire and Interview Responses .................................................. 11
4.2 Dance Studio – Illuminance, Energy, and User Feedback ......................................................... 12
4.2.1 Dance Studio Controls and Their Performance ............................................................... 14
4.2.2 Dance Studio Energy Use ............................................................................................... 15
4.2.3 Dance Studio Questionnaire and Interview Responses ................................................... 17
4.3 Scene Shop – Illuminance, Energy, and User Feedback ............................................................ 17
4.3.1 Scene Shop Energy Use .................................................................................................. 19
4.3.2 Questionnaire and Interview Responses .......................................................................... 21
4.4 Dressing Room Makeup Mirrors– Illuminance, Energy, and User Feedback............................ 22
4.4.1 Dressing Room Energy Use ............................................................................................ 24
4.4.2 Questionnaire and Interview Responses .......................................................................... 26
4.5 Dance Performance Sidelighting – Illuminance, Color, Energy, and Designer and Audience
Feedback .................................................................................................................................... 27
4.5.1 Dance Performance Energy Use ...................................................................................... 32
4.5.2 Questionnaire and Interview Responses .......................................................................... 35
4.6 Summary of Lighting Energy Use and Economics .................................................................... 35
5.0 Conclusions ........................................................................................................................................ 37
6.0 Lessons Learned ................................................................................................................................. 38
Appendix A Sample Questionnaire for Users of the Actor Studio and Dressing Room, and Audience
Members for the Dance Performance ............................................................................................... A.1
Appendix B Questionnaire Results ............................................................................................................B.1
Appendix C Input Data for Dance Studio Room Lighting Calculations ...................................................C.1

x
Figures
Figure 1. The Nadine McGuire Theatre and Dance Pavilion at the University of Florida in Gainesville
(Photo: University of Florida) ............................................................................................................... 1
Figure 2. G15 Acting Studio before LED lighting remodel. Lighting is recessed clear cone downlights
with 100 W PAR38 ceramic metal halide lamps, and medium-base CFL reflector lamps in square of
theatrical “cyc lights.” ........................................................................................................................... 3
Figure 3. G6 Dance Studio when used for dance classes (Photo: Stan Kaye) .............................................. 4
Figure 4. Two photos of the UF Scene Shop showing industrial fluorescent luminaires mounted between
joists ...................................................................................................................................................... 5
Figure 5. Dressing Room, with incandescent lamped mirror lighting (Photo: Stan Kaye) ........................... 6
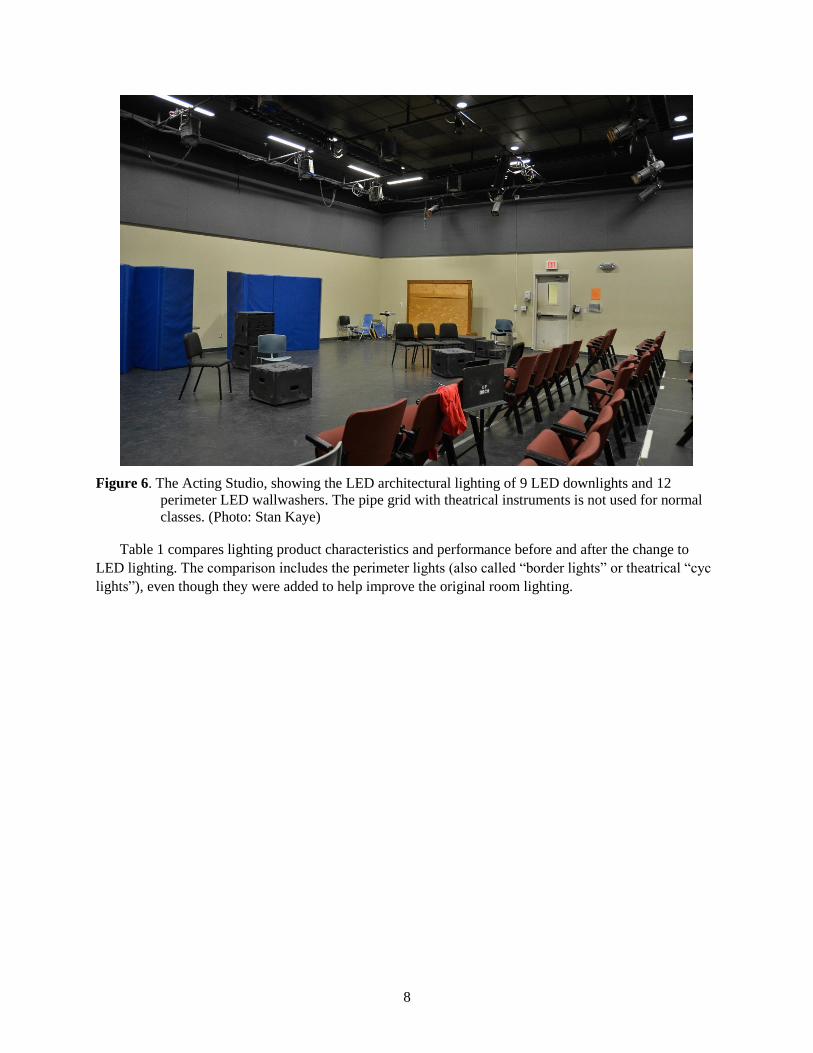
Figure 6. The Acting Studio, showing the LED architectural lighting of 9 LED downlights and 12
perimeter LED wallwashers. The pipe grid with theatrical instruments is not used for normal classes.
(Photo: Stan Kaye) ................................................................................................................................ 8
Figure 7. Typical weekly lighting power profiles, baseline and LED, for the Acting Studio. Data collected
during the weeks of 1-27-14 (baseline) and 3-24-14 (LED). .............................................................. 10
Figure 8. Typical daily lighting power profiles, baseline and LED, for the Acting Studio. Data collected 1-
28-14 (baseline) and 3-25-14 (LED). .................................................................................................. 11
Figure 9. The Dance Studio, after the general lighting was replaced with 20 edge-lit LED luminaires
(Photo: Stan Kaye) .............................................................................................................................. 12
Figure 10. The Dance Studio showing the new LED luminaires. Ten luminaires along the west-facing
window wall were designed to be controlled separately by a photosensor for daylight dimming.
(Photo: Stan Kaye) .............................................................................................................................. 13
Figure 11. Closeup photo showing edge-lit LED panel from below. Note the daylight sensor circled in the
photo. (Photo: Stan Kaye) ................................................................................................................... 13
Figure 12. Typical Dance Studio weekly lighting power profiles, baseline and LED. Data collected during
weeks of 1-27-14 (baseline) and 3-24-14 (LED). ............................................................................... 16
Figure 13. Typical Dance Studio daily lighting power profiles, baseline and LED. Data collected days of
1-28-14 (baseline) and 3-25-14 (LED). .............................................................................................. 16
Figure 14. Scene Shop after replacing fluorescent industrial luminaires with 24 ft long rows of 8’ linear
LED luminaires, spaced 6 ft on center (Photo: Stan Kaye) ................................................................ 18
Figure 15. Typical Scene Shop weekly lighting profiles, baseline and LED. Data collected during weeks
of 1-27-14 (baseline) and 3-24-14 (LED). .......................................................................................... 20
Figure 16. Typical Scene Shop daily lighting power profiles, baseline and LED. Data collected during day
of 1-30-14 (baseline) and 3-28-14 (LED). .......................................................................................... 21
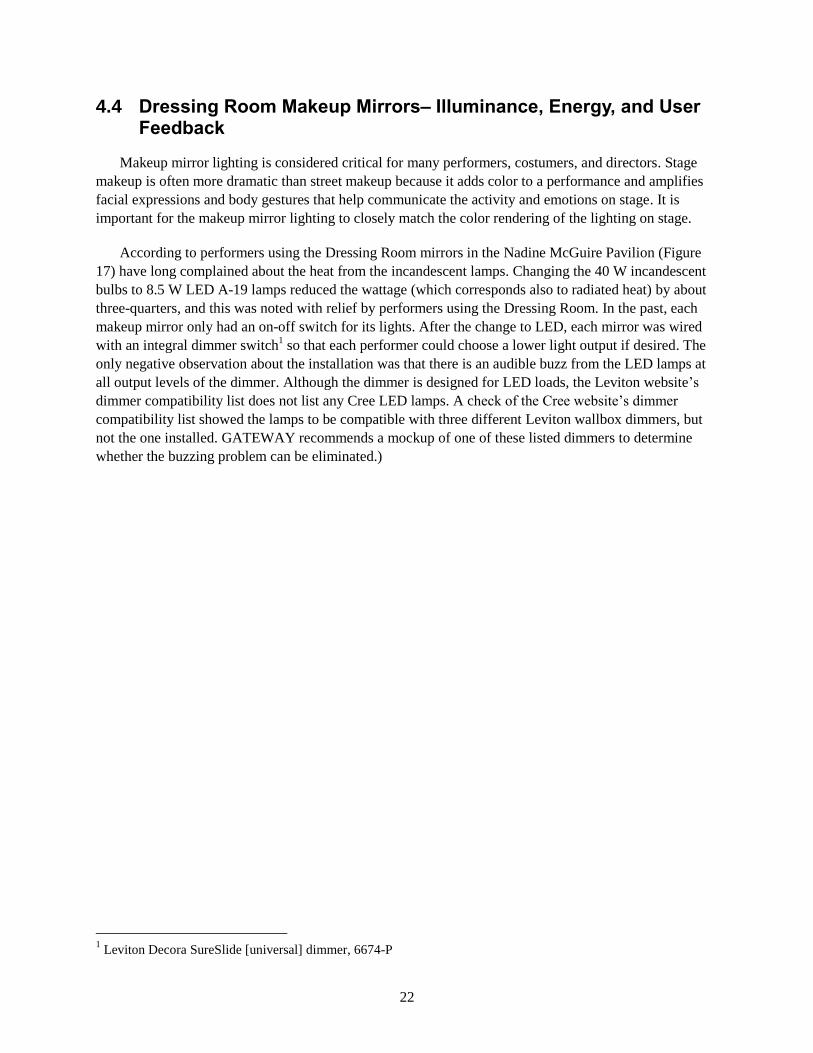
Figure 17. Dressing Room after retrofitting lamps with 8.5 W A-19, 93 CRI, 2700 K, 450 lm LED lamps.
Although called a 40 W incandescent equivalent, the lamps produce almost twice the lumens of the
130 V incandescent incumbent lamps. This is because 130 V incandescent lamps, presumably
selected for their longer life, emit almost 25% less light at 120 V operation than lamps rated for 120
V operation. ........................................................................................................................................ 23
Figure 18. Typical Dressing Room weekly lighting power profiles, baseline incandescent and LED. Data
collected during weeks of 1-27-14 (baseline) and 3-24-14 (LED) ..................................................... 25
Figure 19. Typical daily Dressing Room makeup mirror lighting profiles, baseline and LED. Data
collected days of 1-28-14 (baseline) and 3-26-14 (LED) ................................................................... 25

xi
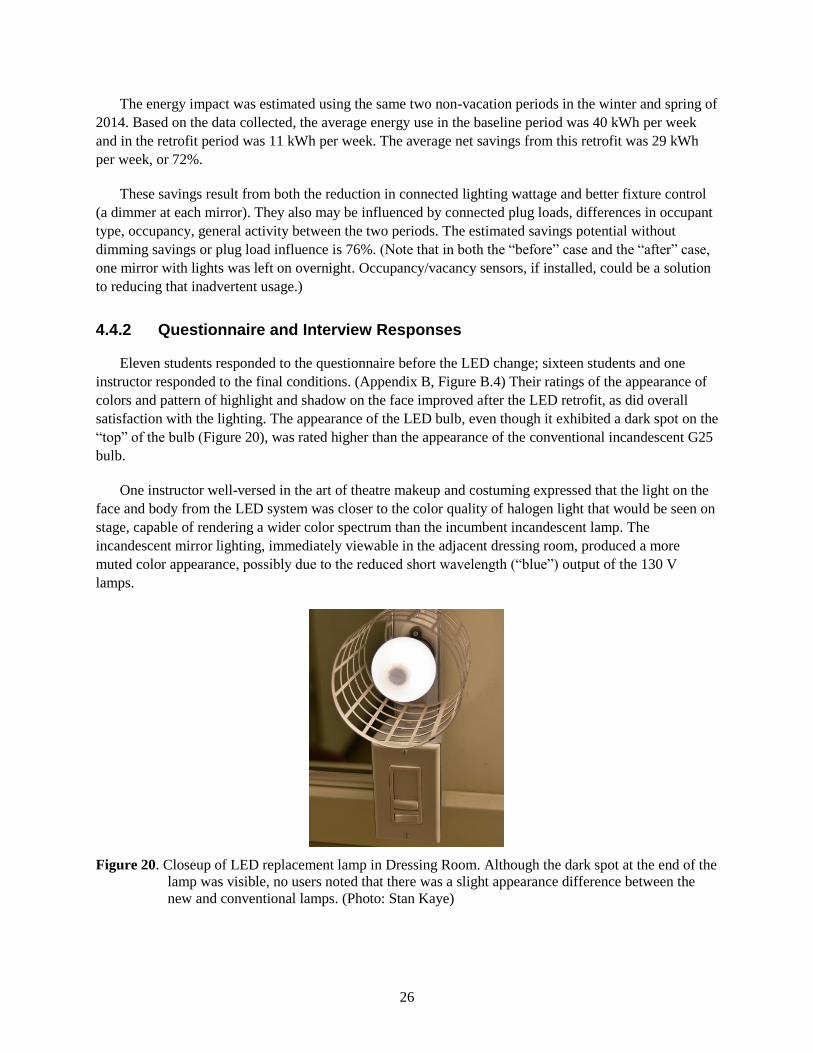
Figure 20. Closeup of LED replacement lamp in Dressing Room. Although the dark spot at the end of the
lamp was visible, no users noted that there was a slight appearance difference between the new and
conventional lamps. (Photo: Stan Kaye) ............................................................................................. 26
Figure 21. Sketch of sidelighting technique used for dance performance. The booms and sidelighting
theatrical instruments were concealed from the audience’s view by vertical black panels. ............... 27
Figure 22. Theatrical instrument wattage by lighting cue as measured at two performances of “Herald,”
the baseline halogen lighting in October 2013, and the LED lighting in April 2014. For the same
color effect, the LED is providing 50% to 90% savings in power. Note that there is standby power
from the LED system even during “blackout” cue 8. ......................................................................... 34
Figure 23. Theatrical sidelighting instrument energy use (watt-hours) by lighting cue measured at two
performances of “Herald.” The baseline halogen instrument energy use was 83 watt-hours, LED
instrument energy use was 11 watt-hours. .......................................................................................... 34
Figure 24. Summary of energy use (average kilowatt-hours per week) in the four spaces before and after
the change to LED lighting. Theatrical lighting energy use was not included. .................................. 36
Tables
Table 1. Comparison of luminaire characteristics and performance data before and after the change to
LED lighting in the G15 Acting Studio ................................................................................................ 9
Table 2. Luminaire characteristics and performance before and after the change to LED lighting in the G6
Dance Studio ....................................................................................................................................... 14
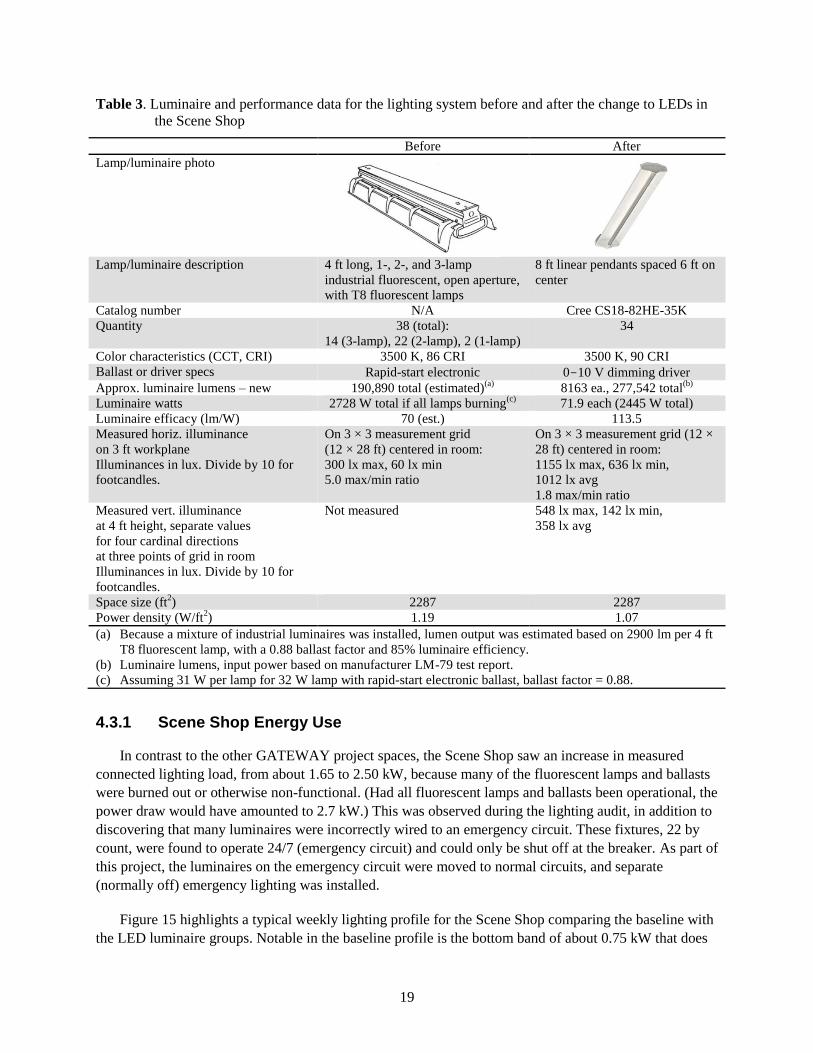
Table 3. Luminaire and performance data for the lighting system before and after the change to LEDs in
the Scene Shop .................................................................................................................................... 19
Table 4. Comparative lamp characteristics and performance data before and after the change to LED
mirror lighting in the Dressing Room ................................................................................................. 24
Table 5. Sidelighting products and their performance data ........................................................................ 28
Table 6. Dimmer settings and color gels used at each cue for the halogen theatrical sidelighting
instruments during the fall 2013 performance of “Herald” ................................................................ 29
Table 7. Intensity settings for LEDs used in LED theatrical sidelighting instruments during the Spring
2014 performance of “Herald.” W = white; G = Green; R = Red; B = Blue. ..................................... 30
Table 8. Video stills from fall and spring performances illustrating the effect of the light from filtered
halogen sidelighting or LED sidelighting for lighting cues 1 through 7............................................. 30


1
1.0 Introduction
Colleges and universities in the U.S. teach 21.3 million students per year,1 providing a broad
background of knowledge and capabilities that students can call upon in their lives and careers. In the
U.S., the higher education sector spends an estimated $14 billion each year on energy,2 approximately
20% to 31% of which is attributable to lighting use.3 The University of Florida (UF), a land-grant
institution located in Gainesville, is one of the nation’s largest comprehensive universities, with 50,000
students. Opened in the fall of 2004, the Nadine McGuire Theatre and Dance Pavilion on the UF campus
(Figure 1) was constructed as a three-story addition to the Constans Theatre. Encompassing 46,000 ft2, the
pavilion houses two theatres as well as dance studios, acting studios, a scene shop, costume studios, and
classrooms. Students get exposure to performing arts production, digital sound and lighting design, set
and costume design, and culturally diverse literature, plays, and dance. Like most academic buildings, this
building has long hours of operation. Normal evening activity includes classes, rehearsals, and
performances.
Figure 1. The Nadine McGuire Theatre and Dance Pavilion at the University of Florida in Gainesville
(Photo: University of Florida)
1 National Center for Education Statistics, http://nces.ed.gov/fastfacts/display.asp?id=372.
2 U.S. Department of Energy, Better Buildings Alliance,
http://www4.eere.energy.gov/alliance/sectors/private/higher-education. 3 U.S. Department of Energy, Higher Education Energy Alliance, 2012 Annual Report, October 2012. Commercial
lighting uses about 4.0 quads of primary energy per year, which is over 20% of total commercial building energy use
(http://apps1.eere.energy.gov/buildings/publications/pdfs/alliances/heea_annual_report_2012.pdf). Thirty-one
percent of energy consumption by U.S. college and university education buildings is for lighting
(https://www.nationalgridus.com/non_html/shared_energyeff_college.pdf).

2
Why study a performing arts building? First, the usual building contains large-volume teaching and
rehearsal spaces with open ceilings for flexible lighting and attachment of scenery, portable lighting,
speakers, etc. These intensively used spaces are not typical white acoustical ceiling applications, so the
existing lighting is generally higher-lumen (lm) output, perhaps more akin to industrial or gymnasium
lighting than other classrooms. These spaces are duplicated across the United States in secondary schools
and college campuses. Second, performance lighting is a key element in several types of spaces. There are
more than 15,000 performing arts organizations1 and 14,000 performing arts establishments
2 in the U.S.
that use halogen theatrical instruments drawing 575 to 2000 W each. Many of these products are then
filtered using absorptive colored media, reducing the already-low efficacy (lumens per watt [LPW]) of the
emitted light. While theatrical productions do not dominate national energy usage, they can be a dramatic
energy expense for a high school or college theatre or auditorium, theme park, hotel, house of worship, or
other performing arts space. Can light-emitting diode (LED) technology make a difference in energy use,
and is the technology ready to meet the stringent demands for color quality and dimming range that
theatres require? The U.S. Department of Energy’s (DOE’s) GATEWAY Demonstration program went to
the Nadine McGuire Pavilion to find out.
The Nadine McGuire Pavilion houses tall-ceiling classrooms used for classes in acting, musical
theatre, and a wide variety of dance. These spaces demand flexibility, and all types of performance arts
are shared with an audience, so body movement and facial expression are important to communication.
UF and the DOE GATEWAY Demonstration program combined forces to investigate the change to LED
architectural and theatrical lighting in two of these classrooms, along with two spaces that support the
performing arts: the makeup lighting in a dressing room, and the scene shop where theatrical sets are
built.
2.0 Project Description
The UF School of Theatre and Dance has approximately 275 student majors guided by 30 faculty and
staff, and offers performances before approximately 1200 patrons annually. The Dance school offers a
variety of classes, including Pilates and exercise, African dance, and contemporary dance, as well as
programs in intercultural dance studies, dance and medicine, choreography, and dance theatre. The
Theatre school offers acting, musical and dramatic theatre, and specialized costume, lighting, audio, and
scene design. Theatre production is naturally a collaborative process achieved by a high degree of
teamwork, under real time pressures, given an impending, non-negotiable opening night deadline. The
making of these performances utilizes skills from literature, business and finance, project management,
engineering, construction, physics, physiology, electronics and programming, music, architecture,
communication, movement, as well as the visual and decorative arts.
The Nadine McGuire Pavilion is busy with activity from early hours until late at night, during the
academic year and through the summer sessions. Its classrooms, studios, and workspaces are used by
multiple instructors, and it takes a wide-ranging mix of disciplines working together to create arts
productions.
1 1997 economic census conducted by the U.S. Census Bureau and reported by Princeton University in 2002,
http://www.princeton.edu/culturalpolicy/quickfacts/artsorgs/howmanytotal.html. 2 2007, U.S. Economic Census, http://arts.gov/sites/default/files/Time-Money-Slides.pdf.

3
UF receives power from Duke Energy at substations and distributes it through its internal electrical
grid to provide power to all of the main campus. The blended average rate is $0.10/kWh. The Nadine
McGuire Pavilion typically uses 586 megawatt-hours of energy per year.
The following briefly describes the four basic spaces, comprising 8164 ft2, selected for relighting with
LED luminaires or lamps.
Acting Studio G15. This is a 39 × 39 ft interior classroom with a 15 ft 6 in. black-painted ceiling and
grey upper walls. The room was originally equipped with an uneven pattern of nine 100 W PAR38
ceramic metal halide downlights (color rendering index [CRI] = 92) that produced a spotty pattern on
the floor and distinct arc patterns on the adjacent walls (seen in Figure 2). These lights also required a
10-minute restrike time when inadvertently switched off, so the room was supplemented with a
square of temporary theatrical “cyc lights” (three-circuit PAR38 striplights) lamped with compact
fluorescent lamp (CFL) reflector lamps. Although these supplemental lamps provided a switchable
light source with a softer-edge light distribution that helped relieve some of the spottiness, the CFL
lamps routinely burned out quickly. When GATEWAY first assessed the room, only 15 of 72 lamps
were still burning in the cyc lights, and there was no intention to replace the failed lamps because they
posed an ongoing maintenance problem.
Figure 2. G15 Acting Studio before LED lighting remodel. Lighting is recessed clear cone downlights
with 100 W PAR38 ceramic metal halide lamps, and medium-base CFL reflector lamps in
square of theatrical “cyc lights.”
Dance Studio G6. Primarily used for regular dance classes, this 50 × 83 ft open space has a 20 ft
ceiling painted dark gray. The room is equipped with permanently mounted theatrical pipe grid to
accommodate flexible stage lighting instruments for performances. The room has a west wall of full-
height windows, and a row of high windows on the south-facing wall. When this room is used as a
CFL-lamped
cyc lights
Metal halide
recessed downlight
Metal halide
recessed downlight
Burned-out CFL
cyc light

4
rehearsal space and final performance space, blackout shades along the window wall are deployed
and walls are covered in floor-to-ceiling black curtains. The original lighting was a 2 × 4 row array of
320 W metal halide industrial low-bay luminaires, 4000 K color, 65 CRI. These remained at full
output all day long, even when the window wall admitted adequate daylight, and when the room was
unoccupied. The metal halide ballasts emitted a noticeable buzz and the lamps took about 10 minutes
to warm up to full output when switched on. If accidently shut off during operation, the lamps
required 10-15 minutes to cool down and restrike. (To provide instantaneous light for janitorial
cleaning, the university installed one 900 W tungsten-halogen floodlight, controlled by a separate
switch.)
Figure 3. G6 Dance Studio when used for dance classes (Photo: Stan Kaye)
Dance Studio G6 – Performance Lighting. Twice per year the Dance Studio is converted into a
dance performance space, with tiered audience seating at one end to accommodate up to 100 people.
There is a permanently installed theatrical pipe grid is located above the dance floor for clamp-
mounted theatrical instruments. These are aimed as needed, controlled by a theatrical board through a
portable dimmer rack. For dance performances, the lighting designer often uses a sidelighting
technique, using portable boom-mounted theatrical instruments, conventionally lamped with 575 W
halogen. These deliver horizontal beams of light that illuminate the bodies of the dancers, revealing
the form and movement of the body and costumes. The booms are vertical pipes located in the wings
of the stage, or at the edge of the dance floor, blocked from view by the audience by curtains or large
baffles. Of the theatrical lighting, only the sidelighting was studied for this GATEWAY
demonstration.
Scene Shop. This 32 × 64 ft open space with 20 ft open-joist ceilings was originally two adjacent
rooms, but a wall was removed to expose irregularly spaced 4 ft long T8 fluorescent industrial
luminaires mounted between joists. All told there were 4 three-lamp luminaires, 22 two-lamp
luminaires, and 1 one-lamp luminaire, and if all had been functional, the power draw would have
been approximately 1767 W. Over the years, many of these luminaires had become non-functional
and were never replaced or repaired. When GATEWAY did an early assessment of the room, light
levels were very low, measuring between 60 and 300 lux (lx) (6 and 30 horizontal footcandles [fc])
5
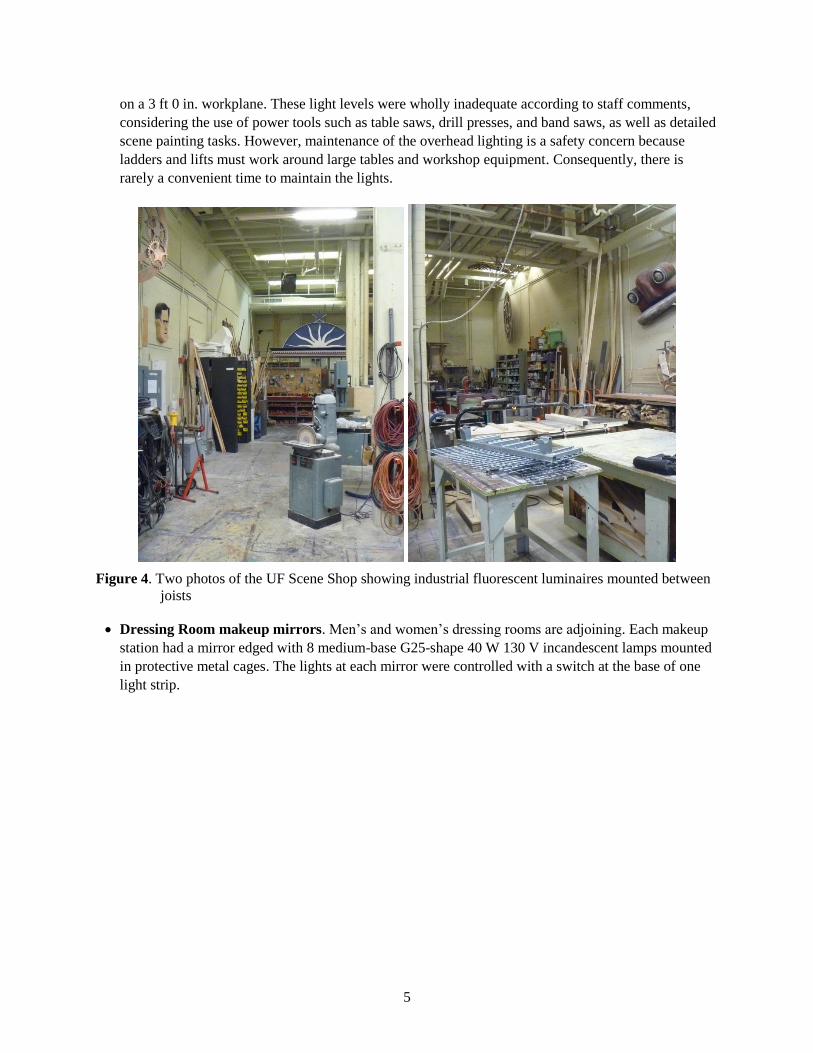
on a 3 ft 0 in. workplane. These light levels were wholly inadequate according to staff comments,
considering the use of power tools such as table saws, drill presses, and band saws, as well as detailed
scene painting tasks. However, maintenance of the overhead lighting is a safety concern because
ladders and lifts must work around large tables and workshop equipment. Consequently, there is
rarely a convenient time to maintain the lights.
Figure 4. Two photos of the UF Scene Shop showing industrial fluorescent luminaires mounted between
joists
Dressing Room makeup mirrors. Men’s and women’s dressing rooms are adjoining. Each makeup
station had a mirror edged with 8 medium-base G25-shape 40 W 130 V incandescent lamps mounted
in protective metal cages. The lights at each mirror were controlled with a switch at the base of one
light strip.

6
Figure 5. Dressing Room, with incandescent lamped mirror lighting (Photo: Stan Kaye)
In the fall of 2013, UF Facilities Planning, Design & Construction professionals, representatives of
Duke Energy, and members of the Theatre and Dance school’s lighting design department worked
together to study LED alternatives to their existing lighting. The new lighting options evaluated consisted
of a complete replacement of luminaires rather than installing retrofit lamps, because the existing metal
halide lighting posed a problematic restrike time, and because the existing fluorescent luminaires were
dated and had already undergone a retrofit from T12 to T8 lamps. (Only in the dressing rooms was an
LED version of the traditional G25 incandescent lamp considered and ultimately accepted as an effective
and inexpensive option.) Multiple design options were considered, point calculations run to confirm
illuminances and light distribution, and samples ordered of all products for visual evaluation of color and
dimming characteristics. The lighting and control products were ordered in November and December of
2013, and installation commenced in February and March of 2014.
3.0 Field Measurement of Technology
For the power and energy measurements, Pacific Northwest National Laboratory (PNNL) supervised
the installation of power monitoring equipment, collect power data before and after the installation of the
new LED systems, and analyze the data. The energy monitoring of the existing and relighted conditions
began in October 2013 and concluded in May 2014. Power data were collected for the four architectural
spaces plus the boom lights used for the dance performance, using a combination of wired and wireless
power meters connected to a networked data acquisition server made by Obvius. The power meters,
Wattnodes, were installed inside electrical panels in five locations in the building. Additional Wattnodes
were installed in an electrical closet to monitor the boom lights. The majority of the meters communicated
wirelessly back to the network-connected data server, where data were uploaded and accessed remotely.
The beauty of this system was its ability to communicate data from multiple points in the building to one
central collection point, wirelessly. Additional advantage was gained with the ability to access and upload
data remotely over the UF local area network and then the internet. The system accuracy of the Wattnode,
wireless bridge, and data server is calculated to be between 0.5% and 1.0%.

7
PNNL worked with the UF lighting design team to develop, distribute, and collect questionnaires to
assess user (e.g., instructors, performers/students, crew, audience members) responses to the lighting
conditions. Sample questionnaires can be seen in Appendix A. The responses to all questionnaires are
detailed in Appendix B.
Illuminance measurements were collected using a Minolta T-10A meter1 or with the Konica-Minolta
CL-500A color meter.2 Dance performance color measurements were collected using the same Konica-
Minolta CL-500A meter, which can document spectral power distribution, its derived color metrics, and
illuminance.
4.0 Results
The lighting changes in the Nadine McGuire Pavilion received a positive response from faculty and
students, which was as much attributable to the improved ease of controls as to the change in light sources
and luminaires. Controls combined with dimmable luminaires offered not only the potential of additional
energy savings in all four of the space types, but also support for the activities and occupants within each.
The LED solutions combined with dimming controls received high marks from instructors and
students/performers, and reduced energy use in all cases. LED lamp/luminaire performance in terms of
appearance, functionality, illuminances, energy, and glare are reported for each space in the following
sections. Power and energy results are summarized in section 4.6.
4.1 G15 Acting Studio – Illuminance, Energy, and User Feedback
Goals for relighting the Acting Studio included improved switching and dimming control, better
illuminance uniformity, brighter walls, and higher vertical illuminances for seeing faces, bodies, and
gestures. This was accomplished with a combination of nine 39 W LED recessed downlights on 8 × 10 ft
spacing, and twelve 4 ft long linear LED wallwashers spaced 10 ft apart around the room perimeter at a
distance of 5 ft from the wall.
The LED downlights and wallwashers were ordered with 0-10 V dimming drivers. The downlights
were wired to be dimmed together from a wall-mounted manual slide dimmer, and the wallwashers were
wired to be dimmed together from a separate wall-mounted slide dimmer. (The dimmers replaced the
original switches at the room’s main entrance.) Different acting instructors use the dimming system for
different reasons. These include dimming areas of the classroom to focus student attention on the area of
brightest light (such as the white board on the perimeter walls, or the center of the room where the teacher
is demonstrating a technique), to change the mood according to the scene or piece, and to reduce energy
use when the room is unoccupied.
1 This meter has rated linearity of +2%, +1 digit, rated cosine response within 3%, and rated spectral response within
6% of the International Commission on Illumination spectral luminous efficiency function, V(λ). 2 This meter has rated wavelength precision of +0.3 nanometers and rated chromaticity accuracy in x-y coordinates
of +0.0015.
8
Figure 6. The Acting Studio, showing the LED architectural lighting of 9 LED downlights and 12
perimeter LED wallwashers. The pipe grid with theatrical instruments is not used for normal
classes. (Photo: Stan Kaye)
Table 1 compares lighting product characteristics and performance before and after the change to
LED lighting. The comparison includes the perimeter lights (also called “border lights” or theatrical “cyc
lights”), even though they were added to help improve the original room lighting.

9
Table 1. Comparison of luminaire characteristics and performance data before and after the change to
LED lighting in the G15 Acting Studio
Before After
Luminaire 1 Luminaire 2 Luminaire 1 Luminaire 2
Lamp/luminaire photo
Lamp/luminaire description Recessed clear
cone downlight
with 100 W
ceramic metal
halide PAR38 lamp
Temporarily
installed “cyc
lights,” sockets
with 30 W
longneck CFL R40
lamps
Recessed LED
downlight with
6 in. dia. clear
reflector cone,
~3000 lm
Recessed linear
LED wallwasher
with ribbed acrylic
diffuser
Catalog number N/A N/A Cree KR6-30L-40
K with KR6T-
SSGC-FF trim
HE Williams
HETW-4-LED-
PH30/840-A
Quantity 12 15 9 12
Color characteristics (CCT,
CRI)
4000 K, 92 CRI 4100 K, 82 CRI 4000 K, 90 CRI 4000 K, 80 CRI
Ballast or driver specs Non-dim electronic
ballast
Integral ballast in
lamp 0-10 V dimming
driver
0-10 V dimming
driver
Approx. luminaire lumens
(estimated from
manufacturer data)
5327 lm 1650 lm (per lamp) 3000 lm 2942 lm
Luminaire watts 122 W 30 W (per lamp) 37 W 42.8 W
Luminaire efficacy (LPW) 43.7 55.0 (lamp only) 81.1 68.7
Measured horiz.
illuminance on 30 in.
workplane (in lux). Divide
by 10 for footcandles.
873 lx max (directly beneath dnlt)
25 lx min (4 ft from two corner walls)
367 lx (diagonal ctr of four dnlts)
34.9 max/min ratio in room
On 3 × 3 measurement grid (13 × 13 ft)
centered in room:
400 lx max, 314 lx min, 334 lx avg
1.3 max/min ratio
Measured vert. illuminance
at 4 ft height, separate
values for four cardinal
directions
Not measured On 3 × 3 measurement grid (13 × 13 ft)
centered in room:
108 lx max, 39 lx min, 75 lx avg
Space size (ft2) 1528
1528
Power density (W/ft2) 1.25 0.55
CCT is correlated color temperature.
4.1.1 Acting Studio Energy Use
The power profile of the Acting Studio, as measured with connected load, was reduced by roughly
50% with the new LED fixtures. Figure 7 presents a typical weekly lighting profile composed of the
baseline and the LED fixture groups discussed above. Notable in the profile is the dramatic drop in power
draw (kilowatts) from the baseline to the LED fixtures and the increased variability in the LED profiles.
This variability is a result of the improved ability to dim and switch the LED products, and reveals that
the newly installed dimmers are being used.
Figure 8 presents the same Acting Studio profile for a single day. This profile highlights both the
reduction in energy use from the LED’s improved efficiency and the additional savings resulting from

10
switching and dimming. The dimming is best noted in the early evening hours after 6 PM. The initial
morning spike in power for both profiles is typically attributed to early rehearsals and/or janitorial
activities.
Figure 7. Typical weekly lighting power profiles, baseline and LED, for the Acting Studio. Data
collected during the weeks of 1-27-14 (baseline) and 3-24-14 (LED).
0.0
0.2
0.4
0.6
0.8
1.0
1.2
1.4
1.6
1.8
2.0
kW
Acting Studio Lighting Weekly Power Profile
Baseline LED

11
Figure 8. Typical daily lighting power profiles, baseline and LED, for the Acting Studio. Data collected
1-28-14 (baseline) and 3-25-14 (LED).
To estimate the energy impact of this retrofit, energy data use during two non-vacation periods in the
winter and spring of 2014 were collected. The baseline period covered 7 weeks while the retrofit metering
period was 4 weeks. (The difference was due to a compressed post-retrofit period before students left for
summer break.) Baseline average energy use of 142 kWh per week in the baseline period was reduced to
45 kWh per week in the retrofit period. The average net savings from this retrofit was 97 kW per week, or
68%.
While these savings are impressive, and result from both the reduction in connected wattage and
better fixture control (dimming), they also may be influenced by differences in occupant type, occupancy,
and space use across the two periods. A lower bound on the savings potential can be estimated as the
difference in connected load (i.e., load without dimming savings) of roughly 56%.
4.1.2 Acting Studio Questionnaire and Interview Responses
Students and instructors were invited to complete questionnaires regarding qualitative aspects of each
type of lighting. Responses were received from 28 students and 6 instructors before the change and 14
students and 2 instructors afterwards. (Appendix B, Figure B.1) Responses indicated that the appearance
of colors improved under the LED, while the amount of contrast – highlight and shadow – was reduced
and therefore also preferred over the incumbent products.” The original system was rated as delivering
too little perimeter lighting, while the LED system was rated as delivering somewhat too much perimeter
lighting at its full power setting. The two instructors responding to the questionnaire had an
overwhelmingly positive response to the ability to control (e.g., raise or lower) the light level delivered by
the LED system, which permitted tuning the center and perimeter lighting, separately, to the preferred
0.0
0.2
0.4
0.6
0.8
1.0
1.2
1.4
1.6
1.8
2.0
kW
Time of Day
Acting Studio Lighting Daily Power Profile
Baseline LED
Rehearsals or janitorial activities
Dimming

12
level. This enthusiastic response on controllability was confirmed through face-to-face interviews with
five instructors.
During the interviews, instructors complained of switching problems in the room under the original
metal halide lighting, and the unevenness of lighting on the workplane (measured as a ratio of 2.4 to 1
directly under and diagonally between a group of four downlights spaced only 7 × 8 ft apart). They
disliked the “raccoon-like” pattern of light on faces that resulted from the intense and narrow distribution
from the downlights, since seeing faces accurately is of paramount importance in acting. They wanted
dimming because low light levels work better for some class exercises. They also wanted to control
perimeter lighting separately from the center to direct focus for the class. They far preferred the new
lighting distribution, since evenly spaced luminaires combined with wall lighting helped improve
uniformity of light across the room. All of these issues were addressed with the lighting change. One
instructor commented that the lighting now works with, rather than against, the instructor.
4.2 Dance Studio – Illuminance, Energy, and User Feedback
The original Dance Studio lighting was poor in color, did an unacceptable job of modeling faces and
bodies of dancers, and was seldom switched off because restrike time was such a concern. The design
team proposed an edge-lit LED product, with an acrylic blade to diffuse light and therefore produce
higher vertical illuminance for dancers, but with a minimal amount of glare. A 4 × 5 pattern of edge-lit
acrylic blade luminaires was proposed, and three sample units were mocked up and approved by space
users for the final installation (Figure 9 and Figure 10).
Figure 9. The Dance Studio, after the general lighting was replaced with 20 edge-lit LED luminaires
(Photo: Stan Kaye)

13
Figure 10. The Dance Studio showing the new LED luminaires. Ten luminaires along the west-facing
window wall were designed to be controlled separately by a photosensor for daylight
dimming. (Photo: Stan Kaye)
Figure 11. Closeup photo showing edge-lit LED panel from below. Note the daylight sensor circled in
the photo. (Photo: Stan Kaye)
The edge-lit panels visibly improved color quality and switching and dimming capability, reduced
audible noise, reduced glare for dancers, and provided more uniform light on the dancers’ bodies.
Because its lumen output is spread over a large surface area (Figure 11), the light is not perceived as
glaring, even though it is delivering useful vertical illuminances at all points in the studio. (High vertical
illuminance is desirable in many applications, but can come with a glare penalty if designed poorly.)

14
Table 2 compares the lighting system in the G6 Dance Studio before and after the change to LED
lighting.
Table 2. Luminaire characteristics and performance before and after the change to LED lighting in the G6
Dance Studio
Before After
Lamp/luminaire photo
Lamp/luminaire description Pendant-mounted “low-bay”
industrial luminaire with
prismatic lens and 320 W pulse
start clear quartz arc tube metal
halide lamp
4 ft long linear edge-lit LED
panel suspended from ceiling
with remote-mounted driver
Catalog number N/A GE ELO40A2GV-white
Quantity 8 20
Color characteristics (CCT, CRI) 4000 K, 65 CRI 4000 K, 82 CRI
Ballast or driver specs Pulse-start magnetic ballast 0-10 V dimming driver
Approx. luminaire lumens – initial 23,560 (31,000 lamp) 6400
Luminaire watts 368 72
Luminaire efficacy (LPW) 64 89
Horiz. illuminance(a)
on a 30 in. workplane.
Walls are draped in black for
performance, so reflectances (%) are 5-5-5.
Illuminances in lux. Divide by 10 for
footcandles.
On 10 x 10 calc grid (5 × 8 ft)
centered in room:
286 lx max, 90 lx min, 204 lx avg
3.2 max/min ratio
On 10 x 10 calc grid (5 × 8 ft)
centered in room:
251 lx max, 119 lx min, 190 lx
avg
2.1 max/min ratio
Vert illuminance(a) at 4 ft height ,
separate values for four cardinal
directions, reflectances (%) are 5-5-5.
Illuminances in lux. Divide by 10 for
footcandles.
On 10 x 10 calc grid (5 × 8 ft)
centered in room:
149 lx max, 4 lx min, 71 lx avg
On 10 x 10 calc grid (5 × 8 ft)
centered in room:
100 lx max, 4 lx min, 59 lx avg
Space size (ft2) 4150 4150
Power density (W/ft2) 0.71 0.35
(a) Illuminance values were calculated using AGI32®. See Appendix B for input values.
4.2.1 Dance Studio Controls and Their Performance
The LED products were supplied with 0-10 V dimming drivers and paired with one 0-10 V dimmer
switch (Lutron DVTV ) controlling two interior rows of edge-lit LED luminaires, and one 4-button
controller for the two rows of luminaires next to the west window wall1. The 10 window wall luminaires
are circuited together and their output was designed to be controlled by one open-loop photosensor. The
1 The Crestron system components controlling the window wall-side luminaires were as follows: 4-button controller
GLPPA-KP, open-loop photosensor GLS-LOL, power pack GLPP-DIMFLVCN-PM, and handheld remote
controller GLPPA.

15
photosensor is located 6 ft from the window wall. The open loop photosensor is powered by and wired to
a power pack, also mounted in the ceiling. This power pack is programmable by a handheld remote
controller, but had never been programmed because the system was never commissioned. The
photosensor seems to have functioned for the spring semester with only its default settings, which
produced no dimming. This was only determined after examining the daily power profiles collected by
GATEWAY.
A couple of issues seem to have led to the photosensor not performing as expected. The first occurred
while installing the photosensor, where a jumper setting for input light levels to the sensor was left in the
default mode. Instead, the installers should have measured the daylight levels and adjusted the jumper
setting, without which the photosensor would be expected to read light levels far exceeding actual
incident levels. The second occurred with the installation of the power pack. The technical information
from the manufacturer contains confusing language that implies out-of-the-box functionality, but also
warns that the system must be commissioned before use with scene selections and daylighting level
settings. Without programming, the power pack instructs the dimmable luminaires to produce 100%
output in response to any daylight sensor input. As a result, only manual dimming at the wall was
reducing luminaire output during the period of GATEWAY’s measurements.
Programming the daylight dimming system properly would have required several steps. First, a light
meter is required, as described above, to first ensure that there is sufficient daylight for the sensor to
operate, and then to set the appropriate range of sensitivity for the meter. (It is not clear from the
instructions whether the latter measurements are to be made at the sensor or at the workplane.) The
second step is to use the handheld remote to set the maximum and minimum levels for the daylighting
scene. This involves being on site during bright daylight conditions to set the desired level of the electric
lighting when daylight is high; but also to return at night for a similar setting when daylight is
unavailable. Without accurate commissioning of the photosensor, additional savings from daylight
dimming cannot be achieved. (When this omission was pointed out to the University, the facilities group
promptly scheduled a visit from the control manufacturer’s representative for commissioning.)
4.2.2 Dance Studio Energy Use
The Dance Studio saw a significant reduction in connected load—in this case just over 50%—with the
change to new LED luminaires. Figure 12 highlights a typical weekly lighting profile comparing the
baseline with the LED luminaires. Similar to the Acting Studio is the reduction in power from the
baseline and the increased variability of the LED fixtures due to dimming controls. The profile also shows
a maximum power draw in the early morning from the janitorial staff, plus a characteristic 20% to 30%
drop in power later in the morning that is presumed to be due to manual switching and dimming by
instructors.
A single day profile is presented in Figure 13. This profile highlights both the LED direct reduction in
energy use and the dimming-based savings.

16
Figure 12. Typical Dance Studio weekly lighting power profiles, baseline and LED. Data collected
during weeks of 1-27-14 (baseline) and 3-24-14 (LED).
Figure 13. Typical Dance Studio daily lighting power profiles, baseline and LED. Data collected days of
1-28-14 (baseline) and 3-25-14 (LED).
0
0.5
1
1.5
2
2.5
3
3.5
kW
Dance Studio Lighting Weekly Power Profile
Baseline LED
0
0.5
1
1.5
2
2.5
3
3.5
kW
Time of Day
Dance Studio Daily Lighting Power Profile
LED Baseline
Power reduction due to manual dimming
17
As with the Acting Studio, the energy impact was estimated using the same two non-vacation periods
in the winter and spring of 2014. Based on the data collected, the average energy use was 217 kWh per
week in the baseline period and 81 kWh per week in the retrofit period. The average net savings from this
retrofit was 136 kWh per week, or 63%.
These savings result from both the reduction in connected power and better fixture control (manual
dimming); they also may be influenced by differences in occupant type, occupancy, and space use across
the two periods.
A lower bound on the savings potential can be estimated as the difference in connected power (i.e.,
load without dimming savings) of 53%.
4.2.3 Dance Studio Questionnaire and Interview Responses
Students were invited to complete questionnaires regarding the architectural lighting of the Dance
Studio; responses were received from 13 students before and 64 after the LED retrofit. (Appendix B,
Figure B.2) Before and after responses to questions about highlight, shadow, and color were similar
except for the color of skin, which was rated as more natural following the LED retrofit. Glare was rated
as not as noticeable in either situation, but overall satisfaction with the Dance Studio lighting was rated
more highly after the retrofit.
Interviewed instructors disliked the “greenish tint” of the original metal halide light, and commented
that the color of light was much better when the luminaires had been newly relamped. Also, they reported
that the metal halide’s light output and color decayed quickly over time. (Practical lamp life was
estimated by GATEWAY at only 10-15,000 hours before light output or color quality had decayed to an
unacceptable level, based on the information provided.) As a result of the restrike time requirement with
the old system, instructors had learned to not touch the light switches, so the lights stayed on all day long.
With the change to LED lighting, instructors felt free to dim or raise the lighting to affect the dancers’
mood and energy levels, or to switch off the lights altogether. Although the light on faces and bodies from
the overhead lighting was reported as acceptable before the change, the visibility of the dancer’s form
seemed improved with the LED edge-lit luminaires. Skin tones were improved as well. The only
suggestion was—if it were possible to do the lighting upgrade again—to simply use more of the same
luminaires to increase maximum light levels. (This would be simple to do since the ceiling power is easily
accessible and control wiring is daisy-chained.)
4.3 Scene Shop – Illuminance, Energy, and User Feedback
The existing T8 fluorescent luminaires mounted between ceiling joists were removed, and rows of
8 ft LED linear luminaires were spaced 6 ft on center, suspended 2 ft below the ceiling. Target light levels
on the 3 ft horizontal workplane were a minimum of 750 lx (75 fc), with no more observed glare than
would have been delivered by the T8 fluorescent lamps that were removed. The luminaire uses LEDs
indirectly mounted in the center spine, with the light directed upward into a white metal reflector that
spreads the brightness over a large, diffuse surface, effectively reducing glare for Scene Shop users. There
was an initial concern raised about potential flicker from the LED luminaires creating a stroboscopic
effect, causing power tools to appear stopped or slowed relative to their actual operation. A luminaire
sample was procured from the sales agent in advance, mocked up in the space, and tested over its full
18
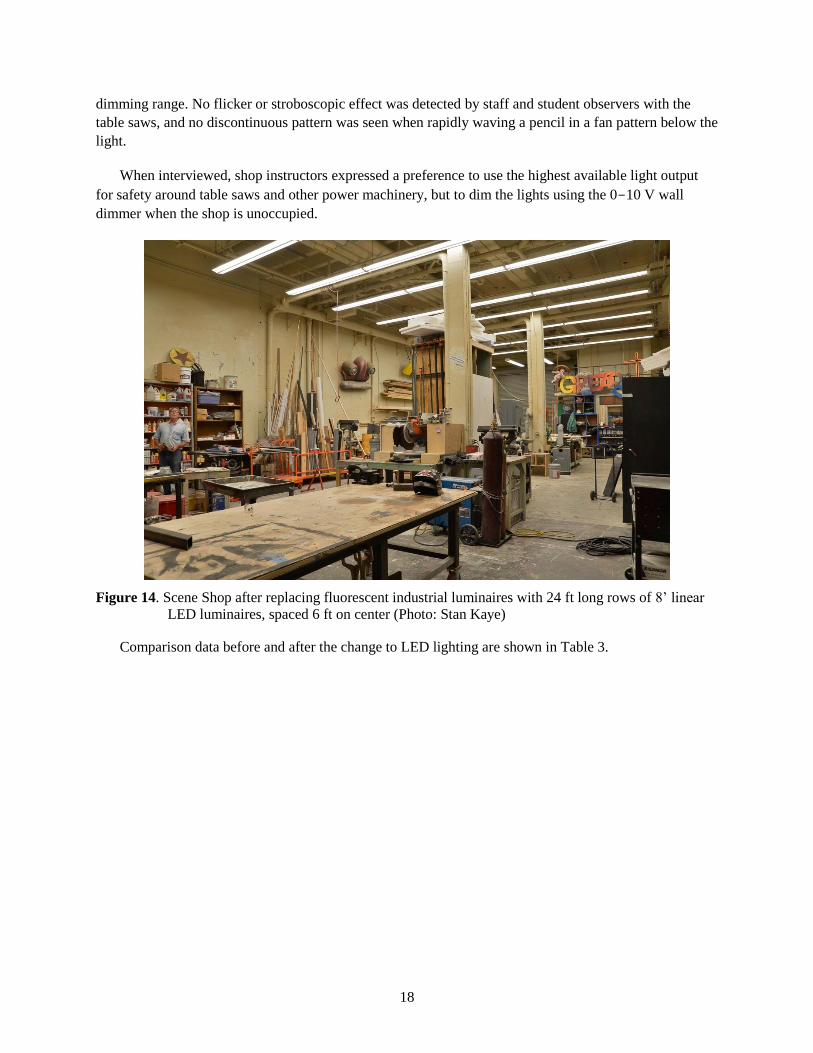
dimming range. No flicker or stroboscopic effect was detected by staff and student observers with the
table saws, and no discontinuous pattern was seen when rapidly waving a pencil in a fan pattern below the
light.
When interviewed, shop instructors expressed a preference to use the highest available light output
for safety around table saws and other power machinery, but to dim the lights using the 0-10 V wall
dimmer when the shop is unoccupied.
Figure 14. Scene Shop after replacing fluorescent industrial luminaires with 24 ft long rows of 8’ linear
LED luminaires, spaced 6 ft on center (Photo: Stan Kaye)
Comparison data before and after the change to LED lighting are shown in Table 3.
19
Table 3. Luminaire and performance data for the lighting system before and after the change to LEDs in
the Scene Shop
Before After
Lamp/luminaire photo
Lamp/luminaire description 4 ft long, 1-, 2-, and 3-lamp
industrial fluorescent, open aperture,
with T8 fluorescent lamps
8 ft linear pendants spaced 6 ft on
center
Catalog number N/A Cree CS18-82HE-35K
Quantity 38 (total):
14 (3-lamp), 22 (2-lamp), 2 (1-lamp)
34
Color characteristics (CCT, CRI) 3500 K, 86 CRI 3500 K, 90 CRI
Ballast or driver specs Rapid-start electronic 0-10 V dimming driver
Approx. luminaire lumens – new 190,890 total (estimated)(a)
8163 ea., 277,542 total(b)
Luminaire watts 2728 W total if all lamps burning(c)
71.9 each (2445 W total)
Luminaire efficacy (lm/W) 70 (est.) 113.5
Measured horiz. illuminance
on 3 ft workplane
Illuminances in lux. Divide by 10 for
footcandles.
On 3 × 3 measurement grid
(12 × 28 ft) centered in room:
300 lx max, 60 lx min
5.0 max/min ratio
On 3 × 3 measurement grid (12 ×
28 ft) centered in room:
1155 lx max, 636 lx min,
1012 lx avg
1.8 max/min ratio
Measured vert. illuminance
at 4 ft height, separate values
for four cardinal directions
at three points of grid in room
Illuminances in lux. Divide by 10 for
footcandles.
Not measured 548 lx max, 142 lx min,
358 lx avg
Space size (ft2) 2287 2287
Power density (W/ft2) 1.19 1.07
(a) Because a mixture of industrial luminaires was installed, lumen output was estimated based on 2900 lm per 4 ft
T8 fluorescent lamp, with a 0.88 ballast factor and 85% luminaire efficiency.
(b) Luminaire lumens, input power based on manufacturer LM-79 test report.
(c) Assuming 31 W per lamp for 32 W lamp with rapid-start electronic ballast, ballast factor = 0.88.
4.3.1 Scene Shop Energy Use
In contrast to the other GATEWAY project spaces, the Scene Shop saw an increase in measured
connected lighting load, from about 1.65 to 2.50 kW, because many of the fluorescent lamps and ballasts
were burned out or otherwise non-functional. (Had all fluorescent lamps and ballasts been operational, the
power draw would have amounted to 2.7 kW.) This was observed during the lighting audit, in addition to
discovering that many luminaires were incorrectly wired to an emergency circuit. These fixtures, 22 by
count, were found to operate 24/7 (emergency circuit) and could only be shut off at the breaker. As part of
this project, the luminaires on the emergency circuit were moved to normal circuits, and separate
(normally off) emergency lighting was installed.
Figure 15 highlights a typical weekly lighting profile for the Scene Shop comparing the baseline with
the LED luminaire groups. Notable in the baseline profile is the bottom band of about 0.75 kW that does

20
not cycle off because it was operating on an emergency circuit. This profile also highlights the LED
connected load as higher than the baseline by about 0.80 kW and some nominal load reduction due to
LED control/dimming.
A single day profile is presented in Figure 16. This profile highlights both the increased LED
connected load, some variability with dimming, and the reduced hours of operation with the re-circuiting
of the emergency fixtures.
Figure 15. Typical Scene Shop weekly lighting profiles, baseline and LED. Data collected during weeks
of 1-27-14 (baseline) and 3-24-14 (LED).
0.0
0.5
1.0
1.5
2.0
2.5
3.0
kW
Scene Shop Fixture Weekly Power Profile
Baseline LED
Minimum load for baseline is due to emergency lighting circuit that kept lights on 24 hr per day

21
Figure 16. Typical Scene Shop daily lighting power profiles, baseline and LED. Data collected during
day of 1-30-14 (baseline) and 3-28-14 (LED).
The energy impact was estimated using the same two non-vacation periods in the winter and spring of
2014. Based on the data collected, the average energy use was 170 kWh per week in the baseline period
and 144 kWh per week after the luminaire change. Even though the connected load of the LED system
was higher than that of the poorly maintained fluorescent, the energy use over time dropped because the
re-circuiting allowed all luminaires to be switched off at night. Between the smaller 24-hour emergency
load and the dimmability of the LED luminaires, the average net savings from this retrofit was 26 kWh
per week, or 15%. These savings may also be influenced by differences in occupant type, occupancy, and
space use across the two periods.
4.3.2 Questionnaire and Interview Responses
Users reacted very positively to the change to LED lighting. One student commented, “Great! Now I
can see to make sure I’m not sawing off my thumb.” Twelve student questionnaires were collected before
the change to LEDs, and twenty-six were collected after. (Appendix B, Figure B.3) The amount of light
from the original system was rated as too low by over 65% of respondents, but rated as high by over 80%
of respondents after the LED retrofit. (This may be related to the Scene Shop supervisor’s desire to
provide the highest available light levels to improve safety.) The amount of shadow decreased, which was
perceived as important for student and instructor safety when working with power tools and machinery.
Under LEDs, lighting flicker was rated as not noticeable by more than 70% of the respondents, a higher
percentage than rated the electronically ballasted incumbent fluorescent system similarly. All respondents
gave the Scene Shop lighting a high rating after the change to LEDs, compared to only half doing so prior
to the change.
0.00
0.50
1.00
1.50
2.00
2.50
3.00kW
Time of Day
Scene Shop Fixtures Daily Power Profile
Baseline LED
Reduced hours of operation
Dimming controls
22
4.4 Dressing Room Makeup Mirrors– Illuminance, Energy, and User Feedback
Makeup mirror lighting is considered critical for many performers, costumers, and directors. Stage
makeup is often more dramatic than street makeup because it adds color to a performance and amplifies
facial expressions and body gestures that help communicate the activity and emotions on stage. It is
important for the makeup mirror lighting to closely match the color rendering of the lighting on stage.
According to performers using the Dressing Room mirrors in the Nadine McGuire Pavilion (Figure
17) have long complained about the heat from the incandescent lamps. Changing the 40 W incandescent
bulbs to 8.5 W LED A-19 lamps reduced the wattage (which corresponds also to radiated heat) by about
three-quarters, and this was noted with relief by performers using the Dressing Room. In the past, each
makeup mirror only had an on-off switch for its lights. After the change to LED, each mirror was wired
with an integral dimmer switch1 so that each performer could choose a lower light output if desired. The
only negative observation about the installation was that there is an audible buzz from the LED lamps at
all output levels of the dimmer. Although the dimmer is designed for LED loads, the Leviton website’s
dimmer compatibility list does not list any Cree LED lamps. A check of the Cree website’s dimmer
compatibility list showed the lamps to be compatible with three different Leviton wallbox dimmers, but
not the one installed. GATEWAY recommends a mockup of one of these listed dimmers to determine
whether the buzzing problem can be eliminated.)
1 Leviton Decora SureSlide [universal] dimmer, 6674-P

23
Figure 17. Dressing Room after retrofitting lamps with 8.5 W A-19, 93 CRI, 2700 K, 450 lm LED lamps.
Although called a 40 W incandescent equivalent, the lamps produce almost twice the lumens
of the 130 V incandescent incumbent lamps. This is because 130 V incandescent lamps,
presumably selected for their longer life, emit almost 25% less light at 120 V operation than
lamps rated for 120 V operation.
Table 4 compares lamp data and performance data before and after the change to LED retrofit lamps
for the Dressing Room mirror lighting.

24
Table 4. Comparative lamp characteristics and performance data before and after the change to LED
mirror lighting in the Dressing Room
Before After
Lamp/luminaire photo
Lamp/luminaire description 40 W 130 V G25 softwhite
incandescent
Cree TW softwhite LED bulb
Quantity (9 mirrors) 72 72
Color characteristics at 120 V (CCT, CRI) 2756 K, CRI 100 2700 K, 93 CRI
Ballast or driver specs None Driver integral to lamp
Approx. per-lamp lumens at 120 V 209 450
Lamp watts at 120 V 35 8.5
Lamp efficacy (lm/W) at 120 V 6 52.9
Horiz. illuminance (max/min/avg lx) N/A N/A
Measured vert. illuminance on face
facing mirror at 4 ft and 7 ft above floor,
16 in. from single mirror,
no ambient light
777 lx max, 573 lx min, 694 lx
avg. [77.7 fc max, 57.3 fc min,
69.4 fc avg]
2,102 lx max, 1,741 lx min,
1,974 lx avg. [210.2 fc max,
174.1 fc min, 197.4 fc avg]
Space size (ft2) 199 199
Power density (W/ft2) 12.66 3.08
4.4.1 Dressing Room Energy Use
Interpreting the Dressing Room lighting energy data, baseline to retrofit, proved challenging for two
reasons. First, the usage of this space was very inconsistent. There were days when no mirror lights were
used, followed by days when they were used heavily and at times were left on for over 48 hours. The
second challenge was the convenience outlet at the switch base for each makeup station. This outlet is on
the same metered circuit as the lighting and, unfortunately, contributes to the measured loads.
Figure 18 compares the baseline with the LED fixture groups for a typical weekly lighting profile.
Notable in the baseline profile are peak watts climbing to 1.7 kW as well as the prolonged on-hours
spanning two days (Wednesday and Thursday). The retrofit profile shows similar peak of 1.8 kW and also
prolonged on-hours this time spanning Thursday. It is likely that the intermittent use of hair dryers
plugged into the mirror lighting circuit is affecting the maximum power draw, while the mirror lighting
use governs the more sustained usage.
A single day profile highlighting both the peaks and the prolonged on-hours is presented in Figure 19.

25
Figure 18. Typical Dressing Room weekly lighting power profiles, baseline incandescent and LED. Data
collected during weeks of 1-27-14 (baseline) and 3-24-14 (LED)
Figure 19. Typical daily Dressing Room makeup mirror lighting profiles, baseline and LED. Data
collected days of 1-28-14 (baseline) and 3-26-14 (LED)
0.0
0.2
0.4
0.6
0.8
1.0
1.2
1.4
1.6
1.8
2.0kW
Dressing Room Makeup Mirror Lighting Weekly Power Profile
Baseline LED
0.0
0.2
0.4
0.6
0.8
1.0
1.2
1.4
kW
Time of Day
Dressing Room Makeup Mirror Lighting Daily Power Profile
Baseline LED
One mirror (8 lamps, LED) left on overnight One mirror (8 lamps,
incandescent) left on overnight
26
The energy impact was estimated using the same two non-vacation periods in the winter and spring of
2014. Based on the data collected, the average energy use in the baseline period was 40 kWh per week
and in the retrofit period was 11 kWh per week. The average net savings from this retrofit was 29 kWh
per week, or 72%.
These savings result from both the reduction in connected lighting wattage and better fixture control
(a dimmer at each mirror). They also may be influenced by connected plug loads, differences in occupant
type, occupancy, general activity between the two periods. The estimated savings potential without
dimming savings or plug load influence is 76%. (Note that in both the “before” case and the “after” case,
one mirror with lights was left on overnight. Occupancy/vacancy sensors, if installed, could be a solution
to reducing that inadvertent usage.)
4.4.2 Questionnaire and Interview Responses
Eleven students responded to the questionnaire before the LED change; sixteen students and one
instructor responded to the final conditions. (Appendix B, Figure B.4) Their ratings of the appearance of
colors and pattern of highlight and shadow on the face improved after the LED retrofit, as did overall
satisfaction with the lighting. The appearance of the LED bulb, even though it exhibited a dark spot on the
“top” of the bulb (Figure 20), was rated higher than the appearance of the conventional incandescent G25
bulb.
One instructor well-versed in the art of theatre makeup and costuming expressed that the light on the
face and body from the LED system was closer to the color quality of halogen light that would be seen on
stage, capable of rendering a wider color spectrum than the incumbent incandescent lamp. The
incandescent mirror lighting, immediately viewable in the adjacent dressing room, produced a more
muted color appearance, possibly due to the reduced short wavelength (“blue”) output of the 130 V
lamps.
Figure 20. Closeup of LED replacement lamp in Dressing Room. Although the dark spot at the end of the
lamp was visible, no users noted that there was a slight appearance difference between the
new and conventional lamps. (Photo: Stan Kaye)

27
4.5 Dance Performance Sidelighting – Illuminance, Color, Energy, and Designer and Audience Feedback
A dance piece was created for comparing halogen and LED sidelighting effects, choreographed by
Richard Rose, an Associate Professor of Dance in the College of Fine Arts. Titled “Herald,” it was a
4-minute piece featuring a solo dancer (Adjunct Professor Isa Garcia-Rose) wearing a flowing white silk
costume. Her continuous dance movements created a swirling effect so that the silk became a soft,
dynamic canvas for dramatic color and shadow. The choreography was a tribute to Loïe Fuller, whose
free-form modern dance style was originally captured by very early Lumière brothers cinematography,
and their film was hand-colored to amaze audiences. This tribute piece was presented to the audience first
in the Fall 2013 BFA Dance Showcase using the sidelighting techniques (Figure 21) with typical halogen
instruments; the lighting design for the performance was completed by student lighting designer Zach
Titterington. The piece was subsequently danced again for the Spring BFA Dance Showcase in 2014,
lighted by the same designer, who strove for the same visual effects, but this time using LED theatrical
instruments.
Figure 21. Sketch of sidelighting technique used for dance performance. The booms and sidelighting
theatrical instruments were concealed from the audience’s view by vertical black panels.
The School of Theatre and Dance had been exploring the use of LED theatrical instruments for a
couple of years, and the GATEWAY study offered an opportunity to try a full-scale trial of two promising
products. In the spring of 2014 the vertical booms that hold the side-lighting instruments were equipped
with a combination of ETC Lustr+ Source 4 units and Philips Selecon PL4 units, 1 of each per boom
(Table 5). The ETC LED unit uses a seven-color system: red, green, blue, indigo, amber, cyan, and white
LEDs in a matrix, combined at the focal point with a diffusing media to unify the emitted color and
aperture appearance. These seven LEDs can be controlled using multiple channel maps, one including
seven channels of color control from the theatrical control board along with one channel for overall
intensity, offering very precise tuning of color. These signals bypass the theatrical dimmer rack since each
channel is dimmed at the PC board in the instrument. The LEDs are plugged into standard uncontrolled
power circuits and then controlled for the performance using a DMX512 protocol (packets of data used as
communication between the fixture and the lighting console).

28
Table 5. Sidelighting products and their performance data
Before
After
Luminaire 1 Luminaire 2
Lamp/luminaire photo
Lamp/luminaire description ETC Source Four 50°
Halogen
ETC Source Four
LED Lustr+ (50°)
Philips Selecon
PLProfile4 LED
(36°)
Quantity 12 6 6
Color characteristics at 120 V (CCT, CRI)
at 100% (halogen) or best LED
spectral mix, per mfr data
3050 K, 99 CRI 3200 K, 84 CRI 3200 K, CRI not
available
Maximum lumen output per mfr’s
photometric data (ETC) or technical
data sheet (Philips Selecon)
12,153 4189 >6000
Max possible watts (measured by
GATEWAY at max output)
575 94 778(a)
(a) Although maximum power draw for this product was measured at 778 W, this operating mode is highly
unlikely. Furthermore, this product is overpowered for this dance sidelighting application, although it worked
well at low levels and can also work for productions where much higher light levels are required.
Similarly, the Philips Selecon unit employs red, blue, green, and a broad-band cool white LED. The
intensity of each of the four LEDs can be varied using a channel of the control board to create a wide
range of colors.
For the incumbent halogen system, twelve of the boom-mounted halogen lights required twelve 20A
dimming circuits to permit individual control of the light intensity. When the halogen lights were replaced
with LED lights, it was expected that all lights could be run on two 20A circuits. However, circuit
breakers were tripping when the sidelights were powered that way, so a total of eight 20A circuits were
ultimately used, a single circuit for each of six Philips Selecon units, plus three ETC units sharing a
circuit on each side of the stage. Compared to the original 575 W halogen lamp used in the ellipsoidal
projector, the ETC LED unit is reported by the manufacturer to draw a maximum of 130 W, although UF
measured a maximum of only 94 W in “full white” mode. Philips Selecon describes its LED units as
drawing a maximum of 600 W, although when programmed for full output of its RGBW channels at the
same time, UF measured the Philips Selecon product’s maximum power draw, with cooling fan, at
778 W. (However, it is unlikely to be operated in that mode.) This unexpectedly high power draw in some
operating modes may have contributed to the tripping of breakers.
Dance Studio G06 contains an electrical closet dedicated to housing two ETC 48-channel portable
dimmer racks, 1.2 kW per dimmer. The cables carrying the dimmed output are run through conduit to a
grid of outlets above a theatrical pipe-grid ceiling, and along walls to power temporary boom-mounted
theatrical instruments for side-lighting of dance performances. The communication protocol to the

29
dimmers is DMX-512. This is how the halogen theatrical instruments had been operated since the
building was constructed.
Once the sidelighting was changed to LED, the power to the instruments was no longer run through
the dimmer rack, and the light console no longer sent a DMX control signal to the dimmer to indicate
output level. Instead, the “intelligent” fixtures were directly powered with 120 V power cords, and the
input voltage remained fixed at 120 V. (Three of the ETC Source 4 Lustr+ were powered together on one
circuit, the remaining three of the ETC LED instruments were powered on a second circuit, and each
Selecon PL4 was powered on an individual power circuit, for a total of 8 circuits.) The DMX-512 signal
was delivered wirelessly (using City Theatrical’s SHoW DMX SHoW Babys) from the light console to a
receiver on each side of the performance floor. The DMX-512 signal was then daisy-chained using wire
from one fixture to the next, providing data exchange down each side of the stage. The data sent to each
fixture provided instructions on how each LED should behave. Each fixture has its own address, and
different fixtures received specific instructions for LED intensity.
Table 6 and Table 7 list the settings for seven of the eight lighting cues used for Herald in both the
fall 2013 performance (halogen) and the spring 2014 performance (LED). (Cue 8 was a blackout setting,
so there was a fade from cue 7 to black over a few seconds. Cue 1 in both cases used predominantly
overhead halogen lighting, with no sidelighting contribution under the LED system, and minimal light
output from the halogen sidelighting system.) Table 8 contains video stills from the “Herald” dance
performance during light cues 1 through 7, with the spectral power distribution plots for the sidelighting
from stage left and right. For each light cue, listed in the left column, the top image is from the fall
performance, lit with traditional halogen ellipsoidal instruments, filtered with colored gels. The bottom
image is from the spring performance, lit with multi-color LED instruments, programmed to project the
desired color rather than using gels to filter out the unwanted wavelengths. The color plots were
normalized to the maximum vertical illuminance measured at the dancer for each cue.
Table 6. Dimmer settings and color gels used at each cue for the halogen theatrical sidelighting
instruments during the fall 2013 performance of “Herald”
Fall 2013 Dance Performance: Lighting Cues
Cue
No.
Stage Left Stage Right
Shin High
Fixture: ETC Source Four
HAL 50°
Head High
Fixture: ETC Source Four
HAL 50°
Shin High
Fixture: ETC Source Four
HAL 50°
Head High
Fixture: ETC Source Four
HAL 50°
1 3% 0% 0% 0%
2 20% 0% 0% 100%
3 15% 0% 75% 100%
4 20% 0% 98% 0%
5 0% 100% 0% 100%
6 45% 30% 0% 100%
7 45% (center only) 0% 100% (center only) 0%
GE
L T
ran
smis
sio
n
Cu
rve
2-CTB (G870+G872)*
Transmission: 72%
Green (L139)
Transmission: 13%
Red (L106)
Transmission: 12%
Blue (G850)
Transmission: 9%
* Spectral transmittance curves are approximate, from comparable Rosco gels.
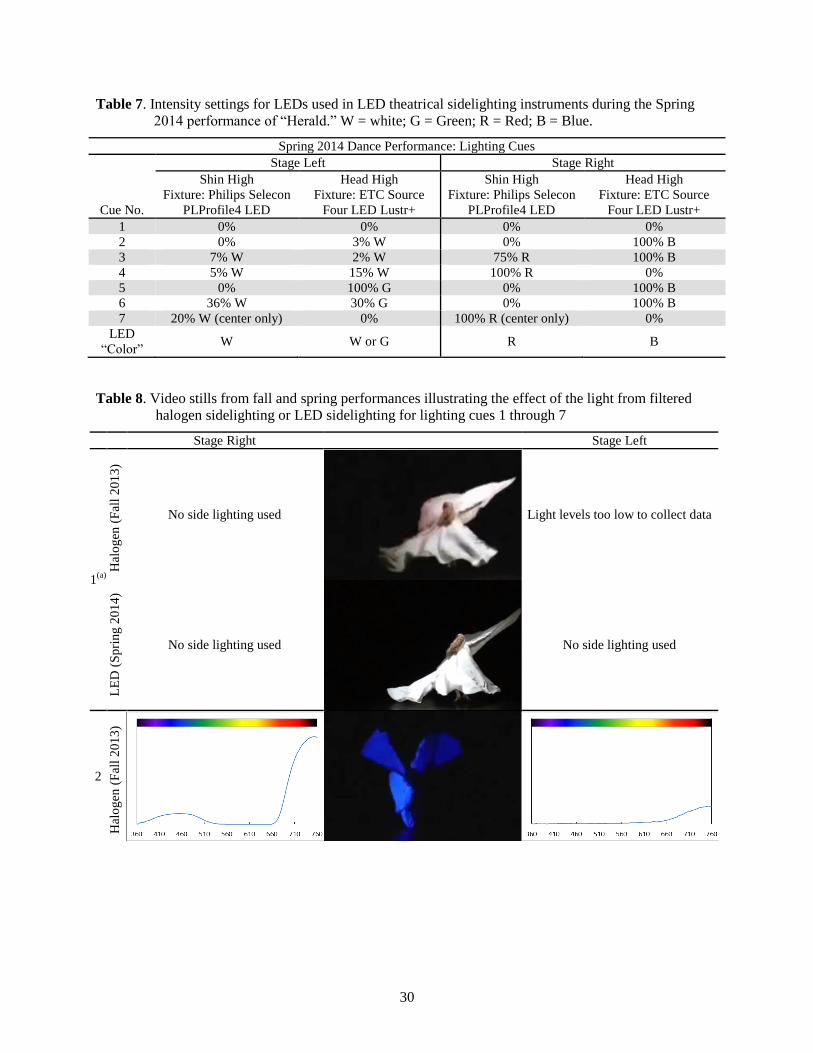
30
Table 7. Intensity settings for LEDs used in LED theatrical sidelighting instruments during the Spring
2014 performance of “Herald.” W = white; G = Green; R = Red; B = Blue.
Spring 2014 Dance Performance: Lighting Cues
Cue No.
Stage Left Stage Right
Shin High
Fixture: Philips Selecon
PLProfile4 LED
Head High
Fixture: ETC Source
Four LED Lustr+
Shin High
Fixture: Philips Selecon
PLProfile4 LED
Head High
Fixture: ETC Source
Four LED Lustr+
1 0% 0% 0% 0%
2 0% 3% W 0% 100% B
3 7% W 2% W 75% R 100% B
4 5% W 15% W 100% R 0%
5 0% 100% G 0% 100% B
6 36% W 30% G 0% 100% B
7 20% W (center only) 0% 100% R (center only) 0%
LED
“Color” W W or G R B
Table 8. Video stills from fall and spring performances illustrating the effect of the light from filtered
halogen sidelighting or LED sidelighting for lighting cues 1 through 7
Stage Right Stage Left
1(a)
Hal
og
en (
Fal
l 2
01
3)
No side lighting used
Light levels too low to collect data
LE
D (
Sp
rin
g 2
014
)
No side lighting used
No side lighting used
2
Hal
og
en (
Fal
l 2
01
3)

31
Stage Right Stage Left L
ED
(S
pri
ng
20
14
)
Light levels too low to collect data
3
Hal
og
en (
Fal
l 2
01
3)
LE
D (
Sp
rin
g 2
014
)
Light levels too low to collect data
4
Hal
og
en (
Fal
l 2
01
3)
LE
D (
Sp
rin
g 2
014
)
5
Hal
og
en (
Fal
l 2
01
3)

32
Stage Right Stage Left L
ED
(
Sp
rin
g 2
01
4)
6
Hal
og
en (
Fal
l 2
01
3)
LE
D (
Sp
rin
g 2
014
)
7
Hal
og
en (
Fal
l 2
01
3)
LE
D (
Sp
rin
g 2
014
)
(a) Cue 1 serves as an example of how the depiction of the lighting through video stills can vary even when the same lighting is
used—the predominant lighting used for the first cue was overhead. Slight differences in appearance can occur because the
dancer may move in different parts of the stage during different performances.
4.5.1 Dance Performance Energy Use
The theatrical lighting used for the Herald dance performance was metered for both the baseline
halogen and the LED technologies. The performance was divided into eight cues—these are the
performance segments to which different sidelighting intensities and/or colors were applied. In the
baseline case, each of the 12 halogen fixtures was metered at the instrument. The LED case had the

33
Philips Selecon products individually circuited and metered, plus two groups of three ETC Source 4 LED
products circuited and metered together. Because the meters had difficulty capturing sufficient power
details during the actual performances, additional benchtop metering of the LED instruments was
completed to verify performance measurements and a higher-than-expected standby power draw of the
LED fixtures. This confirmed the power values collected during the performance.
In both the baseline and retrofit cases, wattage profiles were developed for each theatrical instrument
type and then applied to the eight performance cue settings (dimming percentages and color types). The
resulting energy metrics, power and energy-use profiles, allow for a comparison of the halogen and LED
lighting technologies used for the same dance performance.
Figure 22 presents the power impact for each cue of the Herald performance. Notable in this figure is
the large wattage reduction across the board during the performance. A significant contributor to this
reduction is the ability of the LED fixtures to digitally select and mix LED colors rather than using
colored theatrical gel to subtract out unwanted portions of the lamp spectrum. Also notable in the figure,
specifically at cue 8 where lighting is off, is the standby power draw of the LED fixtures. In this case the
standby draw was approximately 27 W for each Philips Selecon PL4 instrument and 5 W for each ETC
Source 4 Lustr+ instrument.
Figure 23 presents the watt-hour energy use by lighting cue, highlighting the significant energy
savings in comparing the baseline halogen to LED instrument performance. When the energy use is
summed across all eight cues, the baseline halogen system used roughly 83 watt-hours and the LED
performance used about 11 watt-hours, with a savings of 72 watt-hours. While the savings from this
particular performance are small because the piece lasted only 4 minutes, they do represent a total savings
of 87%.
Applied to theatrical performances with longer duration using dozens of lighting instruments, the
energy savings can be substantial. In addition to the energy savings, the LED options contribute far less
heat to the performance space, which is both a savings for air conditioning and a welcome attribute for
most performers.

34
Figure 22. Theatrical instrument wattage by lighting cue as measured at two performances of “Herald,”
the baseline halogen lighting in October 2013, and the LED lighting in April 2014. For the
same color effect, the LED is providing 50% to 90% savings in power. Note that there is
standby power from the LED system even during “blackout” cue 8.
Figure 23. Theatrical sidelighting instrument energy use (watt-hours) by lighting cue measured at two
performances of “Herald.” The baseline halogen instrument energy use was 83 watt-hours,
LED instrument energy use was 11 watt-hours.
0
500
1,000
1,500
2,000
2,500
3,000
3,500
4,000
1 2 3 4 5 6 7 8
Po
wer
Use
(W
)
Performance Cue
Theatrical Instrument Power Draw by Lighting Cue Herald Dance Performance
Baseline
LED
0.0
5.0
10.0
15.0
20.0
25.0
30.0
1 2 3 4 5 6 7 8
Ener
gy U
se (
W-h
r)
Performance Cue
Theatrical Instrument Watt-Hour Use by Performance Cue Herald Dance Performance, April 2014
Baseline
LED
Standby power draw

35
4.5.2 Questionnaire and Interview Responses
There was no meaningful difference in the audience response to Herald before and after the change to
LED sidelighting. (Appendix B, Figure B.5) After the change, the audience responded somewhat more
favorably to questions about the highlight and shadow on the dancer, naturalness of the dancer’s skin,
brightness of the fixtures, and overall quality of the dance performance and production, but the
differences were small. The rating of brightness on the dancer remained neutral, not too bright or too dim.
The color on the costume was rated as saturated in both performances, although there was a slight
increase in audience members rating the color as muted after the change to LED. The very slight
differences in response suggest that the LED sidelights are evoking very similar visual responses from the
audience compared to the original halogen products.
4.6 Summary of Lighting Energy Use and Economics
Figure 24 summarizes the energy use in each of the four spaces, a function of the power drawn,
manual dimming (because the daylight dimming wasn’t yet functional in the dance studio), and the hours
of operation. In the case of the Dance Studio, the LED system achieved significant energy savings
compared to the baseline. The energy savings from the Scene Shop retrofit were much less pronounced
because there was a net wattage increase from the poor-condition baseline system to the new LED system
(with a corresponding significant increase in light levels). The Scene Shop savings that did accrue were
driven by the re-circuiting of an emergency circuit whose baseline lighting was in continuous operation.
One of the highest reductions in lighting wattage, from baseline incandescent lamps to LED retrofit
lamps, was in the Dressing Room where the wattage reduction was 75%. The dressing room average
energy savings was 72%, savings that were influenced by changes in hours of operation and plug load
devices captured on the metered circuits. The final use area, the Acting Studio, reported impressive
energy savings of 68%. Summing the energy use data across the four use areas results in an average
weekly savings of 418 kWh, or a total average savings of 73%.
The weekly energy use for the four architectural spaces was 281 kWh. Assuming 45 weeks per year
of operation, with the four architectural spaces totaling 8164 ft2 in area, this yields an estimated annual
lighting energy density of 1.5 kWh/ft2/yr. This value is considerably lower than the average lighting
energy density for university buildings in the U.S. of 4.0 kWh/ft2/yr.
1
1 Derived from 2003 CBECS Performance Targets Table by Building Type:
http://www.energystar.gov/buildings/sites/default/uploads/tools/2003_CBECSPerformanceTargetsTable.pdf.
Median Site EUI of 104 kBtu/ft2 63% avg electric use × 21% average lighting use of electric load.

36
Figure 24. Summary of energy use (average kilowatt-hours per week) in the four spaces before and after
the change to LED lighting. Theatrical lighting energy use was not included.
Considered on a percentage basis, the LED upgrades for this project provide impressive energy
savings. However, the total project cost was $104,500, including equipment and installation labor—
$79,500 for the architectural lighting, $25,000 for the theatrical lighting. Evaluating just the architectural
lighting, assuming 418 kWh saved per week for an average of 45 weeks operation per year, and a melded
electric rate of $0.10/kWh, the annual electrical energy savings is $1,881. These relatively small savings
would not by themselves justify the installed cost of the upgrades. (Note that UF’s electric rate is below
the national average of $0.11/kWh, so energy cost savings would be higher in most parts of the U.S.)
However, this project was completed as a demonstration of the technology, for a small number of
spaces. There were no quantity discounts, no competitive bids, and no economies of scale for labor costs.
Further, other factors were present that could result in economic benefits. The estimated long life of the
LED products is expected to reduce maintenance costs, especially in these spaces where access is
difficult. LED theatrical lighting can reduce the number of electrical circuits needed for performances,
reduce the cost of the theatrical dimming systems, and possibly even reduce the size of the electrical
service for new theatre buildings. Certainly LEDs will reduce the cost of fluorescent and metal halide
lamp disposal, since they contain no mercury. These factors, combined with the fact that LED products
have dropped in price since this project was begun, make UF more convinced that LED luminaires and
lamps are a viable option.
It is important to note that the University did not undertake these lighting upgrades simply to evaluate
the potential energy savings. As discussed in the next section, the LED systems studied in this project
provided important benefits to the University that are difficult or impossible to include in an economic
217
170
40
142
81
144
11
45
0
50
100
150
200
250
Dance Studio Scene Shop Dressing Room Acting Studio
Ave
rage
kW
h/w
eek
Use Areas
Baseline and LED Energy Use by Use Area
Baseline
LED

37
analysis, but that were considered important components for this upgrade. Desired improvements in
lighting quality, controllability, maintenance, and color properties were as important to the project
stakeholders as reducing the energy use, and in general the LED lighting systems delivered the expected
results in these areas.
5.0 Conclusions
The change to LED lighting brought significant quality improvements to the University of Florida
School of Theatre and Dance. Chief among them was improved controllability, both switching and
dimming, compared to the original metal halide lighting systems located in the Acting Studio and Dance
Studio. Dimming was achieved through a 0-10 V dimming protocol, so additional control wires had to be
run between the dimmer and the luminaires. In these same classrooms, even though power use decreased,
vertical illuminances improved or were maintained, an especially important lighting characteristic for the
Acting Studio and Dance Studio because this makes faces, bodies, expressions, and movements more
visible. Notably, increased vertical illuminances were achieved with no increase in glare.
The daily power logs clearly show that when effective dimming controls became available in the
Acting Studio and Dance Studio, instructors, staff, and students used the dimming to support the activities
in the space, saving energy as they did so. During daylight hours, the dimmability of the LED system
could have allowed photosensor controls to reduce significant lighting load in the daylighted Dance
Studio, although the sensor system was never commissioned and saves no energy in its default control
settings.
LED systems improved color in studio spaces, especially where conventional quartz metal halide was
the incumbent technology. No longer can interviewed staff complain about the greenish cast on dancers’
bodies.
LED replacement lamp samples for the dressing room mirror lights were ordered and tested for color,
flicker, glare, and other criteria before the full order was placed. The intent was to minimize compatibility
issues and disappointing performance. (The samples were not tested for compatibility with a specific
dimmer in advance, and a dimmer incompatibility may be responsible for the audible buzz from the lamps
when in use. It may be wise to look for SSL-7A compatibility between replacement lamps and dimmers
in future installations.) The switch to high color-rendering LED A-lamps for mirror lighting in the
dressing rooms was considered just as good for makeup application (if not better) than the conventional
incandescent lamps. Although the 90+ CRI lamps were less efficacious (using 8.5 W instead of the 6 W
used by the 80 CRI lamp option from the same manufacturer), the lamps have reduced power by more
than 75% and still deliver halogen-quality light. Furthermore, the LED lamps are dimmable, enabling
performers to select a comfortable level of light for their makeup needs. The LED lamps also deliver 75%
less heat to the face and space.
Linear LED luminaires installed in the Scene Shop were tested for flicker during a mockup phase,
including at different levels of dimming, to ensure there would be no potentially hazardous stroboscopic
interaction between lighting and moving machinery. No flicker or stroboscopic effect was detected with
the installed product.

38
New theatrical technology separates intensity control from color control, and this is being embraced
by a generation of lighting designers. Digital control is an attractive technology, but the transition from
tungsten to LED may take some experience until the color implications are fully understood and applied.
There are different LED theatrical instrument offerings, some with a selection of multiple narrow-band
color LEDs, and some with a mix of narrow band LEDs and broader-band white LEDs. The former may
be better for dramatic color effects; the latter may be better for naturalistic rendering of skin tones. Either
way, the LED technology reduces power consumption by 50% to 90% compared to the power required to
achieve saturated colors with tungsten halogen instruments equipped with colored gel.
Each LED theatrical instrument has an internal controller board (computer) and must be prepared to
accept control instructions. Consequently, the instruments draw power in standby mode, ranging from 5
to 27 W in the fixtures used in the UF dance performance. This standby power needs to be factored into
the energy used in theatrical productions. Even though one fixture can replace eight or more tungsten
instruments because of its color-changing features, control consoles and theatrical systems should have
provisions to ensure power is switched off promptly when the performance is complete. (One additional
consideration of theatrical instruments with on-board computers is that theatrical spaces will need to be
designed and built like “computer rooms,” with dust and heat carefully controlled to maintain reliability
and prolong life.)
Excellent installation coordination with the contractor by the university facilities group minimized
muss and fuss of construction, and also minimized construction time and the need to find alternative
spaces for classes during the academic semester.
Overall, the switch to LED lighting improved lighting quality in the four architectural spaces, due to a
wise choice of products and luminaire light distributions. GATEWAY’s energy metering showed an
average weekly savings of 418 kWh, or a total average savings of 73% in the four spaces. Perhaps more
importantly, as a graduate student in lighting said:
No matter what the numbers on savings show, what is important is the design and layout
of the lighting. If the lighting is not properly laid out in the space, there will be no
qualitative reason to switch over and save energy. All of the qualitative research here
opened my eyes to looking at more than the wattage and power draw. Glare, brightness,
light spread, and color quality are all more important than wattage to me. This is why I
find the scene shop is so successful. Even though the energy savings were not huge, the
overall evenness and brightness of the space made it all worth it in the end. The room
looks 1000 times better, though the energy results do not show that 1000 fold change.
6.0 Lessons Learned
The University of Florida’s Nadine McGuire Theatre and Dance Pavilion GATEWAY project
produced many useful lessons:
Communicate and cooperate. Collaboration among the university facilities group; department
administrators, design faculty, and students; construction contractors; luminaire manufacturers; and
the electric utility yielded excellent results. They communicated their goals and worked as a team to

39
accomplish them, and the results of the LED installations were inspiring examples for the entire UF
campus.
LEDs can be excellent solutions in high-ceiling educational spaces. Metal halide lighting can
exhibit restrike problems, controllability, audible noise, and frequent relamping needs. Older
fluorescent luminaires also have only moderate lamp life and limited dimmability, requiring frequent
maintenance for safe use of machinery and offering no ability to reduce light levels to a bare
minimum when the space is unoccupied. LED luminaires may solve many lighting problems in these
applications.
Mockups help with wise product selection and layouts. Most people have difficulty visualizing
lighting effects, light levels, glare, color quality, and flicker, especially when there is a relatively new
light source involved. Plus, there are few effective metrics that manufacturers can report for flicker
and glare. A mockup of one or more luminaire of each type in the target space can alleviate concerns
and set reasonable expectations of performance.
Manual dimmers not only reduce lighting energy use, but improve functionality of classrooms
and buildings. Academic buildings need flexible spaces because they accommodate so many
different kinds of subject matter, styles of teaching and learning, and ages and needs of students.
Students and instructors use dimming options as a teaching tool to change mood, activity level, and
focus.
Photosensors and dimming drivers or ballasts can dramatically reduce energy use in academic
rooms with significant window area, but only if commissioned properly. Photosensor system
settings are not necessarily intuitive, especially when there are multiple instruction sheets to read and
interpret. Often the contractor leaves the setting of light levels, setpoints, etc. to the client, who is
unaware that this step need be taken or is unable to attend quickly to the commissioning because of
more urgent priorities. Self-commissioning controls or commissioning protocols that do not involve
nighttime visits, multiple lighting measurements, and complicated settings may be more reliably
implemented.
Vampire power in LED theatrical instruments could be responsible for significant energy use if
not switched off at the conclusion of a performance. LED theatrical instruments require power for
built-in circuits that listen for instructions. In this study, the LED theatrical instruments each drew 5
to 27 W in standby mode.
LED theatrical lighting offers power savings. LED theatrical instruments with multiple-color LEDs
reduce power use significantly, from 50% to 90%, compared to halogen instruments with filtered with
color gels. Adding one or more white LEDs to the mix can improve color rendering of skin tones
considerably, compared to RGB or similar color-only combinations.
Uniformity of workplane and vertical illuminance is important in classrooms and studios.
Where facial features and body movements need to be visible, gradients of light across the workplane
should be soft, with no pools of light or abrupt changes from light to dark. Similarly, vertical
illuminances should not vary widely, or a face will disappear and reappear as it moves across the
space through light and shadow.
LEDs can reduce maintenance issues. In spaces that are difficult to access because of tall ceilings,
equipment in the way of ladders and lifts, etc., the long lifetime of LEDs is expected to improve the
lighting function and appearance over time.

40
Taking the bold step of trying LED lighting and learning from the experience is perhaps the greatest
lesson for the university.

A.1
Appendix A
Sample Questionnaire for Users of the Actor Studio and Dressing Room, and Audience Members for the Dance
Performance
Note: Dance Studio and Scene Shop questionnaires are similar; therefore, only the Actor Studio
questionnaire is provided here.


B.1
Appendix B
Questionnaire Results
The following figures summarize the results of questionnaires administered in fall 2013 and spring
2014, before and after the lighting retrofit. Questionnaires were completed during the performance of
“Herald” and also in the classes that use the retrofit spaces. Some participants did not answer every
question, which is why the total percentage of responses is less than 100%. The left side of the figure
denotes EX as the existing condition (i.e., fall semester), and LED as the changed condition for each
question. The questionnaire questions are listed on the right side.
Some questions had a limited number of participants, and the number of participants varied greatly
for some of the questions between the fall and spring semesters. Also, some respondents may have
confused the meaning of “cool” and “warm” light appearance, thinking that this was related to thermal
temperature.

B.2
Figure B.1. Acting Studio – Student and Instructor Response to Questionnaire

B.3
Figure B.2. Dance Studio: Practice – Student Response to Questionnaire

B.4
Figure B.3. Scene Shop – Student and Instructor Response to Questionnaire

B.5
Figure B.4. Dressing Room – Student and Instructor Response to Questionnaire

B.6
Figure B.5. Dance Studio: Herald Performance – Audience Response to Questionnaire

C.1
Appendix C
Input Data for Dance Studio Room Lighting Calculations
The input values for AGI 32 calculation model for the Dance Studio are as follows:
83 ft × 50 ft × 20 ft (l × w × h)
Ceiling, wall, and floor reflectance values are 5% (black, for performance)
Luminaires mounted at 17 ft above finished floor
Lamp
Output
(lm)
Luminaire
Output
(lm)
Luminaire Input
Power
(W)
Efficiency
(%)
Lamp Lumen
Depreciation
Daybrite LBN 17337
(MH) (a)
31,000 23,560 368 76% 0.58 at 8000 hr
GE Edge-Lit EL-04-x-
a3-x-whte (LED) N/A 6400 72 100%
0.925 at 25,000
hr(b)
(a) GE MH:
http://genet.gelighting.com/LightProducts/Dispatcher?REQUEST=COMMERCIALSPECPAGE&PRODUCTC
ODE=27501
(b) GE LED: http://www.gelighting.com/LightingWeb/na/images/ind070-ge-lumination-led-el-series-suspended-
luminaire-data-sheet_tcm201-54012.pdf