lecture19 keynesianpolicyanalysis …nwilliam/econ702_files/lect19-15.pdflecture19...
TRANSCRIPT

Lecture 19Keynesian Policy Analysis
Monetary Policy
Noah Williams
University of Wisconsin - Madison
Economics 312/702
Williams Economics 312/702

Real Wage Rigidities
Beyond nominal price or wage rigidities, there are alsomodels where the real wage itself is rigid. The primeexample is the efficiency wage model due to Shapiro andStiglitz (1984).Effort put forth by worker depends on wage e(w). Effort isnot directly observable by employers.Workers who feel well treated will work harder and moreefficiently: “the carrot”.Workers who are well paid won’t risk losing their jobs bybeing caught shirking: “the stick”.e(w) is S-shaped: increases in w, flattens out at high w.
Williams Economics 312/702

Copyright © 2005 Pearson Addison-Wesley. All rights reserved. 16-19
Figure 16.17 Effort of the Worker as a Function of His or Her Wage
Williams Economics 312/702

Efficiency Wages
Firms take as given effort curve. Problem now:
maxN
F(K , e(w)N )− wN
First order condition: e(w)FN (K , e(w)N ) = w. Gives firmlabor demand for any real wage.But how to choose wage to set? Want to minimize cost ofinducing effort. Choose efficiency wage to maximizee(w)/w.
maxw
e(w)/w ⇒ w = e(w)/e′(w)
Note the real wage is then rigid. Changes in labor supplythen only affect level of unemployment, not employment.No downward pressure on wages with excess labor supply,since if firms reduce wages effort will decline.
Williams Economics 312/702

Copyright © 2005 Pearson Addison-Wesley. All rights reserved. 16-22
Figure 16.20 Determination of the Efficiency Wage
Williams Economics 312/702
Implications of Real Wage Rigidity
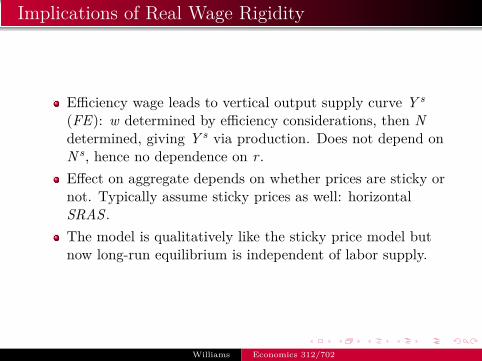
Efficiency wage leads to vertical output supply curve Y s
(FE): w determined by efficiency considerations, then Ndetermined, giving Y s via production. Does not depend onN s, hence no dependence on r .Effect on aggregate depends on whether prices are sticky ornot. Typically assume sticky prices as well: horizontalSRAS .The model is qualitatively like the sticky price model butnow long-run equilibrium is independent of labor supply.
Williams Economics 312/702

Copyright © 2005 Pearson Addison-Wesley. All rights reserved. 16-23
Figure 16.21 Unemployment in the Efficiency Wage Model
Williams Economics 312/702

Copyright © 2005 Pearson Addison-Wesley. All rights reserved. 16-24
Figure 16.22 The Output Supply Curve in the Efficiency Wage Model
Williams Economics 312/702

LMIS
Y
r
Long-run equilibrium in the Keynesian Model:Efficiency wages
FE
r*
Y*
Williams Economics 312/702

Effects of Fiscal Policy
Increase in government spending: Shifts the IS curve out.In short run, Y and r interest rate increase.The multiplier mg = ∆Y
∆G gives the increase in output dueto government spending.Much original Keynesian theory thought mg > 1.Government spending leads to higher private output.With efficiency wages, FE line unaffected. Labor supplyonly determines unemployment.As prices adjust, LM curve shifts up. New generalequilibrium has higher r , same Y .
Williams Economics 312/702

LM(P)IS
Y
r
Short-run Effect of Increase in Govt Spending
FE
G increase
IS’
r’
r*
Y* Y’
Williams Economics 312/702

IS
Y
r
Long-run Effect of Increase in Govt Spending
FE
G increase
IS’
LM(P’)
P increaseLM(P)
r’
r*
Y* Y’
Williams Economics 312/702

Effects of Monetary Policy
Increase in money supply: not neutral in short run. ShiftsLM curve out, increasing Y decreasing r .Shifts AD curve out. Effect on prices depends on whetherthey’re sticky or not.With sticky prices no effect on price. With sticky wages,price level increases, shifting LM curve part of way back in.In long run, prices or nominal wages adjust, shifting LMcurve and SRAS curve. Y decreases and r increases tooriginal levels.Short-run non-neutralities lead to role of monetary policyin smoothing responses to shocks: stabilization policy.
Williams Economics 312/702

LM(P)
IS
Y
r
Short-run Effect of Increase in Money Supply
FE LM’(P)
M increase
r*r’
Y* Y’
Williams Economics 312/702

LM(P)=LM(P’)
IS
Y
r
Long-run Effect of Increase in Money Supply:Money is neutral in the long-run.
FE LM’(P)
M increase
P increase
r*r’
Y* Y’
Williams Economics 312/702

Stabilization Policy
Classical theory gave no role for government to offsetshocks. At best, government policy was neutral.In Keynesian model, since markets may be out ofequilibrium in the short run, role for government to smoothfluctuations.Example: Reduction in investment demand shifts the IScurve down. Keynes’s “animal spirits”. Causes recession inshort run.If government does nothing, price level will eventuallydecline, shifting LM . Output decline will endure for awhile.Govt. could increase M , shifting LM curve down to generalequilibrium. Same as doing nothing but happens faster.Govt. could increase G, shifting IS curve back up.Taking policy action has potential benefit of shorteningrecession. Leads to higher price level than if no action.
Williams Economics 312/702

IS’
Y
r FE
Shock
ISLM(P)
r*
r’
Y’ Y*
Short-run Effect of Shock to IS Curve
Williams Economics 312/702

LM(P)IS’
Y
r
Response to Shock: Nothing or Monetary Policy
FE
Shock
IS LM(P’)
P fall or M increase
r*r’r*’
Y’ Y*
Williams Economics 312/702

IS’
Y
r
Response to Shock: Fiscal Policy
FE
Shock
ISLM(P)
G increase
r*
r’
Y’ Y*
Williams Economics 312/702

ADP
P* SRAS
LRASAD’Shock
Y*Y’ Y
Effect of the IS Shock: AD-AS
Williams Economics 312/702

ADP
P* SRAS
LRASAD’
SRAS’P’
P adjusts
Shock
Y*Y’ Y
Effect of the IS Shock: Nothing
Williams Economics 312/702

ADP
P* SRAS
LRASAD’Shock
M or G increase
Y*Y’ Y
Effect of the IS Shock: Monetary or Fiscal Policy
Williams Economics 312/702

Limitations on Stabilization & Liquidity Traps
Generally have monetary policy smooth cyclicalfluctuations. Fiscal policy takes longer to implement,money is more direct.Limitation on monetary policy: nominal interest rates arebounded at zero. Can’t set nominal interest rates negative:everyone would want to borrow.Means LM curve very flat near zero interest rates. Soincreases in money supply have little effect at low rates: aliquidity trap.Very relevant for many economies: Japan, US, Europe.From 1960 to 1990, Japan’s economy grew over 6% peryear. But the Japanese economy slumped in the 1990s,with growth near zero. Stock and land prices fell fromexcessive levels, hurting banks. Banks’ financial distresscaused lending to fall, reducing investment.
Williams Economics 312/702

Growth in Interest Rates in Japan
1994 1996 1998 2000 2002 2004−4
−2
0
2
4
Japan: Annualized Growth of Real GDP, 1993−2004
1994 1996 1998 2000 2002 20040
0.5
1
1.5
2
2.5
3
3.5Japan: Money Market Inerest Rate, 1993−2004
Williams Economics 312/702

IS’r=R FE
r*
A Liquidity Trap: Increase in M Powerless
Y’
Shock
ISLM(P)
0
Y*
Williams Economics 312/702

Policy in a Liquidity Trap
Interest rates near zero and remained there. Low inflationor even deflation, so real rates also near zero.Possible to run expansionary fiscal policy to shift IS curveto restore equilibrium.Was tried but unsuccessful – some say it wasn’t enough. Incombination with expansionaryProblem with monetary policy is zero (expected) inflation.If could engineer an inflation, then possible to haveequilibrium with negative real rates but positive nominal(Krugman).Also no reason to force households to consume.Not clear how to commit to it – most central banks likeBank of Japan known inflation fighter. Possible to do so bydepreciating currency (Svensson).
Williams Economics 312/702

IS’r=R FE
r*
A Liquidity Trap: Fiscal Policy
Y’
Shock
ISLM(P)
0
G increase
Y*
Williams Economics 312/702

IS’r
Y’
FE
Y*
r*
Shock
ISLM
0
LM’
r’<0
R=r+i
i
0
A Liquidity Trap: Increase Inflation
Williams Economics 312/702

US Policy Recently
Fed has recently raised interest rates after having keptthem at near zero for extended period of time.Fed has also backed away from explicit short-term inflationtarget, seeming to be willing to allow inflation to rise inshort run. Has stressed that 2% inflation target is for the“medium term”.Fed has become more explicit recently, announcing forecastpaths for future interest rates. (Dot plots)All of these steps geared toward guiding expectations, andcommitting to allowing inflation to rise. Inflation hasremained low, but success of policy would require low rateseven when inflation picks up. Given dissent on Board, inpress, profession, not clear this would happen.Others have argued that Fed should raise inflation targetas long as economy remains below trend growth. Potentialproblem on how to reduce inflation once it takes hold.
Williams Economics 312/702

The Federal Reserve System
Monetary policy in US administered by the FederalReserve. Leadership of the Fed is provided by the Board ofGovernors in Washington, D.C.7 governors, appointed by the President, and have 14-yearterms. Chairman of the Board of Governors hasconsiderable power, and has a term of 4 years.Monetary policy decisions are made by the Federal OpenMarket Committee (FOMC): consists of the 7 governorsplus 5 presidents of the Federal Reserve Banks on arotating basis (with the New York president always on).FOMC meets eight times a year, may meet more.
Williams Economics 312/702

The Twelve Federal Reserve DistrictsAddresses andphone numbersBanksBranches
BostonNew YorkPhiladelphiaClevelandRichmondAtlantaChicagoSt. LouisMinneapolisKansas CityDallasSan FranciscoBoard
The Federal Reserve officially identifies Districts by number and Reserve Bank city.In the 12th District, the Seattle Branch serves Alaska, and the San Francisco Bank serves Hawaii. The System servescommonwealths and territories as follows: the New York Bank serves the Commonwealth of Puerto Rico and the U.S. VirginIslands; the San Francisco Bank serves American Samoa, Guam, and the Commonwealth of the Northern Mariana Islands. TheBoard of Governors revised the branch boundaries of the System in February 1996.
Home | About the FedAccessibility | Contact usLast update: December 13, 2005
FRB: Federal Reserve Districts and Banks http://www.federalreserve.gov/otherfrb.htm
1 of 1 4/21/2009 4:14 PM
Williams Economics 312/702

Fed Balance Sheet
Traditionally, largest asset was holdings of Treasurysecurities, also owns gold, makes loans to banks, and holdsother assets including foreign exchange and federal agencysecurities.Largest liability is currency outstanding. Another liabilityis deposits by banks.Fed makes profit on security portfolio, which it pays toTreasury. In 2015 transferred $97.7 billion to Treasury.In response to financial crisis and recession of 2007-present,balance sheet of Fed has expanded to include wide array ofassets, direct bank lending, and mortgage-backed securities.
Williams Economics 312/702

Williams Economics 312/702
Fed Policy Instrument
Main instrument of conventional policy is the FederalFunds rate. An extremely short-term interest rate: the rateon overnight loans from one bank to another.Uses as implicit means of changing money supply. Policycarried out via open market operations by trading desk atNew York Fed. Buy and sell government securities so thatmarket for overnight cash clears at the target rate.Again in response to recent crisis and recession, directlending and other purchases of assets have become animportant component of policy response. “Unconventional”monetary policy.
Williams Economics 312/702

Federal Funds Rate and Discount Rate
Williams Economics 312/702

Other Policy Instruments
Also can adjust reserve requirements, minimum fraction ofeach type of deposit that a bank must hold as reserves.Discount window lending: lending reserves to banks so theycan meet depositors’ demands or reserve requirements,interest rate on such called the discount rate, role of lenderof last resort.A discount loan increases the monetary base, increases indiscount rate discourage borrowing, reduce the monetarybase.In past, Fed discouraged banks from borrowing from thediscount window. Instead, banks borrow from each other inthe Federal funds market. Interest rate is the Fed fundsrate. In recent years has encouraged discount windowborrowing.
Williams Economics 312/702

1 Discount Window includes primary, secondary and seasonal credit programs.2 The PDCF, TSLF and AMLF will remain in operation through April 30, 2009 as announced on December 2, 2008.3 ECB and SNB created December 12, 2007; BOC, BOE, and BOJ created September 18, 2008; RBA, Sveriges Riksbank, DNB, and Norges Bank created September 24, 2008; Reserve Bank of New Zealand created October 28, 2008; Banco Central do Brazil, Banco de Mexico, Bank of Korea, and Monetary Authority of Singapore created October 29, 20084 TOP auctions are sales of options granting the right to enter into TSLF borrowing.5 The TALF is expected to go live around February 2009. The Federal Reserve reserves the right to review and make adjustments to these terms and conditions – including size of program, pricing, loan maturity, and asset and borrower eligibility requirements – consistent with the policy objectives of the TALF.
6 Through the CPFF the FRBNY provides financing to an SPV that purchases eligible three-month unsecured and asset-backed commercial paper from eligible issuers.7 Through the MMIFF the FRBNY will provide senior secured funding to a series of private sector SPVs to finance the purchase of certain money market instruments from eligible investors.8 Reverse repos are collateralized with U.S. Treasuries.9 PDCF and TSLF collateral expanded on September 14, 2008.10 Includes non-U.S. dollar denominated securities.11 Includes auto loans, student loans, credit card loans, or small business loans guaranteed by the U.S. SBA12 Open market operations are authorized for terms of up to 65 business days.
13 28-day and 84-day terms may vary slightly to account for maturity dates that fall on Bank holidays.14 Primary credit loans are generally overnight. Loans may be granted for term beyond a few weeks to small banks, subject to additional administration. 15 Maximum maturity of term increased from overnight to 30 days on August 17, 2007, and to 90 days on March 16, 2008.16 Foward selling TAF auctions announced on September 29, 2008 will be conducted in November with terms targeted to provide funding over year-end.17 Loans are targeted to span potentially stressed financing dates, such as quarter-ends.18 TOP auctions may be conducted on multiple dates for a single loan and may be conducted well in advance of a loan period. 19 Data only available on days when operations are conducted.20 Data published on Thursday, as of close of business on Wednesday.
Federal Reserve Bank of New YorkDecember 2008
Discount Window1
Securities Lending
Depository institutions
Primary credit-eligible depository institutions
Primary credit-eligible depository institutions Primary dealers Primary dealers
Forms of Federal Reserve Lending to Financial Institutions
Full range of Discount Window
collateral U.S. Treasuries
No (loans are bond-for-bond)
No (loans are bond-for-bond)Yes Yes Yes
Yes Yes No N/A No
All All
FRBNY FRBNY
As requested(standing facility)
Every other week,or as necessary16 Daily
Schedule 1: Every other week
Schedule 2: Weekly
Funds Funds Funds U.S. Treasuries U.S. Treasuries
Typically overnight, but up to
several weeks14
Up to 90 days15 28 days or 84 days13,16 Overnight 28 days13
All
Regular OMOs
Single-TrancheOMO Program
Who can participate? Primary dealers Primary dealers
What collateral can be pledged?
Is there a reserve impact?
U.S. Treasuries, agencies,
agency MBS, but typically agency MBS
Yes Yes
What is the term of loan?
Typically, term is overnight–14 days12
Is prepayment allowed if term is greater than
overnight?
No No
Which Reserve Banks conduct
operations?FRBNY FRBNY
How frequently is the program
accessed?
Typically once or more daily
Typically weekly
What are they borrowing? Funds
28 days13
(announced March 7, 2008)
Term DiscountWindow Program
(announcedAugust 17, 2007)
Term AuctionFacility
(announcedDecember 12, 2007)
Term SecuritiesLending Facility
(announcedMarch 11, 2008)2
(announced March 16, 2008)2
Primary dealers
Funds
Full range of tri-party repo
system collateral9,10
Yes
Overnight
N/A
FRBNY
Primary Dealer Credit Facility
Full range of Discount Window
collateral
Full range of Discount Window
collateral
Schedule 1: U.S. Treasuries, agencies, agency MBS
Schedule 2: Schedule 1 plus all
invesment grade debt securities9
Where are statistics reported
publicly?
H.4.1 - Factors Affecting Reserve
Balances20
Securities lending activity
TemporaryOMO activity19
Temporary OMO activity19
H.4.1 - Factors Affecting Reserve
Balances20
H.4.1 - Factors Affecting Reserve
Balances20
Term securities lending facility
activity19
Primary dealers
No (loans are bond-for-bond)
U.S. Treasuries
Schedule 2 TSLF collateral
Typically 2 weeks or less17
No
FRBNY
As necessary18
Term SecuritiesLending Facility
Options Program4
(announcedJuly 30, 2008)
Term securitieslending facilty
options programactivity19
(announcedSeptember 21, 2008)
U.S. and London broker-dealer subsidiaries of
Goldman Sachs, Morgan Stanley, Merrill Lynch
Funds
Full range of Discount Window
collateral and tri-party repo system collateral10
Yes
Overnight
N/A
FRBNY
H.4.1 - Factors Affecting Reserve
Balances20
Transitional Credit Extensions
As requested(standing facility)
As requested(standing facility)
As requested(standing facility)
Yes
Funds
First-tier ABCP
ABCP maturity date(270-day maximum)
No
FRB Boston
Despository institutions, bank holding companies,
U.S. branches and agencies of foreign banks
H.4.1 - Factors Affecting Reserve
Balances20
ABCP Money Market Fund
Liquidity Facility(announced
September 19, 2008)2
As requested(standing facility)
TAF Activity19
Funds
U.S. Treasuries, agencies,
agency MBS8
Eligible CP issuers6 Eligible Money Market
Mutual Funds7
FundsFunds and
subordinated note
Newly issued 3-month unsecured and asset-
backed CP from eligible U.S. issuers
U.S. dollar-denominated certificates of deposit, bank notes and commercial paper
issued by highly rated financial institutions
3 months N/A
N/A
FRBNY FRBNY
N/A
Yes Yes
U.S. Dollars
Central banks pledge foreign currency and lend against
eligible collateral in their jurisdiction
Yes
Overnight to 3 months
No
FRBNY
Typically on schedule with FRBNY TAF auctions or as requested
by central banks
Select central banks to lend on to banks in their jurisdiction3
Reciprocal Currency Arrangements
Commercial Paper Funding Facility
Money Market Investing Funding
Facility(announced
October 21, 2008)
As requested(standing facility)
As requested(standing facility)
H.4.1 - Factors Affecting Reserve
Balances20
H.4.1 - Factors Affecting Reserve
Balances20
H.4.1 - Factors Affecting Reserve
Balances20
(first announced December 12, 2007)3
(announced October 7, 2008)
All U.S. persons that own eligible collateral
Funds
Recently originated U.S. dollar-denominated
AAA ABS11
At least one year
Yes
FRBNY
Yes
Term Asset-Backed Securities Loan
Facility5
(announced November 25, 2008)
Monthly
TALF activity19
Williams Economics 312/702

Policy Decisions and Conduct
FOMC meets 8 times per year to set target rate.Directives from Congress to pursue price stability and fullemployment.Prior to meetings intensive staff briefings, laying out policyoptions, scenarios, and likely effects.For many years the Fed resisted committing to an explicitinflation target. Now explicitly 2%. Many other centralbanks around the world explicitly announce inflationtargets, target interest rate paths.
Williams Economics 312/702

Release Date: March 16, 2016
For release at 2:00 p.m. EDT
Information received since the Federal Open Market Committee met in January suggests thateconomic activity has been expanding at a moderate pace despite the global economic and financialdevelopments of recent months. Household spending has been increasing at a moderate rate, and thehousing sector has improved further; however, business fixed investment and net exports have beensoft. A range of recent indicators, including strong job gains, points to additional strengthening ofthe labor market. Inflation picked up in recent months; however, it continued to run below theCommittee's 2 percent longer-run objective, partly reflecting declines in energy prices and in pricesof non-energy imports. Market-based measures of inflation compensation remain low; survey-basedmeasures of longer-term inflation expectations are little changed, on balance, in recent months.
Consistent with its statutory mandate, the Committee seeks to foster maximum employment andprice stability. The Committee currently expects that, with gradual adjustments in the stance ofmonetary policy, economic activity will expand at a moderate pace and labor market indicators willcontinue to strengthen. However, global economic and financial developments continue to poserisks. Inflation is expected to remain low in the near term, in part because of earlier declines inenergy prices, but to rise to 2 percent over the medium term as the transitory effects of declines inenergy and import prices dissipate and the labor market strengthens further. The Committeecontinues to monitor inflation developments closely.
Against this backdrop, the Committee decided to maintain the target range for the federal funds rateat 1/4 to 1/2 percent. The stance of monetary policy remains accommodative, thereby supportingfurther improvement in labor market conditions and a return to 2 percent inflation.
In determining the timing and size of future adjustments to the target range for the federal fundsrate, the Committee will assess realized and expected economic conditions relative to its objectivesof maximum employment and 2 percent inflation. This assessment will take into account a widerange of information, including measures of labor market conditions, indicators of inflationpressures and inflation expectations, and readings on financial and international developments. Inlight of the current shortfall of inflation from 2 percent, the Committee will carefully monitor actualand expected progress toward its inflation goal. The Committee expects that economic conditionswill evolve in a manner that will warrant only gradual increases in the federal funds rate; the federalfunds rate is likely to remain, for some time, below levels that are expected to prevail in the longerrun. However, the actual path of the federal funds rate will depend on the economic outlook asinformed by incoming data.
The Committee is maintaining its existing policy of reinvesting principal payments from its holdings
Printer Version - Board of Governors of the Federal Reserve System https://www.federalreserve.gov/newsevents/press/monetary/20160316a.htm
1 of 2 3/30/2016 2:58 PM
Williams Economics 312/702

Press Release
Release Date: December 16, 2008
For immediate release
The Federal Open Market Committee decided today to establish a target range for the federal fundsrate of 0 to 1/4 percent.
Since the Committee's last meeting, labor market conditions have deteriorated, and the available dataindicate that consumer spending, business investment, and industrial production have declined. Financial markets remain quite strained and credit conditions tight. Overall, the outlook foreconomic activity has weakened further.
Meanwhile, inflationary pressures have diminished appreciably. In light of the declines in the pricesof energy and other commodities and the weaker prospects for economic activity, the Committeeexpects inflation to moderate further in coming quarters.
The Federal Reserve will employ all available tools to promote the resumption of sustainableeconomic growth and to preserve price stability. In particular, the Committee anticipates that weakeconomic conditions are likely to warrant exceptionally low levels of the federal funds rate for sometime.
The focus of the Committee's policy going forward will be to support the functioning of financialmarkets and stimulate the economy through open market operations and other measures that sustainthe size of the Federal Reserve's balance sheet at a high level. As previously announced, over thenext few quarters the Federal Reserve will purchase large quantities of agency debt and mortgage-backed securities to provide support to the mortgage and housing markets, and it stands ready toexpand its purchases of agency debt and mortgage-backed securities as conditions warrant. TheCommittee is also evaluating the potential benefits of purchasing longer-term Treasury securities. Early next year, the Federal Reserve will also implement the Term Asset-Backed Securities LoanFacility to facilitate the extension of credit to households and small businesses. The Federal Reservewill continue to consider ways of using its balance sheet to further support credit markets andeconomic activity.
Voting for the FOMC monetary policy action were: Ben S. Bernanke, Chairman; Christine M.Cumming; Elizabeth A. Duke; Richard W. Fisher; Donald L. Kohn; Randall S. Kroszner; SandraPianalto; Charles I. Plosser; Gary H. Stern; and Kevin M. Warsh.
In a related action, the Board of Governors unanimously approved a 75-basis-point decrease in thediscount rate to 1/2 percent. In taking this action, the Board approved the requests submitted by theBoards of Directors of the Federal Reserve Banks of New York, Cleveland, Richmond, Atlanta,Minneapolis, and San Francisco. The Board also established interest rates on required and excessreserve balances of 1/4 percent.
Printer Version - Board of Governors of the Federal Reserve System http://www.federalreserve.gov/newsevents/press/monetary/20081216b.htm
1 of 1 4/21/2009 4:36 PM
Williams Economics 312/702

Chart 1.9a Projected key policy rate inthebaseline scenario with fan chart. Per cent.
Quarterly figures. 05 Q1 – 10 Q4
0123456789
2005 2006 2007 2008 2009 20100123456789
-2
-1
0
1
2
3
4
2005 2006 2007 2008 2009 2010-2
-1
0
1
2
3
4
-1
0
1
2
3
4
2005 2006 2007 2008 2009 2010-1
0
1
2
3
4
0
1
2
3
4
2005 2006 2007 2008 2009 20100
1
2
3
4
Chart 1.9b Estimated output gap in the baseline scenario with fan chart. Per cent. Quarterly figures. 05 Q1 – 10 Q4
Chart 1.9c Projected CPI in the baseline scenario with fan chart. 4-quarter change. Per cent. Quarterly figures. 05 Q1 – 10 Q4
Chart 1.9d Projected CPI-ATE in the baseline scenario with fan chart. 4-quarter change. Per cent. Quarterly
figures. 05 Q1 – 10 Q4
From the Norges Bank Inflation Report, 1/07
Williams Economics 312/702

Chart 3 Key policy rate in the baseline scenario in IR 3/06 with fan chart and key policy rate in
the baseline scenario in MPR 1/07 (red line). Per cent. Quarterly figures. 04 Q1 – 09 Q4
0123456789
2004 2005 2006 2007 2008 20090123456789
30% 50% 70% 90%
Source: Norges Bank
Chart 5 Key policy rate in the baseline scenario in IR 3/06 with fan chart and the isolated effect of stronger krone exchange rate (red line). Per cent. Quarterly figures. 04 Q1 – 09 Q4
0123456789
2004 2005 2006 2007 2008 20090123456789
Williams Economics 312/702