lecture #4: principles and absorption - mit opencourseware · paradigm for pharmacokinetics and...
TRANSCRIPT
20.201 Mechanisms of Drug Action
Lecture #4: Principles and Absorption
September 13 and 18, 2013
1

Paradigm for pharmacokinetics and pharmacodynamics
Metabolism
Excretion
Absorption
DistributionEntry
ResponseTargets
• Receptors • Host • Microbe • Protein • DNA, RNA • Lipid • Carbohydrate
• Activate = agonism • Inhibit = antagonism • Efficacy, potency • Up/down regulate
PK/PD affected by: • Other drugs • Genetic polymorphisms • Infection/GI flora • Age, weight, diet
Concentration at target
Paradigm relating drug dose and drug effect
ADME/PK PHARMACODYNAMICS
Concentration at locus of action
Administered Dose
• Bioavailability• Distribution • Non-target binding • Rate of elimination
Endpoint
• Cure • Therapy • Palliation • Toxicity
Intensity of Effect
• Drug-receptorinteraction
• Functional state • Placebo effect
2

Defining terms in drug development
• Target discovery – finding targets specific to a disease • “Drugability” – suitability of a target for drug development
and the suitability of a compound to be administered as a drug (Can the compound reach the target?)
drug ��drugable � drugability
• Drug discovery – finding candidate drugs that are active against a defined target (e.g., kinase inhibitors).
• Hits – compounds that give a minimal positive response during screening (e.g., bind to a receptor)
• Lead – the most promising compound arising in a screen • Food and Drug Administration (FDA) – the agency of the
US government responsible for monitoring drug development
3

Defining terms in drug development
• New Chemical Entity (NCE), New Molecular Entity (NME) – Application to FDA for permission to develop a drug candidate and proceed to pre-clinical research
• Pre-clinical research – testing the drug candidates in cells and animals for efficacy, toxicity, pharmacokinetics
• Good Laboratory Practice (GLP) – FDA and international rules and regulations under which preclinical drug development studies are planned, performed, monitored, recorded, reported and archived
• Investigational New Drug (IND) – application to the FDA for permission to proceed with clinical trials
4

Defining terms in drug development
• Clinical research/trials – human testing for safety and efficacy; challenge: defining the dose; phases I-IV
• Good Clinical Practice (GCP) – FDA rules and regulations governing studies in people; data from pre-clinical studies guides human use.
• Good Manufacturing Practice (GMP) – FDA rules and regulations ensuring consistent formulation and manufacture of a drug; pill, solution, shelf-life, etc.
• New Drug Application – the request to the FDA for permission to market a new drug if a drug candidate is proved to be safe and effective in humans
5

Defining terms in drug development
• Pharmacokinetics - What the body does to the drug; determines how much reaches the target
• Pharmacodynamics – What the drug does to the body; therapeutic or toxic outcome; mechanism of action
• ADMET – an acronym for the main determinants of pharmacokinetics: A ~ Uptake = absorption D ~ Distribution M ~ Metabolism E ~ Elimination T ~ Toxicology (politically correct: “Drug Safety”)
6

Steps in drug development (1) Target identification
~ Disease mechanism – biochemical hypothesis ~ Target type and ‘drugability’ Gastric H+�� ulcers
~ Functional genomics � inhibit H+ production
(2) Target validation ~ Knock-out/-in, transgenics, antisense, RNAi, chem. genetics ~ Pathways and pathophysiology Na+/H+ pump well
defined –~ Clinical data – 2nd/3rd generation drugs discovered 1970’s
(3) Assay development – for screening drugs Timoprazole~ In vitro (cell-based), in vivo (animal-based) discovered to inhibit
~ High throughput screening (HTS) Na+/H+ ATPase
(4) Screening – identifying “hits” & narrowing to “leads” ~ Compound/combinatorial libraries; in silico (CADD, SBDD) ~ Primary screen – rapid screen for hits; single dose ~ Potency and dose-response – refine analysis of hits
http://www.alzforum.org/
7

Steps in drug development (5) Lead optimization – improving the lead compounds
~ Medicinal chemistry Synthesized derivatives of ~ Animal PK/PD/ADME/Toxicity timoprazole: Omeprazole ~ Formulation and delivery ~ Apply to FDA for a New Chemical Entity (NCE)
(6) Development – test safety and efficacy in animals ~ Pre-clinical data – safety and efficacy in animal models ~ Process development – drug properties and formulation ~ Investigational New Drug (IND) application for clinical trials
(7) Clinical trials Omeprazole found to be
~ Phase I – PKs, toxicity, dosing safe and effective in ~ Phase II – small scale efficacy increasing gastric pH
~ Phase III – large scale efficacy Lansoprazole,(8) Apply to FDA for approval as a drug Dexlansoprazole, Pantoprazole,(9) Perform Phase IV follow-up studies Rabeprazole,
Ilaprazole� http://www.alzforum.org/
8
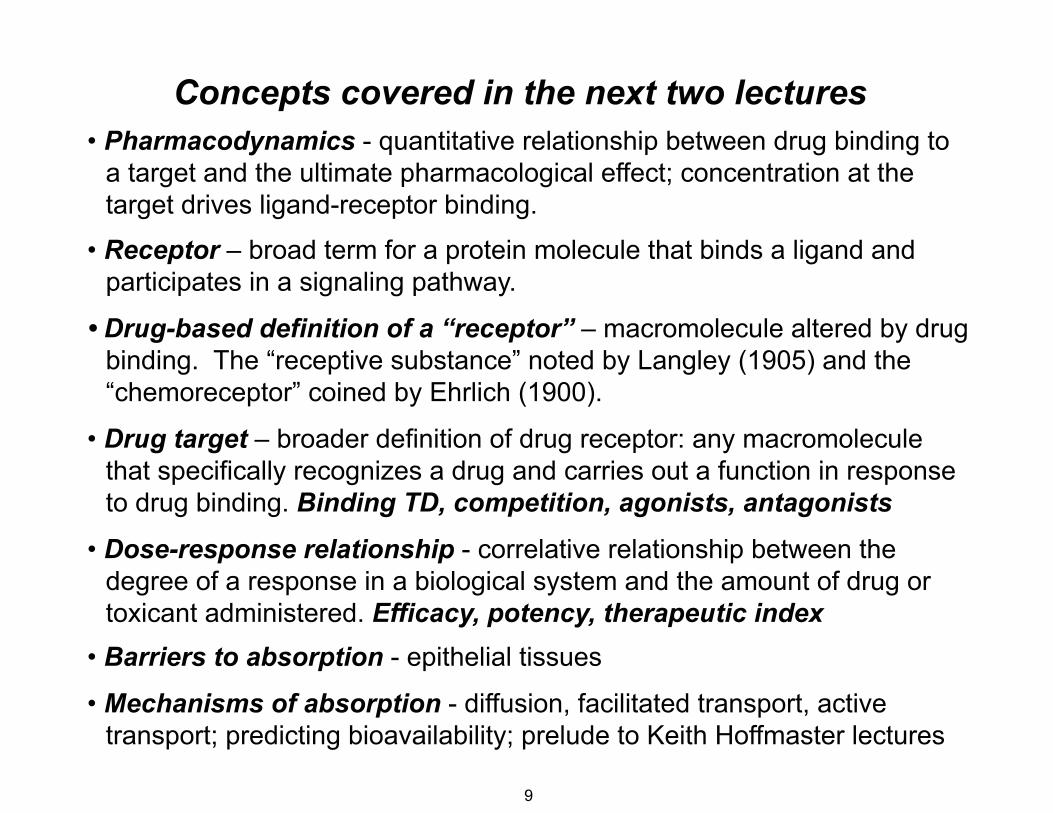
Concepts covered in the next two lectures • Pharmacodynamics - quantitative relationship between drug binding to
a target and the ultimate pharmacological effect; concentration at the target drives ligand-receptor binding.
• Receptor – broad term for a protein molecule that binds a ligand and participates in a signaling pathway.
• Drug-based definition of a “receptor” – macromolecule altered by drug binding. The “receptive substance” noted by Langley (1905) and the “chemoreceptor” coined by Ehrlich (1900).
• Drug target – broader definition of drug receptor: any macromolecule that specifically recognizes a drug and carries out a function in response to drug binding. Binding TD, competition, agonists, antagonists
• Dose-response relationship - correlative relationship between the degree of a response in a biological system and the amount of drug or toxicant administered. Efficacy, potency, therapeutic index
• Barriers to absorption - epithelial tissues
• Mechanisms of absorption - diffusion, facilitated transport, active transport; predicting bioavailability; prelude to Keith Hoffmaster lectures
9
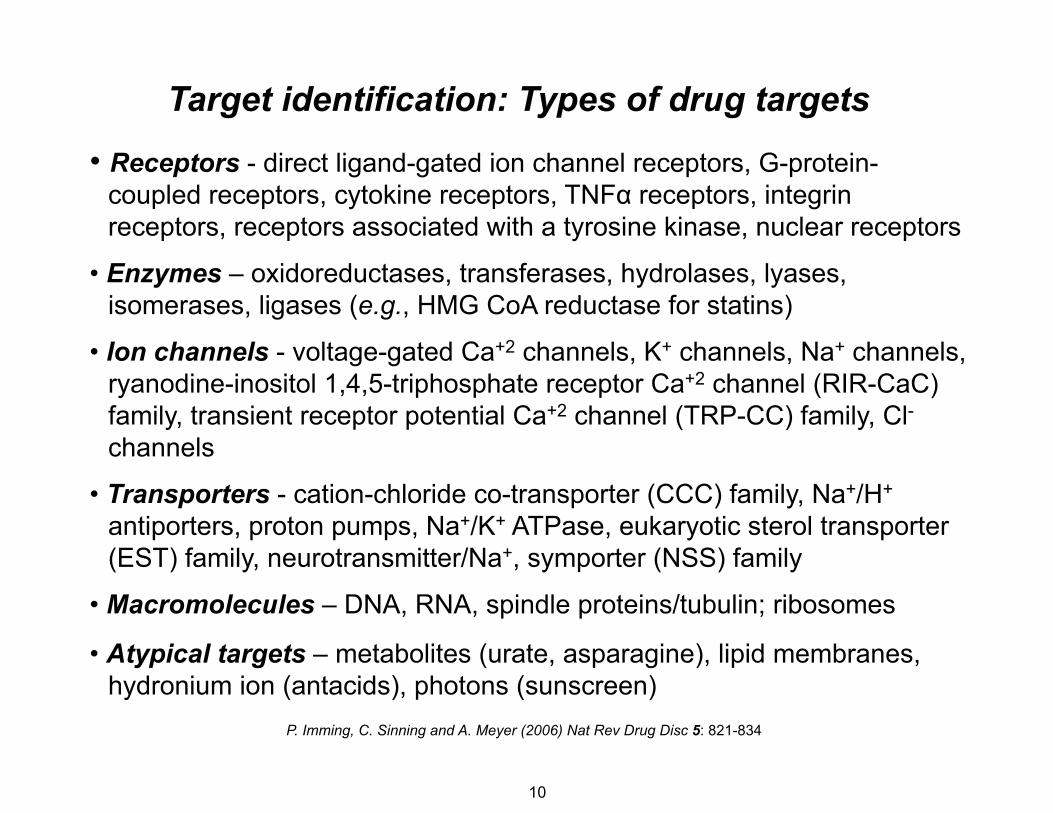
Target identification: Types of drug targets
• Receptors - direct ligand-gated ion channel receptors, G-proteincoupled receptors, cytokine receptors, TNFα receptors, integrin receptors, receptors associated with a tyrosine kinase, nuclear receptors
• Enzymes – oxidoreductases, transferases, hydrolases, lyases, isomerases, ligases (e.g., HMG CoA reductase for statins)
• Ion channels - voltage-gated Ca+2 channels, K+ channels, Na+ channels, ryanodine-inositol 1,4,5-triphosphate receptor Ca+2 channel (RIR-CaC) family, transient receptor potential Ca+2 channel (TRP-CC) family, Clchannels
• Transporters - cation-chloride co-transporter (CCC) family, Na+/H+
antiporters, proton pumps, Na+/K+ ATPase, eukaryotic sterol transporter (EST) family, neurotransmitter/Na+, symporter (NSS) family
• Macromolecules – DNA, RNA, spindle proteins/tubulin; ribosomes
• Atypical targets – metabolites (urate, asparagine), lipid membranes, hydronium ion (antacids), photons (sunscreen)
P. Imming, C. Sinning and A. Meyer (2006) Nat Rev Drug Disc 5: 821-834
10

Types of classical receptors • Transmembrane ion channels
~ Conduct ions across membrane in response to ligand binding, voltage gradient or second messenger ~ Examples: H +/K+-ATP’ase, Na+/K+-ATP'ase
• Transmembrane linked to intracellular G protein - e.g., adrenergic receptors • Transmembrane with cytosolic domain - e.g., receptor tyrosine kinases • Intracellular - cytoplasm or nucleus; e.g., DNA, estrogen receptor
11
© Pharmacology Corner. All rights reserved. This content is excluded from our CreativeCommons license. For more information, see http://ocw.mit.edu/help/faq-fair-use/.

Atypical drug targets and mechanisms
P. Imming, C. Sinning and A. Meyer (2006) Nat Rev Drug Disc 5: 821-834
Courtesy of Nature Publishing Group. Used with permission.
Source: Imming, Peter, Christian Sinning, et al. "Drugs, Their Targets and the Nature and
Number of Drug Targets." Nature Reviews Drug Discovery 5, no. 10 (2006): 821-34.
12

Drug-receptor interactions: Regulating receptor activity
Golan Chapter 1
© Lippincott Williams & Wilkins. All rights reserved. This content is excluded from our CreativeCommons license. For more information, see http://ocw.mit.edu/help/faq-fair-use/.
Source: Golan, David E., Armen H. Tashjian, et al. Armstrong, eds. Principles of Pharmacology:The Pathophysiologic Basis of Drug Therapy. Lippincott Williams & Wilkins, 2011.
13
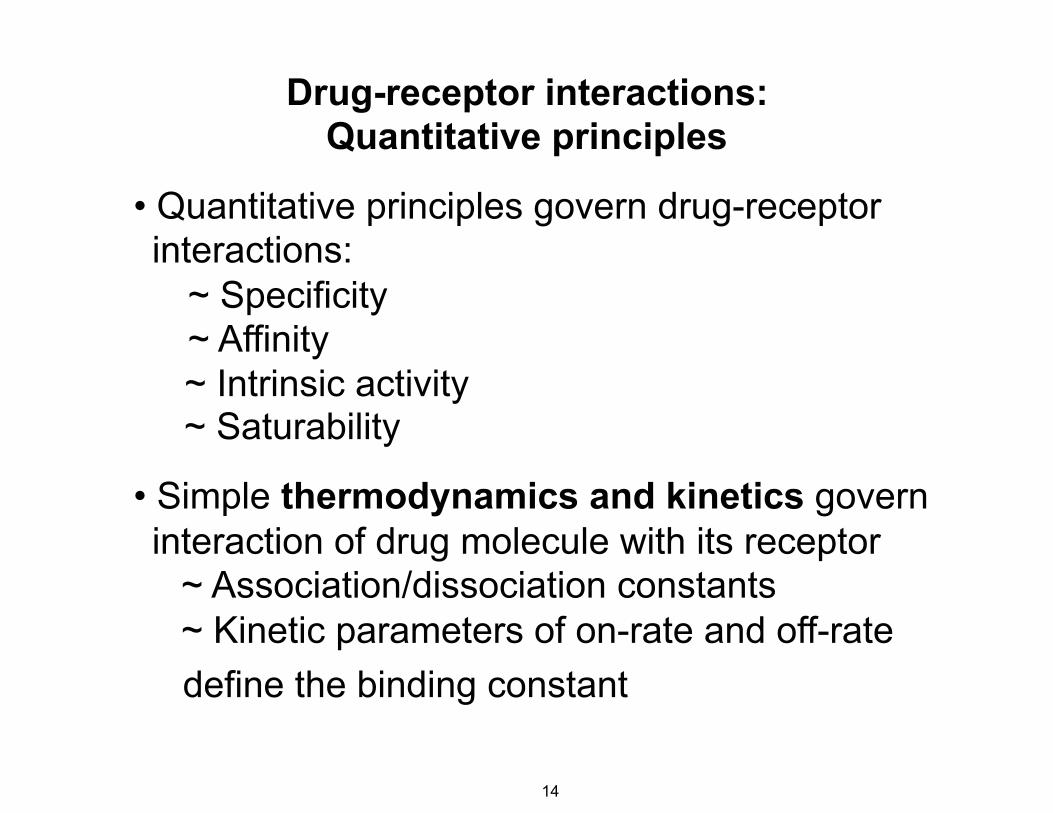
Drug-receptor interactions: Quantitative principles
• Quantitative principles govern drug-receptor interactions:
~ Specificity ~ Affinity ~ Intrinsic activity ~ Saturability
• Simple thermodynamics and kinetics govern interaction of drug molecule with its receptor ~ Association/dissociation constants ~ Kinetic parameters of on-rate and off-rate define the binding constant
14

Characteristics of a receptor
• Specificity - Receptor interacts with one type of ligand or
structurally related ligands - Competition between related ligands - Example: glucose transporter and D-glucose
• Affinity - The energetics of ligand receptor interactions
- Energetics of binding contribute to specificity
• Intrinsic activityCHO CHO- A measure of the ability of a bound drug to
H OH H OHactivate the receptor HO H HO H- Distinguishes agonist from antagonist
H OH H OH
OH• Saturability H HO H
- Finite number of binding sites on a receptor CH2OH CH2OH and their specificity for a ligand imply that D-glucose L-glucose binding sites can become fully occupied with ligand molecules
- Additional ligand leads to non-specific binding
Substrate Km (M) L-Glucose >3000
Galactose 30
Mannose 20
D-Glucose 1.5
Unnatural substrate, low affinity
binding
Native substrate,
high affinity binding
CHO CHO
H OH HO H
HO H HO H
OHHO H H
OHH OH H
CH2OH CH2OH
D-galactose D-mannose
15

Types of chemical bonds that govern ligand-receptor interactions
- Affinity and specificity - based on chemical bonds -Covalent binding of omeprazole occurs only after non-covalent,
specific interaction with H +/K+-ATPase - Ionic bonds ➙ initial attraction - Cation-π interactions, H-bonds ➙ improved binding, some specificity - Van der Waals forces, hydrophobic interactions ➙ most specificity
Epinephrine and the ββ-adrenergic receptor
16

Sulfenamide
i w
d t to –SH al ump rsed Sulfenamide
Sulfenic acid
pKa ~ 4
Covalent bonds in ligand-receptor interactions: Example with omeprazole
Protonation of imidiazole Pyridinium ion intermediate trapped in cannalicular lumen where pH ~1 (1000x
concentration)
Omeprazole (Prilosec)
Sulfenamide and sulfenic acid react to
form disulfide with –SH on Cys on lumenal
surface of proton pump (or with GSH! Reversed
in liver)
17
KKKK
r =
nKa [X ]free
1+ Ka [X ]free
[[
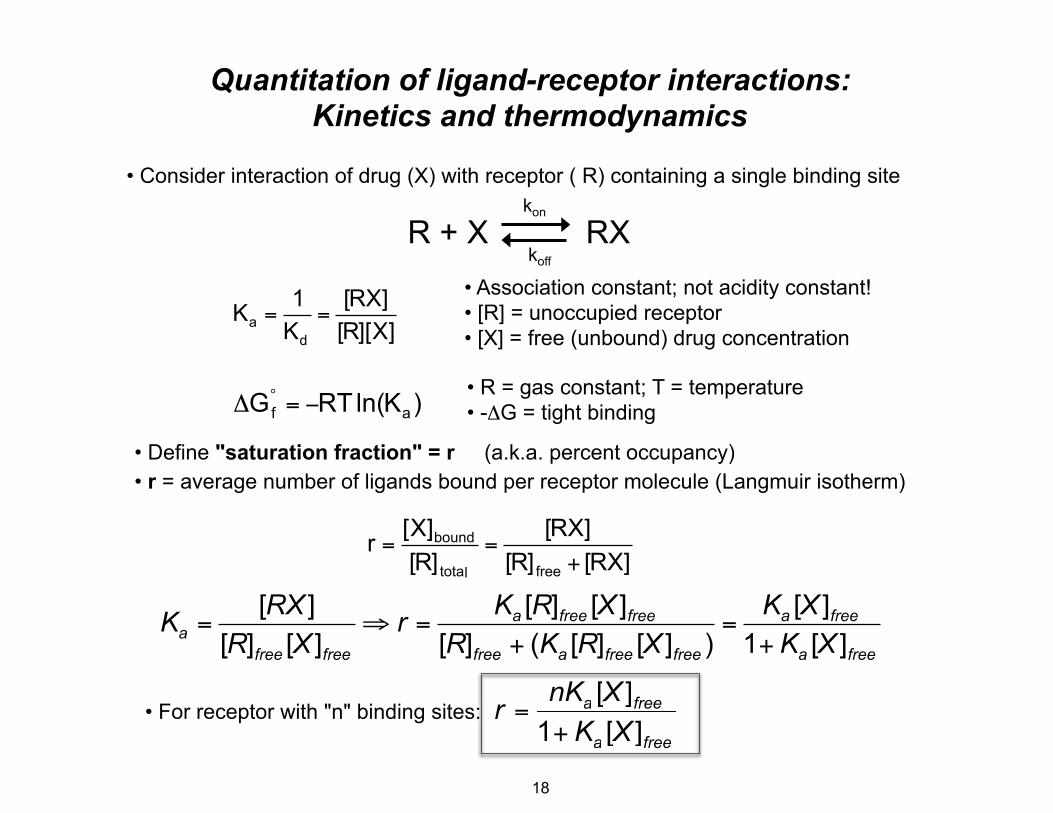
Quantitation of ligand-receptor interactions: Kinetics and thermodynamics
• Consider interaction of drug (X) with receptor ( R) containing a single binding site kon
R + X RX koff
• Association constant; not acidity constant!1 [RX] Ka = = • [R] = unoccupied receptorKd [R][X] • [X] = free (unbound) drug concentration
• R = gas constant; T = temperature ΔG°
f = −RTln(K )a • -ΔG = tight binding
• Define "saturation fraction" = r (a.k.a. percent occupancy) • r = average number of ligands bound per receptor molecule (Langmuir isotherm)
[X]bound [RX] r = = [R]total [R]free + [RX]
[RX ] Ka [R]free [X ]free Ka [X ]freeKa = ⇒ r = = [R]free [X ]free [R]free + (Ka [R]free [X ]free ) 1+ Ka [X ]free
• For receptor with "n" binding sites:: r = nKa [X[ ]free
1 + Ka [X[ ]free
free
+ K free
18
v
KK
vo =
vmax • [S]Km + [S]
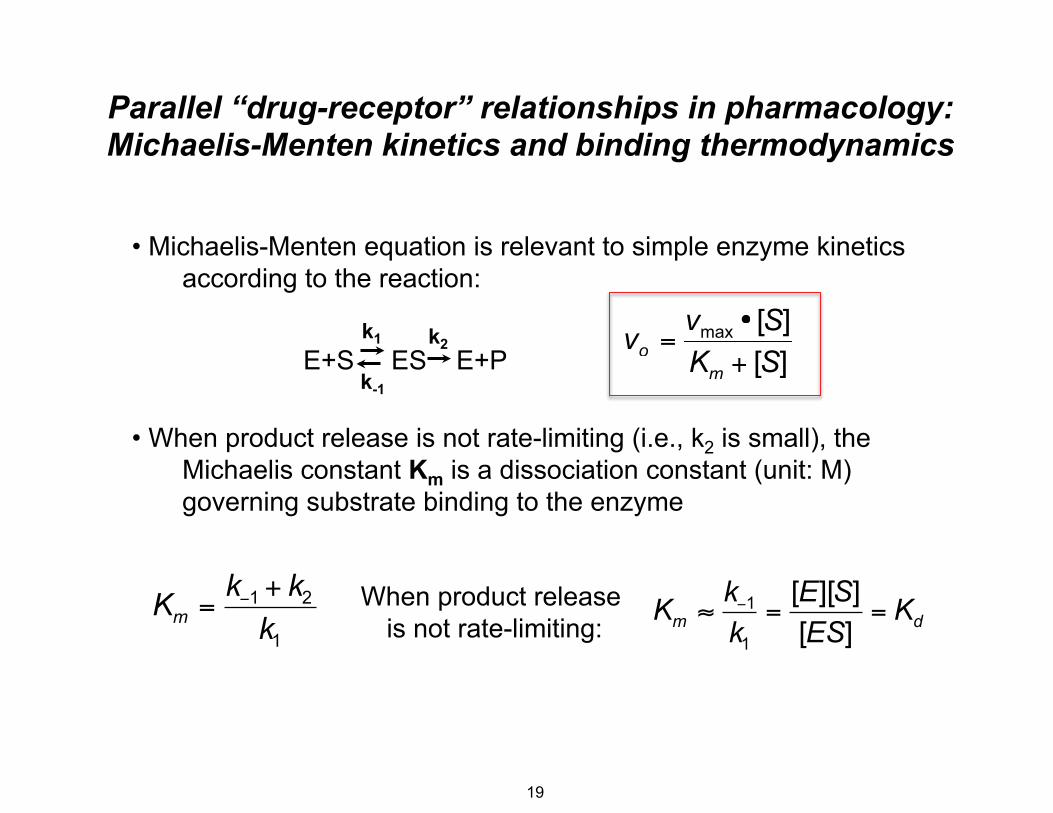
Parallel “drug-receptor” relationships in pharmacology: Michaelis-Menten kinetics and binding thermodynamics
• Michaelis-Menten equation is relevant to simple enzyme kinetics according to the reaction:
k1 k2E+S ES E+P
k-1
vo = vmax • [S] Km + [S]
• When product release is not rate-limiting (i.e., k2 is small), the Michaelis constant Km is a dissociation constant (unit: M) governing substrate binding to the enzyme
k−1 + k2 When product release k−1 [E][S]Km = Km ≈ = = Kdk1 is not rate-limiting: k1 [ES]
[S][S]
19

KKKK
r =nKa [X ]free
1+ Ka [X ]free
[
Quantitation of ligand-receptor interactions • Binding isotherm: increase [ligand] and measure bound and free (constant temp) • Nonlinear regression to fit the data and determine Ka
n or 1 r = nKa [X[ ]free
1 + K [[[a ]freeX
Ka [X ]freer = 0.5 ="r" 0.5 1+ Ka [X ]free
r = 0.5 ⇒ [R]free = [RX] ⇒ Ka = 1 and 1
= [X]free1/ 2[X]free Ka0
1/Ka = [X]free that [X]free occurs when 1/2 of
receptors are occupied Ka Slope = -Ka
Yi = nKaScatchard plot • Rearrange equation: linear plot Xi = nr/[x]free• r/[X]free versus r
nKa [X ]free r r = ⇒ = nK − K r1+ Ka [X ]free [X ]free
a a
0 0.5 n or 1r
20

Quantitation of ligand-receptor interactions
nKr = a [X ]free
1+ Ka [X ]free
r = 0.5 =
Ka [X ]free
1+ Ka [X ]free
r = 0.5 ⇒ [R]free = [RX] ⇒ Ka =
1[X]free
and 1Ka
= [X]free1/2
"r"
n or 1
0.5
0
[X]free 1/Ka = [X]free that occurs when 1/2 of
receptors are occupied
n or 1
0.5
0
Log([X]free)
"r"
• Replot binding isotherm as semi-log plot: log[ligand] • Sigmoidal shape typical for binding isotherms and dose-response relationships!
r =nKa [X[[ ]free
1+ Ka [X[[ ]free
21
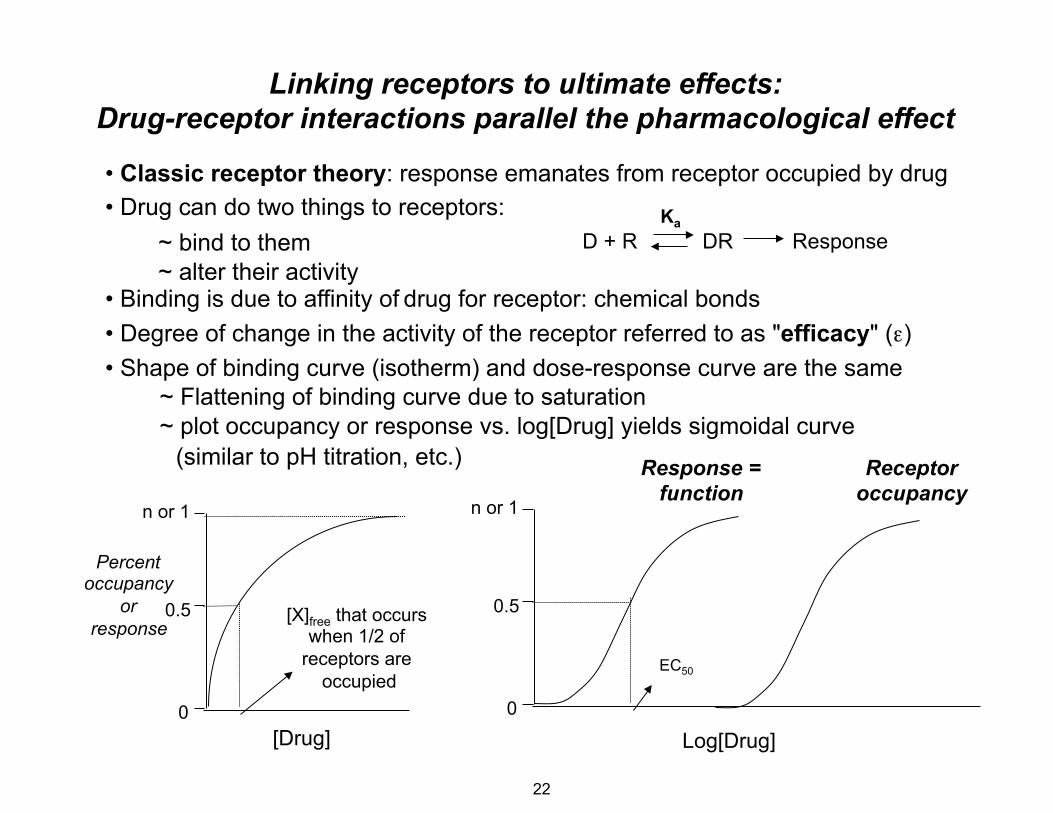
Linking receptors to ultimate effects: Drug-receptor interactions parallel the pharmacological effect
• Classic receptor theory: response emanates from receptor occupied by drug • Drug can do two things to receptors: Ka
~ bind to them D + R DR Response~ alter their activity
• Binding is due to affinity of drug for receptor: chemical bonds • Degree of change in the activity of the receptor referred to as "efficacy" (ε) • Shape of binding curve (isotherm) and dose-response curve are the same
~ Flattening of binding curve due to saturation ~ plot occupancy or response vs. log[Drug] yields sigmoidal curve
(similar to pH titration, etc.) Response = Receptor
n or 1
Percent occupancy
or 0.5 response
0
function occupancyn or 1
0.5[X]free that occurs when 1/2 of
receptors are occupied
0
EC50
[Drug] Log[Drug]
22

The dose-response relationship
• The relationship between the quantity of response and the dose of drug or toxicant
• Foundation for receptor theory of pharmacology, drug action
• Prerequisites and assumptions for defining a dose-response relationship:
~ Response is due to the drug ~ Degree of response is due to the drug concentration ~ Have a quantifiable (measurable) response parameter
• Types of dose-response relationships: ~ Individual, graded or continuous: dose-related change in intensity of response in an individual. Example: enzyme inhibition, blood pressure change
~ Quantal: effect of various drug doses on a population; single end-point ("quanta") study in which an organism either responds or it does not. Example: death
23

The dose-response relationship • Example: drug for control of blood pressure
~ groups of 10 patients ~ one dose of drug per group ~ administer 8 doses of drug and then measure blood pressure ~ “response” = ≥ 20 mm Hg drop in blood pressure ~ plot % of patients responding versus log of dose
• Sigmoidal dose-response curve is typical
• Similar to ligand-receptor binding curve, cell response curve, etc. 100
90
80
% of patients 70
with 20 mm Hg 60
drop in blood 50
pressure 40
30
20
10
0 0 1 2 3 4 5
log(Dose, mg/kg)
24

The dose-response relationship
• Calculate net increase in % response with each higher dose
• Replot the change in % response or frequency
100
90
80
% of patients with 20 mm Hg drop in blood
pressure 30
40
50
60
70
20
10
0 0
1 2 3 4 5
log(Dose, mg/kg)
25
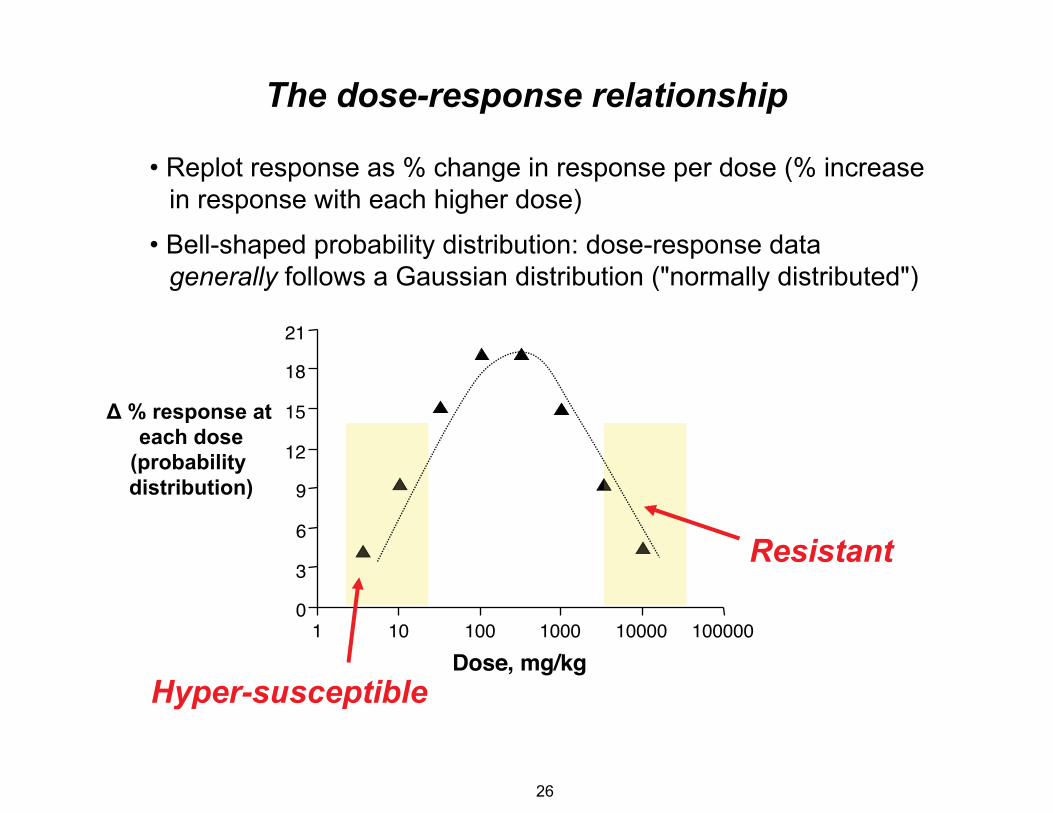
The dose-response relationship
• Replot response as % change in response per dose (% increase in response with each higher dose)
• Bell-shaped probability distribution: dose-response data generally follows a Gaussian distribution ("normally distributed")
21
18
Δ % response at 15 each dose
(probability 12
distribution) 9
6
3
0 1 10 100 1000 10000 100000
Dose, mg/kg
Resistant
Hyper-susceptible
26

The dose-response relationship • In population with normal distribution (mean = median):
~ mean ± 1 SD...68.3% of the population ~ mean ± 2 SD...95.5% of the population ~ mean ± 3 SD...99.7% of the population
• Convert % response to units of deviation from the mean = NED (normal equivalent deviations) +5 = PROBIT:
~ 16% response (-1 SD)..NED = -1..PROBIT = 4 ~ 50% response (0 SD)...NED = 0...PROBIT = 5 ~ 84% response (+1 SD).NED = +1.PROBIT = 6
100 90 80 70 60 50 40 30 20 10
0
log(Dose, mg/kg)
Mean = 50% ±1 SD = 26% and 84% ±2 SD = 2% and 98% ±3 SD = 0.2% and 99.8%
+2 SD
+1 SD
-1 SD
0 1 2 3 4 5
Mean/Median
NED PROBIT 2 3 4 5 6 7 8
27

LD50 TD50
ED50
response = Efficacy
ED50
The dose-response relationship • Definitions - Effective dose = ED; Toxic dose = TD; Lethal dose = LD • Potency - Range of doses over which a drug produces increasing responses • Efficacy - Maximal response; plateau of the dose-response curve
Dose producing equal response LethalityDose or= Potency producing Toxicity maximal
100
80% Response
or 60 Median E/Emax (50%
40 Response)
20
Re LD50 TD50
response = Efficacy
ED50 ED505
0 1 2 3 4
log(Dose, mg/kg)
28

Drug-receptor interactions: Agonists and Antagonists (distinguishing binding from response)
• Agonist - Ligand that binds to receptor and stabilizes an “active state” of the receptor - “Active state” is defined as the functionally activated form (e.g., open ion
channel, activated tyrosine kinase) - Endogenous ligands are generally agonists: neurotransmitters
• Antagonist -A ligand that binds to the receptor with affinity/specificity but does not have
intrinsic activity - Inhibits the action of an agonist but has no activity in the absence of agonist
- Receptor antagonist: binds to the active site or an allosteric site reversibly or irreversibly
- Non-receptor antagonist: binds to molecule downstream in activation pathway, or acts in a pathway that opposes the agonist pathway ~ Chemical antagonist: protamine binds to and inhibits heparin, an
anticoagulant ~ Physiological antagonist: β-adrenergic receptor agonists block the
tachycardia caused by hyperthyroidism (though thyroid hormone acts by a different receptor)
29

Agonists - Ligand that binds to receptor and stabilizes an “active state” of the receptor -“Active state” represents conformational change caused by agonist binding -Binding can occur at the active site or at another region of the receptor
(exerts allosteric effects) - The kinetics of drug binding and receptor activation are distinct
kon kα D + R � DR � DR*
Potencyy Efficacy kk
coff kββ
- Potency related to drug binding affinity (i.e., association constant) - Efficacy related to the rate and extent of receptor activation AFTER drug binding
S
D
Active Site
Allosteric Site
D
Active Site
Allosteric Site
S
30

kon kα
D + R � DR � DR* Agonistskoff kβ
Potency Efficacy
- Potency related to drug binding affinity (i.e., association constant)
- Efficacy related to rate and extent of receptor activation AFTER drug binding
- Partial agonist: sub-maximal response when drug binds to receptor; judged relative to the most efficacious drug in class
= log(concentration)
100%
Partial agonist:
less efficacious 50%
Differences in potency
Differences in efficacy
log(dose)
% Response
or E/Emax
31

Irreversible Antagonists
• Irreversible Antagonist = Noncompetitive Antagonist
• Drug binds to receptor at active or allosteric site with extremely high affinity or by covalent bonds
• Example: omeprazole
• Antagonist action terminates when receptor degraded
32

Toxic Response
95 ~ 10
Therapeutic Index • Goal: wide difference between toxic and therapeutic doses • Quantify this concept in the Therapeutic Index: TI = TDx / EDx
• Conservative approach: use TD5-10 and ED90-95
• More conservative: Margin of Safety (MOS) = TD01/ED99
• Safe drug: TI > 10 versus MOS > 1 • Usually based on animal studies; clinical experience guides human "TI" estimates
100
80% Response
or 60
E/Emax 40
20
0 1 2 3 4
log(Dose, mg/kg)
TD5ED95
TherapeuticResponse
TI = TD5/ED Toxic Response
5
/ED95 ~ 10 95 ~ 10

Drugs with narrow therapeutic indices
Drug Therapeutic Range Toxicity TI Phenytoin 10-12 mg/L >25 mg/L 2-2.5
Phenobarbitone 10-30 mg/L >35 mg/L 3-3.5 Carbamazepine 5-12 mg/L >12 mg/L 1-2.4 Ethosuximide 40-100 mg/L >100 mg/L 1-2.5 Valproic acid 50-100 mg/L >100 mg/L 1-2
Digoxin 1-2.5 μg/L >3 μg/L 1-3 Digitoxin 10-25 μg/L >38 μg/L 1.5-4 Quinidine 3-6 mg/L >6 mg/L 1-2
Procainamide 3-10 mg/L >10 mg/L 1-3 Lithium 0.8-1.0 mmol/L >1.5 mmol/L 1.5-1.8
Nortryptyline 50-160 μg/L >210 μg/L 1-4 Theophylline 10-20 mg/L >20 mg/L 1-2
From Avery's Drug Treatment (1987) edited by T.M. Speight, Williams and Wilkins, Baltimore. 3rd Edition.
34

Digoxin
Pharmacodynamics and receptors: Case study with cardiac glycosides
• Digitalis Digitalis purpurea �~ genus of flowering plants ("foxglove") (Common Foxglove)� (Dead men's bells)�~ 20 species: Digitalis purpurea
• Caridac glycosides ~ Carbohydrate conjugate ~ Aglycone = digoxigenin
• Digoxin - "Digitalis"
~ Lanoxin (GlaxoSmithKline) ~ excreted mainly in urine
• Digitoxin -
~ Not available in US ~ excreted mainly in bile (liver)
• Main indications for use:
~ Chronic heart failure = inotropic agent ~ Atrial fibrillation = anti-arrhythmic agent
~ Source of cardiac glycosides (Digtalins)igtalins)
Digoxin
Digitoxin
e
Courtesy of Ryan Somma on flickr. License: CC-BY.
35

Qiu et al. (2005) J. Biol. Chem. 280: 32349
Pharmacodynamics and receptors: Binding of digoxin to Na+/K+-ATPase
K+
• Mechanism of action: ~ Inhibits Na+/K+-ATPase – the “receptor” ~ Direct effect: ↑force/velocity cardiac contraction
"positive inotropism"
Na+
~ Indirect effects: ↓BP, ↓HR (autonomic nervous system)
• Na+/K+-ATPase ~ trans-membrane ~ ion transport protein: Na + out, K+ in ~ extracellular binding site
• Inhibition: ↑ intracellular Na+ ⇒ ↑ intracellular Ca+2
• Recent crystal structure with ouabain
• Ouabain ~ Digoxin surrogate ~ "g-strophanthin" (extract) ~ cardiac glycoside ~ endogenous, plant sources
(Strophanthus gratus)
Ouabain
Ogawa et al. (2009) PNAS 106: 13742
© American Society for Biochemistry and Molecular Biology.All rights reserved. This content is excluded from our CreativeCommons license. For more information, seehttp://ocw.mit.edu/help/faq-fair-use/.Source: Qiu, Li Yan, Elmar Krieger, et al. "Reconstruction of
the Complete Ouabain-binding Pocket of Na, K-ATPase in
Gastric H, K-ATPase by Substitution of only Seven
Amino Acid." Journal of Biological Chemistry 280,
no. 37 (2005): 32349-55.
Courtesy of the authors. Used with permission.
Source: Ogawa, Haruo, Takehiro Shinoda, et al."Crystal Structure
of the Sodium-Potassium Pump(Na+, K+-ATPase) with Bound
Potassium andOuabain." Proceedings of the National Academyof Sciences
36 106, no. 33 (2009): 13742-7.
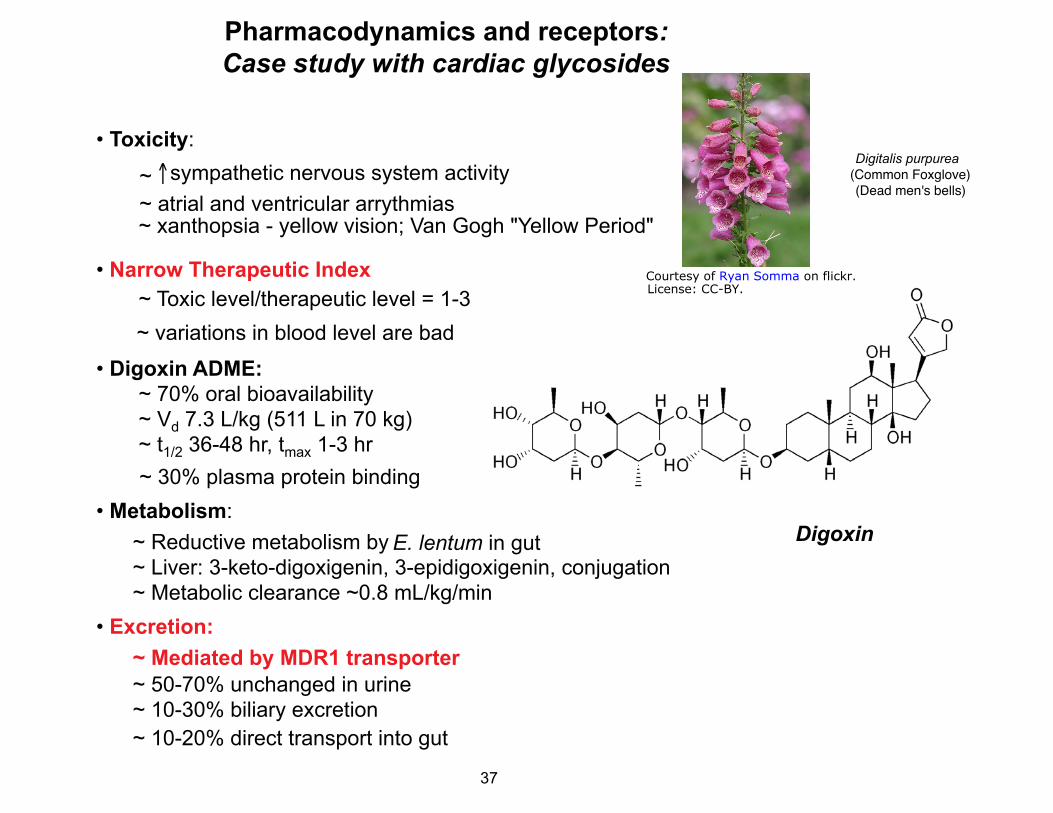
Pharmacodynamics and receptors: Case study with cardiac glycosides
• Toxicity: Digitalis purpurea �
~ ↑sympathetic nervous system activity (Common Foxglove)� (Dead men's bells)�
~ atrial and ventricular arrythmias ~ xanthopsia - yellow vision; Van Gogh "Yellow Period"
• Narrow Therapeutic Index ~ Toxic level/therapeutic level = 1-3 ~ variations in blood level are bad
• Digoxin ADME: ~ 70% oral bioavailability
~ Vd 7.3 L/kg (511 L in 70 kg) ~ t1/2 36-48 hr, tmax 1-3 hr
~ 30% plasma protein binding • Metabolism:
~ Reductive metabolism by E. lentum in gut ~ Liver: 3-keto-digoxigenin, 3-epidigoxigenin, conjugation ~ Metabolic clearance ~0.8 mL/kg/min
• Excretion: ~ Mediated by MDR1 transporter ~ 50-70% unchanged in urine ~ 10-30% biliary excretion ~ 10-20% direct transport into gut
Digoxin
Courtesy of Ryan Somma on flickr.License: CC-BY.
37

Antiarrhythmic agent
Drescher et al. (2003) Clin Pharm Ther 73: 223-31.
AUCdig+quinAUCdig
Quinidine increases plasma levelsof digoxin by blocking excretion
of digoxin into bile and gut
Digoxin + quinidine
Digoxin alonene
MDR1/P-Glycoprotein: Digoxin Case Study
• Major role for MDR1 in excretion of Quinidinedigoxin
• MDR1 mediates digoxin excretion: ~10-30% of dose into bile ~20% of dose in gut lumen
• MDR1 mutation or competition for binding: major effects on digoxin PKs
• Competition for MDR1: ~ binding thermodynamics! ~ Elevated plasma digoxin levels when other MDR1-transported drugs are administered (e.g., quinidine)
• Over-expression of MDR1: decreased serum digoxin levels when some drugs (e.g., rifampin) cause increased MDR1 expression
© American Society for Clinical Pharmacology and Therapeutics. All rights reserved. This contentis excluded from our Creative Commons license. For more information,see http://ocw.mit.edu/help/faq-fair-use/.Source: Drescher, Siegfried, Hartmut Glaeser, et al. "P-glycoprotein-mediated Intestinal andBiliary Digoxin Transport in Humans." Clinical Pharmacology & Therapeutics 73, no. 3 (2003):223-31.
38

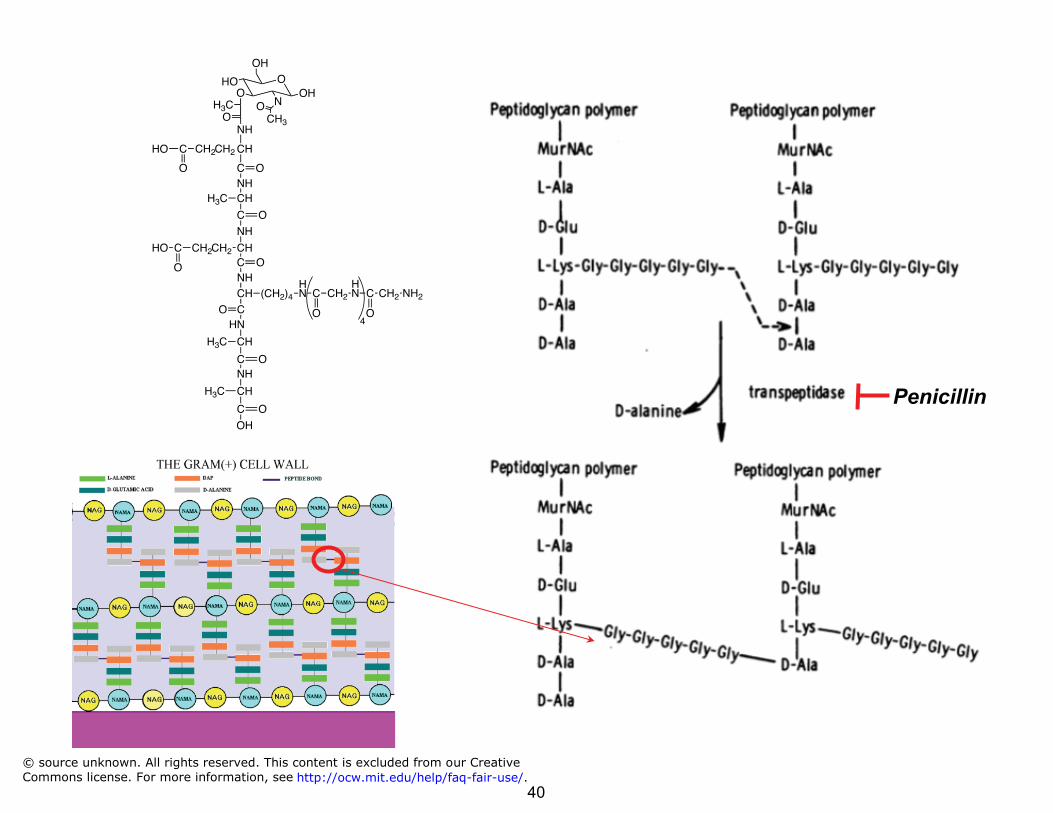
Drugs with a high TI: Amoxicillin
Amoxicillin
• Amoxicillin: penicillin family of antibiotics
• Penicillins – β-lactams ~ bacteriocidal ~ inhibit cell wall synthesis ~ non-competitive transpeptidase
inhibitor
• Analogs of D-ala-D-ala that is cross-linked by transpeptidase
• Weakened cell walls: osmotic rupture
• LD50 ~ 12-25,000 mg/kg (mice, rats, rabbits)
• ED ~ 7 mg/kg ⇒⇒ TI > 1000 © source unknown. All rights reserved. This content is excluded from our CreativeCommons license. For more information, see http://ocw.mit.edu/help/faq-fair-use/.
39
Penicillin
NH CH
C
H3C
O
NH
CH C
CH2
O CH2CHO
O NH CH
CO
H N
HN
CH
C
H3C
O NH
CH
C
H3C
OH
O
(CH2)4
NH
CH
C
CH2
O
CH2CHO
O
O
OH
HO
H3C OH
NO CH3O
O
NH2CH2C
O
H NCH2C
O 4
© source unknown. All rights reserved. This content is excluded from our Creative
Commons license. For more information, see http://ocw.mit.edu/help/faq-fair-use/.40

Outline • Fundamental concepts in Tox and Pharm • Absorption, transporters, oral activity • Absorption, transporters, oral activityA
D • Distribution, protein binding M • Metabolism, the liver and portal circulation E • Excretion pathways
• Pharmacokinetics • Genetic variation and ADME
41

Absorption and Distribution
• Route of administration determines PKs
• Enteral Route of
Administration
~ oral ~ sublingual ~ rectal
• Parenteral ~ intravenous (iv) ~ intramuscular (im) ~ subcutaneous (sc)
• Other routes ~ inhalation ~ topical ~ transdermal
Blood/Plasma
Absorption
Tissues Distribution
Route of Elimination
42
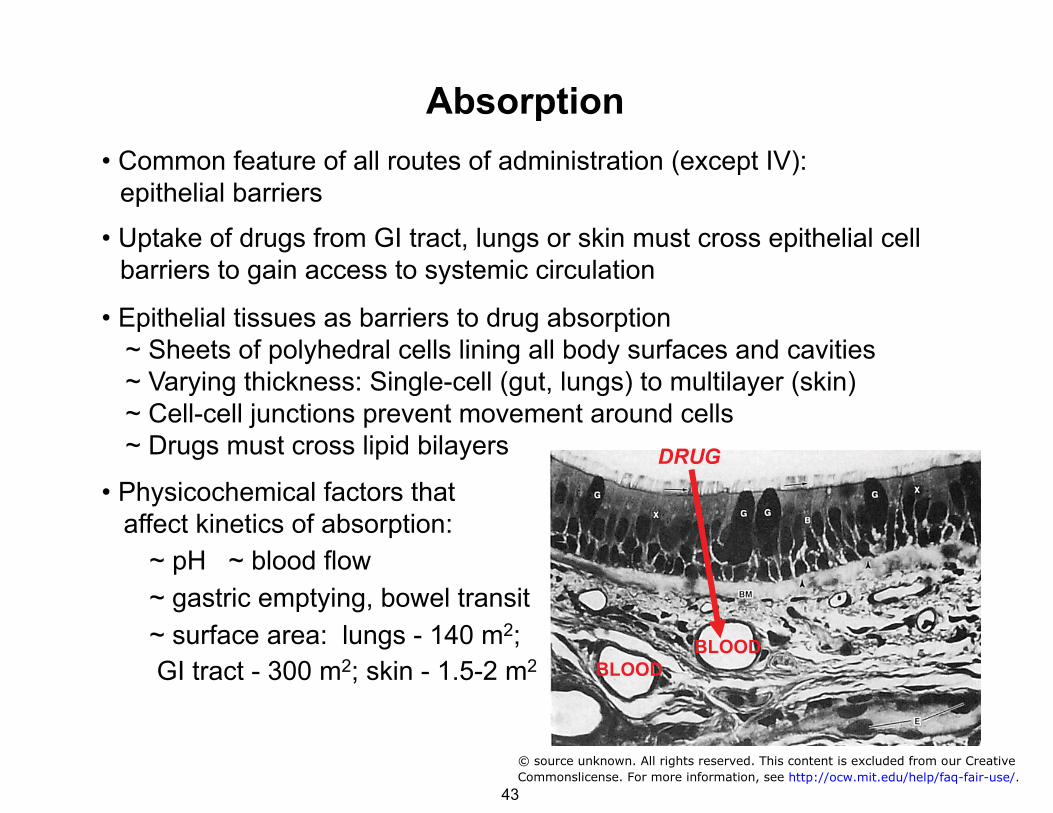
Absorption • Common feature of all routes of administration (except IV): epithelial barriers
• Uptake of drugs from GI tract, lungs or skin must cross epithelial cell barriers to gain access to systemic circulation
• Epithelial tissues as barriers to drug absorption ~ Sheets of polyhedral cells lining all body surfaces and cavities ~ Varying thickness: Single-cell (gut, lungs) to multilayer (skin) ~ Cell-cell junctions prevent movement around cells ~ Drugs must cross lipid bilayers
• Physicochemical factors that affect kinetics of absorption:
~ pH ~ blood flow ~ gastric emptying, bowel transit ~ surface area: lungs - 140 m2; GI tract - 300 m2; skin - 1.5-2 m2
DRUG
BLOOD BLOOD
© source unknown. All rights reserved. This content is excluded from our Creative
Commonslicense. For more information, see http://ocw.mit.edu/help/faq-fair-use/.43

Absorption: Epithelial tissue barriers • Four types of tissue: collections of similar cells and intercellular material
~ Epithelial: sheets of polyhedral cells lining body cavities and surfaces ~ Connective: cells in intercellular matrix; form, adhesion, and support ~ Muscle: contractile elements ~ Nervous: impulse conducting
• Epithelial tissues as barriers to drug absorption ~ Varying thickness: Single-cell (gut, lungs) to multilayer (skin) ~ Cell-cell junctions prevent movement around cells ~ Drugs must cross lipid bilayers
• Functions: ~ Protection/hydration - skin ~ Protection/absorption - GI tract ~ Gas transfer - respiratory tract ~ Hormone production - glandular elements ~ Barrier to fluid movement - lining of blood vessels
• Epithelium and cancer: ~ Carcinoma - malignant neoplasm of epithelial origin ~ Sarcoma - malignant neoplasm of connective tissue origin ~ epithelial cells account for >90% of tumors in adults >45 yo ~ children <10 yo: hematologic>>neuronal>connective tissue (bone)>epithelial
44
Epithelial Structure/Function: Cell Structure Review
Images of cell structures from textbooks removed due to copyright restrictions.
45
Epithelial Structure/Function: Tissue Architecture
Images of cell structures from textbooks removed due to copyright restrictions.
46
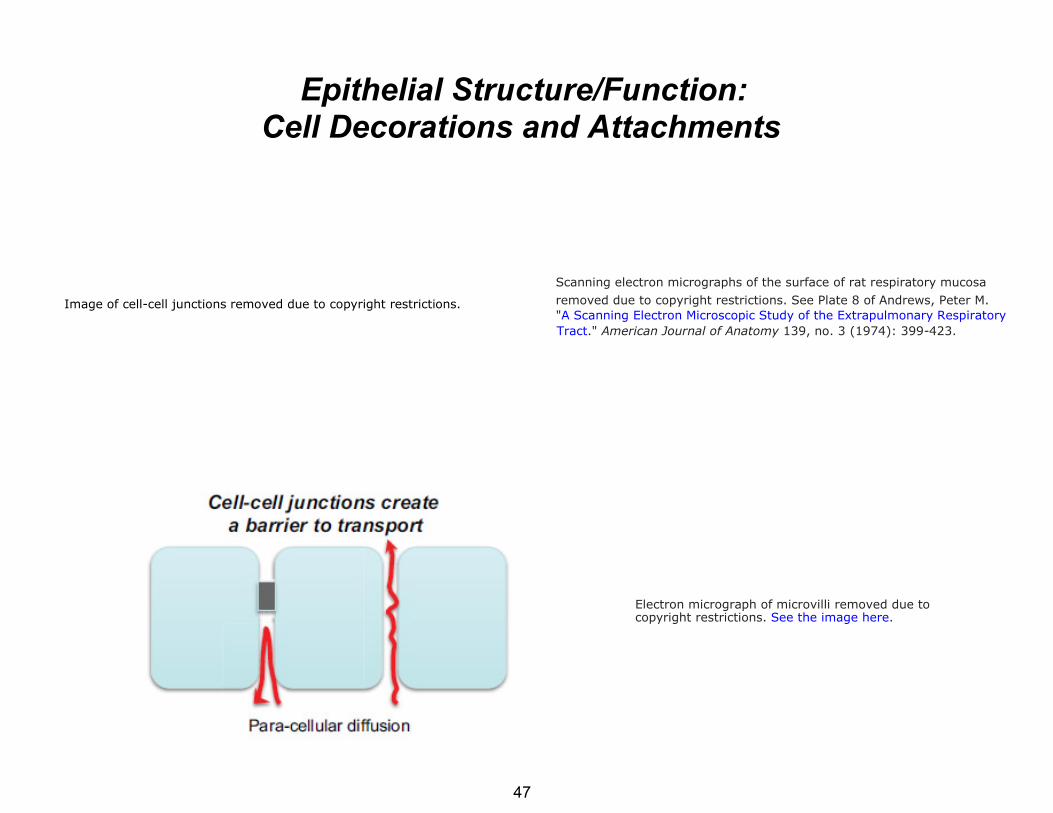
Scanning electron micrographs of the surface of rat respiratory mucosa
Image of cell-cell junctions removed due to copyright restrictions. removed due to copyright restrictions. See Plate 8 of Andrews, Peter M.
"A Scanning Electron Microscopic Study of the Extrapulmonary Respiratory
Tract." American Journal of Anatomy 139, no. 3 (1974): 399-423.
Electron micrograph of microvilli removed due tocopyright restrictions. See the image here.
Epithelial Structure/Function: Cell Decorations and Attachments
47
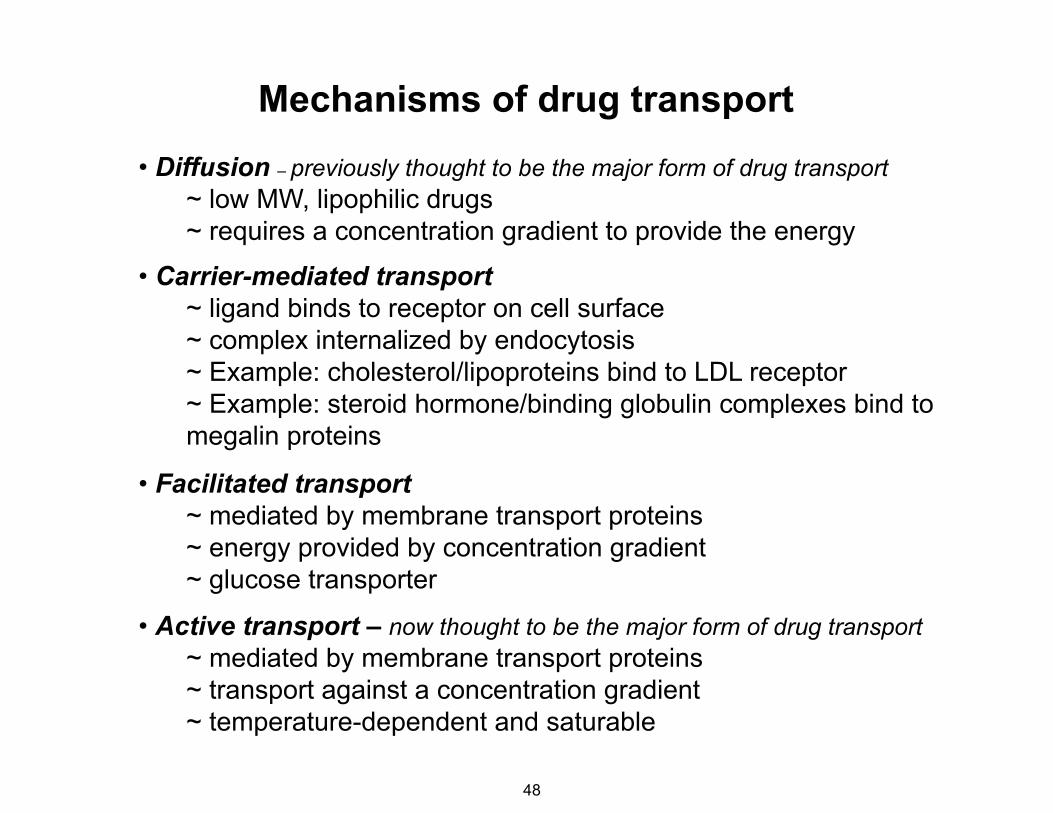
Mechanisms of drug transport • Diffusion – previously thought to be the major form of drug transport
~ low MW, lipophilic drugs ~ requires a concentration gradient to provide the energy
• Carrier-mediated transport ~ ligand binds to receptor on cell surface ~ complex internalized by endocytosis ~ Example: cholesterol/lipoproteins bind to LDL receptor ~ Example: steroid hormone/binding globulin complexes bind to megalin proteins
• Facilitated transport ~ mediated by membrane transport proteins ~ energy provided by concentration gradient ~ glucose transporter
• Active transport – now thought to be the major form of drug transport ~ mediated by membrane transport proteins ~ transport against a concentration gradient ~ temperature-dependent and saturable
48

• Passive mechanism for small lipophilic drugs
• Fick's law: flux of diffusing material is proportional to the local density gradient ~ J = flux along density gradient (mol•m-2•s-1) ~ D = diffusion coefficient or diffusivity (m2/s) ~ ø = density or concentration; mol/m3
~ x = position
• Rate of diffusion affected by distance, surface area, and properties of drug and medium ~ A = area available for exchange (m2) ~ L = distance (m); 7-10 nm lipid bilayer ~ ΔC = concentration difference (mol/m3)
• Occurs down a concentration gradient: • P = permeability coefficient (m/s) = D/l • For a specific area (A, m2):
J = −D ∂φ
∂xD
∝L
⎛
⎝ ⎜
⎞
⎠ ⎟ • ΔC
Cell surface
area A
Distance L = 7-10 nm
[Drug] outside
cell C1
C2 < C1 ⇒ −ΔC ⇒ −
∂φ∂x
Mechanisms of transport: Diffusion
[Drug] inside
cell C2
J = P • ΔC
mol s
= A• J = P • A• ΔC
49

First-order processes in the body
• Definition of a first-order process: a reaction or activity the rate of which depends on the concentration of reactants or the chemical of interest
• Most of the processes of absorption, distribution, metabolism,
elimination are first-order • Absorption: Rate of diffusion depends on the concentration
gradient (i.e., the concentration of the "reactant”)
dQ − dt
• Metabolism and transport proteins - Enzyme kinetics generally first -order, except under conditions of substrate saturation:
when Km>>[S], then
= P • A • ΔC
dProduct
dt= V =
Vmax •[S]Km + [S]
dProduct
dt= V =
Vmax
Km
•[S] = kmet•[S]
50

• Fisk’s law states that movement through the membrane will be proportional to ΔC and P
• Cell membrane is essentially impermeable to most charged and highly polar substances except H2O • H2O moves 109-times faster than Na+ or K+
mol
s= A• J = −
dQdt
= P • A• ΔC
10-12 10-10 10-8 10-6 10-4 10-2 P, cm/s
Na+ K+ Cl- Glucose
Trp Urea
Glycerol Indole
H2O
Permeability of a drug determines the rate of diffusion
+H3N CH C
CH2
O-
O
HNHN
N N C H 3
Nicotine
O
H
HO
H
HOH
H
OHH
OH
OH
51

Chemical transport and pH: The chemistry of nicotine delivery
• Nicotine ~ addictive component of cigarette smoke ~ tertiary amine - acid/base chemistry
• Bioavailability of nicotine is affected by pH ~ Uncharged/base form: volatile; vapor phase (rapid uptake) ~ Charged/acid form: non-volatile; particulate phase (slow uptake)
• Manufacturers control pH of cigarette smoke to control nicotine uptake
• Flue-cured tobacco: pH <6; air-cured dark tobacco: pH >7 - more nicotine?
RNH + +3 ↔ RNH2 + H
Ka = [RNH2][H+] [RNH +
3 ]
pKa = -log(Ka)
pH = -log[H+]
N
N
CH3
Nicotine
N
N
H3C H
+
pKa ~ 8
H+
H+
Charged, acid form Uncharged, base form
Henderson-Hasselbalch equation:
pH = pKa + log([base]/[acid])
52

pH-Dependent diffusion of aspirin can influence toxicity
M E M B R A N E
O
O
CH3
O
OH
O
O
CH3
O
OH
O
O
CH3
O
O-
O
O
CH3
O
O-X X
1 μM
7943 μM
1 μM
0.032 μM
pH 7.4 Intracellular
pH
pH 2 Stomach
lumen
O
+Ka = 10-3.5
O
CH3
O
OH
O
O
CH3
O
O-
H+
High concentration of aspirin inside gastric epithelial cells if mucous layer disturbed
53
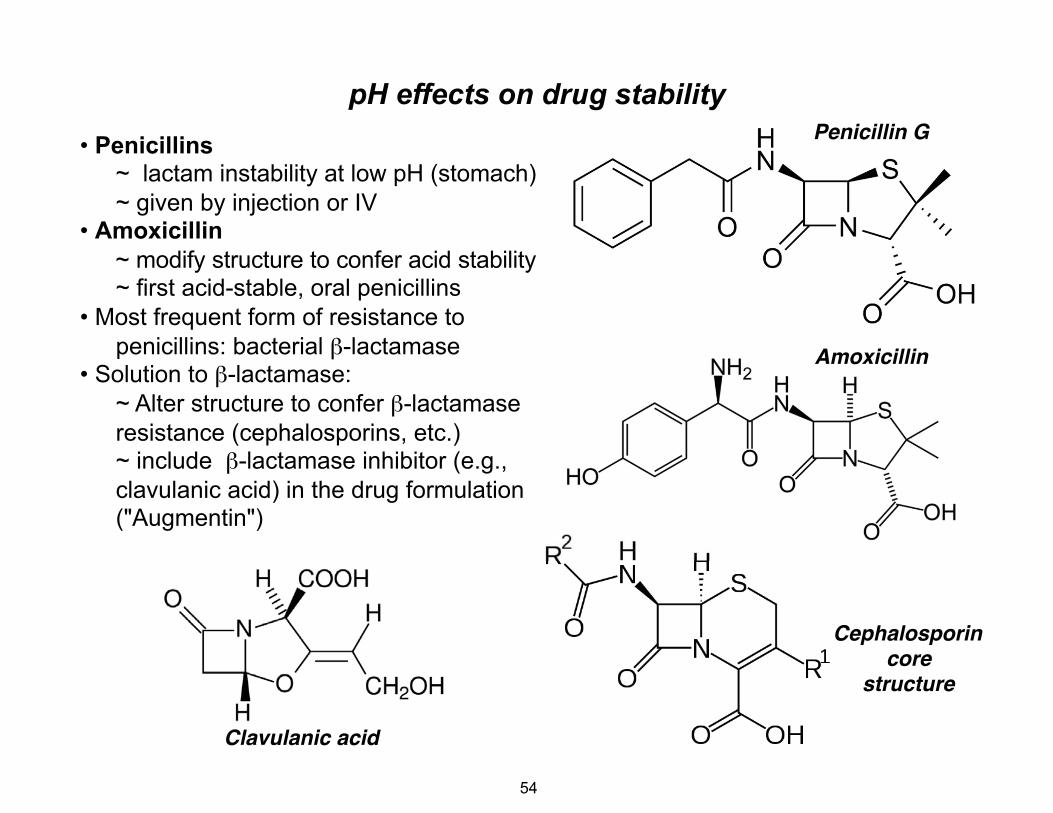
pH effects on drug stability • Penicillins
~ lactam instability at low pH (stomach) ~ given by injection or IV
• Amoxicillin ~ modify structure to confer acid stability ~ first acid-stable, oral penicillins
• Most frequent form of resistance to penicillins: bacterial β-lactamase
• Solution to β-lactamase: ~ Alter structure to confer β-lactamase resistance (cephalosporins, etc.) ~ include β-lactamase inhibitor (e.g., clavulanic acid) in the drug formulation ("Augmentin")
Clavulanic acid�
Amoxicillin�
Penicillin G�
Cephalosporin�core �
structure�
54

Facilitated or carrier-mediated diffusion
• Simple diffusion is too slow for most physiologic substances: Example - glucose diffusion very slow: P ~ 10-7-10-8 cm/s
• Speed up diffusion by introducing a carrier protein in membrane: a "pore"
• Movement is still down
Inside
“Pump”
the concentration gradient of the chemical!
• Characteristics of facilitated diffusion: ~ Transport rate is greater than Fick's Law predicts: simple diffusion is too slow! ~ The transport protein is specific for a chemical structure ~ Transport is saturable: finite # binding sites on a protein and finite rate of transport
~ Obeys Michaelis-Menten kinetics
Vmax
V = 1/2Vmax when [Substrate] = Km
Substrate Concentration
Rate V
Facilitated Diffusion
Substrate Concentration
Rate
Simple Diffusion
Km
VV = max • [S]K m + [S]
L-glucose >3000 galactose 30mannose 20D-glucose 1.5
55

Predicting “drug-like behavior”
• Problem: Poor bioavailability and pharmacokinetics were major causes of drug failure for orally active drugs
• Problem: evolution of drug development to high-throughput screening of large, DMSO-solvated drug libraries (combinatorial) led to drug structures with potentially undesirable properties: large size, poor water solubility, high lipophilicity
• Problem: how to screen early drug leads for good behavior as an “orally active drug”?
• Christopher Lipinski (1997) studied thousands of successful drugs to determine which physicochemical properties accounted for successful orally active drugs: what was the structure of a drug that was well absorbed and pharmacokinetically well behaved?
Lipinski CA, Lombardo F, Dominy BW, Feeney PJ (2001) Experimental and computational approaches to estimate solubility and permeability in drug discovery and development settings. Adv Drug Deliv Rev 46: 3–26
56

Predicting “drug-like behavior”
• Lipinski compared the structures of drugs that had entered Phase II clinical trials in the US
• Rationale: Phase II trials serve as a filter (albeit an expensive one!) for rejecting drug candidates that were poorly soluble, poorly permeable or poorly absorbed in the gut. Any drug making it into Phase II trials was a well behaved drug candidate.
• Lipinski selected 2500 drugs from World Drug Index, a computerized database of about 50000 drugs that had reached Phase II trials
• Collected data for several criteria for each drug: ~ Molecular weight –high molecular weight � poor permeability ~ Lipophilicity – Calculated LogP (P = octanol/H2O partition coefficient)
between -0.5 and 5 (not too lipophilic and not too polar) ~ # H-bond donors/acceptors – High # � poor membrane permeability
Lipinski CA, Lombardo F, Dominy BW, Feeney PJ (2001) Experimental and computational approaches to estimate solubility and permeability in drug discovery and development settings. Adv Drug Deliv Rev 46: 3–26
57

Predicting “drug-like behavior”:Lipinski’s “Rule of 5”
• A well behaved, orally active drug should have: ~ less than 5 H-bond donors ~ less than 10 H-bond acceptors “Rule of 5” ~ molecular weight less than 500 ~ MLogP less than 5
• Drugs exceeding one or more of these values has a high probability of failing
• Average values derived from the 2500 Phase II candidates studied:
~ MlogP = 1.80 ~ Molec. weight = 408 ~ H-bond donor = 2.53 ~ H-bond acceptor = 6.95
• Relatively good predictor: Alerts for possible poor absorption-12%
Lipinski CA, Lombardo F, Dominy BW, Feeney PJ (2001) Experimental and computational approaches to estimate solubility and permeability in drug discovery and development settings. Adv Drug Deliv Rev 46: 3–26
58

Strengths and weaknesses of LRO5 • Most drugs are intended for oral route of administration, but predicting oral
absorption and behavior is difficult
• LRO5 provides a computational tool to screen out the least “drug-like” molecules from a large library
• LRO5 increases the probability that a drug lead will have acceptable oral activity (bioavailability)
• However, LRO5 is very crude in its predictive power ~ Many LRO5 compliant molecules turn out to be poor drugs ~ LRO5 rules out the worst cases, so many bad candidates are missed
• Exceptions to LRO5 ~ Applies only to orally active drugs ~ Applies only to drugs absorbed by passive mechanisms (diffusion) ~ Does not apply to drugs with transporters involved in absorption
• Most drugs now appear to have transporters involved at some point in their
ADMET, so parallel LRO5 calculation and transporter assessment is critical
TH Keller, A Pichota, Z Yin Current Opinion in Chemical Biology 10: 357–361, 2006
59

Octanol
Water
LogP and the activity of a drug
P = Concentration in organic solvent
• IUPAC definition of lipophilicity: “�represents the affinity of a molecule or moiety for a lipophilic environment. It is commonly measured by its distribution in a biphasic system (e.g., partition coefficient in octanol-water).”
Concentration in water
• Lipophilicity is usually a major factor involved in determining the biological activity of a drug
• Rule of thumb: Optimize/minimize LogP to reduce toxicity, non-specific binding, increase bioavailability.
Adapted from John Comer, CSO, Sirius Analytical Ltd.
60

• Relationships between Log P and activity vary :
Linear: Activity= m•log P + k Parabolic: Activity= m•log P - c(log P)2 – k Rectilinear: Activity= m•log P – c(blog P +1) – k
• Most useful relationships between activity and physico-chemical
parameters (e.g., LogP, pKa) come from multivariate statistical analysis.
• Correlation of LogP with activity is mostly empirical - organic solvents are simple models of lipid bilayers etc. and cannot explain everything.
• CNS, gastric absorption: parabolic LogP relationship holds (Log P ~2±1), from experiments relating radiolabelled compounds and behavior.
• Sophisticated analysis of molecular properties such as “partial charged surface area” and H-bonding properties better predict oral absorption.
LogP and the activity of a drug
61

LogP and the activity of a drug• Literature survey reveals general guidelines for optimal Log P values
for penetration or absorption: ~ CNS: LogP = 2 ~ Oral: LogP = 1.8 ~ Intestinal: LogP =1.4 ~ Colonic: LogP = 1.3
~ Sublingual: Log P = 5.5
• Formulation and dosing forms: ~ Low Log P (below 0) Injectable ~ Medium (0-3) Oral ~ High (3-4) Transdermal
~ Very High (4-7) Toxic build up in fatty tissues
• Drug Clearance and Toxicity: ~ LogD7.4 >0: � renal clearance, � metabolic clearance. ~ High LogD7.4: metabolised by hepatic P450 enzymes. ~ High ionisation: keeps drugs out of cells, � systemic toxicity. ~ pKa 6~8 advantageous for membrane penetration
62

The battle between active and passive transport mechanisms
From John Comer, CSO, Sirius Analytical Ltd.
63
Active transport • Emerging appreciation for major role of active transport in drug
uptake and distribution
• Transport proteins that require chemical energy source
• Can occur up a concentration gradient
• Primary active transport ~ ATP hydrolysis as energy source ~ E.g.: p-glycoprotein (P-GP), multi-drug resistance protein (MRP)
• Secondary active transport ~ Ion gradients generated by 1° transport provide energy for transport of drugs up a concentration gradient ~ Co-transport and counter-transport ~ Examples: Na+-taurocholate cotransporter; Na+/H+-antiporter
• Tertiary active transport ~ ion gradients from 2° transport drive molecules against electrochemical gradient ~ Example: OH-/HCO -
3 anion exchange
64
MIT OpenCourseWarehttp://ocw.mit.edu
20.201 Mechanisms of Drug ActionsFall 2013
For information about citing these materials or our Terms of Use, visit: http://ocw.mit.edu/terms.