lecture 4 jack tanabe old dominion university hampton, va january 2011 poisson a two-dimensional...
TRANSCRIPT
Lecture 4Jack Tanabe
Old Dominion UniversityHampton, VA January 2011
POISSONA Two-Dimensional Magnetostatic Solver

POISSON
• POISSON/SUPERFISH are a family of electric and electromagnetic codes, written originally by Klaus Halbach and Ron Holsinger. – Information regarding the code family and means of downloading
the codes can be obtained by contacting James H. Billen <[email protected]>
• It is a public access code (it’s free), maintained under contract with DOE by Los Alamos National Accelerator Laboratory (LANL) personnel.
• The LANL interest is mainly in the RF field, so the bulk of the development and maintenance of this family of codes is in the SUPERFISH area. Thus, maintenance and development of the magnetostatic capabilities is limited by funding and time.

Magnetostatic Elements• Four main code components are of interest to those involved in magnet
design. – Automesh.EXE
• Automesh is a automatic mesh generator. It takes input information written in a text file and generates a mesh of points written in several matrices used by POISSON or PANDIRA to solve the distribution of magnetic fields in a two dimensional magnet cross section.
– poisson.EXE• POISSON uses the Automesh output and solves for the vector potential distribution in
the two dimensional geometry by successive approximation using the relaxation method. It computes the field distribution from the vector potential distribution.
– pandira.EXE• PANDIRA solves for the vector potential by diagonalizing the matrix.
– Wfsplot.EXE• WFSPLOT is a graphics routine which can present either the lattice geometry from
Automesh or the Vector equi-potentials resulting from POISSON or PANDIRA solutions.

Program Flow Chart
• The structure of the information flow for the POISSON/Pandira program group is shown in the diagram.
• A text file is written which includes all the information required to define the problem.
– If WFSPlot is run alt this point, the Tape35 file is used to graphically present the geometry information.
• AutoMesh is run using this file. Automesh overwrites the current Tape35 file.
• Poisson/Pandira is run using the current Tape35 file and overwrites the Tape35 file writeen by AutoMesh.
– WFSPlot is run using the current Tape35 file and creates a graphical output of the calculated results.
• Outpoi is a text file which is overwritten each time POISSON or Pandira is run.
• This file contains the information used in the program, including the BH curve called in the .txt file.
• Parts of this file (the results of the edit) can be copied and used to present the results of the calculations.

Text File
Sample Problem Simple Dipole!First two lines in the text file are the title and descriptors for the problem. !These titles will be carried in subsequent output files. !mat=1 means air region, =2 means iron region using the internal iron BH properties. !kprob=0 means POISSON problem!mode=0 means finite permeability using one of the tables!xmin, xmax, ymin, ymax are the physical horizontal and vertical limits of the problem.! xreg1 and kreg1 are the x value for the mesh with kreg1 nodes. kmax is the no. of k !nodes. More regions defined by xreg2, kreg2, etc. are possible. ! yreg1 and lreg1 are the y value for the mesh with lreg1 nodes. lmax is the no. of l nodes.! icylin=0 is Cartesian Coordinates, =1 is cylindrical coordinates.! xminf, xmaxf, yminf, ymaxf are the physical limits for the data output limits. ktop and !ltop are the number of data output points over the limits. Example, xminf=-30, !xmaxf=30, ktop=13 means that the output edit data will have 13 entries from -30 to +30 !mm at 5 mm. increments. ienergy=1 means that the stored energy will be computed. ! nbsup, nrslo, nbsrt, nbslf are boundary condition for UPper, LOwer, RTside, LFside.! =0 and 1 mean Dirichlet and Neumann Boundaries, respectively. ! conv=1 is the default for cm. =.1 is for mm, =2.54 is for inches.! The following are the CONS for the harmonic analysis.! ktype=124. First integer =1 dipole, 2 quadrupole.!Second integer =2 means multipole inteval. Third integer =1 means midplane !symmetry, =0 skew terms. ! nptc=30 number of arc points, nterm=number of terms, rint=35 mm interpolation radius, !rnorm=32 mm normalization radius. !angle=180 maximum angle, anglz=0 starting point for interpolation.
A portion of a text file written for a dipole geometry is shown. The first two lines of the file are title lines which are carried throughout the calculations. All the lines shown are preceded by a ! sign, which indicates that these are comments.

• This text file defines a dipole geometry.
$reg mat=1, kprob=0, mode=0,conv=.1,xmin=0,xmax=150., kmax=50,ymin=0, ymax=100., lmax=50, icylin=0, xminf=0., xmaxf=25,ktop=11yminf=0.0, ymaxf=10,ltop=5 ktype=121,nptc=31 nterm=14,rint=20, rnorm=25, angle=90, anglz=0ienergy=1,nbsup=0, nbslo=1, nbsrt=0, nbslf=0$
The first section defines the problem constraints. Note that $reg is used before and $ after this input section.
Air Region Poisson/PandiraProblem
Finite PermeabilityUsing Table
0.1 is for mm.1 is for cm. 2.54 is for inch
x and y limitsk and l limits No cylindrical
symmetryicylin=1 is cylindrical
symmetry problem

• The last part of the first section describes the edit constraints.
$reg mat=1, kprob=0, mode=0,conv=.1,xmin=0,xmax=150., kmax=50,ymin=0, ymax=100., lmax=50, icylin=0, xminf=0., xmaxf=25,ktop=11yminf=0.0, ymaxf=10,ltop=5 ktype=121,nptc=31 nterm=14,rint=20, rnorm=25, angle=90, anglz=0ienergy=1,nbsup=0, nbslo=1, nbsrt=0, nbslf=0$
This section describes the limits of the output edit. The x limits are 0 to 25 mm, the y limits are 0 to 10 mm. 11 points are used for x (x=2.5 mm) and 5 points are used for y (x=2.0mm).
This line describes the edit for the Fourier analysis of the beam. Ktype=121 means (1=dipole, 2=multipole interval, 1= midplane Neumann boundary, third digit 0= midplane Dirichlet boundary. nptc=31 means number of points on the circle, rint=20 means interpolation on 20 mm radius arc, rnorm=25 means multipole normalization at 25 mm, angle=90 and anglez=0 means the edit points are from 0 to 90 degrees. nterm=14 means the maximum number of multipole terms.
ienergy=1 means calculate the stored energy in joules/meter. ienergy=0 means don’t calculate the stored energy.
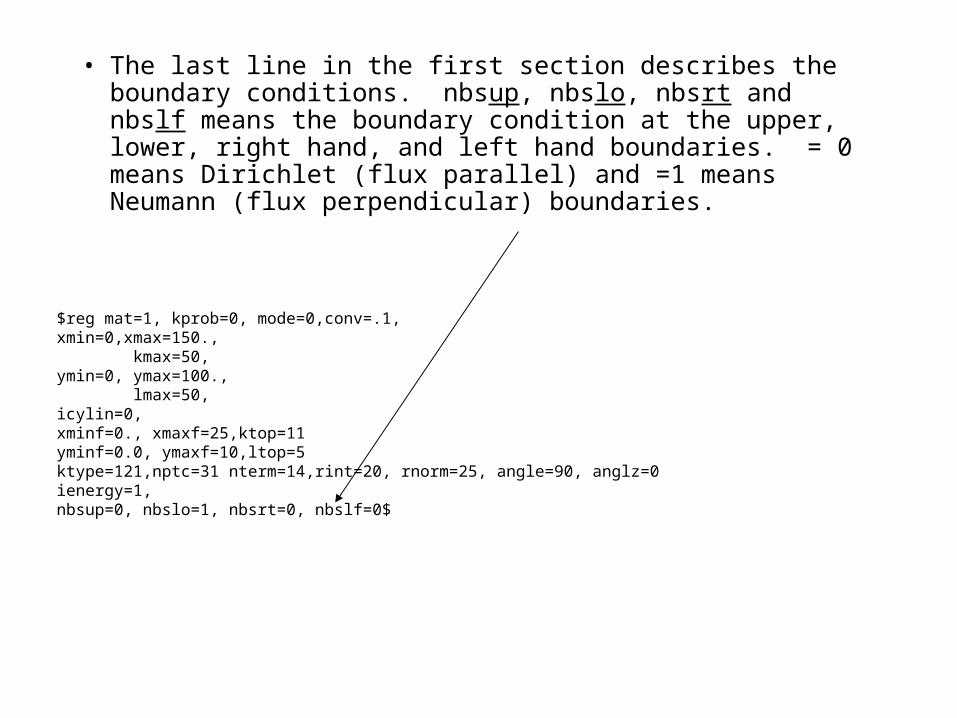
• The last line in the first section describes the boundary conditions. nbsup, nbslo, nbsrt and nbslf means the boundary condition at the upper, lower, right hand, and left hand boundaries. = 0 means Dirichlet (flux parallel) and =1 means Neumann (flux perpendicular) boundaries.
$reg mat=1, kprob=0, mode=0,conv=.1,xmin=0,xmax=150., kmax=50,ymin=0, ymax=100., lmax=50, icylin=0, xminf=0., xmaxf=25,ktop=11yminf=0.0, ymaxf=10,ltop=5 ktype=121,nptc=31 nterm=14,rint=20, rnorm=25, angle=90, anglz=0ienergy=1,nbsup=0, nbslo=1, nbsrt=0, nbslf=0$

• Geometry Definition. Note that all regions must close, that is the first and last coordinates are equal. Each line must begin and end with $ or & sign.
!first region is air (mat=1), defines the problem limits. $po x=0, y=0$$po x=150, y=0$$po x=150, y=100$$po x=0, y=100$$po x=0, y=0$
!Coil$reg mat=1 cur=-20000$$po x=55, y=25 $$po x=75, y=25 $$po x=75, y=45 $$po x=55, y=45 $$po x=55, y=25$
!Iron Yoke$reg mat=2$$po x=0, y=25 $$po x=40, y=25$$po x=50, y=50$$po x=80, y=50$$po x=80, y=0 $$po x=120, y=0 $$po x=120, y=80$$po x=0, y=80$$po x=0, y=25$
Problem rectangular boundary. It uses the material definition given in the first section, mat=1 means air or vacuum.
Coil region is defined by its boundary, material specification mat=1 and the current value in Amps. Negative currents in the right hand coil gives positive flux on the horizontal centerline. Coil regions can be single points and/or lines.
The iron yoke area uses mat=2, which uses the BH curve for a “generic” iron whose magnetic properties approximate the behavior of 1010 steel.

Lattice Text Writing Techniques• I find it easier to develop the geometry lattice using the Excel.
$po x=, y=
boundary $xb yb
0 0 $po x=0, y=0$150 0 $po x=150, y=0$150 100 $po x=150, y=100$
0 100 $po x=0, y=100$0 0 $po x=0, y=0$
Coilxc yc
55 25 $po x=55, y=25$75 25 $po x=75, y=25$75 45 $po x=75, y=45$55 45 $po x=55, y=45$55 25 $po x=55, y=25$
Yokexy yy
0 25 $po x=0, y=25$40 25 $po x=40, y=25$50 50 $po x=50, y=50$80 50 $po x=80, y=50$80 0 $po x=80, y=0$
120 0 $po x=120, y=0$120 80 $po x=120, y=80$
0 80 $po x=0, y=80$0 25 $po x=0, y=25$
-50
0
50
100
150
-50 0 50 100 150 200
yy
yc
yb
=CONCATENATE(C$1,A5,C$2,B5,C$3)
Copy and Paste

Symmetric Quadrupole• $reg mat=1, kprob=0, mode=0,conv=.1• xmin=0, xreg1=50.0, xreg2=235, xmax=301.65, • kreg1=60, kreg2=200, kmax=220,• ymin=0.0, yreg1=30.0, yreg2=108, ymax=301.65,• lreg1=40, lreg2=120, lmax=220, • icylin=0, • xminf=0, xmaxf=230, • yminf=0, ymaxf=0, • ktype=4, • nbsup=0, nbslo=1, nbsrt=0, nbslf=1, • ktype=241,nptc=46 nterm=14,rint=30, rnorm=32.5, angle=45, anglz=0$• !first region is air (mat=1) • !problem type is poisson• $po x=0.0, y=0.0$• $po x=301.65, y=0.0$• $po x=301.65, y=301.65$• $po x=0.0, y=0.0$
• $reg mat=1 cur=10700$• $po x=128.175, y=55.152$• $po x=205.74, y=99.264$• $po x=230.190, y=56.655$• $po x=152.625, y=12.543$• $po x=140.4, y=33.848$• $po x=128.175, y=55.152$
Spear3 Quadrupole
S:\LANL3\Q.TXT 11-13-2000 12:54:24
0
50
100
150
200
250
300
0
50
100
150
200
250
300
0 50 100 150 200 250 300 350 400

• $reg mat=1 cur=135$
• $po x=117.380, y=48.379$
• $po x=128.175, y=55.152$
• $po x=140.4, y=33.848$
• $po x=129.605, y=27.075$
• $po x=117.380, y=48.379$
•$reg mat=2$•$po x=24.75, y=24.75$•$po x=25.124,y=24.382$•$po x=26.482,y=23.129$•$po x=29.063,y=21.075$•$po x=31.731,y=19.296$•$po x=34.429,y=17.798$•$po x=37.159,y=16.679$•$po x=38.959,y=16.097$•$po x=39.768,y=15.647$•$po x=40.494,y=15.006$•$po x=41.171,y=14.227$•$po x=41.905,y=13.615$•$po x=42.7,y=13.215$•$po x=43.544,y=13.022$•$po x=45.902,y=13.0$•$po x=46.436,y=13.093$•$po x=46.683, y=13.206$•$po x=119.38, y=53.379$•$po x=130.175, y=60.152$•$po x=207.740, y=104.264$•$po x=232.19, y=61.655$•$po x=232.19, y=0.0$•$po x=301.65, y=0.0$•$po x=301.65, y=301.65$•$po x=24.75, y=24.75$
•$reg ibound=0$•$po x=0., y=0.0$•$po x=24.75, y=24.75$•$po x=301.65, y=301.65$
A line boundary region defines the Neumann boundary condition along a diagnoal line.

Using POISSON in Conformally Mapped Geometries
• In addition to analyzing the performance of a high performance geometry, POISSON can be used analyze the performance of mapped geometry. However, the mapping algorithm is highly nonlinear. Therefore, when a dipole geometry (which is well understood) is mapped into a quadrupole geometry, the entire quadrupole area is highly distorted and the boundaries of the extremities of the geometry can be very large compared to the area where the fields need to be resolved.
• Because of this limitation, means of modeling a smaller boundary in the quadrupole space needs to be understood.

Conformal Mapping
• The figure shows the simple dipole (the baseline case) described in the earlier section of this lecture.
• The output edit instruction requested a vector potential edit on a circular boundary which enclosed the required good region and a portion of the pole.
$po x=, y=
boundary $xb yb
0 0 $po x=0, y=0$150 0 $po x=150, y=0$150 100 $po x=150, y=100$
0 100 $po x=0, y=100$0 0 $po x=0, y=0$
Coilxc yc
55 25 $po x=55, y=25$75 25 $po x=75, y=25$75 45 $po x=75, y=45$55 45 $po x=55, y=45$55 25 $po x=55, y=25$
Yokexy yy
0 25 $po x=0, y=25$40 25 $po x=40, y=25$50 50 $po x=50, y=50$80 50 $po x=80, y=50$80 0 $po x=80, y=0$
120 0 $po x=120, y=0$120 80 $po x=120, y=80$
0 80 $po x=0, y=80$0 25 $po x=0, y=25$
-50
0
50
100
150
-50 0 50 100 150 200
yy
yc
yb
=CONCATENATE(C$1,A5,C$2,B5,C$3)
Copy and Paste
Mapping the dipole (w-space) into quadrupole (z-space) maps half the angle and generates a mesh where the corner of the dipole maps into a very large multiple of the magnet gap, h.

Review from Lecture #3Mapping a Dipole into a Quadrupole
• In order to map the dipole into the quadrupole, we use the polar forms of the functions;
ieww iezz and
Since was used to convert the quadrupole into the dipole, .iewhhwz 2
h
zw
2
iiezewhz 2 whz
2
therefore; and
Finally; 2coscos
whzx
2sinsin
whzy

Simple Dipole
Z:\Private\S-Drive\Private\LANL3\DBOUND1.TXT 4-05-2004 15:45:36
0
10
20
30
40
50
60
70
80
90
100
0
10
20
30
40
50
60
70
80
90
100
0 20 40 60 80 100 120 140
Simple Dipole Vector Potential Boundary Condition
Z:\Private\S-Drive\Private\LANL3\DBOUND2.TXT 4-05-2004 16:15:48
0
5
10
15
20
25
30
35
40
45
50
55
0
5
10
15
20
25
30
35
40
45
50
55
0 10 20 30 40 50 60 70 80
Harmonic analysisInterpolated points on an arc of radius = 58.95centered at (XORG,YORG) = (0.0,0.0)K,L is nearest mesh point to physical coordinates X,Y.n Angle X Y K L Avector
1 0 58.95 0 40 1 -5.01E+042 5 58.7257 5.1378 40 5 -5.03E+043 10 58.0544 10.2366 40 8 -5.09E+044 15 56.9413 15.2574 39 12 -5.18E+045 20 55.3949 20.1621 38 16 -5.30E+046 25 53.4268 24.9133 36 19 -5.43E+047 30 51.0522 29.475 35 22 -5.54E+048 35 48.289 33.8123 33 26 -5.65E+049 40 45.1583 37.8923 31 29 -5.77E+04
10 45 41.6839 41.6839 29 32 -5.26E+0411 50 37.8923 45.1583 26 34 -4.69E+0412 55 33.8123 48.289 23 37 -4.07E+0413 60 29.475 51.0522 21 38 -3.44E+0414 65 24.9133 53.4268 18 40 -2.82E+0415 70 20.1621 55.3949 15 42 -2.21E+0416 75 15.2574 56.9413 11 43 -1.63E+0417 80 10.2366 58.0544 8 44 -1.07E+0418 85 5.1378 58.7257 5 44 -5.31E+0319 90 0 58.95 1 44 -3.83E-11
The upper figure is the POISSON solution for the full quadrupole. The text file is from the POISSON edit where the values of the vector potential is evaluated on a fixed radius enclosing the pole tip and the required good field region. The lower figure is the POISSON calculation using a mesh in which the vector potential values are used for the boundary condition.

Spear3 Quadrupole - Conformal Map
Z:\Private\S-Drive\Private\LANL3\QCMAP.TXT 4-08-2004 16:18:52
0
10
20
30
40
50
60
70
0
10
20
30
40
50
60
70
0 10 20 30 40 50 60 70 80 90 100
Spear3 Quadrupole Vector Potential Edit
Z:\Private\S-Drive\Private\LANL3\Q2.TXT 4-07-2004 15:00:26
0
5
10
15
20
25
30
35
40
45
50
0
5
10
15
20
25
30
35
40
45
50
0 10 20 30 40 50 60 70
Spear3 Quadrupole Vector Potential Edit
Z:\Private\S-Drive\Private\LANL3\Q2ZERO.TXT 4-13-2004 11:48:46
0
5
10
15
20
25
30
35
40
45
50
0
5
10
15
20
25
30
35
40
45
50
0 10 20 30 40 50 60 70
A
B
C
•A is the quadrupole POISSON flux plot from the dipole mesh using the vector potential boundary.•B is an “optimized” dipole contour.•C is the POISSON flux plot from the mapped “optimized pole contour.

Spear3 Quadrupole
S:\LANL3\Q.TXT 11-13-2000 12:54:24
0
50
100
150
200
250
300
0
50
100
150
200
250
300
0 50 100 150 200 250 300 350 400
The final Poisson flux plot describes the field distribution using the actual quadrupole yoke and coil geometry.

• Although there are many commercial software packages which perform two and three dimensional magnet calculations, POISSON uses the “language” of magnetics and allows one to compute the vector potential around a boundary and performs the harmonic analysis which are used to track the beam in existing lattice codes.
• Most of the accelerator community uses this tool, thus it is the software package of choice for me.
• The individual student should investigate other packages which may be more user friendly. In particular, the meshing package for POISSON is rather weak and often does not have the flexibility nor is robust enough to generate difficult detailed meshes easily.

Homework• This lecture will be followed by a computer laboratory session.
– If you haven’t already done so, please read thoroughly and carefully chapter 6 of the text. Pay special attention to the section which presents the writing of the text file. An example writing the coordinates using a spreadsheet is illustrated by Fig. 4 on page 142 of the text.
• Familiarize yourself with Problem 6.1 on page 169 of the text. • The examples of the conformally mapped geometry, although
important, may take too much time to understand and to execute properly during this week. The student is encouraged to study the examples carefully and to run these, or similar cases, when he/she returns home.
• If you have the opportunity to do so, begin making the calculations of the parameters and the quadrupole poletip geometry and compute the current required to produce the required excitation in problem 6.1. – An expression needed to calculate this excitation is eq. 5.12 in chapter 5,
the chapter covered in lecture 6. – We will work together writing the text file and running POISSON during
the next session.

Lecture 5
• Chapter 4 of the text covers the material which will be presented in lecture 5, Perturbations.
• Although much effort can be invested to define pole geometry which will result in a uniform magnet, errors in fabrication, assembly or design assymetry can introduce error fields which can compromise the magnet performance.
• This chapter and lecture will cover the multipole field errors introduced in an otherwise perfectly designed magnet. – In many ways, these errors are much more important and damaging than
those limited by the design. – This is because these errors are lower order multipoles which vary as a
lower power of the radius and thus damp less quickly than the “allowed” multipoles.
• Understanding the next lecture will be enhanced if chapter 4 is read before the next lecture.