lecture 4: evaluating performance instructor: dimitris
TRANSCRIPT

CS2
50
4,
Sp
rin
g'2
00
7©
Dim
itri
s N
iko
lop
ou
los
CS2504: Computer Organization
Lectu
re 4
: Evalu
ati
ng P
erf
orm
ance
Inst
ructo
r: D
imit
ris
Nik
olo
poulo
s
Guest
Lectu
rer:
Matt
hew
Curt
is-M
aury

CS2
50
4,
Sp
rin
g'2
00
7©
Dim
itri
s N
iko
lop
ou
los 2
Understanding Perform
ance
�Why do we study perform
ance?
−Evaluate during design
−Evaluate before purchasing
−Key to understanding underlying organizational motivation
�How can we (meaningfully) compare two m
achines?
−Perform
ance, Cost, Value, etc
�Main issue:
−Need to understand what factors in the architecture
contribute to overall system perform
ance and the relative
importance of these factors
�Effects of ISA on perform
ance
�How will hardware change affect perform
ance

CS2
50
4,
Sp
rin
g'2
00
7©
Dim
itri
s N
iko
lop
ou
los 3
Airplane Perform
ance Analogy
1500
2000
4Fighter Jet
544
8720
146
Douglas DC-8-50
1250
4000
132
Concorde
610
4150
470
Boeing 747
610
4630
375
Boeing 777
Sp
ee
dR
an
ge
Pass
en
ge
rsA
irp
lan
e
�What metric do we use?
−Concorde is 2.05times faster than the 747
−747 has 1.74times higher throughput
−What about cost?
�And the winner is:
It Depends!
CS2
50
4,
Sp
rin
g'2
00
7©
Dim
itri
s N
iko
lop
ou
los 4
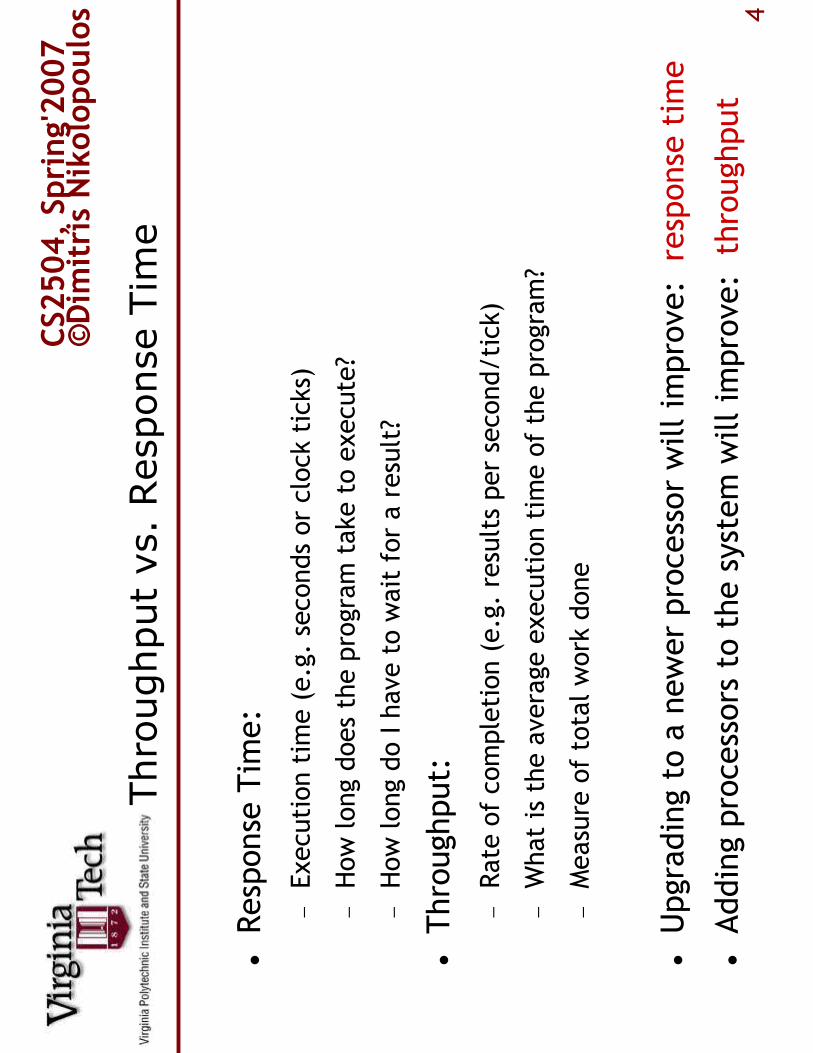
Throughput vs. Response Time
�Response Time:
−Execution time (e.g. seconds or clock ticks)
−How long does the program take to execute?
−How long do I have to wait for a result?
�Throughput:
−Rate of completion (e.g. results per second/tick)
−What is the average execution time of the program?
−Measure of total work done
�Upgrading to a newer processor will improve: response time
�Adding processors to the system will improve: throughput
CS2
50
4,
Sp
rin
g'2
00
7©
Dim
itri
s N
iko
lop
ou
los 5
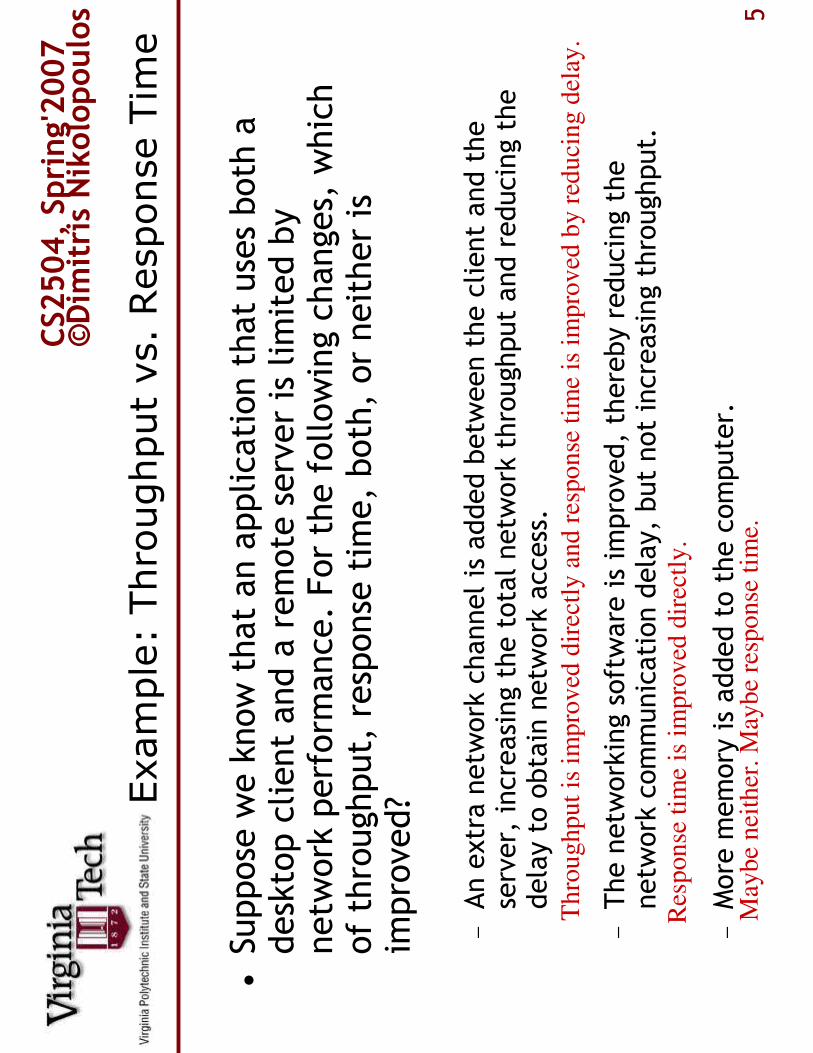
Example: Throughput vs. Response Time
�Suppose we know that an application that uses both a
desktop client and a remote server is limited by
netw
ork perform
ance. For the following changes, which
of throughput, response time, both, or neither is
improved?
−An extra netw
ork channel is added betw
een the client and the
server, increasing the total netw
ork throughput and reducing the
delay to obtain netw
ork access.
−The netw
orking software is improved, thereby reducing the
netw
ork communication delay, but not increasing throughput.
−More m
emory is added to the computer.
Th
rou
ghp
ut
is i
mp
rov
ed d
irec
tly a
nd
res
po
nse
tim
e is
im
pro
ved
by
redu
cing
del
ay.
Res
pon
se t
ime
is i
mp
rov
ed d
irec
tly.
May
be
nei
ther
. M
ayb
e re
spo
nse
tim
e.

CS2
50
4,
Sp
rin
g'2
00
7©
Dim
itri
s N
iko
lop
ou
los 6
Design Goals
•P
erfo
rma
nce
–m
axim
um
sp
eed
•C
ost–
circ
uit
siz
e
•V
alu
e–
bes
t p
rice
-per
form
ance
rat
io
•E
ner
gy–
leas
t en
ergy
con
sum
pti
on
CS2
50
4,
Sp
rin
g'2
00
7©
Dim
itri
s N
iko
lop
ou
los 7
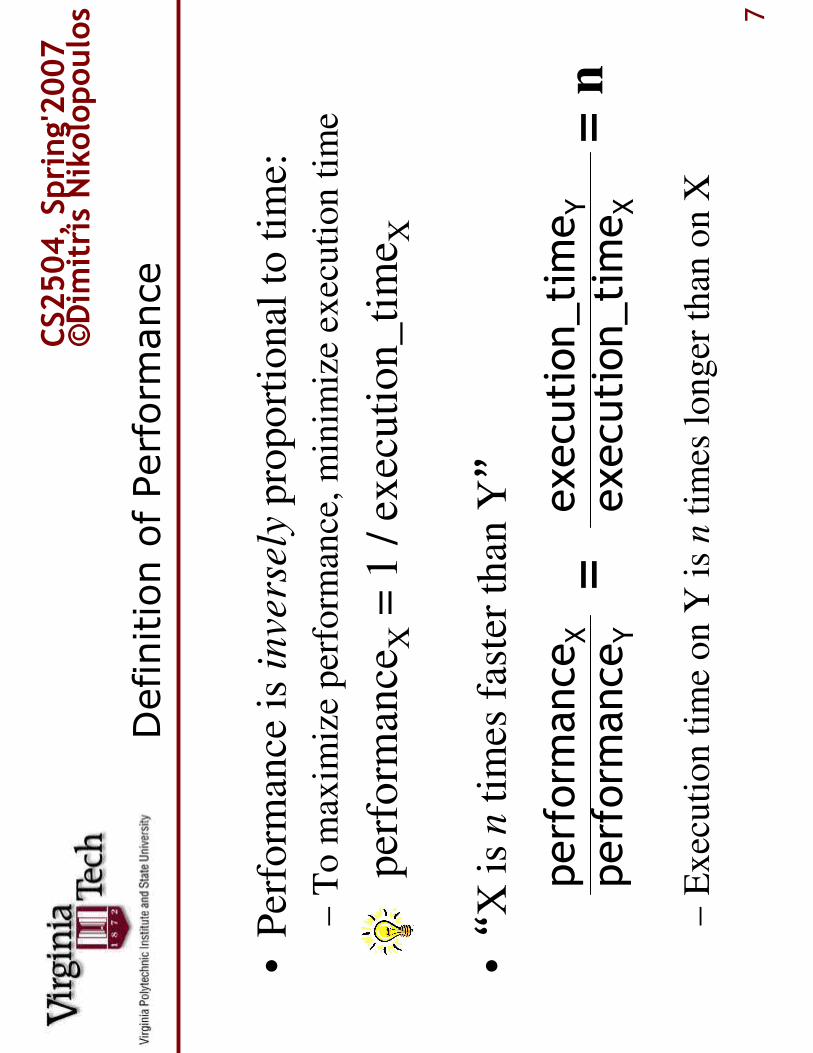
Definition of Perform
ance
•P
erfo
rman
ce i
s in
vers
ely
pro
po
rtio
nal
to
tim
e:
–T
o m
axim
ize
per
form
ance
, m
inim
ize
exec
uti
on
tim
e
per
form
ance
X=
1 /
ex
ecu
tio
n_
tim
e X
•“
X i
s n
tim
es f
aste
r th
an Y”
–E
xec
uti
on
tim
e o
n Y
is
nti
mes
lo
ng
er t
han
on
X
perform
ance
Xexecution_timeY
perform
ance
Yexecution_timeX
==
n

CS2
50
4,
Sp
rin
g'2
00
7©
Dim
itri
s N
iko
lop
ou
los 8
Example: Perform
ance Calculation
•A
par
ticu
lar
mu
ltip
roce
sso
r se
rver
mac
hin
e’s
per
form
ance
is
4 t
imes
bet
ter
than
a g
iven
un
ipro
cess
or
des
kto
p s
yst
em. If
th
e d
esk
top s
yst
em r
un
s an
app
lica
tio
n i
n 2
8 s
econ
ds,
how
lo
ng
wil
l it
tak
e on
th
e se
rver
?
per
form
ance
serv
er
28
sec
on
ds
per
form
ance
des
kto
p ti
me s
erver
tim
e ser
ver
= 2
8 /
4 =
7 s
econ
ds
==
4

CS2
50
4,
Sp
rin
g'2
00
7©
Dim
itri
s N
iko
lop
ou
los 9
Example: Relative Perform
ance
•If
a p
arti
cula
r d
esk
top
ru
ns
a p
rog
ram
in
60
sec
on
ds
and
a
lap
top
run
s th
e sa
me
pro
gra
m i
n 7
5 s
econ
ds,
ho
w
mu
ch f
aste
r is
th
e d
esk
top
th
an t
he
lap
top
?
Per
form
ance
des
kto
p=
1/e
xec
uti
on_ti
me d
esk
top
= 1
/60
Per
form
ance
lap
top
= 1
/exec
uti
on_ti
me l
apto
p=
1/7
5
Per
form
ance
des
kto
p/
Per
form
ance
lap
top
= (
1/6
0)/
(1/7
5)
= 1
.25
Or
sim
ply
: ex
ecuti
on_ti
me l
apto
p /
exec
uti
on_ti
me d
esk
top
= 1
.25
So
, th
e des
kto
p i
s 1
.25 t
imes
fas
ter
than
th
e la
pto
p

CS2
50
4,
Sp
rin
g'2
00
7©
Dim
itri
s N
iko
lop
ou
los
10
Real-time Constraints
•W
hat
are
rea
l-ti
me
syst
ems?
–S
yst
ems
wit
h “
op
erat
ion
al d
ead
lin
es f
rom
even
t to
syst
em r
espo
nse
”
•E
xam
ple
s of
real
-tim
e sy
stem
s:–
An
tilo
ck b
rak
e sy
stem
•H
ard r
eal-
tim
e
•M
ust
know
im
med
iate
ly i
f th
e bra
kes
hav
e lo
cked
–V
ideo
pla
yb
ack
•S
oft
rea
l-ti
me
•W
ant
to m
ake
most
dea
dli
nes
to a
void
im
age
jitt
er
•R
eal-
tim
e def
init
ion o
f per
form
ance
:–
“Are
th
e d
ead
lin
es m
et?”
–C
on
sequ
ence
s o
n d
esig
n:
min
imiz
e co
st t
o m
eet
dea
dli
nes
CS2
50
4,
Sp
rin
g'2
00
7©
Dim
itri
s N
iko
lop
ou
los
11
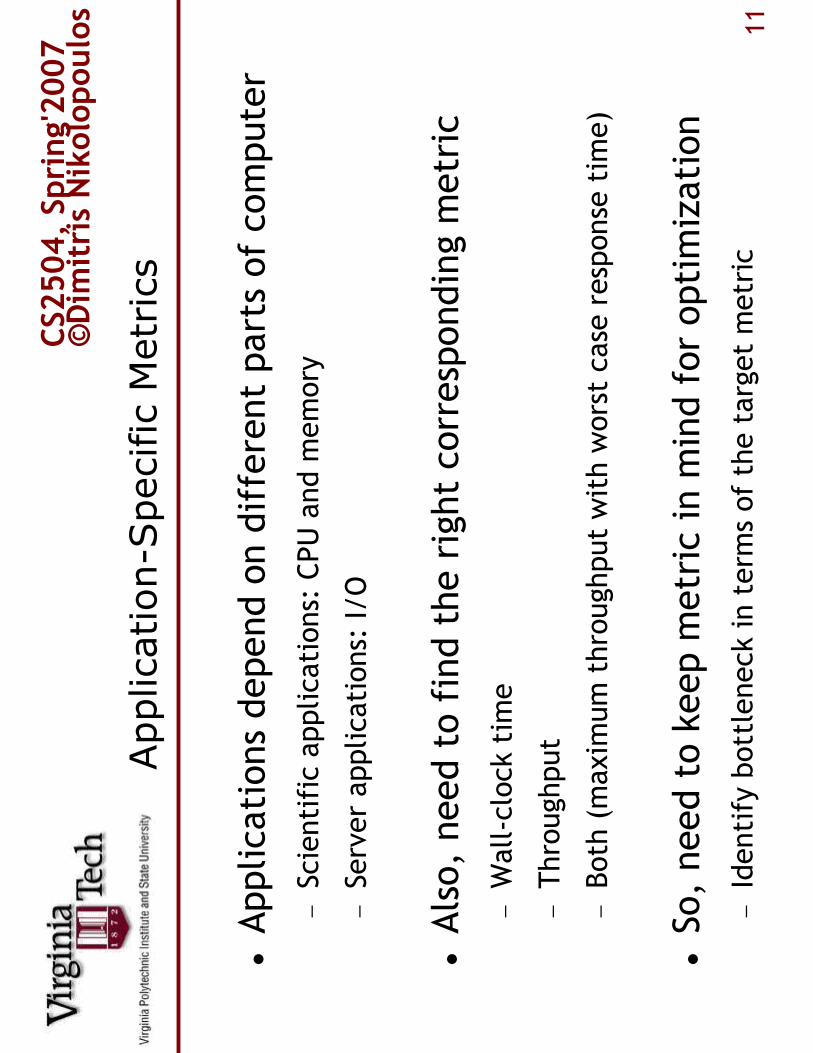
Application-Specific Metrics
�Applications depend on different parts of computer
−Scientific applications: CPU and m
emory
−Server applications: I/O
�Also, need to find the right corresponding metric
−Wall-clock time
−Throughput
−Both (maximum throughput with worst case response tim
e)
�So, need to keep m
etric in m
ind for optimization
−Identify bottleneck in term
s of the target metric

CS2
50
4,
Sp
rin
g'2
00
7©
Dim
itri
s N
iko
lop
ou
los
12
Measuring Execution Time
•T
ime
is t
he
ult
ima
tem
easu
re o
f p
erfo
rman
ce
–S
ame
work
in l
ess
tim
e =
bet
ter
per
form
ance
•M
ost
str
aig
ht-
forw
ard
def
init
ion
of
tim
e
–W
all-
clock
tim
e, r
esponse
tim
e, e
lapse
d t
ime
–T
ota
l ti
me
to c
om
ple
tion o
f a
task
•C
PU
tim
e
–A
mount
of
tim
e th
e ta
sk w
as a
ctual
ly e
xec
uti
ng
–D
oes
n’t
incl
ude
I/O
or
runnin
g o
ther
tas
ks
•W
e w
ill
gen
eral
ly u
se C
PU
tim
e

CS2
50
4,
Sp
rin
g'2
00
7©
Dim
itri
s N
iko
lop
ou
los
13
Clock Cycles
�Clock Cyclesare a direct m
easure of time
−Measures how fast the computer can perform
basic functions
−Discrete time interval in the CPU
�Clock periodis the tim
e for one clock cycle (seconds)
�Clock rate
is the inverse of clock period (cycles/second)
�5 nsec clock cycle => 200 MHz clock rate
�500 psec clock cycle => 2 GHz clock rate
�200 psec clock cycle => 5 GHz clock rate
on
e c
lock p
eri
od
CS2
50
4,
Sp
rin
g'2
00
7©
Dim
itri
s N
iko
lop
ou
los
14
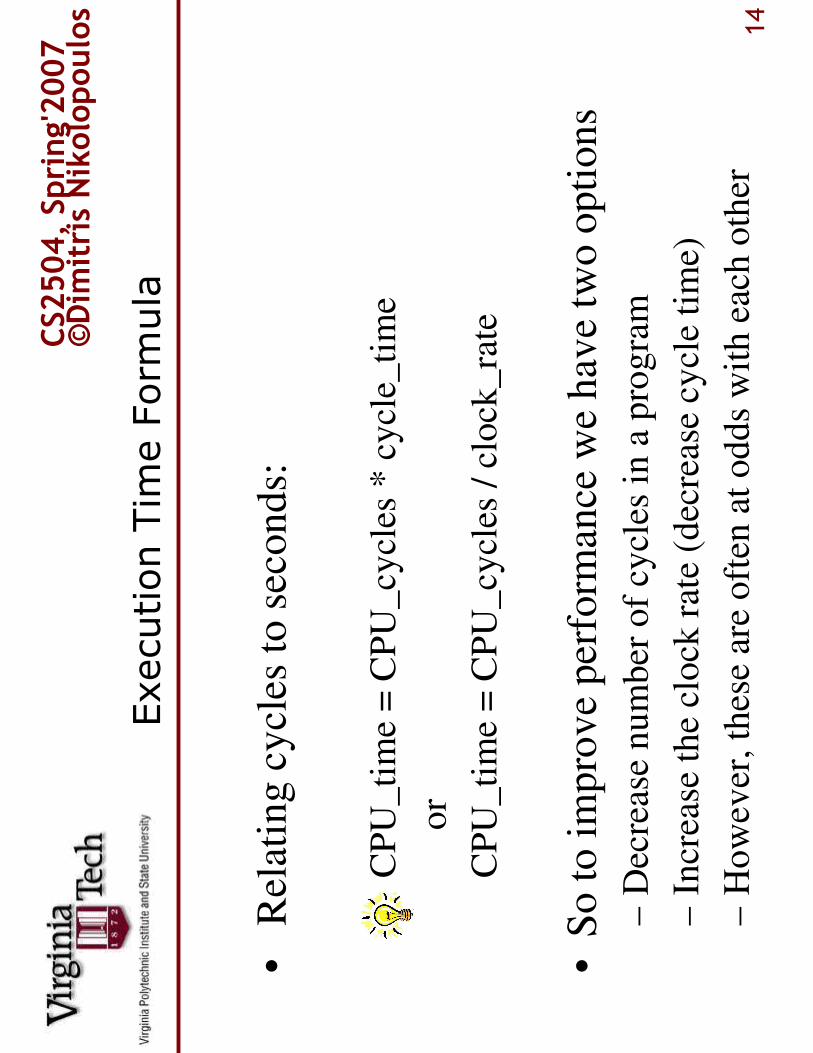
Execution Time Form
ula
•R
elat
ing
cy
cles
to s
econ
ds:
CP
U_
tim
e =
CP
U_
cycl
es *
cycl
e_ti
me
or
CP
U_
tim
e =
CP
U_
cycl
es /
clo
ck_
rate
•S
o t
o i
mp
rove
per
form
ance
we
hav
e tw
o o
pti
on
s
–D
ecre
ase
nu
mb
er o
f cy
cles
in
a p
rog
ram
–In
crea
se t
he
clo
ck r
ate
(dec
reas
e cy
cle
tim
e)
–H
ow
ever
, th
ese
are
oft
en a
t o
dds
wit
h e
ach
oth
er
CS2
50
4,
Sp
rin
g'2
00
7©
Dim
itri
s N
iko
lop
ou
los
15
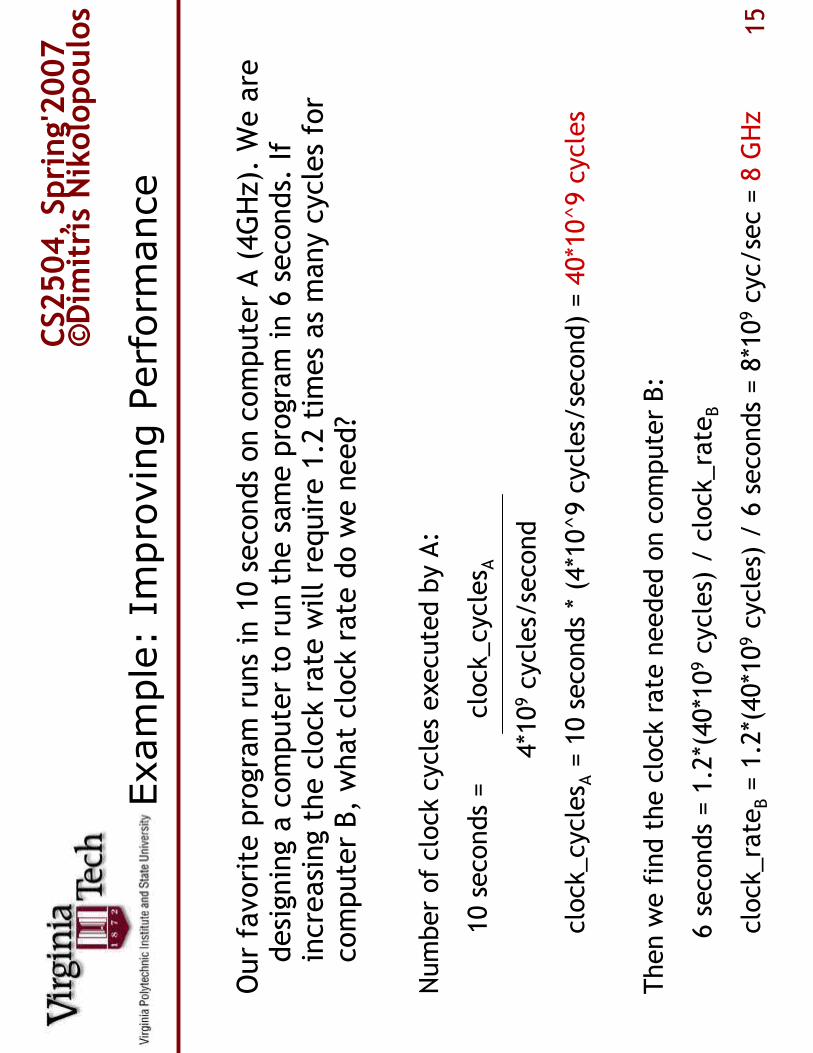
Example: Im
proving Perform
ance
Our favorite program runs in 10 seconds on computer A (4GHz). Weare
designing a computer to run the same program in 6 seconds. If
increasing the clock rate will require 1.2 times as many cycles for
computer B, what clock rate do we need?
Number of clock cycles executed by A:
10 seconds =
clock_cycles A
4*109cycles/second
clock_cycles A= 10 seconds * (4*10^9 cycles/second) = 40*10^9 cycles
Then we find the clock rate needed on computer B:
6 seconds = 1.2*(40*109cycles) / clock_rate
B
clock_rate
B= 1.2*(40*109cycles) / 6 seconds = 8*109cyc/sec = 8 GHz
CS2
50
4,
Sp
rin
g'2
00
7©
Dim
itri
s N
iko
lop
ou
los
16
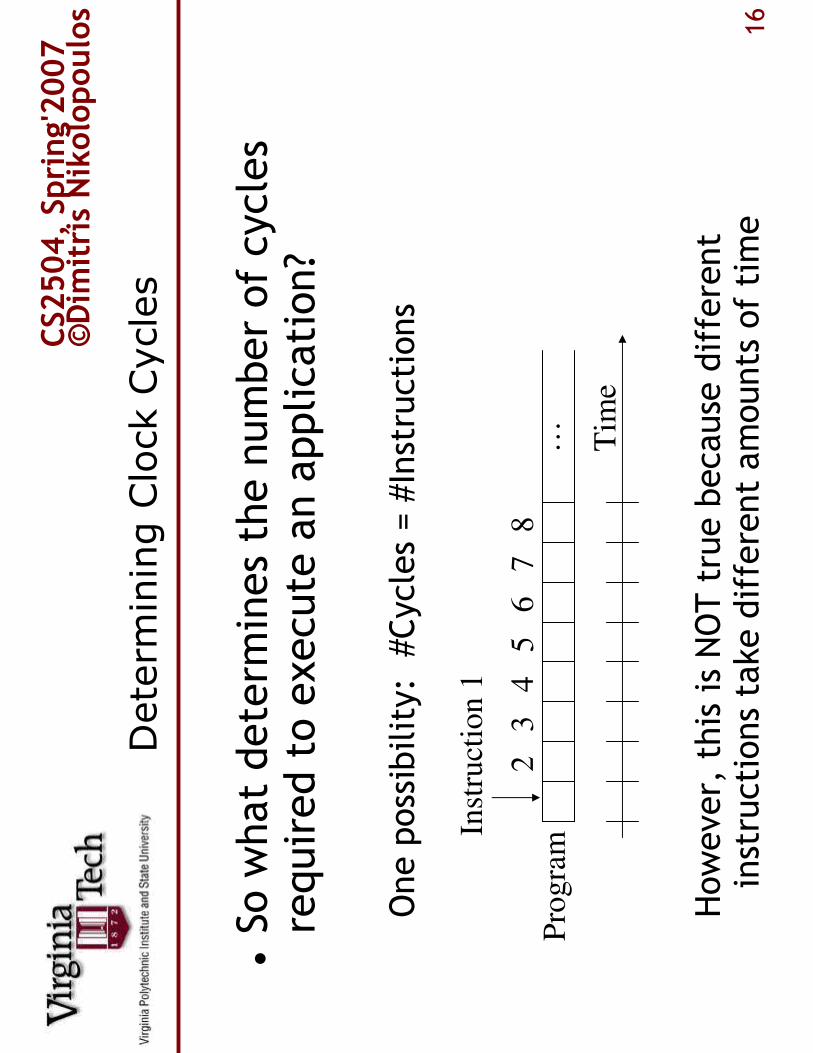
Determ
ining Clock Cycles
�So what determ
ines the number of cycles
required to execute an application?
One possibility: #Cycles = #Instructions
However, this is NOT true because different
instructions take different amounts of time
Tim
e
…
Inst
ruct
ion 1
23
45
67
8P
rogra
m

CS2
50
4,
Sp
rin
g'2
00
7©
Dim
itri
s N
iko
lop
ou
los
17
Determ
ining Clock Cycles
•A
mo
re r
eali
stic
pic
ture
of
wh
at’s
hap
pen
ing…
–F
loat
ing
poin
t o
per
atio
ns
can
tak
e lo
ng
er t
han
in
teg
er
–M
ult
ipli
cati
on
tak
es l
on
ger
th
an a
dd
itio
n
–M
emo
ry a
cces
ses
can
tak
e m
any
cy
cles
to
com
ple
te
Clo
ck c
ycl
es =
In
stru
ctio
ns
* A
vg
Cy
cles
Per
In
stru
ctio
n
Tim
e
…
Inst
ruct
ion 1
23
45

CS2
50
4,
Sp
rin
g'2
00
7©
Dim
itri
s N
iko
lop
ou
los
18
Example: Calculating Time
�Suppose we have two implementations of the same ISA.
Computer A has a cycle time of 250 ps and a CPI (cycles per
instruction) of 2.0 for some program, and computer B has a
cycle time of 500 ps and a CPI of 1.2 for the same program.
Which computer is faster for this program?
Note: A constant number of instructions will be executed:
I
clock_cycles A= I* 2.0 and clock_cycles B= I* 1.2
timeA= I* 2.0 * 250 ps = 500 * Ips and tim
eB= I* 1.2 * 500 ps = 600 * Ips
perform
ance
AtimeB
600 * I ps
perform
ance
BtimeA
500 * I ps
==
= 1.2
C
om
pu
ter
A i
s 1.2
tim
es f
ast
er

CS2
50
4,
Sp
rin
g'2
00
7©
Dim
itri
s N
iko
lop
ou
los
19
Clock Cycles per Instruction
�Then what is average Cycles Per Instruction?
−The average number of cycles each instruction takes
−A way to compare two implementations of one ISA
�CPI is dependent on the instruction m
ix
−This is the composition of different types of instructions in
an application
�Aware of variation in CPI by instruction type
−Averages across all instructions executed
−Specific to a given instruction sequence

CS2
50
4,
Sp
rin
g'2
00
7©
Dim
itri
s N
iko
lop
ou
los
20
Effective CPI
•M
axim
um
CP
I–
CP
I w
ith i
nst
ruct
ion m
ix o
f ex
clusi
vel
y t
he
short
est
inst
ruct
ion
•C
alcu
lati
ng c
lock
cy
cles
–IC
iis
the
num
ber
of
tota
l in
stru
ctio
ns
of
clas
s i
–C
PI i
is t
he
aver
age
CP
I fo
r in
stru
ctio
n c
lass
i
–n i
s th
e num
ber
of
inst
ruct
ion c
lass
es
–A
ccounts
for
the
wei
ght
and C
PI
of
each
inst
ruct
ion t
ype
•E
ffec
tiv
e C
PI
CP
I =
Clo
ck c
ycl
es /
Nu
mb
er o
f in
stru
ctio
ns
CPU Clock Cycles
=
Σ(CPI ix ICi)
i = 1
n
CS2
50
4,
Sp
rin
g'2
00
7©
Dim
itri
s N
iko
lop
ou
los
21
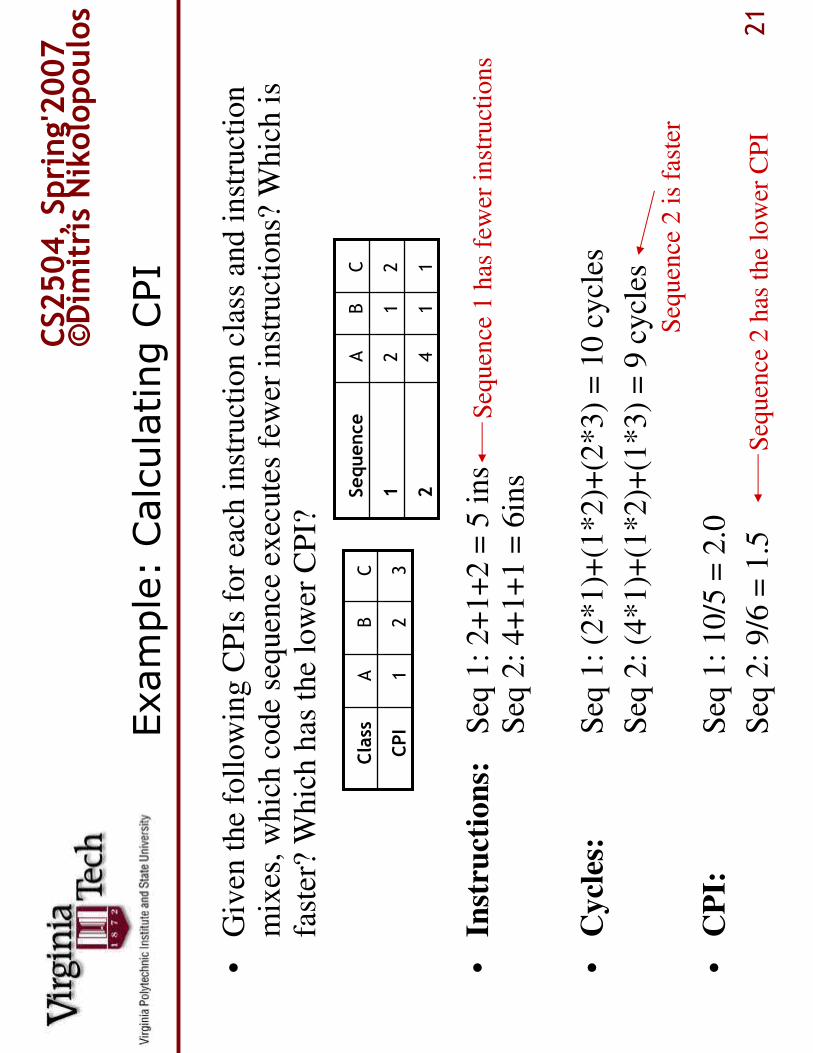
Example: Calculating CPI
•G
iven
the
foll
ow
ing C
PIs
for
each
inst
ruct
ion c
lass
and i
nst
ruct
ion
mix
es, w
hic
h c
ode
sequen
ce e
xec
ute
s fe
wer
inst
ruct
ions?
Whic
h i
sfa
ster
? W
hic
h h
as t
he
low
er C
PI?
•In
stru
ctio
ns:
Seq
1:
2+
1+
2 =
5 i
ns
Seq
2:
4+
1+
1 =
6in
s
•C
ycl
es:
Seq
1:
(2*1)+
(1*2)+
(2*3)
= 1
0 c
ycl
es
Seq
2:
(4*1)+
(1*2)+
(1*3)
= 9
cycl
es
•C
PI:
Seq
1:
10/5
= 2
.0
Seq
2:
9/6
= 1
.5
32
1C
PI
CB
AC
lass
11
42
21
21
CB
ASe
qu
en
ce S
equ
ence
1 h
as f
ewer
in
stru
ctio
ns
Seq
uen
ce 2
is
fast
er
Seq
uen
ce 2
has
th
e lo
wer
CP
I
CS2
50
4,
Sp
rin
g'2
00
7©
Dim
itri
s N
iko
lop
ou
los
22
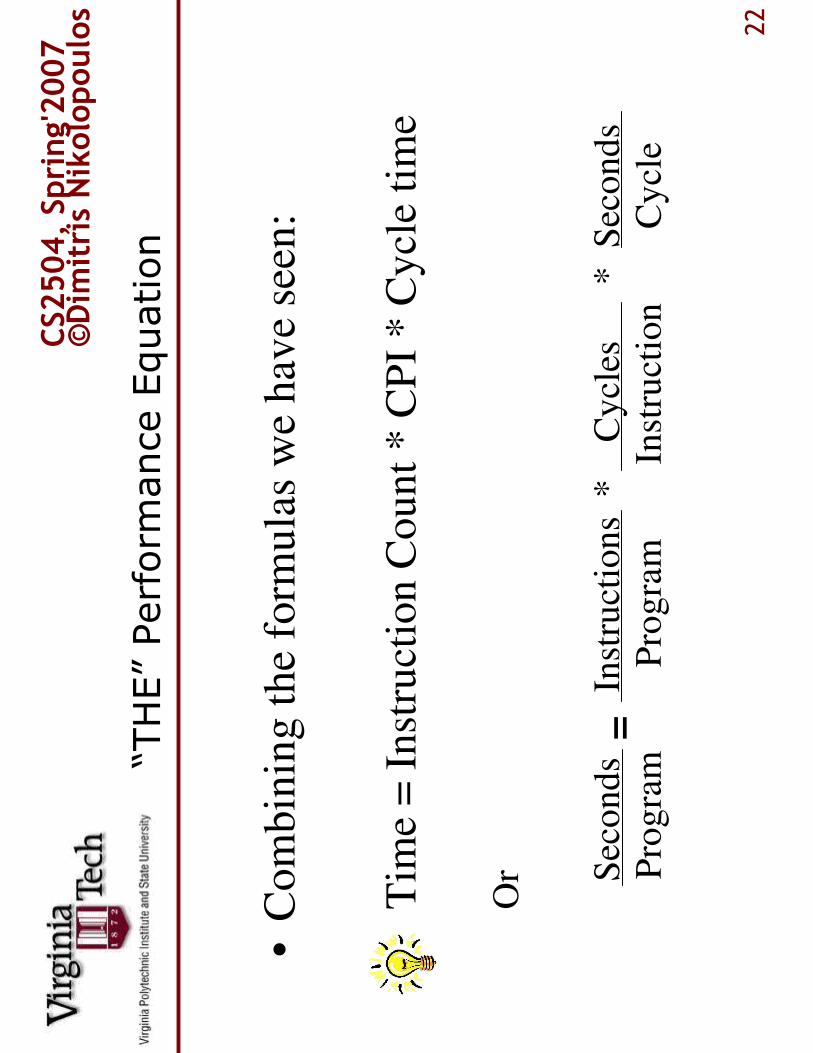
“THE” Perform
ance Equation
•C
om
bin
ing
th
e fo
rmu
las
we
hav
e se
en:
Tim
e =
In
stru
ctio
n C
oun
t *
CP
I * C
ycl
e ti
me
Or S
eco
nd
s
In
stru
ctio
ns
*
Cy
cles
* S
eco
nd
sP
rog
ram
Pro
gra
m
In
stru
ctio
n
C
ycl
e=

CS2
50
4,
Sp
rin
g'2
00
7©
Dim
itri
s N
iko
lop
ou
los
23
“THE” Perform
ance Equation
�Separates the three key perform
ance factors
−Instructions, CPI, Clock rate
�Can help evaluate design decisions
−Known effects on these term
s can be translated into the
overall effect on perform
ance
�How can the values of these term
s be found?
−Time: by running the program
−Clock rate: published by computer manufacturer
−Instructions and CPI:
�Hardware perform
ance counters –CPU logic to record events
�Simulation of the system
CS2
50
4,
Sp
rin
g'2
00
7©
Dim
itri
s N
iko
lop
ou
los
24
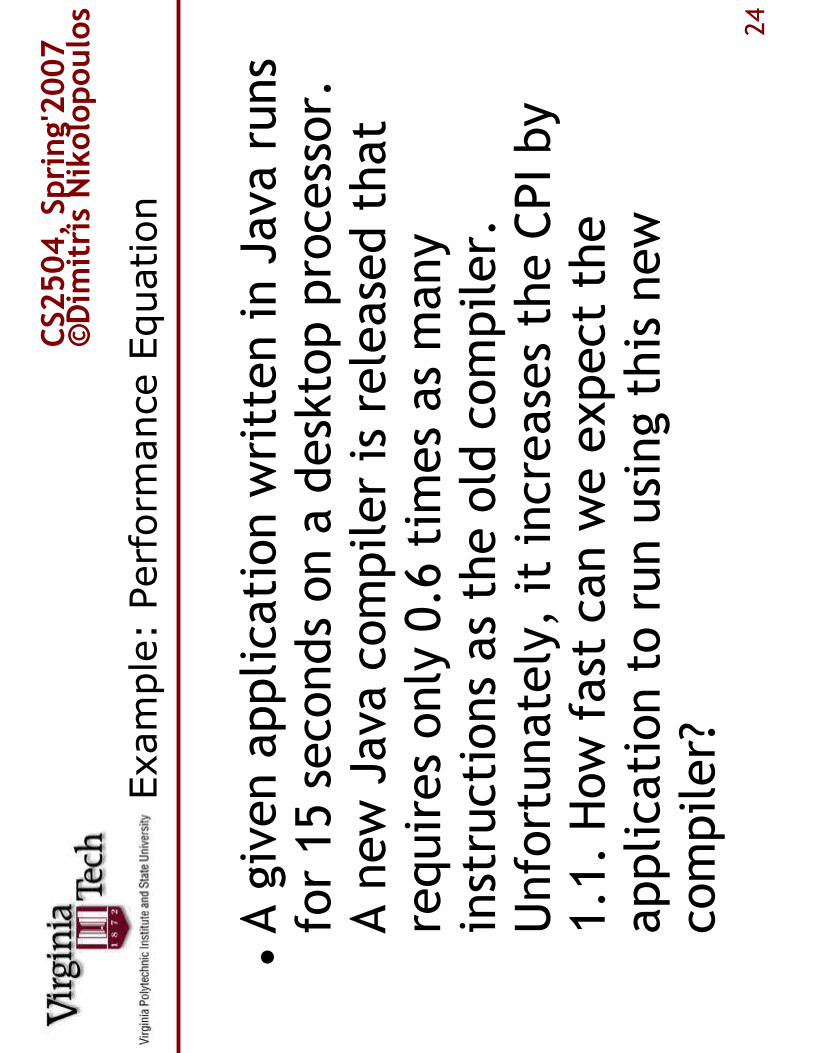
Example: Perform
ance Equation
�A given application written in Java runs
for 15 seconds on a desktop processor.
A new Java compiler is released that
requires only 0.6 times as many
instructions as the old compiler.
Unfortunately, it increases the CPI by
1.1. How fast can we expect the
application to run using this new
compiler?

CS2
50
4,
Sp
rin
g'2
00
7©
Dim
itri
s N
iko
lop
ou
los
25
MIPS Perform
ance
•M
IPS
is
an a
lter
nat
ive
met
ric
for
per
form
ance
–M
illi
on
inst
ruct
ion
s p
er s
econd
MIP
S =
In
stru
ctio
ns
/ (T
ime
* 1
06
)=
Clo
ck R
ate
/ C
PI
•In
ver
sely
pro
port
ional
to e
xec
uti
on t
ime
–B
igg
er n
um
ber
s in
dic
ate
bet
ter
per
form
ance
–In
tuit
ive
repre
sen
tati
on
•3 s
ignif
ican
t pro
ble
ms
wit
h M
IPS
usa
ge
–D
oes
n’t
co
nsi
der
wh
at t
he
inst
ruct
ions
actu
ally
do
–V
arie
s b
y p
rogra
m;
no
sin
gle
nu
mb
er f
or
a m
ach
ine
–C
an v
ary i
nv
erse
ly w
ith
per
form
ance
! (e
xam
ple
to
fo
llo
w)
CS2
50
4,
Sp
rin
g'2
00
7©
Dim
itri
s N
iko
lop
ou
los
26
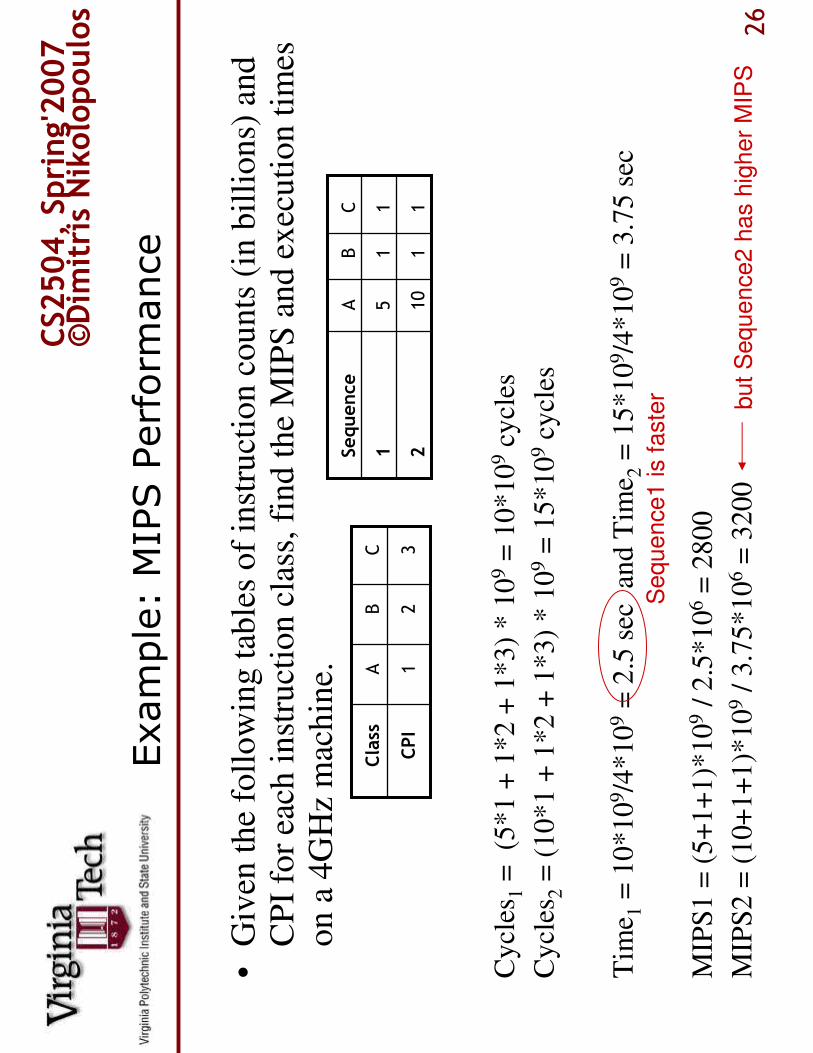
Example: MIPS Perform
ance
•G
iven
th
e fo
llo
win
g t
able
s o
f in
stru
ctio
n c
ou
nts
(in
bil
lio
ns)
and
C
PI
for
each
in
stru
ctio
n c
lass
, fi
nd
th
e M
IPS
an
d e
xec
uti
on
tim
es
on
a 4
GH
z m
ach
ine.
Cy
cles
1=
(5
*1
+ 1
*2
+ 1
*3
) *
10
9=
10
*1
09
cycl
es
Cy
cles
2=
(1
0*
1 +
1*
2 +
1*
3)
* 1
09
= 1
5*
10
9cy
cles
Tim
e 1=
10
*10
9/4
*1
09
= 2
.5 s
ec
and
Tim
e 2=
15
*1
09/4
*1
09
= 3
.75 s
ec
MIP
S1
= (
5+
1+
1)*
10
9/
2.5
*1
06
= 2
80
0
MIP
S2
= (
10+
1+
1)*
10
9/
3.7
5*1
06
= 3
20
0
32
1C
PI
CB
AC
lass
11
10
2
11
51
CB
ASe
qu
en
ce
Seque
nce1 is f
aste
r but
Seque
nce2
has h
igh
er
MIP
S

CS2
50
4,
Sp
rin
g'2
00
7©
Dim
itri
s N
iko
lop
ou
los
27
Determ
inates of Perform
ance
CPU time = Instruction_countx CPI x clock_cycle
XX
Algorithm
XX
Processor
organization
XX
XISA
XX
Compiler
XX
Programming
language
Clock_cycle
CPI
Instruction_
count

CS2
50
4,
Sp
rin
g'2
00
7©
Dim
itri
s N
iko
lop
ou
los
28
Determ
inates of Perform
ance
�Algorithm affects:
−Instruction count
�Determ
ines the number of source program
instructions, which affects the total number of
instruction executed
−CPI
�By favouring particular classes of instructions, the
algorithm can affect whether slower or faster
instructions are used
�For example can use m
ore floating point operations
and increase the CPI

CS2
50
4,
Sp
rin
g'2
00
7©
Dim
itri
s N
iko
lop
ou
los
29
Determ
inates of Perform
ance
�Programming language affects:
−Instruction count
�Statements in the language are translated to
processor instructions which determ
ine the
instruction count
−CPI
�The features of a programming language m
ay
influence the CPI because its features may translate
to slower or faster instructions
�For example indirect calls in Java are expensive

CS2
50
4,
Sp
rin
g'2
00
7©
Dim
itri
s N
iko
lop
ou
los
30
Determ
inates of Perform
ance
�Compiler affects:
−Instruction count
�The compiler determ
ines how to translate a high level
language into m
achine instructions, so it is directly
responsible
−CPI
�The compiler can translate the source code into high
or low CPI instructions, which affects the overall
average CPI
CS2
50
4,
Sp
rin
g'2
00
7©
Dim
itri
s N
iko
lop
ou
los
31
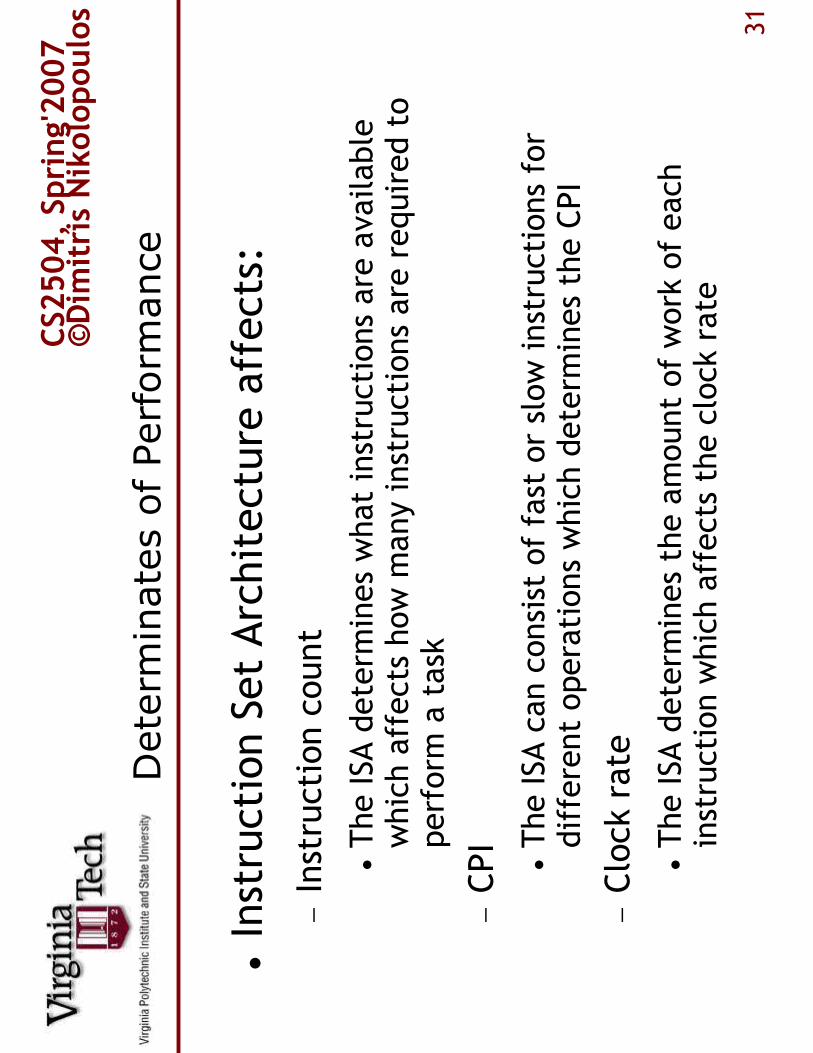
Determ
inates of Perform
ance
�Instruction Set Architecture affects:
−Instruction count
�The ISA determ
ines what instructions are available
which affects how m
any instructions are required to
perform
a task
−CPI
�The ISA can consist of fast or slow instructions for
different operations which determ
ines the CPI
−Clock rate
�The ISA determ
ines the amount of work of each
instruction which affects the clock rate

CS2
50
4,
Sp
rin
g'2
00
7©
Dim
itri
s N
iko
lop
ou
los
32
Determ
inates of Perform
ance
�Processor Organization affects:
−CPI
�The processor organization is the implementation of
instructions, so it determ
ines how long each
instruction will take to execute
−Clock rate
�The clock rate is affected by what work needs to be
done betw
een clock ticks, and this is determ
ined by
the processor organization

CS2
50
4,
Sp
rin
g'2
00
7©
Dim
itri
s N
iko
lop
ou
los
33
Examples: More CPI Calculations
•H
ow
mu
ch f
aste
r w
ou
ld t
he
mac
hin
e b
e if
a b
ette
r d
ata
cach
e re
du
ced t
he
aver
age
load
tim
e to
2 c
ycl
es?
•H
ow
do
es t
his
co
mp
are
wit
h u
sing
bra
nch
pre
dic
tio
n t
o s
hav
e a
cycl
e off
th
e bra
nch
tim
e?
•W
hat
if
two A
LU
ins
could
be
exec
ute
d a
t on
ce?
Σ=
220%
Branch
310%
Store
520%
Load
150%
ALU
Freq x CPI i
CPI i
Freq
Op
0.5
1.0
0.3
0.4 2.2
2.2
/1.6
m
eans 3
7.5
% f
aste
r
1.6
0.5
0.4
0.3
0.4
0.5
1.0
0.3
0.2
2.0
2.2
/2.0
m
eans 1
0%
faste
r
0.2
5
1.0
0.3
0.4
1.9
5
2.2
/1.9
5
mean
s 1
2.8
% f
aste
r
CS2
50
4,
Sp
rin
g'2
00
7©
Dim
itri
s N
iko
lop
ou
los
34
Now That We Understand Cycles
�A given program will require:
−Some number of instruction (machine ins)
−Some number of cycles
−Some number of seconds
�We now have the vocabulary to discuss how these
quantities relate to each other
−Cycle time (seconds/cycle)
−Clock rate (cycles/second)
−CPI (cycles/instruction)
−MIPS (Millions of instructions/second)

CS2
50
4,
Sp
rin
g'2
00
7©
Dim
itri
s N
iko
lop
ou
los
35
Perform
ance Traps
�Perform
ance is determ
ined by the execution time of the
program that you care about
�Do any of the other metrics equal perform
ance
−# of cycles to execute a program?
−# of instructions in a program?
−# of cycles per second?
−# of cycles per instruction?
−# of instructions per second (e.g. MIPS)?
�Common pitfall:
−Thinking that any one m
etric is representative of perform
ance
CS2
50
4,
Sp
rin
g'2
00
7©
Dim
itri
s N
iko
lop
ou
los
36
Evaluating Perform
ance
�How do we compare two computers, etc?
−Could rely on specs
�Difficult to interpret
�Not reliable betw
een architectures
�Better to actually run applications
−Execution time of applications can be m
etric
−These applications are called the w
orkload
�Ideal situation is a user with a fixed workload
−Run workload on both m
achines, compare times
−Find m
achine best for the user
−This situation is not very common
CS2
50
4,
Sp
rin
g'2
00
7©
Dim
itri
s N
iko
lop
ou
los
37
Workloads
�Perform
ance best determ
ined by running real applications
−Use programs typical of expected workload
−Pick workload containing expected properties
�Scientists will use scientific applications
�Software developers use compilers and word processors
�Select workload that emphasises the same resources
−On desktop systems
�CPU perform
ance
�DVD playback
�Graphics
−On server systems
�CPU perform
ance (scientific servers)
�File access times (file and web servers)

CS2
50
4,
Sp
rin
g'2
00
7©
Dim
itri
s N
iko
lop
ou
los
38
Benchmarks
�Bench
marksexist to represent many workloads
−Don’t have to find your own applications
−Generally agreed upon for reporting numbers
�Many popular bench
mark suitesto choose from
−SPEC (System Perform
ance Evaluation Corporation)
�CPU (INT+FP), W
eb, Mail, Java, Graphics, HPC
�Soon to publish Power and Virtualization benchmarks
−NAS (NASA Advanced Supercomputing)
�Parallel HPC applications
−EEMBC
�Embedded computing
CS2
50
4,
Sp
rin
g'2
00
7©
Dim
itri
s N
iko
lop
ou
los
39
Representative W
orkloads
�Five possible classes of applications:
−Real applications
−Modified applications (m
ost benchmarks are here)
−Kernels
−Toy benchmarks
−Synthetic benchmarks
�Each exists for different reasons
�Different reliability as benchmarks

CS2
50
4,
Sp
rin
g'2
00
7©
Dim
itri
s N
iko
lop
ou
los
40
Problems with Small Benchmarks
�Very attractive to designers
−Due to ease of compilation and sim
ulation (even by hand)
−Saves a lot of time in evaluation
−Easy to standardize
�Bad optimization target
−Can be trivially optimized
−Tailored to benchmark, not actual end-user workload
�Easily abused by designers
−Compiler optimizations enabled for specific app
−Generate possibly incorrect code for real app
�No excuse for their use on working computers

CS2
50
4,
Sp
rin
g'2
00
7©
Dim
itri
s N
iko
lop
ou
los
41
Reporting Results
�Reproducibilityis of the utm
ost importance
−List everything needed to duplicate the results
−Operating system, compiler, computer configuration
�Program input is also very important to consider
and to report
−Input can greatly affect program behavior
�Execute dominant vs. boundary cases
−Input size affects the perform
ance
�Larger inputs stress the m
emory system m
ore
�Must find representative input size

CS2
50
4,
Sp
rin
g'2
00
7©
Dim
itri
s N
iko
lop
ou
los
42
Summarizing Perform
ance
�Summarizing multiple results gives less info
−Preferable to have a single number
−Can simply compare single numbers betw
een
machines rather than complicated sets of numbers
�How do we come up with that single number?
−Obviously want it to be representative of perform
ance
−We’ve seen how complicated perform
ance can be

CS2
50
4,
Sp
rin
g'2
00
7©
Dim
itri
s N
iko
lop
ou
los
43
Comparing Perform
ance
•T
his
exam
ple
ill
ust
rate
s th
e d
iffi
cult
y
–C
om
pu
ter
A i
s 1
0 t
imes
fas
ter
than
B f
or
Pro
gra
m 2
–C
om
pu
ter
B i
s 1
0 t
imes
fas
ter
than
A f
or
Pro
gra
m 1
•S
imp
lest
app
roac
h:
use
to
tal
exec
uti
on t
ime
Per
form
ance
BT
ime A
10
01
Per
form
ance
AT
ime
B1
10
110
1001
Total
100
1000
Program 2
10
1Program 1
Computer B
Computer A
Time
==
=9
.1

CS2
50
4,
Sp
rin
g'2
00
7©
Dim
itri
s N
iko
lop
ou
los
44
Arithmetic Mean
�If applications will be run the same # of times
−Use the arithmetic mean
AM = 1/N * Σ
Tim
ei
�If applications will be run different # of times
−Use the w
eighted arith
metic mean
WAM = 1/N * Σ
Weight i* Timei
−Use weights corresponding to actual frequency
−Can choose weights to m
ake times equal on base
�AM is proportional to execution time
n
i =
1
n
i =
1

CS2
50
4,
Sp
rin
g'2
00
7©
Dim
itri
s N
iko
lop
ou
los
45
Geometric Mean
•T
he
geo
met
ric
mea
no
f a
coll
ecti
on
of
po
siti
ve
dat
a is
d
efin
ed a
s th
e n
th r
oot
of
the
pro
du
ct o
f al
l th
e m
emb
ers
of
the
dat
a se
t, w
her
e n
is t
he
nu
mb
er o
fm
emb
ers.
(W
ikip
edia
)
•S
ho
uld
be
use
d f
or
aver
agin
g n
orm
aliz
ed n
um
ber
s
–O
ver
com
es i
nco
nsi
sten
cies
of
AM
–W
ill
alw
ays
be
less
than
or
equal
to A
M
–S
ee:
“How
not
to l
ie w
ith s
tati
stic
s”

CS2
50
4,
Sp
rin
g'2
00
7©
Dim
itri
s N
iko
lop
ou
los
46
Example: Geometric Mean
(1.0
1)
(1.0
0)
AM
(0.8
6)
(1.0
0)
GM
368 (0.48)
772 (1.00)
E
33527 (0.85)
39449 (1.00)
D
153 (2.32)
66 (1.00)
C
70 (0.84)
83 (1.00)
B
244 (0.59)
417 (1.00)
A
CPU: M
CPU: R
Bench
33527 (1.00)
39449 (1.00)
D
368 (1.00)
772 (1.00)
E
(1.0
0)
(1.1
7)
GM
(1.0
0)
(1.3
2)
AM
153 (1.00)
66 (0.43)
C
70 (1.00)
83 (1.19)
B
244 (1.00)
417 (1.71)
A
CPU: M
CPU: R
Bench
•T
hes
e g
rap
hs
sho
w t
he
arit
hm
etic
mea
n (
AM
) an
d g
eom
etri
c m
ean
(G
M)
of
a se
t o
f n
orm
aliz
ed e
xec
uti
on
tim
es
–A
M y
ield
s num
ber
s in
dic
atin
g t
hat
eac
h C
PU
is
bet
ter
than
the
oth
er
–G
M s
ho
ws
CP
U M
bei
ng b
ette
r th
an C
PU
R i
n b
oth
cas
es
CS2
50
4,
Sp
rin
g'2
00
7©
Dim
itri
s N
iko
lop
ou
los
47
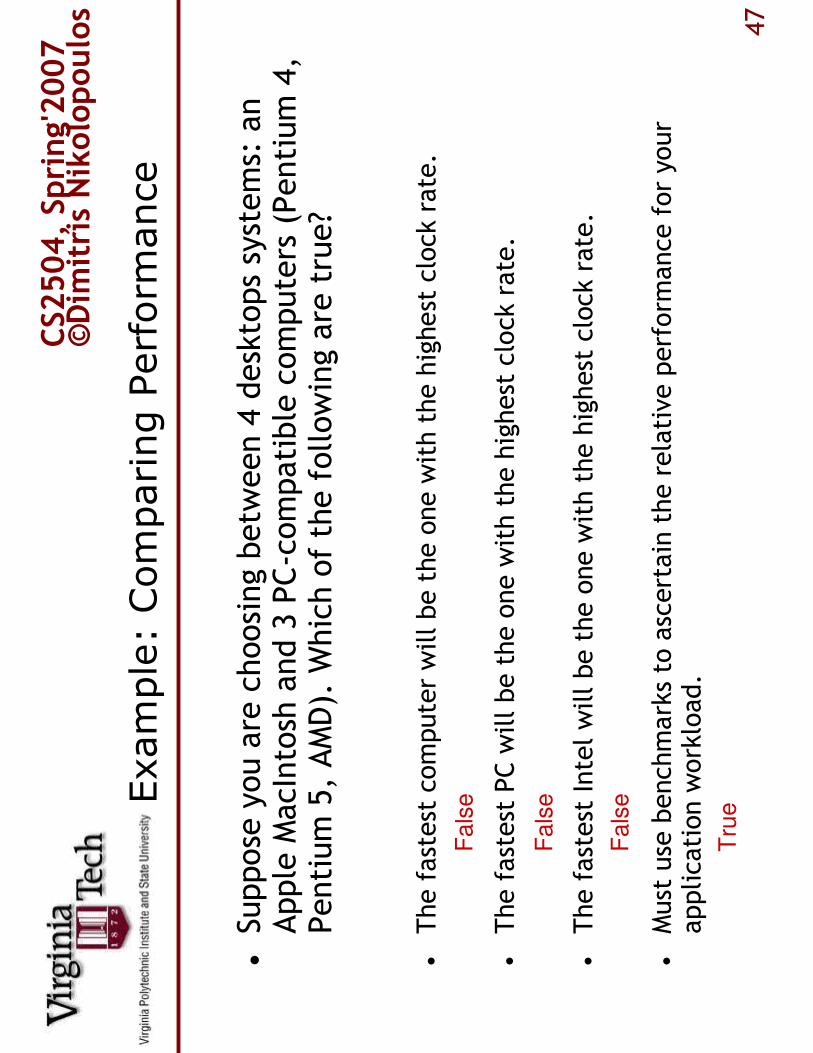
Example: Comparing Perform
ance
�Suppose you are choosing betw
een 4 desktops systems: an
Apple MacIntosh and 3 PC-compatible computers (Pentium 4,
Pentium 5, AMD). W
hich of the following are true?
�The fastest computer will be the one with the highest clock rate.
�The fastest PC will be the one with the highest clock rate.
�The fastest Intel will be the one with the highest clock rate.
�Must use benchmarks to ascertain the relative perform
ance for your
application workload.
Fals
e
Fals
e
Fals
e
Tru
e

CS2
50
4,
Sp
rin
g'2
00
7©
Dim
itri
s N
iko
lop
ou
los
48
Example: Comparing Perform
ance
•A
ssu
me
the
foll
ow
ing m
easu
rem
ents
wer
e ta
ken
:
•W
hic
h o
f th
e fo
llo
win
g s
tate
men
ts a
re t
rue:
–A
is
fast
er t
han
B f
or
pro
gra
m 1
.
–A
is
fast
er t
han
B f
or
pro
gra
m 2
.
–A
is
fast
er t
han
B f
or
a w
ork
load
wher
e pro
gra
m 1
and p
rogra
m
2 a
re e
xec
ute
d a
n e
qual
num
ber
of
tim
es.
–A
is
fast
er t
han
B f
or
a w
ork
load
wher
e pro
gra
m 1
is
exec
ute
d
twic
e as
oft
en a
s pro
gra
m 2
.
2 <
4,
so T
rue
2 sec
5 sec
2
4 sec
2 sec
1
Computer B
Computer A
Program
5 >
2,
so F
als
e
2+
5 >
4+
2, so F
als
e
2+
2+
5 <
4+
4+
2,
so T
rue

CS2
50
4,
Sp
rin
g'2
00
7©
Dim
itri
s N
iko
lop
ou
los
49
Evaluation using SPEC
�SPEC CPU benchmarks
−Measure CPU perform
ance
−12 INT and 14 FP applications (details next slide)
−Latest release (at book publishing) was CPU2000
�What metric do they report?
−Execution time of each application
−Sun 300MHz reported times divided by observed times
−This gives the SPEC ratio
−Bigger numbers indicate better perform
ance
−Geometric m
eans are reported for INT and FP

CS2
50
4,
Sp
rin
g'2
00
7©
Dim
itri
s N
iko
lop
ou
los
50
Pollutant distribution
apsi
Nuclear physics accel
sixtrack
Crash simulation fem
fma3d
Circuit place & route
twolf
Primality
testing
lucas
compression
bzip2
Computational chemistry
ammp
Object oriented database
vortex
Facial image recognition
facerec
Group theory interpreter
gap
Seismic wave propagation
simulation
equake
perlapplication
perlbmk
Image recognition (NN)
art
Computer visualization
eon
Computational fluid dynamics
galgel
Word processing program
parser
3D graphics library
mesa
Chess program
crafty
Parabolic/elliptic pde
applu
Combinatorial
optimization
mcf
Multigridsolver in 3D fields
mgrid
GNU C compiler
gcc
Shallow water model
swim
FPGA place & route
vpr
Quantum chromodynamics
wupwise
compression
gzip
FP benchmarks
Integer benchmarksSPEC CPU2000
CS2
50
4,
Sp
rin
g'2
00
7©
Dim
itri
s N
iko
lop
ou
los
51
SPEC CPU Example Use
�CPU perform
ance improvements come from:
−Increases in clock rate
−CPI lowering processor organization improvements
−Compiler enhancements (fewer or simpler ins)
�We will now compare the SPEC results from two
Intel processors
−Pentium III
−Pentium 4
−Varying the clock rate
CS2
50
4,
Sp
rin
g'2
00
7©
Dim
itri
s N
iko
lop
ou
los
52
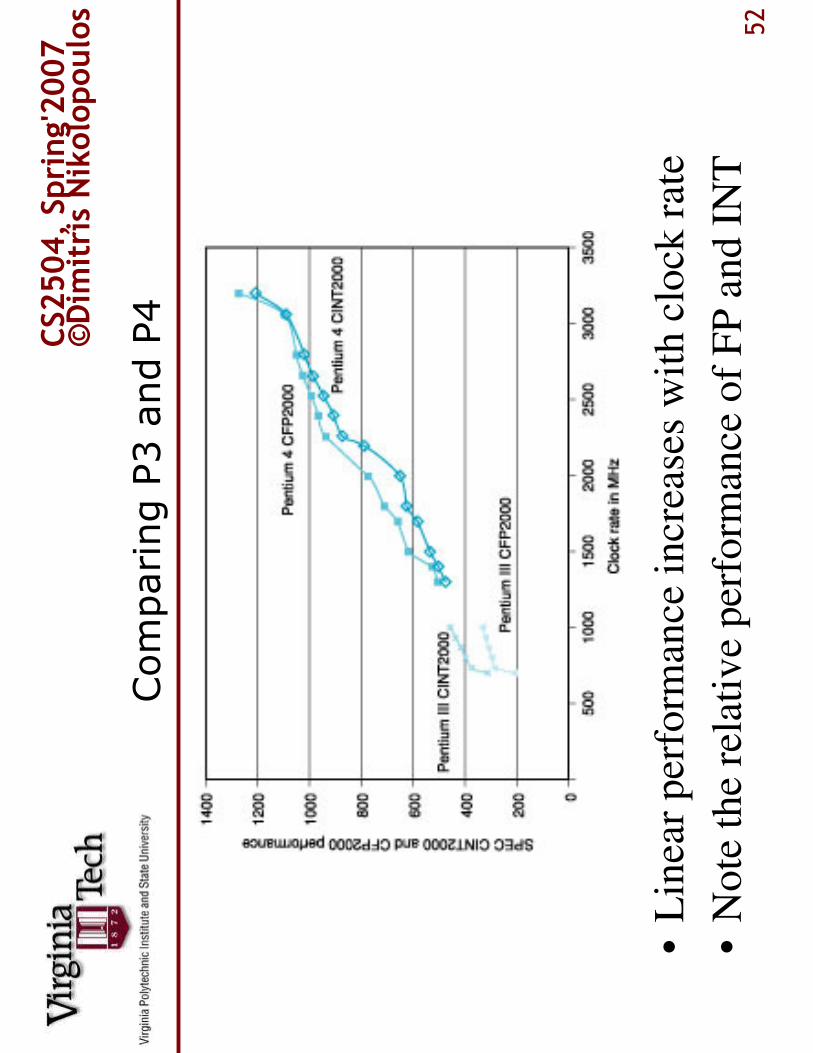
Comparing P3 and P4
•L
inea
r p
erfo
rman
ce i
ncr
ease
s w
ith c
lock
rat
e
•N
ote
the
rela
tiv
e per
form
ance
of
FP
and
IN
T

CS2
50
4,
Sp
rin
g'2
00
7©
Dim
itri
s N
iko
lop
ou
los
53
Analysis of FP vs. INT
•S
o w
hy
do
es t
he
rela
tiv
e per
form
ance
of
FP
and
IN
T c
han
ge?
•W
e ca
n l
ook
at
the
SP
EC
rat
io o
ver
clo
ck r
ate
–P
4 h
as m
ore
ad
van
ced
IC
tec
hn
olo
gy
an
d m
ore
ag
gre
ssiv
e p
ipel
ine
stru
ctu
re
•In
crea
ses
clock
rat
e at
som
e ex
pen
se t
o C
PI
for
CIN
T
•H
ow
ever
, C
PI
is i
mpro
ved
for
CF
P
•H
appen
s bec
ause
new
inst
ruct
ions
wer
e in
troduce
d (
SS
E)
0.39
0.34
CFP2000
0.36
0.47
CINT2000
Pentium 4
Pentium III
Ratio

CS2
50
4,
Sp
rin
g'2
00
7©
Dim
itri
s N
iko
lop
ou
los
54
SPEC W
eb 99
�Focuses on throughput rather than response time
−Maximum number of connections supported
−Must m
aintain m
inimum perform
ance guarantee
−Multiprocessor systems perform
well
�SPECweb99 simply generates requests and records
the throughput
−Does not handle the requests
−This m
eans that the software is measured
�Results depend upon m
any system specs
−Disk drives, netw
ork, CPUs

CS2
50
4,
Sp
rin
g'2
00
7©
Dim
itri
s N
iko
lop
ou
los
55
SPEC W
eb 99 Results
•F
ocu
ses
on t
hro
ug
hpu
t ra
ther
than
res
pon
se t
ime
–A
lar
ger
nu
mb
er o
f sl
ow
er p
roce
sso
rs i
s bet
ter
–M
ore
dis
ks
and
net
wo
rk c
on
nec
tio
ns
are
imp
ort
ant
8001
80.7
87
8450
6700
82.0
48
6600
4200
40.7
45
6400
5698
43.06
25
2650
3435
41.13
28
2500
1810
11.4
23
1650
2765
21.0
22
1550
Result
#Nets
GHz
#CPUs
#Disks

CS2
50
4,
Sp
rin
g'2
00
7©
Dim
itri
s N
iko
lop
ou
los
56
Example: SPEC W
eb 99
�Which of the following uniprocessor Pentium
III configurations is likely to produce the best
perform
ance on SPECweb99?
a) 1.26 GHz processor, 1 disk, 1 netw
ork connection
b) 1.0 GHz processor, 6 disks, 3 netw
ork connections
c) 1.1 GHz processor, 2 disks, 2 netw
ork connections
Def
init
ely B
, bec
ause
dis
k a
nd
net
work
are
AT
LE
AS
T a
s im
po
rtan
tas
CP
U s
pee
d
CS2
50
4,
Sp
rin
g'2
00
7©
Dim
itri
s N
iko
lop
ou
los
57
Power Aware Computing
�Power is increasingly becoming a perform
ance limiting factor
−Passive cooling problems
−Battery power limitations
−Electricity costs
−Overheating in server systems
−Overheating in THIS laptop
�Popular solution is DVFS
−Dynamic Frequency and Voltage Scaling
−Reducing frequency hurts perform
ance
−Saves power proportional to the square of the perform
ance loss

CS2
50
4,
Sp
rin
g'2
00
7©
Dim
itri
s N
iko
lop
ou
los
58
Evaluating DVFS Perform
ance
•P
erfo
rman
ce c
har
acte
rist
ics
on
3 p
roce
sso
rs w
ith
DV
FS
•P
enti
um
M b
est
for
max
an
d
adap
tiv
e–
Slo
wer
pro
cess
or
–N
ewer
tec
hn
olo
gy
•P
enti
um
4 b
est
for
min
imu
m–
Mu
ch h
igh
er c
lock
rat
e

CS2
50
4,
Sp
rin
g'2
00
7©
Dim
itri
s N
iko
lop
ou
los
59
Evaluating DVFS Efficiency
•T
he
ener
gy e
ffic
ien
cy o
f D
VF
S o
n 3
pro
cess
ors
–P
erfo
rman
ce/P
ow
er C
on
sum
ed
•P
enti
um
M b
est
in a
ll c
ases
–D
esig
ned
fo
r en
erg
y e
ffic
ien
cy
fro
m t
he
star
t
–E
xtr
emel
y e
ffic
ien
t in
lo
wes
t D
VF
S ‘
gea
r’
•P
enti
um
III
bet
ter
than
4–
P4
has
in
her
entl
y e
ner
gy
In
effi
cien
t lo
gic

CS2
50
4,
Sp
rin
g'2
00
7©
Dim
itri
s N
iko
lop
ou
los
60
Amdahl’s Law
�Amdahl’s Law dictates the m
aximum perform
ance
improvement that can be seen by optimizing only part
of the system
Timeafter= Timenoopt+ Timeopt/Improvement
�The perform
ance improvement to be gained from using
some faster mode of execution is limited by the fraction
of the time the faster mode can be used
−Considers the amount of time the optimized region is used
−Considers the amount by which the region is optimized

CS2
50
4,
Sp
rin
g'2
00
7©
Dim
itri
s N
iko
lop
ou
los
61
Amdahl’s Law
•T
his
dia
gra
m i
llu
stra
tes
the
log
ic b
ehin
d A
md
ahl’
s L
aw
Ori
gin
al p
roce
ss
Mak
e B
5x f
aste
r
Mak
e A
2x f
aste
r
Tw
o i
ndep
enden
t par
ts:
Aan
d B
Eli
min
ate
Ben
tire
ly

CS2
50
4,
Sp
rin
g'2
00
7©
Dim
itri
s N
iko
lop
ou
los
62
Speedup
�Speedupis the ratio by which the perform
ance is
improved
Speedup = Perform
ance
orig/Perform
ance
opt
�E.g. improvement from 6 seconds to 5 seconds
would be a speedup of 6/5 = 1.2
�Amdahl’s Law limits speedup by finding the
minimum Perform
ance
opt

CS2
50
4,
Sp
rin
g'2
00
7©
Dim
itri
s N
iko
lop
ou
los
63
Example: Using Amdahl’s Law
�Suppose an enhancement to a processor used for Web serving that
is 10 times faster on computation than the original processor. If
the original CPU is busy with computation 40% of the time, what is
the overall speedup to be gained with the new processor?
Timeopt= 0.4 because 40% of the time is CPU
Timenoopt= 0.6 remaining time
Improvement = 10 because new CPU is 10x faster
Timeafter= 0.6 + 0.4/10 = 0.64
Speedupoverall= 1/0.64 = 1.56

CS2
50
4,
Sp
rin
g'2
00
7©
Dim
itri
s N
iko
lop
ou
los
64
Example: Using Amdahl’s Law
�Suppose a program runs in 100 seconds, and m
ultiply
operations account for 80% of this time. How m
uch
faster do we have to m
ake m
ultiplication to m
ake the
program 5 times faster?
Timeafter= Timenoopt+ Timeopt/Improvement
20 seconds= (100 –80) + 80 seconds/n
0 seconds = 80 seconds/n
There is no possible amount of optimization to accomplish this.
CS2
50
4,
Sp
rin
g'2
00
7©
Dim
itri
s N
iko
lop
ou
los
65
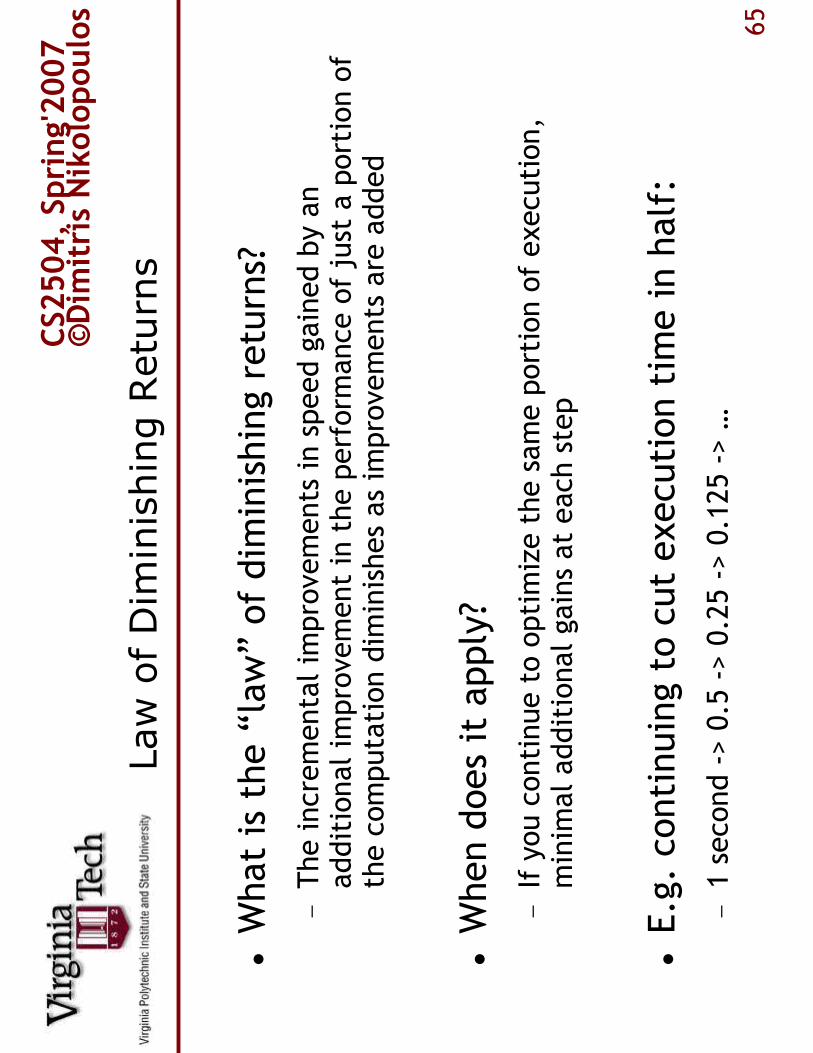
Law of Diminishing Returns
�What is the “law”of dim
inishing returns?
−The incremental improvements in speed gained by an
additional improvement in the perform
ance of just a portion of
the computation diminishes as improvements are added
�When does it apply?
−If you continue to optimize the same portion of execution,
minimal additional gains at each step
�E.g. continuing to cut execution time in half:
−1 second -> 0.5 -> 0.25 -> 0.125 -> …

CS2
50
4,
Sp
rin
g'2
00
7©
Dim
itri
s N
iko
lop
ou
los
66
Amdahl’s Law for Parallelization
•M
axim
um
po
ssib
le s
pee
du
p:
1F
+ (
1 –
F)/
N
–F
is
the
% o
f ex
ecuti
on n
ot
par
alle
liza
ble
–N
is
the
num
ber
of
pro
cess
ors
•D
emon
stra
tes
the
imp
ort
ance
o
f m
inim
izin
g F
•A
lso
sh
ow
s th
e d
imin
ish
ing
re
turn
s

CS2
50
4,
Sp
rin
g'2
00
7©
Dim
itri
s N
iko
lop
ou
los
67
Example: Amdahl’s Law
�Assume FP square root represents 20% of the time of a
graphics benchmark. One proposal might be to improve
FPSQ
R by a factor of 10. Alternatively, we m
ight im
prove FP
(which accounts for 50% of the tim
e) by a factor of 1.6. If
each of these optimizations requires the same cost, which
one is better?
SpeedupFPSQ
R=
11
1.22
(1 –0.2) + (0.2/10)
0.82
SpeedupFP
= 1
11.23
(1 –0.5) + (0.5/1.6)
0.8125
= ===

CS2
50
4,
Sp
rin
g'2
00
7©
Dim
itri
s N
iko
lop
ou
los
68
Make the Common Case Fast
�Very important concept in optimization
�Different events occur with varying frequencies
−Optimization opportunity limited by the frequencies
−Optimizing the rare cases is likely to have little effect
−Don’t waste time optimizing something that rarely happens
−Better return on investment to optimize frequent case
�Often the common case is simpler anyw
ay
CS2
50
4,
Sp
rin
g'2
00
7©
Dim
itri
s N
iko
lop
ou
los
69
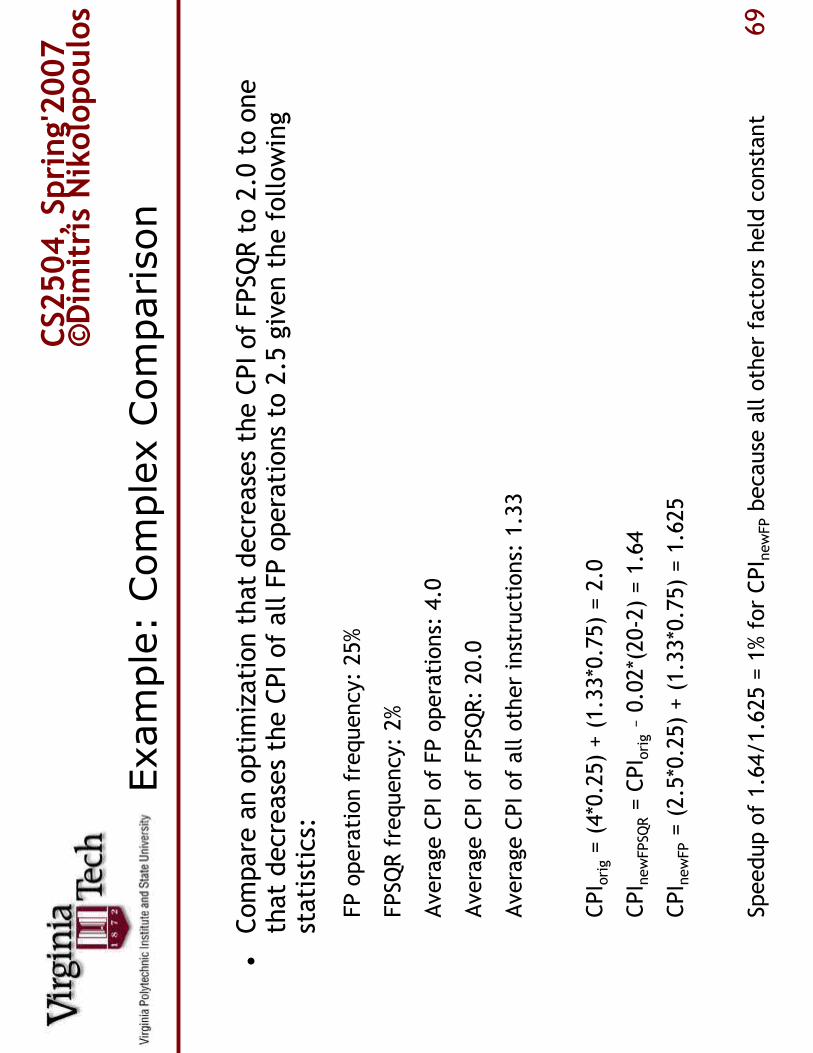
Example: Complex Comparison
�Compare an optimization that decreases the CPI of FPSQ
R to 2.0 to one
that decreases the CPI of all FP operations to 2.5 given the following
statistics:
FP operation frequency: 25%
FPSQ
R frequency: 2%
Average CPI of FP operations: 4.0
Average CPI of FPSQ
R: 20.0
Average CPI of all other instructions: 1.33
CPI orig= (4*0.25) + (1.33*0.75) = 2.0
CPI newFPSQ
R= CPI orig–0.02*(20-2) = 1.64
CPI newFP= (2.5*0.25) + (1.33*0.75) = 1.625
Speedup of 1.64/1.625 = 1% for CPI newFPbecause all other factors held constant
CS2
50
4,
Sp
rin
g'2
00
7©
Dim
itri
s N
iko
lop
ou
los
70
Top500 List
�What is the Top500 list?
−Ranking of the 500 fastest computers in the world
−Published every 6 m
onths
�Fastest at what?
−LINPACK benchmark
−Linear algebra package
−Designed to indicate Peak speed
�Speed m
easured in FLOPS
−FLoating point Operations Per Second

CS2
50
4,
Sp
rin
g'2
00
7©
Dim
itri
s N
iko
lop
ou
los
71
Top500 List
43480
14,024
Jaguar
ORNL
10
47380
11,088
TSU
BAME
GSIC (Tokyo)
9
51870
10,160
Columbia
NASA/Ames
8
52840
9,968
Tera-10
CEA (France)
7
53000
9,024
Thunderbird
Sandia
6
62630
10,240
MareNostrum
BSC
5
75760
12,208
ASC Purple
LLN
L4
91290
40,960
BlueGeneW
IBM TJ Watson
3
101400
26,544
Red Storm
Sandia
2
280600
131,072
BlueGene/L
LLN
L1
Max
Processors
Computer
Site
Rank

CS2
50
4,
Sp
rin
g'2
00
7©
Dim
itri
s N
iko
lop
ou
los
72
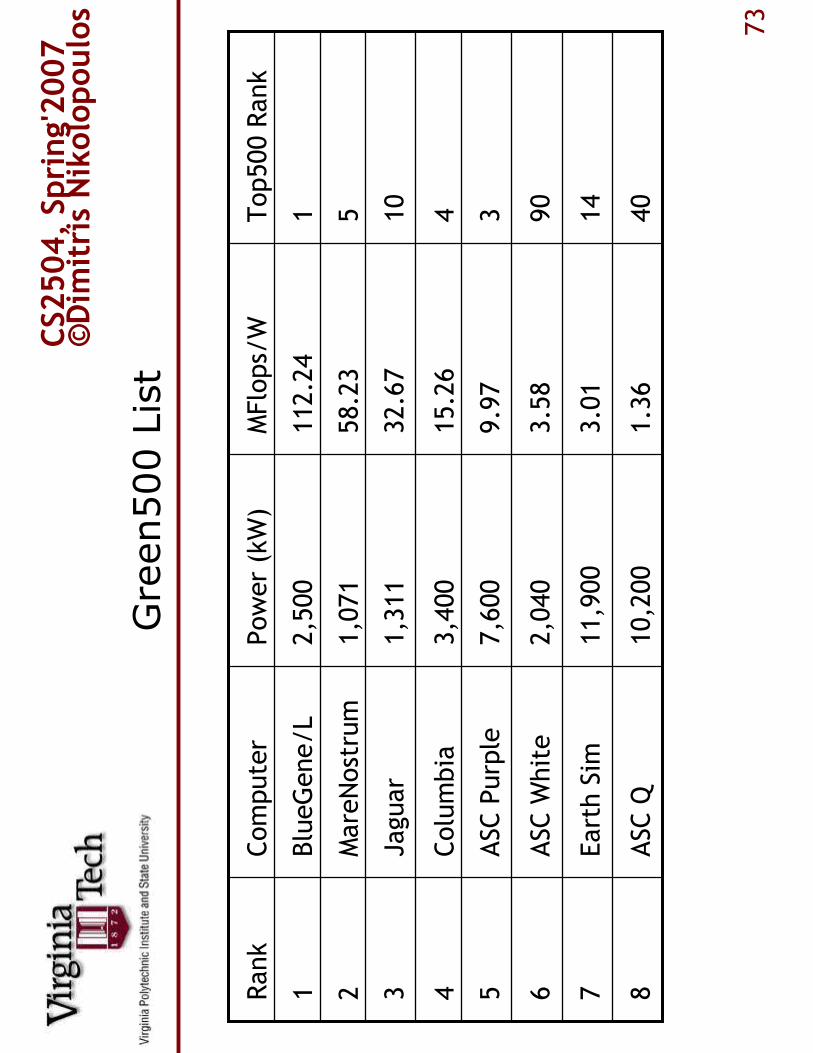
Green500 List
�What is the Green500 list?
−Green as in environmental
−Counterpart to Top500 list that considers energy
−Still in development
−Founded by Dr. W
u-chunFenghere at VT
�How is it m
easured?
−FLOPS/Watt
−Quantifies energy efficiency
CS2
50
4,
Sp
rin
g'2
00
7©
Dim
itri
s N
iko
lop
ou
los
73
Green500 List
ASC Q
Earth Sim
ASC W
hite
ASC Purple
Columbia
Jaguar
MareNostrum
BlueGene/L
Computer
10,200
11,900
2,040
7,600
3,400
1,311
1,071
2,500
Power (kW)
1.36
3.01
3.58
9.97
15.26
32.67
58.23
112.24
MFlops/W
40
8
14
7
90
6
35
44
10
3
52
11
Top500 Rank
Rank

CS2
50
4,
Sp
rin
g'2
00
7©
Dim
itri
s N
iko
lop
ou
los
74
Price-Perform
ance Evaluation
�If both perform
ance and cost are known, can then
calculate price-perform
ance
−The “value”of the system
−How m
uch perform
ance you are getting for the price
�Ideally, we want the fastest system
−Realistically, we want the fastest for the price
�Price-perform
ance is simply:
−Perform
ance / Price
−Each m
etric m
easured in any units

CS2
50
4,
Sp
rin
g'2
00
7©
Dim
itri
s N
iko
lop
ou
los
75
Desktop Price-Perform
ance
$2,950
500
UltraSPARCII-e
Sunblade100
Sun
$13,889
450
IBM III-2
RS6000
IBM
$4,175
1,700
P4
Precision 530
Dell
$3,834
1,000
PIII
Precision 420
Dell
$2,091
1,400
Athlon
Presario 7000
Compaq
Price
Clock Rate
Processor
Model
Vendor
�Price variations due to several things
−Components (CPU, memory, hard drive)
−Expandability
−Commoditization

CS2
50
4,
Sp
rin
g'2
00
7©
Dim
itri
s N
iko
lop
ou
los
76
Desktop Price-Perform
ance (INT)
Price
-Per
form
ance
0
100
200
300
400
500
600
Com
paq
Pre
sario
700
0
Del
l Pre
cisi
on
530
Del
l Pre
cisi
on
420
IBM
RS
6000
Sun
Sun
blad
e
100
SPEC CPU Performance
050100
150
200
250
300
SPEC/$1Kdf
�Presario has best Price, Perform
ance, and Price-Perform
ance
�IBM RS6000 has highest Price and worst Price-Perform
ance
−Must be something we’re not seeing about the IBM RS6000
$2k
$4K
$4K
$14K
$3K

CS2
50
4,
Sp
rin
g'2
00
7©
Dim
itri
s N
iko
lop
ou
los
77
Price-P
erf
orm
ance (FP
)
0
100
200
300
400
500
600
700
Com
paq
Pre
sario 7
000
Dell
Pre
cis
ion
530
Dell
Pre
cis
ion
420
IBM
RS
6000
Sun S
unbla
de
100
SPEC CPU Performance d
050
100
150
200
250
SPEC/$1K d
Desktop Price-Perform
ance (FP)
�Improved FP perform
ance on P4 compared to PIII is clear
−Results in better value at the same price
�P4 outperform
s the AMD in FP also
−AMD still the better price-perform
ance system
$2k
$4K
$4K
$14K
$3K
CS2
50
4,
Sp
rin
g'2
00
7©
Dim
itri
s N
iko
lop
ou
los
78
Price-Perform
ance for OLTP
�One of the largest server markets is OLTP
−On-Line Transaction Processing
−Represented by the TPC-C benchmark
−Perform
ance m
easured in TPM –transactions per minute
�Many interesting things about TPC-C
−Very realistic
−Measures total system perform
ance
−Specific running rules
−Vendors m
ust report both perform
ance and price

CS2
50
4,
Sp
rin
g'2
00
7©
Dim
itri
s N
iko
lop
ou
los
79
Price-Perform
ance for TPC
Price-P
erf
orm
ance (TP
C-C
)
0
100
200
300
400
500
600
700
800
IBM
xS
eries
Com
paq
GS
320
Fujit
su 2
0000
IBM
pS
eries
HP
9000
IBM
iS
eries
TPC-C d
0510
15
20
25
30
35
40
45
50
TPM / $1K d
�Best price and price-perform
ance by the IBM xSeries
−This m
achine has 280 processors, second m
ost is 48 processors
�Other than the xSeries, they are pretty comparable
−pSeriesis slightly better power-perform
ance
$15M
$10M
$10M
$8M
$9M
$8M

CS2
50
4,
Sp
rin
g'2
00
7©
Dim
itri
s N
iko
lop
ou
los
80
Price-Perform
ance for TPC
Price-P
erf
orm
ance (TP
C-C
)
0
20
40
60
80
100
120
140
160
180
Dell
Pow
erE
dge
IBM
xS
eries
Com
paq
Pro
liant
HP
NetS
erv
erN
EC
Expre
ss
HP
9000
TPM / $1K d
010
20
30
40
50
60
TPC-C d
�Sm
allest and cheapest system has the best price-perform
ance
−Definitely NOT the best perform
ance though
�Compared to previous slide, much higher value
−Alm
ost 4 tim
es better price-perform
ance
−Much worse perform
ance than on previous slide (~10X)
$131K
$300K
$375K
$375K
$680K
$370K
CS2
50
4,
Sp
rin
g'2
00
7©
Dim
itri
s N
iko
lop
ou
los
81
Perform
ance Counters
�What are perform
ance counters?
−Logic inside the processor to record events
−Also known as hardware perform
ance m
onitors, hardware event
counters, and others
�Then what are events?
−Events are anything that happens inside the CPU
−E.g. stall cycles, bus accesses, cache m
isses
�What can they be used for?
−Provide insight into the interaction betw
een hardware and software
−Show where an application likely has bottlenecks
−Allows for optimizing a given application

CS2
50
4,
Sp
rin
g'2
00
7©
Dim
itri
s N
iko
lop
ou
los
82
Using Perform
ance Counters
�There are m
any existing HEC libraries
−PAPI, Perfctr, Perfmon, PACMAN(!), VTune, others…
−All have specific niches
�Provide “high-level”
access to counters
−Avoids having to deal with bitmasks and writing them to registers
�Published lists of reference values
−Can compare observed values for a given event to see if it is
likely to be a problem
−Then comes the hard part…

CS2
50
4,
Sp
rin
g'2
00
7©
Dim
itri
s N
iko
lop
ou
los
83
Using Perform
ance Counters
�Here is what the code often looks like:
start_recording(stall cycles, bus accesses);
//Perform whatever work you want to monitor…
work();
stop_recording(values);
for each entryin values: print entry;
�Real examples from PACMAN…
CS2
50
4,
Sp
rin
g'2
00
7©
Dim
itri
s N
iko
lop
ou
los
84
Simulation
�Model all of the components in software
−Rather than actually im
plementing the system in hardware
−Or at least the important components
−Write code to m
odel the registers, ALU, etc
−Different levels of detail possible
�Full system vs. Processor only
�Highly accurate vs. statistical approximation
�More detail is very computationally expensive
�Many popular simulators available
−SIMICS, SESC, Turandot, HotSpot, others

CS2
50
4,
Sp
rin
g'2
00
7©
Dim
itri
s N
iko
lop
ou
los
85
Simulation
�Tweak the parameters to m
atch your system
−Change the size of the caches, the branch predictor,
the number of registers, etc
−Cheaper than doing it in hardware
−Faster than doing it in hardware
�Simulator reports anything you want to know
−Execution time of the application
−Amount of time spent using various resources
−Number of accesses to each component

CS2
50
4,
Sp
rin
g'2
00
7©
Dim
itri
s N
iko
lop
ou
los
86
Summary
�You learned:
−How to quantify the perform
ance of a system
�Form
ula for perform
ance
−How different metrics relate to overall perform
ance
�CPI vs. Instruction count vs. Clock frequency
�MIPS and FLOPS
−How to compare two systems using benchmarks
�Finding benchmarks that represent your workload