lecture 4: correlation and regression laura mcavinue school of psychology trinity college dublin
Post on 20-Dec-2015
219 views
TRANSCRIPT

Lecture 4:Correlation and Regression
Laura McAvinue
School of Psychology
Trinity College Dublin

Correlation
• Relationship between two variables
– Do two variables co-vary / co-relate?• Is mathematical ability related to IQ?• Are depression and anxiety related?
– Does variable Y vary as a function of variable X?• Does error awareness vary as a function of ability to sustain
attention?• Does accuracy of memory decline with age?

Correlation
• Direction– Do both variables move in the same direction?– Do they move in opposite directions?
• Degree– What is the degree or strength of the relationship?
• Analysis– Scatterplot– Correlation Coefficient
• Statistical significance

Scatterplot
Describe the relationship between the two variables using a scatterplotVisual representation of the relationship between the
variables
Plot each observation in the study, displaying its value on variable X and variable YPlace the predictor variable on the X axis
The independent variable, which is making the prediction
Place the criterion variable on the Y axisThe dependent variable, which is being predicted

Participant Anxiety Depression1 1 12 3 33 6 6
Anx
Dep
1 2 3 4 5 6
1
23
4
5
6

No Relationship
Random Scatter

Positive Relationship
Direction in scatter
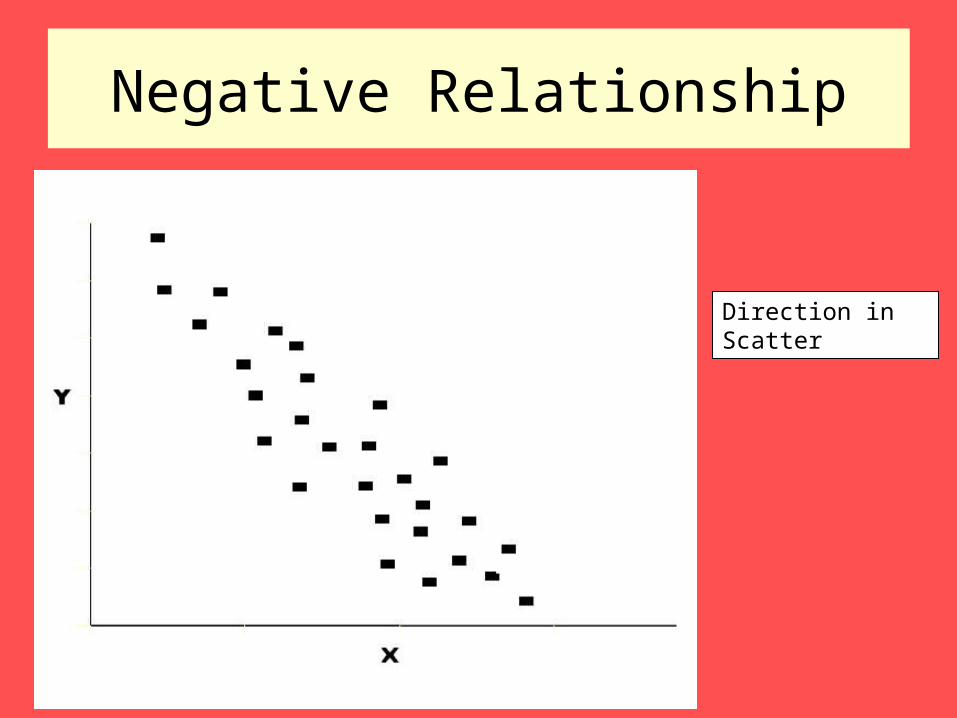
Negative Relationship
Direction in Scatter
0
10
20
30
40
50
60
70
0 2 4 6 8 10
No. of Pints
Verb
al C
oh
ere
nce
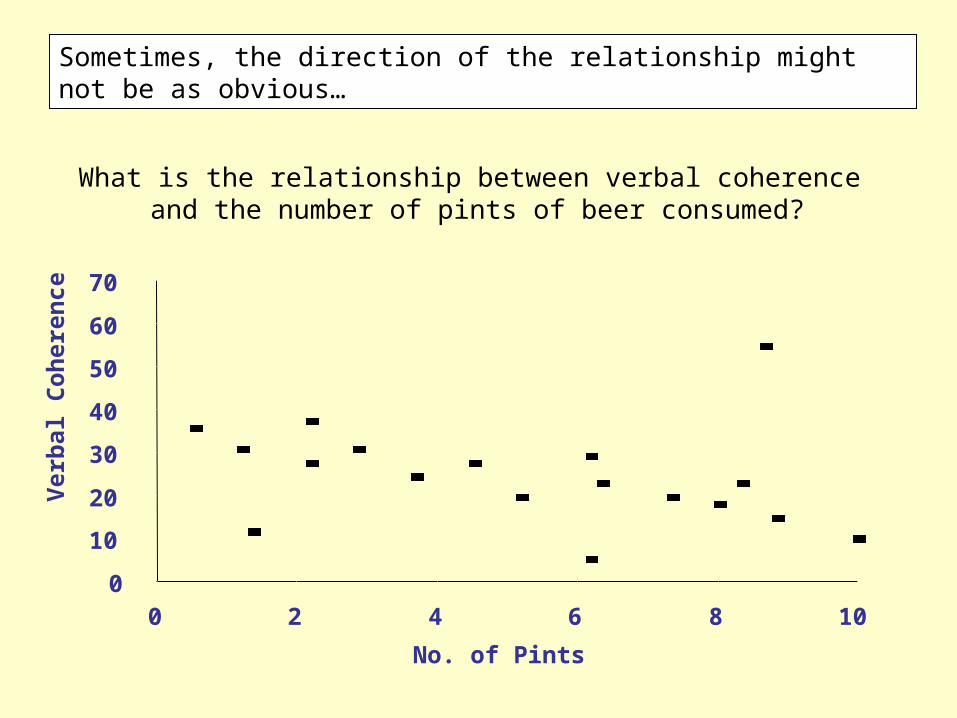
What is the relationship between verbal coherence and the number of pints of beer consumed?
Sometimes, the direction of the relationship might not be as obvious…

Regression Line
• Useful to add a regression line
– Model of the relationship– Straight line that best represents the relationship
between the two variables• ‘The line of best fit’
– Helps us to understand the direction of the relationship

0
10
20
30
40
50
60
70
0 2 4 6 8 10
No. of Pints
Verb
al C
oh
ere
nce
Adding the regression line helps us see the direction ofthe relationship

Direction of Relationship
• Positive– Two variables tend to move in the same direction
• As X increases, Y also increases• As X decreases, Y also decreases
• Negative– Two variables tend to move in opposite directions
• As X increases, Y decreases• As X decreases, Y increases
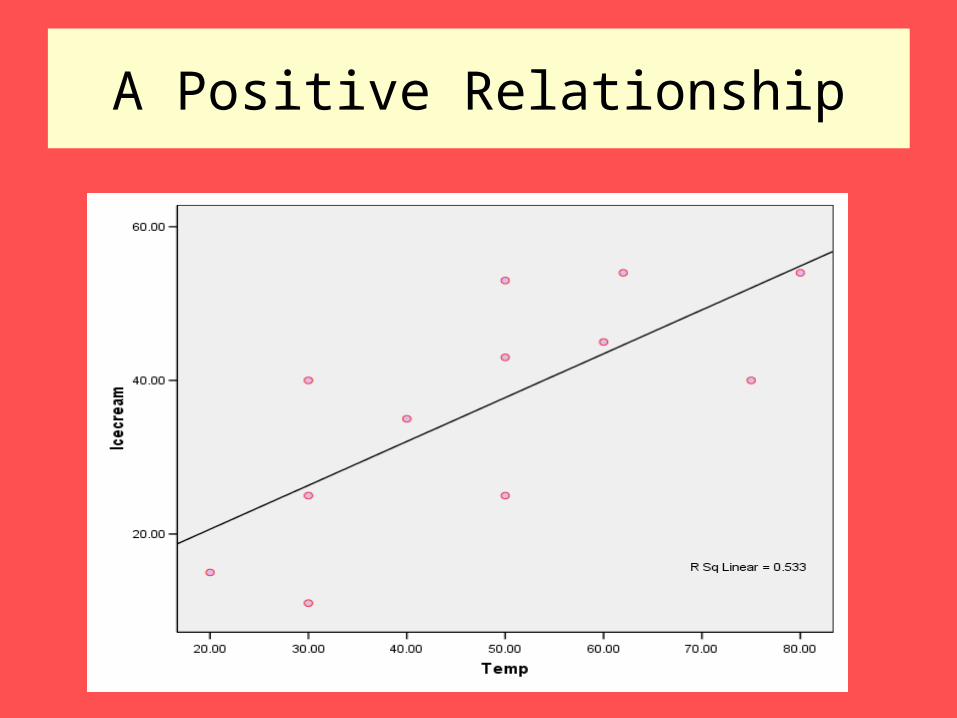
A Positive Relationship

A Negative Relationship

Degree of Relationship
• Degree or strength of relationship
– Calculate a correlation coefficient• Pearson Product-Moment Correlation Coefficient (r)
– Statistic that varies between -1 and 1• r = 0, no relationship between the variables
– Change in X is not associated with systematic change in Y
• r = 1, perfect positive correlation– Increase in X associated with systematic increase in Y
• r = -1, perfect negative correlation– Increase in X associated with systematic decrease in Y

Perfect
Negative
relationship
Interpretation of r
Perfect Positive relationshi
p-1 0 +1
AbsolutelyNo
relationship
Closer Pearson r is to one of the extremes,the stronger the relationship between the variables

Calculation of Pearson r
• Based on the covariance– A statistic representing the degree to which two
variables vary together– Based on how an observation deviates from the mean
on each variable
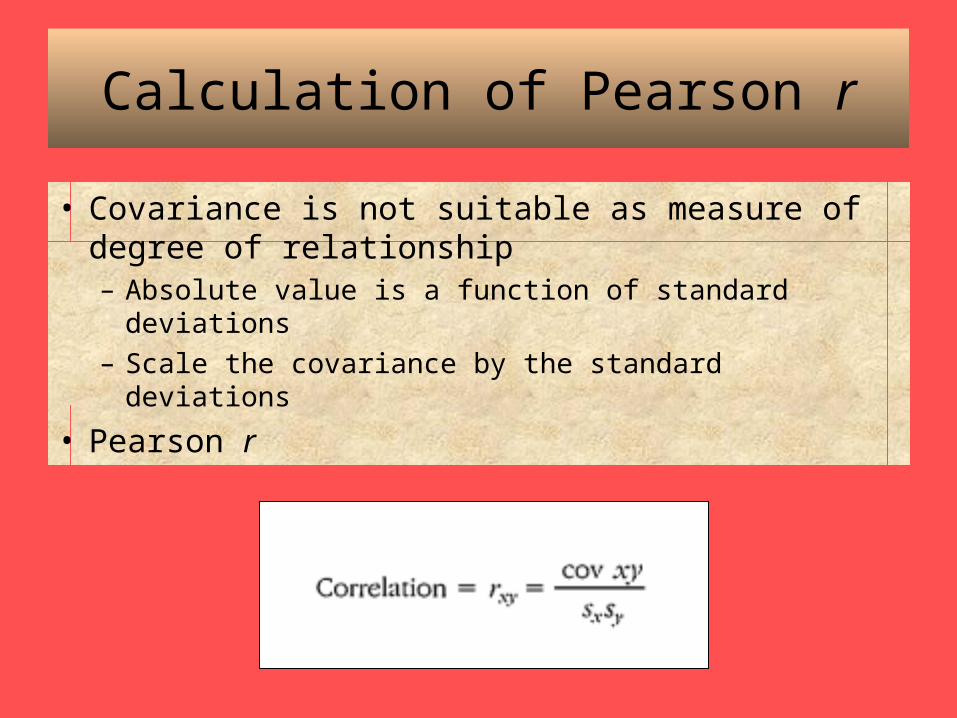
Calculation of Pearson r
• Covariance is not suitable as measure of degree of relationship– Absolute value is a function of standard deviations– Scale the covariance by the standard deviations
• Pearson r
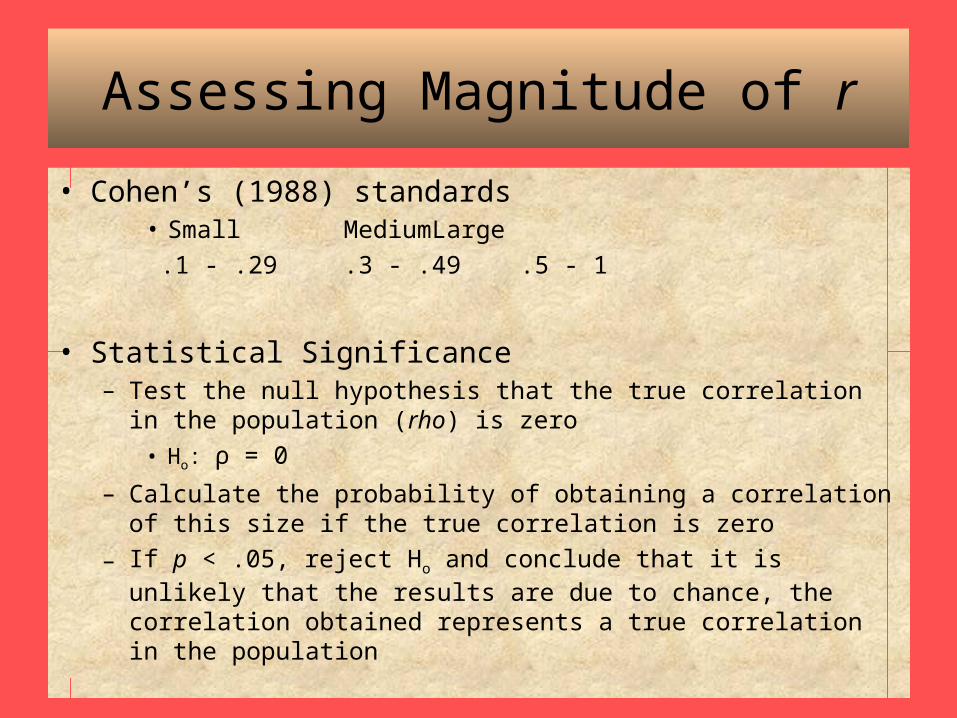
Assessing Magnitude of r
• Cohen’s (1988) standards• Small Medium Large
.1 - .29 .3 - .49 .5 - 1
• Statistical Significance– Test the null hypothesis that the true correlation in the population
(rho) is zero
• Ho: ρ = 0
– Calculate the probability of obtaining a correlation of this size if the true correlation is zero
– If p < .05, reject Ho and conclude that it is unlikely that the results are due to chance, the correlation obtained represents a true correlation in the population

Summary
• Interested in the relationship between two variables
• Direction and degree of relationship– Scatterplot & regression line
• Direction
– Correlation Coefficient• Magnitude• Statistical significance

As temperature increases, ice-cream consumption increases
r = .73 (large)
n = 12
p = .007

As temperature increases, hot whiskey consumption decreases
r = -.908 (large)
n = 12
p <.001

Issues to consider
• Assumption of linearity
– Pearson correlation assumes there is a linear relationship between the two variables
– Assumes the relationship can be represented by a straight line
– It is possible that the relationship might be better represented by a curved line
• Examine scatterplot
– Curve-fitting procedures

VAR00003
14121086420
VA
R0
00
04
160
140
120
100
80
60
40
20
0
Linear?

VAR00003
14121086420
VA
R0
00
04
160
140
120
100
80
60
40
20
0
Non-linear?

STRESS
121086420
PE
RF
OR
M
14
12
10
8
6
4
2
0
Non-linear

Issues to consider
• Correlation can be affected by– Range restrictions– Heterogeneous subsamples– Extreme observations
• Correlation does not mean causation

Regression
• The regression line– A straight line that represents the relationship
between two variables– Useful to add to the scatterplot to help us see the
direction of the relationship– But it’s much more than this…
• Prediction– Regression line enables us to predict Variable Y on
the basis of Variable X
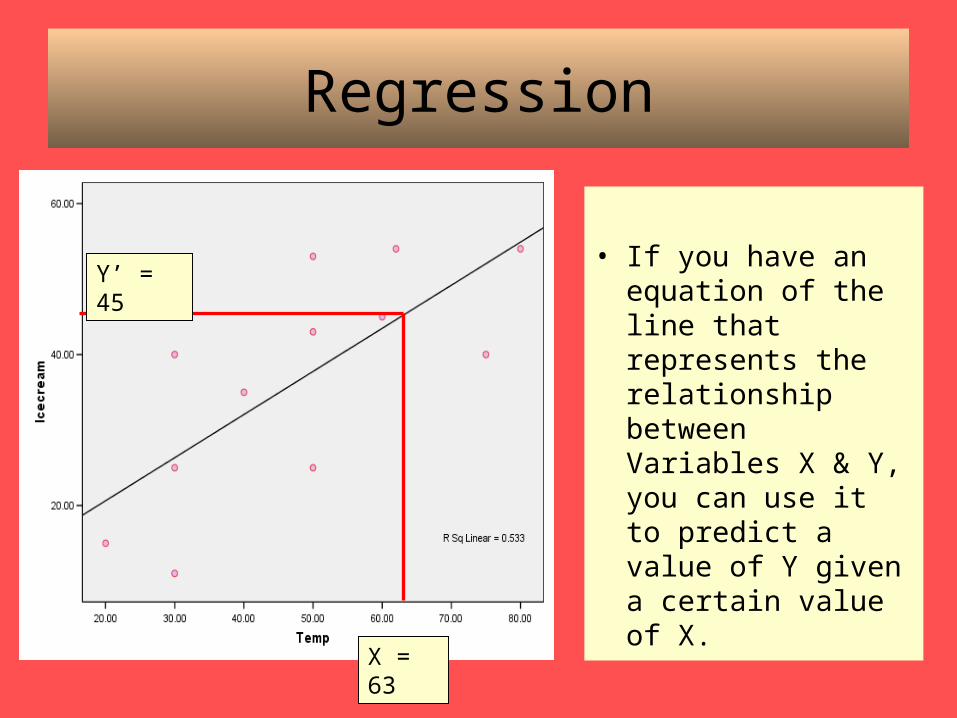
Regression
• If you have an equation of the line that represents the relationship between Variables X & Y, you can use it to predict a value of Y given a certain value of X.
X = 63
Y’ = 45

Regression Equation
ˆ Y bX a
Predicted
value of Y
Predicting
value of X
Regression Coefficients
The basic equation of a line

Regression Equation
ˆ Y bX ab
The slope of the regression line
The amount of change in Y associated with a one-unit change in X
a
The intercept
The point where the regression line crosses the Y axis
The predicted value of Y when X = 0

Regression Equation
X
Y’
a
b ˆ Y bX a

Same intercept,
different slopes
Same slope,
different intercepts

Summary
• The relationship between two variables, X & Y
• Correlation– Degree and direction of relationship
• Regression– Predict Y, given X– More on regression next lecture…