lecture 4: contaminated site characterizationbaiyu/engi 9621_files/lecture 4.pdf · when the...
TRANSCRIPT
Spring 2015 Faculty of Engineering & Applied Science
Lecture 4: Contaminated Site Characterization
1
9621 – Soil Remediation Engineering

Site characterization a systematic investigation aimed at obtaining appropriate and adequate data in order to define the type and extent of contamination as well as to assess the fate and transport of contaminants under various scenarios (1) Information required for site characterization
4.1 Introduction
Geologic data Hydro-geologic data Contamination data
2

(2) Questions to be answered by site characterization
Nature and extent of contamination where is it? What is future migration and control where is it going? What are receptors and their risk what harm will it do? What are technical options for remediation how do we fix it?
3

(3) General methodology for site characterization
Source: Sharma and Reddy, Geoenvironental Engineering, 2004
4

4.2 Preliminary and exploratory site assessment
to collect and review available or published site-specific or regional data involves two tasks: literature review and site visit
(a) Literature review
(1) Phase I: Preliminary site assessment
site use and history site permits water well logs and records aerial photos other sources
site personnel interviews geological maps and reports topographic maps soil survey maps
5

Action I Get a topo map understand geographic setting, topography, nearby water bodies Action II Get background geologic data through
Effective actions:
consulting ground-water atlas of Canada getting reports on geology, hydrology, meteorology checking for reports from province and national geological surveys
Action III Investigate regional geology and hydrogeology help to understand site geology and hydrology understand effects on contaminant movement
6

Where were chemicals handled or disposed? What site structures or activities are potential sources? What chemicals are and were handled? Prevention of costly mistakes such as multi-aquifer wells
(b) Site visit observe/record all potential important surface site features + collect surface water and near-surface soils
7

to confirm findings in the preliminary assessment to obtain preliminary site-specific data to facilitate design of a detailed site investigation program
(2) Phase II: Exploratory site investigation
sampling and testing procedures sampling locations and frequency QA/QC plan health and safety (H&S) plan schedule cost assessment
a written work plan for phase III
8

More information about H&S plan , visit http://www.worksafebc.com/publications /health_and_safety/by_topic/assets/pdf/howtoimplement_ohs.pdf
Health and Safety Levels
Source: Rast, Environmental Remediation Estimating Methods, 1997
9

4.3.1 Methods of obtaining soil and rock data
4.3 Detailed site investigation
Phase III : detailed site investigation a comprehensive field and laboratory test program, along with S&H and QA/QC plans
Direct methods Geophysical methods Drive methods
10

Source: Sharma and Reddy, Geoenvironental Engineering, 2004
bucket augers; spiral or ram’s horn auger
Direct methods – near surface soil sampling
11

Direct methods – soil sampling by solid-stem auger drilling
Source: Sharma and Reddy, Geoenvironental Engineering, 2004
Power-driven solid-stem augers: (a) solid-flight auger; (b) relationship of surface cuttings and subsurface
Drilling stop at the desired depth augers remove from the borehole a sampler is attached to the end of the drill put the entire string back to the borehole a sample is taken from the bottom flight by
Only for sampling from soil, not applicable to saturated zones
12

Direct methods – soil sampling by hollow-stem auger drilling
Source: Sharma and Reddy, Geoenvironental Engineering, 2004
Typical components of a hollow-stem auger: a hollow pipe with a continuous ramp of upward-spiraling flight welded around them
Drilling a center rod (with a pilot bit and plug) is lowered inside the auger till the sampling position is reached the center rod/bit/plug are removed soil sampler is applied
Applicable to soil/uppermost level of groundwater sampling
13
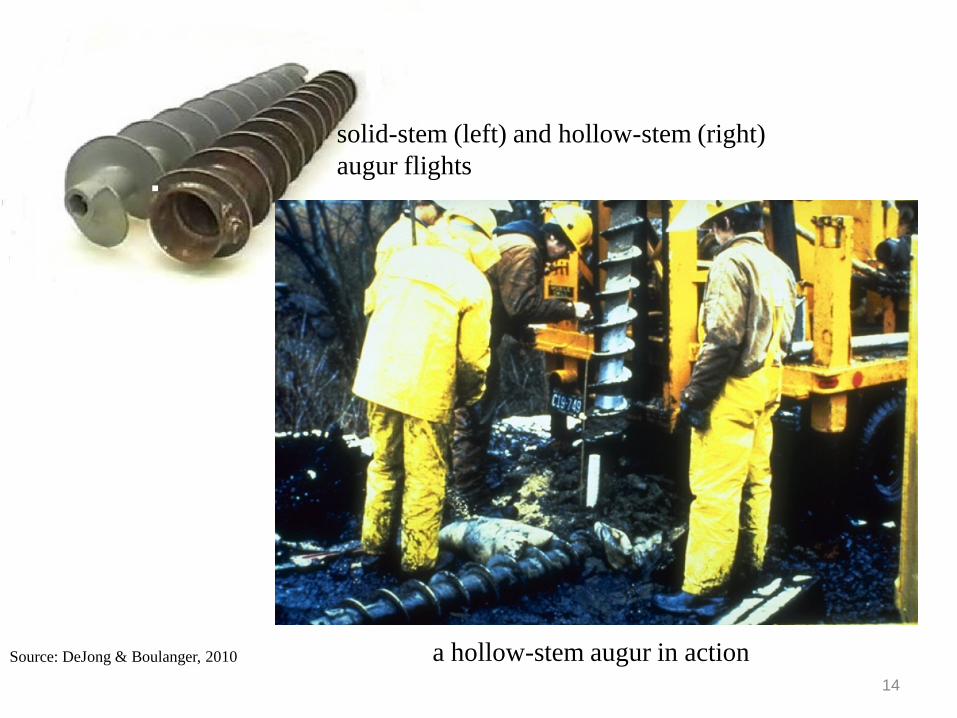
solid-stem (left) and hollow-stem (right) augur flights
a hollow-stem augur in action Source: DeJong & Boulanger, 2010
14

Source: Sharma and Reddy, Geoenvironental Engineering, 2004
Direct methods – popular samplers
A split-spoon sampler
Thin-walled tube samplers
15
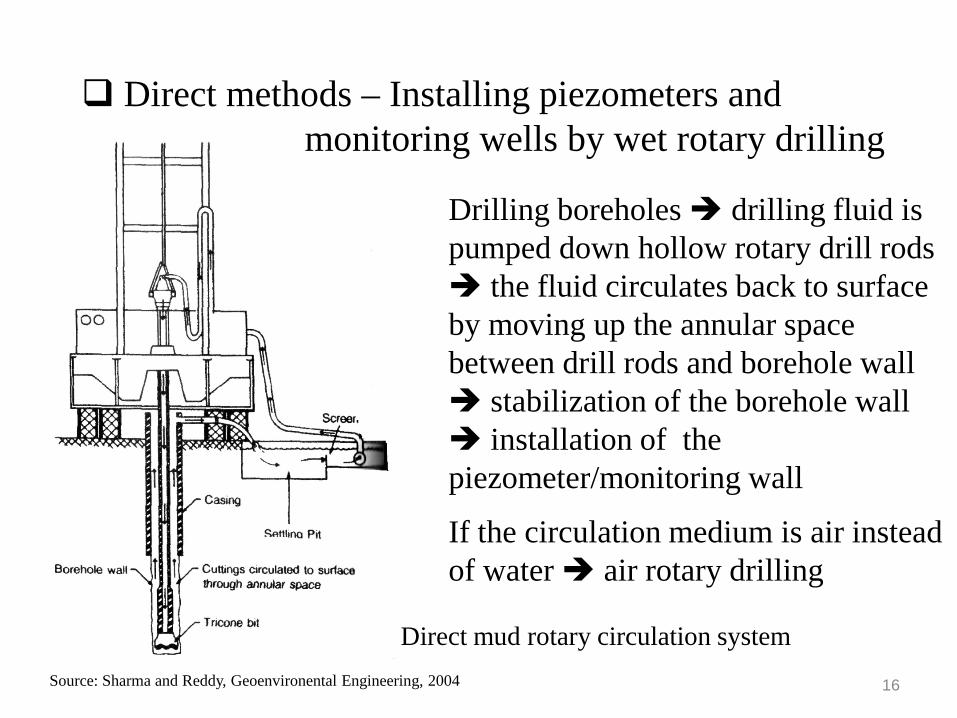
Drilling boreholes drilling fluid is pumped down hollow rotary drill rods the fluid circulates back to surface by moving up the annular space between drill rods and borehole wall stabilization of the borehole wall installation of the piezometer/monitoring wall
If the circulation medium is air instead of water air rotary drilling
Source: Sharma and Reddy, Geoenvironental Engineering, 2004
Direct methods – Installing piezometers and monitoring wells by wet rotary drilling
Direct mud rotary circulation system
16

Geophysical methods
Borehole geophysical methods a probe into the borehole using a cable transmit signals to surface instruments generate logs or charts
Surface geophysical methods no requirement of boreholes conduct electric/seismic/electromagnetic surveys as well as the use of ground penetrating radar
17

Geophysical methods – Electrical resistivity
Source: van Ea, Geophysical Techniques for Sensing Buried Wastes and Waste Migration, 1985 18

Geophysical methods – Seismic reflection
Source: van Ea, Geophysical Techniques for Sensing Buried Wastes and Waste Migration, 1985 19

Geophysical methods – Electromagnetic Induction
Source: van Ea, Geophysical Techniques for Sensing Buried Wastes and Waste Migration, 1985 20

Geophysical methods – Ground penetrating radar
Source: van Ea, Geophysical Techniques for Sensing Buried Wastes and Waste Migration, 1985 21

Drive methods e.g. cone penetrometer technology
CPT a method of providing real-time data for use in characterizing the subsurface, as opposed to older methods of analyzing subsurface conditions in the laboratory It consists of a steel cone that is hydraulically pushed into the ground at up to 40,000 pounds of pressure Sensors on the tip of the cone collect data
22

4.3.2 Methods of obtaining hydrogeologic data
Piezometers and monitoring wells Water-level measurement In-situ hydraulic conductivity test Packer test Slug test Pumping test
23

Installing Piezometers with a Manual Slide Hammer Structure of a piezometer
Piezometers a small-diameter observation well used to measure the hydraulic head of groundwater in aquifers
Source: Shanahan, Waste Containment and Remediation Technology, 2004 24

Monitoring wells -- Structure
Source: Shanahan, Waste Containment and Remediation Technology, 2004
25

Monitoring wells -- Development
Source: Shanahan, Waste Containment and Remediation Technology, 2004 26

Source: Shanahan, Waste Containment and Remediation Technology, 2004 27

Well development by surge block
Source: Shanahan, Waste Containment and Remediation Technology, 2004 28
A surge block closely fits the casing interior and is operated like a plunger beneath the water level it has a very direct positive action on the movement in the well

Source: Shanahan, Waste Containment and Remediation Technology, 2004 29

Water-level measurement
Source: Shanahan, Waste Containment and Remediation Technology, 2004 30

(a) Applying a bailer a portion of the water is removed from the bore hole after which measurement can commence The rise rate of the groundwater is determined by using a measuring tape with a float and a stopwatch (b) The determination of the saturated water permeability using the Guelph permeameter.
In-situ hydraulic conductivity test
(a) (b) Source: Eijkelkamp, Agrisearch Equipment, 2010 (http://www.eijkelkamp.com/)
31

Sources: Groundwater data collection, USGS Illinois Water Science Center Searchable Publications Database, 2010, http://il.water.usgs.gov/pubs/ofr01-50_chapter4_8.pdf (Left) Cutting Edge Drilling , 2010, http://cuttingedgecoredrilling.com/_wsn/page4.html (Right)
(a) The schematic of a packer test apparatus (b) Field packer test
Packer test
32

Source: Butler, et al., Analysis of slug tests in formations of high hydraulic conductivity, Ground Water, v. 41, no. 5, 620-630, 2003
Slug test
33

Pumping test
Single well pumping test Source: Sharma and Reddy, Geoenvironental Engineering, 2004
34

4.3.3 Methods of obtaining contaminant data
Contaminant in soil analyze the samples from soil sampler
Contaminant in water analyze the samples from piezometers and/or monitoring wells
Contaminant in soil vapor analyze the samples from soil gas sampler
35

3.4 Case study
The Cantuar Field Scrubber Site located in southwest Saskatchewan
Leaking underground storage tank of natural gas condensates site contamination
Source: Zhang et al., 2007