lecture 4 – characters: molecular first used by luca cavalli-sforza and anthony edwards
TRANSCRIPT
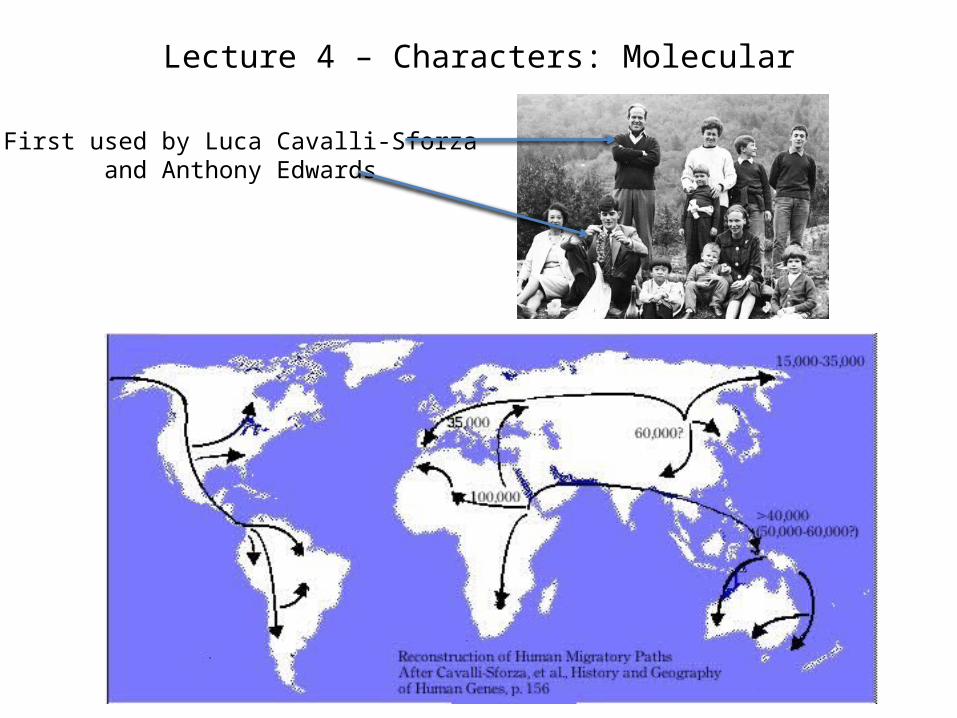
Lecture 4 – Characters: Molecular
First used by Luca Cavalli-Sforzaand Anthony Edwards

Lecture 4 – Characters: Molecular
cwk1056 eaa292 cwk1025 eaa448 dsr5032 eaa028 fac1117 cwk1007
cwk1056 ---------- eaa292 0.05840708 ----------cwk1025 0.01769911 0.05398230 ----------eaa448 0.08672567 0.08141593 0.08230089 ----------dsr5032 0.02566372 0.05929204 0.01946903 0.08495575 ----------eaa028 0.06725664 0.07433628 0.06371681 0.07522124 0.07168142 ----------fac1117 0.02123894 0.05575221 0.00530973 0.08053097 0.02123894 0.0637168 ----------cwk1007 0.05221239 0.02920354 0.05132743 0.08230089 0.05486726 0.07610620 0.05132743 ----------eaa667 0.05840708 0.01238938 0.05221239 0.07787611 0.05752213 0.07433628 0.05398230 0.02743363
Pairwise distance matrix
The units for these distances vary, but the matrix can then be subjected to a number of potential phylogenetic analyses.
Information regarding comparative genomics may be presented as inherently distance data.

An example of a simple genomic distance.(Edwards et al. 2002. Syst. Biol. 51:599 )
Large amounts of sequence data that is assumed to be a random sample from each respective genome.
Begin by calculating the frequency of each of the 4n bp words in each taxon, where n is the length of the word.
n = 1, there are 4 words: G, A, T, C (data are the base frequencies).
n = 2, there are 16 possible dinucleotide words – 16 frequencies.

Edwards et al. (2002) use 5 bp words, so there are 45 = 1024 possible words, and the frequency of each word is calculated from the genome sample for each OTU.
So, for each taxon, we have a vector of penta-nucleotide frequencies.
The Euclidian distance between each pair of genomes is calculated to generate a distance matrix.
where fxi is the frequency of word x in taxon i and fxj is the frequency of word x in taxon j.

This matrix is then subjected to any of a number of tree-estimation methods.
Deep split in bird phylogeny (Paleognthus birds) is reflected in the genomic signature.

2. Chromosomal Inversions have a long history due to Diptera having polytene chromosomes.
Can puzzle out order of inversions, and use events as characters.
Potential Molecular Characters
1. Allozymes – Allelic forms of proteins (usually enzymes) that vary by a charge changing amino-acid. Distance-based or character-basedanalyses were conducted.

Chromosomal Inversions(Kamail et al. 2012. PLoS Pathogens)

3. Fragment Data
DNA sequence variation can be assayed indirectly with restriction enzymes
EcoR1 will cleave DNA anywhere there is the following sequence occurs.
..G – A – A – T – T – C.. | | | | | |..C – T – T – A – A – G..
4. Sequence Data
a. Gene sequences – 4 possible character states.
b. Protein sequences - 20 possible character states.

5. Higher order molecular characters (Rare Genomic Changes)
Rokas and Holland (2000. TREE, 15:454).

a. Insertions/Deletions in/of introns.
These are often applied to already existing phylogenetic hypotheses.
Murphy et al. (2007. Genome Res., 17: 413)

microRNA (miRNA) Profile
Tarver et al. (2013. Mol. Biol. Evol. 30:2369)

microRNA (miRNA) Profile
Losses are more frequent than reported, there is large heterogeneity in rates of gains and losses, there’s ascertainment bias, and model-based
analyses that account for this can refute simple analyses.
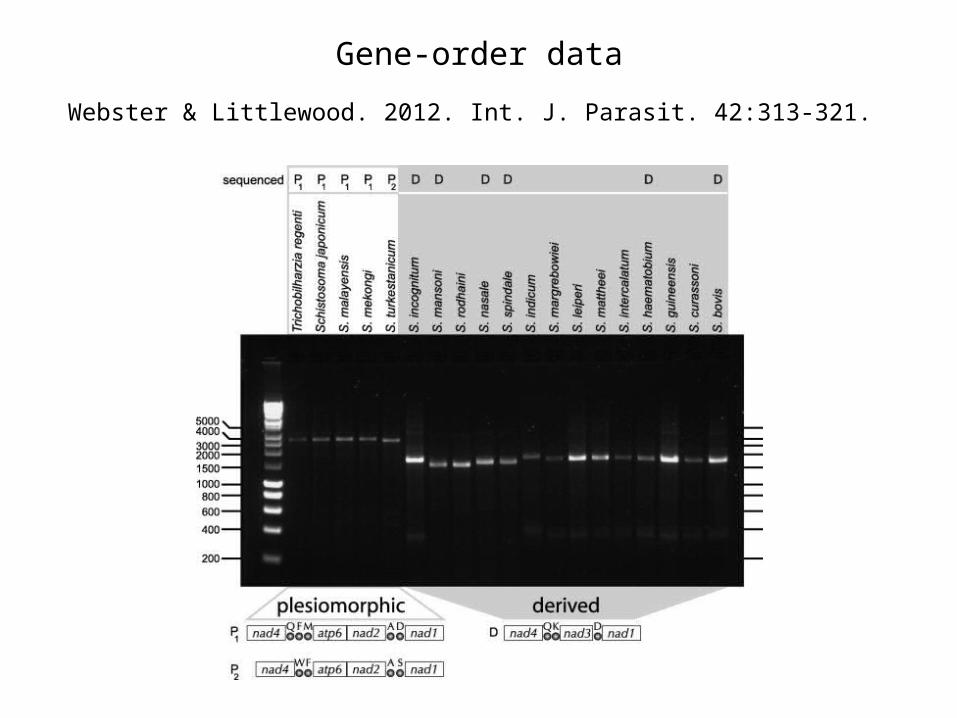
Webster & Littlewood. 2012. Int. J. Parasit. 42:313-321.
Gene-order data

Genomic Distances
Increasingly, gene content data have been applied to the growing database of prokaryotic genomes.
High Scoring Pairs – “genes” that have high scores in BLAST searches.
They measure the number of base-pairs shared in a pair of genomes in these putative homologous genes.
Snel et al. 1999. Nature Genetics 21:108-110.Korbel et al.2002 Trends Genet. 18:158-162. Bernard et al. 2002 J. Comp. Syst. Sci. 65:508-525.Henz et al., 2005. Bioinformatics. 21:2329-2335.
Auch et al. 2010. Standard operating procedure for calculating genome-to-genome distances based on high-scoring segment pairs. Standards in Genomic Sciences. 2:142-148.