lecture 22: corruption lecture 1 - mit opencourseware · corruption lecture 1. 2 / 25. ... choosing...
TRANSCRIPT
14.7 : Corruption Lecture 1
Ben Olken
Olken () Corruption Lecture 1 1 / 25
5
Outline
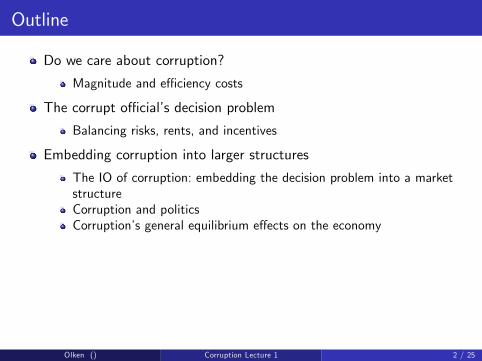
Do we care about corruption? Magnitude and effi ciency costs
The corrupt offi cial’s decision problem Balancing risks, rents, and incentives
Embedding corruption into larger structures The IO of corruption: embedding the decision problem into a market structure Corruption and politics Corruption’s general equilibrium effects on the economy
Olken () Corruption Lecture 1 2 / 25
Measurement
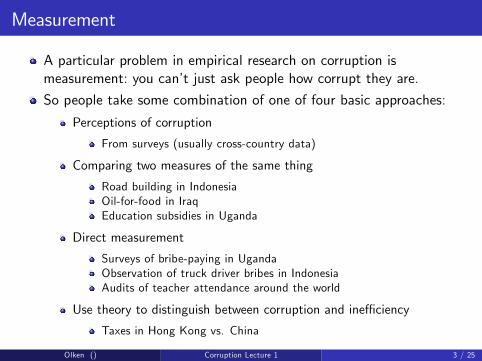
A particular problem in empirical research on corruption is measurement: you can’t just ask people how corrupt they are. So people take some combination of one of four basic approaches:
Perceptions of corruption From surveys (usually cross-country data)
Comparing two measures of the same thing Road building in Indonesia Oil-for-food in Iraq Education subsidies in Uganda
Direct measurement Surveys of bribe-paying in Uganda Observation of truck driver bribes in Indonesia Audits of teacher attendance around the world
Use theory to distinguish between corruption and ineffi ciency Taxes in Hong Kong vs. China
Olken () Corruption Lecture 1 3 / 25
-
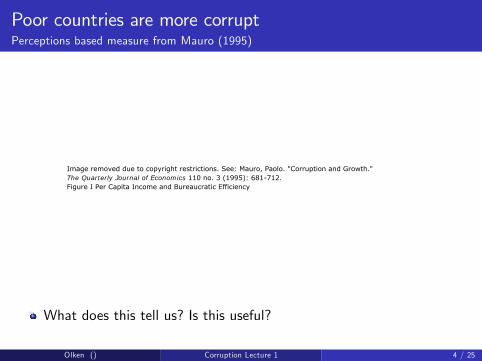
Poor countries are more corrupt Perceptions based measure from Mauro (1995)
What does this tell us? Is this useful?
Olken () Corruption Lecture 1 4 / 25
Image removed due to copyright restrictions. See: Mauro, Paolo. "Corruption and Growth."The Quarterly Journal of Economics 110 no. 3 (1995): 681-712.Figure I Per Capita Income and Bureaucratic Efficiency
""
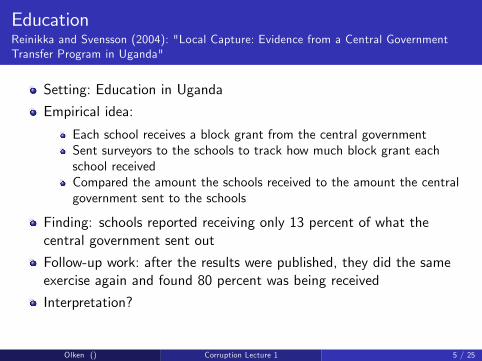
Setting: Education in Uganda Empirical idea:
Each school receives a block grant from the central government Sent surveyors to the schools to track how much block grant each school received Compared the amount the schools received to the amount the central government sent to the schools
Finding: schools reported receiving only 13 percent of what the central government sent out Follow-up work: after the results were published, they did the same exercise again and found 80 percent was being received Interpretation?
Olken () Corruption Lecture 1 5 / 25
EducationReinikka and Svensson (2004): "Local Capture: Evidence from a Central GovernmentTransfer Program in Uganda"
"- - "
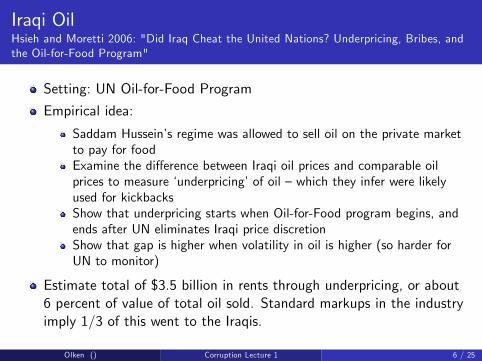
Setting: UN Oil-for-Food Program Empirical idea:
Saddam Hussein’s regime was allowed to sell oil on the private market to pay for food Examine the difference between Iraqi oil prices and comparable oil prices to measure ‘underpricing’of oil — which they infer were likely used for kickbacks Show that underpricing starts when Oil-for-Food program begins, and ends after UN eliminates Iraqi price discretion Show that gap is higher when volatility in oil is higher (so harder for UN to monitor)
Estimate total of $3.5 billion in rents through underpricing, or about 6 percent of value of total oil sold. Standard markups in the industry imply 1/3 of this went to the Iraqis.
Olken () Corruption Lecture 1 6 / 25
Iraqi OilHsieh and Moretti 2006: "Did Iraq Cheat the United Nations? Underpricing, Bribes, andthe Oil-for-Food Program"
Results 1214 QUARTERLY JOURNAL OF ECONOMICS
8 A
\ 4 -
-p\,t ' ?
^ -2
-__ 1985 1990 1995 2000 2003
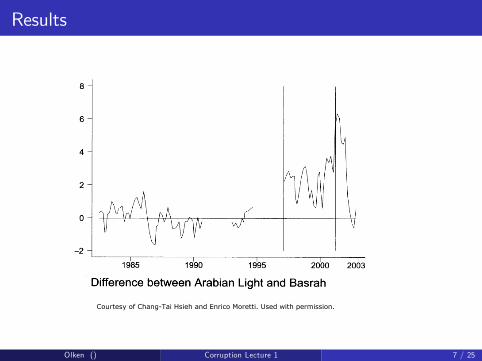
Difference between Arabian Light and Basrah
6 -
4 -
-2 -I_
1985 1990 1995 2000 2003
Difference between Urals and Kirkuk
Figure I
Difference between the Market Price of Close Substitutes and the Official Selling Price of Iraqi Oils
The top panel shows the difference between the market price of Arabian Light and the official selling price of Basrah. Arabian Light is the closest substitute of Basrah. The bottom panel shows the difference between the market price of Urals and the official selling price of Kirkuk. Urals is the closest substitute of Kirkuk. The first vertical line marks the beginning of the Oil for Food Program. The second vertical line indicates the beginning of retroactive pricing. The horizontal line is the average difference for the years before the Oil for Food Program. Iraqi oil was not traded in 1991-1993 due to the first Gulf War, and in 1995-1997 due to delays in the Oil for Food Program.
Olken () Corruption Lecture 1 7 / 25
Courtesy of Chang-Tai Hsieh and Enrico Moretti. Used with permission.

""
Setting: primary schools and health clinics in Bangladesh, Ecuador, India, Indonesia, Peru, and Uganda Empirical idea: surveyors randomly arrived and noted what percent of workers were present in the facility at the time of the spot check Results: on average, 19 percent of teachers and 35 percent of health workers weren’t present Higher in poorer countries and poorer states in India Is this corruption?
Olken () Corruption Lecture 1 8 / 25
Magnitudes: Direct evidenceChaudhury, Hammer, Kremer, Muralidharan, and Rogers: "Missing in Action: Teacherand Health Worker Absence in Developing Countries"
Correlation with Income 98 Journal of Economic Perspectives
Figure 1 Absence Rate versus National/State Per Capita Income
Absence
rate
(1)
60-
40
20-
0-
Teachers
Countries Indian states Fitted values
~J~:;G~Xd~4
IBNG IDN tcu
PER
6.5 7 7.5 8 8.5 Per capita income
(GDP, 2002, PPP-adjusted)
Absence
rate
(1O
60-
40-
20-
0-
Health workers
UGA NN"
IDN
PER
Countries Indian states Fitted values
6.5 7 7.5 8 8.5
Per capita income
(GDP, 2002, PPP-adjusted)
Source: Authors' calculations. Note: BNG = Bangladesh; ECU = Ecuador; IDN = Indonesia; PER = Peru; UGA = Uganda. India's national averages are excluded, due to the inclusion of the Indian states. For Indian states, incomes are the official per capita net state domestic products.
capital acquisition and thus income. Another is that the overall level of develop- ment drives the quality of education and health delivery. While it is impossible to
disentangle these stories completely, to the extent that the overall level of devel-
opment influences provider absence, one might expect low income levels to lead to
high absence rates in both education and health. On the other hand, if education is particularly important for human capital acquisition, and thus income, while medical clinics have a larger consumption component, then exogenous variation in
quality of education systems will lead to variation in income, while the quality of health care systems will be less correlated with income. This pattern matches what we see in the data.
It is intriguing that the relationship between income and absence is so similar across countries and across Indian states, and that it is so tight in each case. While salaries typically rise with GDP (although not proportionally), teacher salaries across Indian states are relatively flat.6 Thus, across the states of India, salaries for teachers and health workers in poor states are considerably higher relative to the cost of living and relative to workers' outside opportunities than are salaries in rich states. Nonetheless, absence rates are higher in poor states. The similarity between the absence-income regression line across countries and the comparable line across Indian states, despite the difference in the relationship between income and salaries in the two samples, suggests a limited role for salaries in influencing
6 Ministry of Human Resource Development, India.
Olken () Corruption Lecture 1 9 / 25
Image removed due to copyright restrictions. See: Chaudhury, Nazmul, Jeffrey Hammer, et al. "Missing in Action: Teacherand Health Worker Absence in Developing Countries." Journal of Economic Perspectives 20, no. 1 (2006): 91-116.

" ‘ ’"
Question: what is the ’elasticity’of tax evasion with respect to tax rates?
This is a key parameter in determining the optimal tax rate Empirical challenge: very hard to measure what the true tax assessment should be. Fisman and Wei’s idea:
Comparing two measures: Look at both sides of the China - Hong Kong border, where China is the ’high evasion’side and Hong Kong is the ’low evasion side’ Denote the difference between what Hong Kong (low corruption) and China (high corruption) reports as evasion, i.e,
gap_value = log (export_value) − log (import_value)
Use theory: theory says the gap should be higher when tax rates are higher.
Olken () Corruption Lecture 1 10 / 25
Does corruption respond the way we expect?Fisman and Wei (2004): "Tax Rates and Tax Evasion: Evidence from ‘Missing Imports’inChina"
Findings
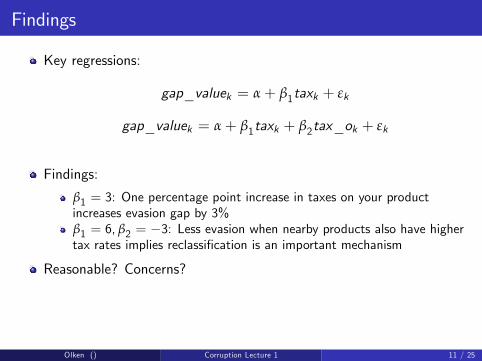
Key regressions:
gap_valuek = α + β1taxk + εk
gap_valuek = α + β1taxk + β2tax_ok + εk
Findings: β1 = 3: One percentage point increase in taxes on your product increases evasion gap by 3% β1 = 6, β2 = −3: Less evasion when nearby products also have higher tax rates implies reclassification is an important mechanism
Reasonable? Concerns?
Olken () Corruption Lecture 1 11 / 25
Summary of Magnitudes
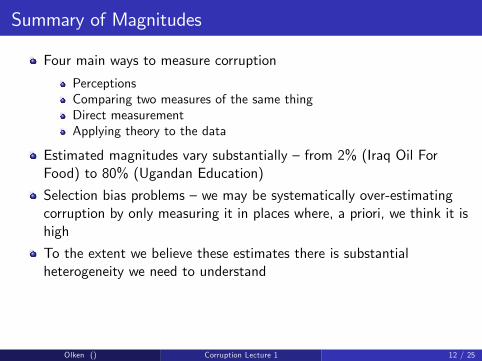
Four main ways to measure corruption Perceptions Comparing two measures of the same thing Direct measurement Applying theory to the data
Estimated magnitudes vary substantially — from 2% (Iraq Oil For Food) to 80% (Ugandan Education) Selection bias problems — we may be systematically over-estimating corruption by only measuring it in places where, a priori, we think it is high To the extent we believe these estimates there is substantial heterogeneity we need to understand
Olken () Corruption Lecture 1 12 / 25
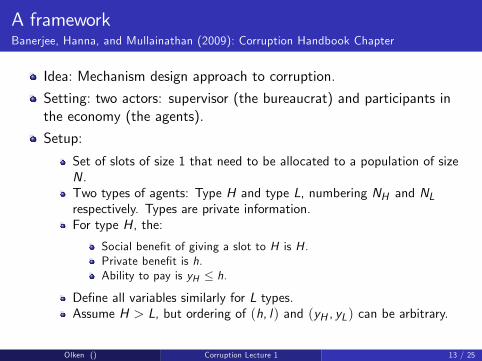
A framework Banerjee, Hanna, and Mullainathan (2009): Corruption Handbook Chapter
Idea: Mechanism design approach to corruption. Setting: two actors: supervisor (the bureaucrat) and participants in the economy (the agents). Setup:
Set of slots of size 1 that need to be allocated to a population of size N. Two types of agents: Type H and type L, numbering NH and NL respectively. Types are private information. For type H, the:
Social benefit of giving a slot to H is H . Private benefit is h. Ability to pay is yH ≤ h.
Define all variables similarly for L types. Assume H > L, but ordering of (h, l) and (yH , yL ) can be arbitrary.
Olken () Corruption Lecture 1 13 / 25
Four cases
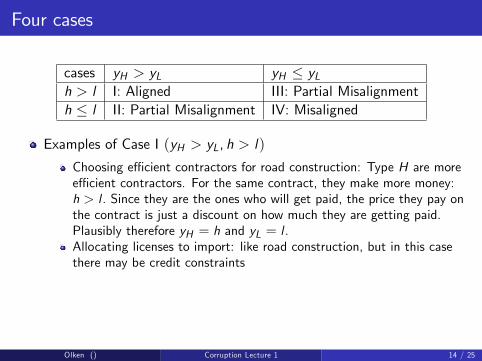
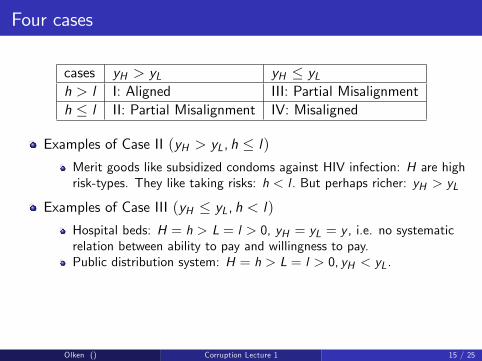
cases yH > yL yH ≤ yL h > l I: Aligned III: Partial Misalignment h ≤ l II: Partial Misalignment IV: Misaligned
Examples of Case I (yH > yL, h > l) Choosing effi cient contractors for road construction: Type H are more effi cient contractors. For the same contract, they make more money: h > l . Since they are the ones who will get paid, the price they pay on the contract is just a discount on how much they are getting paid. Plausibly therefore yH = h and yL = l . Allocating licenses to import: like road construction, but in this case there may be credit constraints
Olken () Corruption Lecture 1 14 / 25
Four cases
cases yH > yL yH ≤ yL h > l I: Aligned III: Partial Misalignment h ≤ l II: Partial Misalignment IV: Misaligned
Examples of Case II (yH > yL, h ≤ l) Merit goods like subsidized condoms against HIV infection: H are high risk-types. They like taking risks: h < l . But perhaps richer: yH > yL
Examples of Case III (yH ≤ yL, h < l) Hospital beds: H = h > L = l > 0, yH = yL = y , i.e. no systematic relation between ability to pay and willingness to pay. Public distribution system: H = h > L = l > 0, yH < yL.
Olken () Corruption Lecture 1 15 / 25
Four cases
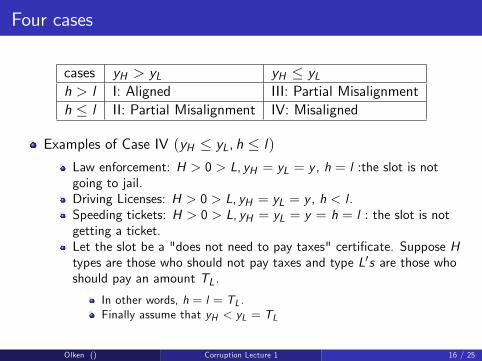
cases yH > yL yH ≤ yL h > l I: Aligned III: Partial Misalignment h ≤ l II: Partial Misalignment IV: Misaligned
Examples of Case IV (yH ≤ yL, h ≤ l) Law enforcement: H > 0 > L, yH = yL = y , h = l :the slot is not going to jail. Driving Licenses: H > 0 > L, yH = yL = y , h < l . Speeding tickets: H > 0 > L, yH = yL = y = h = l : the slot is not getting a ticket. Let the slot be a "does not need to pay taxes" certificate. Suppose H types are those who should not pay taxes and type L's are those who should pay an amount TL.
In other words, h = l = TL . Finally assume that yH < yL = TL
Olken () Corruption Lecture 1 16 / 25
Implications
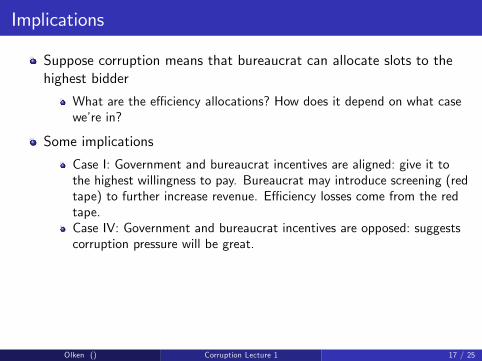
Suppose corruption means that bureaucrat can allocate slots to the highest bidder
What are the effi ciency allocations? How does it depend on what case we’re in?
Some implications Case I: Government and bureaucrat incentives are aligned: give it to the highest willingness to pay. Bureaucrat may introduce screening (red tape) to further increase revenue. Effi ciency losses come from the red tape. Case IV: Government and bureaucrat incentives are opposed: suggests corruption pressure will be great.
Olken () Corruption Lecture 1 17 / 25
" ’"
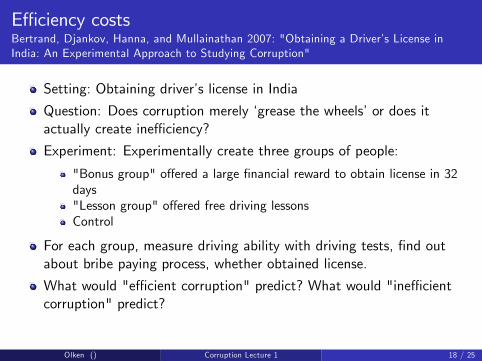
Setting: Obtaining driver’s license in India Question: Does corruption merely ‘grease the wheels’or does it actually create ineffi ciency? Experiment: Experimentally create three groups of people:
"Bonus group" offered a large financial reward to obtain license in 32 days "Lesson group" offered free driving lessons Control
For each group, measure driving ability with driving tests, find out about bribe paying process, whether obtained license. What would "effi cient corruption" predict? What would "ineffi cient corruption" predict?
Olken () Corruption Lecture 1 18 / 25
Effi ciency costsBertrand, Djankov, Hanna, and Mullainathan 2007: "Obtaining a Driver’s License inIndia: An Experimental Approach to Studying Corruption"
Summary Statistics
Olken () Corruption Lecture 1 19 / 25
Images removed due to copyright restrictions. See: Bartrand, Marianne, Simeon Djankov, Rema Hanna, andSendhil Mullainathan."Obtaining a Driver's License in India: An Experimental Approach to Studying Corruption."The Quarterly Journal of Economics 122 no. 4 (2007): 1639-76.Table II Summary Statistics on the Bureaucratic Process for the Comparison GroupTable III Obtaining a LicenseTable IV Payments and ProcessTable VI Audity Study
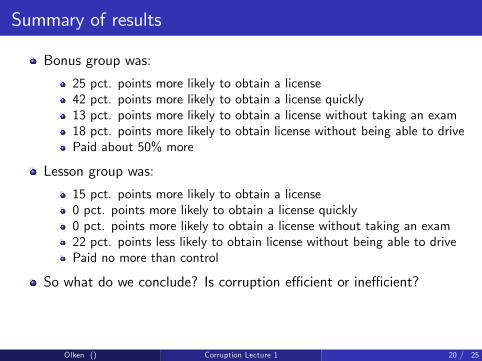
Summary of results
Bonus group was: 25 pct. points more likely to obtain a license 42 pct. points more likely to obtain a license quickly 13 pct. points more likely to obtain a license without taking an exam 18 pct. points more likely to obtain license without being able to drive Paid about 50% more
Lesson group was: 15 pct. points more likely to obtain a license 0 pct. points more likely to obtain a license quickly 0 pct. points more likely to obtain a license without taking an exam 22 pct. points less likely to obtain license without being able to drive Paid no more than control
So what do we conclude? Is corruption effi cient or ineffi cient?
Olken () Corruption Lecture 1 20 / 25

Agents
One important result is that almost all of the change in the bonus group comes from using agents To study what agent can and cannot do, author conducted an "audit study":
Hired actors to approach agents to request assistance obtaining a drivers’license Varied their situation (can drive, can’t drive, etc), and measured whether agent states he can produce a license and, if so, the price
Olken () Corruption Lecture 1 21 / 25
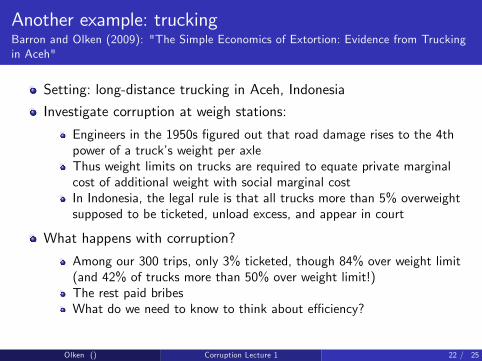
""
Setting: long-distance trucking in Aceh, Indonesia Investigate corruption at weigh stations:
Engineers in the 1950s figured out that road damage rises to the 4th power of a truck’s weight per axle Thus weight limits on trucks are required to equate private marginal cost of additional weight with social marginal cost In Indonesia, the legal rule is that all trucks more than 5% overweight supposed to be ticketed, unload excess, and appear in court
What happens with corruption? Among our 300 trips, only 3% ticketed, though 84% over weight limit (and 42% of trucks more than 50% over weight limit!) The rest paid bribes What do we need to know to think about effi ciency?
Olken () Corruption Lecture 1 22 / 25
Another example: truckingBarron and Olken (2009): "The Simple Economics of Extortion: Evidence from Truckingin Aceh"
Results
Olken () Corruption Lecture 1 23 / 25
Images removed due to copyright restrictions. See: Olken, Benjamin A., and Patrick Barron. "The SimpleEconomics of Extortion: Evidence from Trucking in Aceh." NBER Working Paper No. 13145 (2009).
Summary of findings
Payments at weigh stations increasing function of truck weight Note that the intercept is greater than 0 — so some extortion On average, Rp. 3,400 (US $0.3) for each ton overweight Much more concave than offi cial fine schedule
Interesting question: how should the government design the rules, knowing they will be used as the threat point in a corrupt bargaining game?
Olken () Corruption Lecture 1 24 / 25
Summary
Four main ways to measure corruption Perceptions Comparing two measures of the same thing Direct measurement Inference from theory
Effi ciency implications Depends on whether the government’s interests are aligned with or against private interests Effi ciency costs likely to be higher when government interests are against private willingness to pay Examples from trucking and drivers’licenses suggest that this may be the case But understanding effi ciency costs of corruption is an area for more research
Olken () Corruption Lecture 1 25 / 25

MIT OpenCourseWarehttp://ocw.mit.edu
14.75 Political Economy and Economic DevelopmentFall 2012
For information about citing these materials or our Terms of Use, visit: http://ocw.mit.edu/terms.