lecture 2: onset of el nino, the greenhouse effect, and consequences of arctic ice melt
TRANSCRIPT

Lecture 2:
Onset of El Nino, the greenhouse effect, and consequences of Arctic ice melt

Schematic view of sea surface temperature and tropical rainfall in the equatorial Pacific Ocean during normal, El Niño, and La Niña conditions.The sea-surface temperature is shaded: blue-cold and orange-warm. The dark arrows indicate the direction of air movement in the atmosphere: upward arrows are associated with clouds and rainfall and downward-pointing arrows are associated with a general lack of rainfall.
Quick Review:
El Nino & La Nina
CW
WW
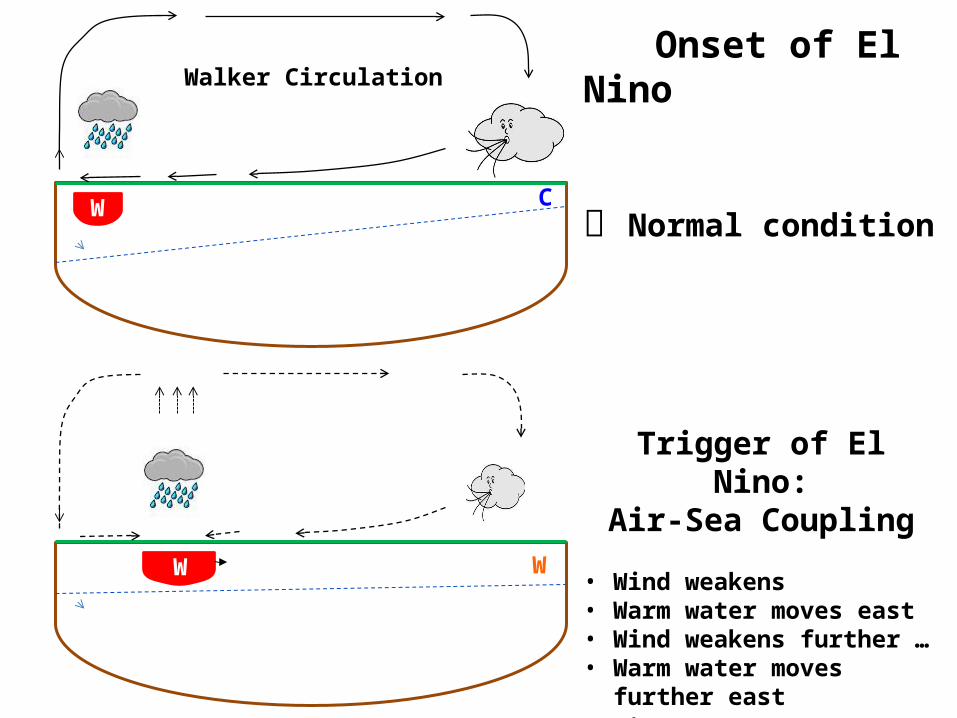
Onset of El Nino
Normal condition
Trigger of El Nino:Air-Sea Coupling
• Wind weakens• Warm water moves east• Wind weakens further …• Warm water moves further east• etc…
Walker Circulation

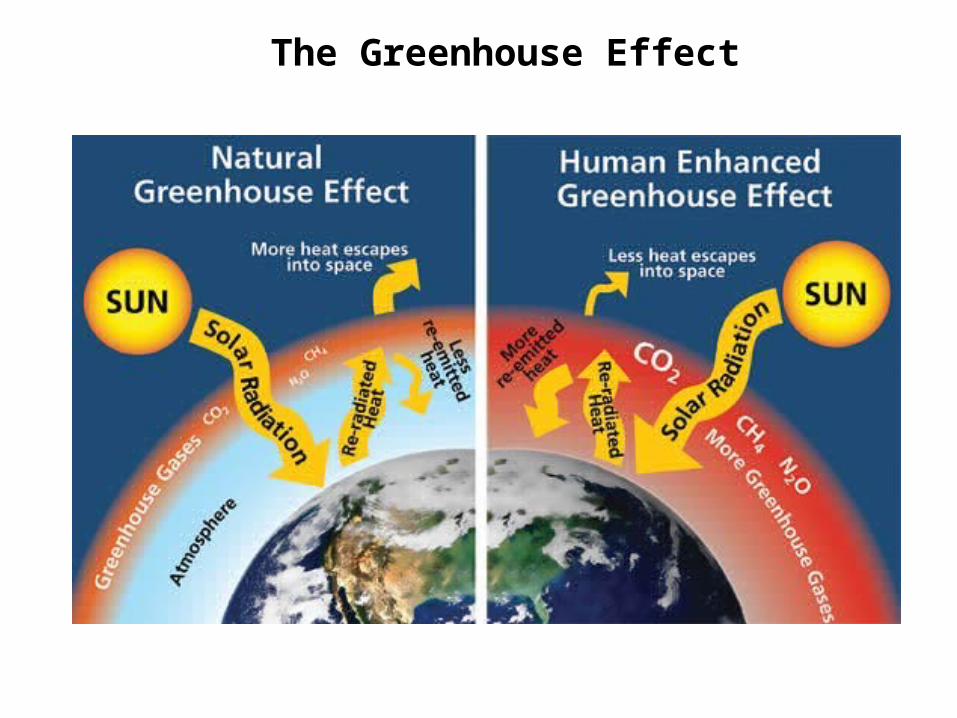
Greenhouse GasesGreenhouse gases: carbon dioxide, methane, nitrous oxide, water vapor, etc.
Function: they absorb and emit heat energy, creating the greenhouse effect that keeps our planet's temperature livable
Water vapor is the most plentiful greenhouse gas on the planet, accounting for about 60% of the current greenhouse effect.
Since the industrial revolution, people have burned vast amounts of coal, petroleum, and other fossil fuels to create heat and power. This releases carbon dioxide, the most plentiful human-produced greenhouse gas, into the atmosphere. The result: more heat is trapped in Earth's atmosphere instead of radiating out into space.

Radiative energy balanceEarth's surface temperature has been quite stable over time, 3 oC over 1000’s of years;
Temperature is stable because earth radiates energy back to space at a rate energy input it receives from the sun -- the planet is close to being in radiative energy balance;
Sun emits radiation strongly in the visible light range of the electromagnetic spectrum; it also produces ultraviolet and infrared radiation. The earth radiates heat back to space mostly at much longer wavelengths than solar radiation (see Figure below):
Figure: The electromagnetic spectrum. The Sun is much hotter than Earth, so it emits radiation at shorter wavelengths. The solar spectrum x 10-6 applies at the surface of the Sun, not at Earth's orbit. Solar energy flux is lower by a factor of 50,000 at Earth's orbit.
4m

AlbedoSolar radiation is absorbed by clouds, the atmosphere, or the earth’s surface, and then is transformed into heat energy, which raises Earth's surface temperature. But some fraction is reflected back to space: albedo = (reflected radiation)/(incident radiation) (=0 black, 1 white), usually referring to some appropriate average across the spectrum of visible light.
Figure: The albedo of various surface conditions of the earth

The albedo of the Earth’s surface. Over the ocean the albedo is small (2–10%). It is larger over the land (typically 35–45% over desert regions) and is particularly high over snow and ice ( 80%).∼

The Solar Constant & Earth’s Temperature without Greenhouse gases
Sun’s energy flux onto earth = the Solar Constant = S 1.38 kW m-2 i.e. 1-m-diameter dish can collect enough solar energy to power 1-kW electric heater.
Total energy received by earth = R2S
Averaged per unit area of earth’s surface = R2S/4R2 = S/4 345 W m-2 (= I, say)
So earth’s temperature T = (345/B )1/4 = (345/5.6704×10-8 )1/4 270 K 0 oC.
But earth is warmer than this.
R
The Greenhouse Effect

Ground
Glass e = fraction of heat absorbed
I (<4m)
I U
B
B
(1-e) U
Long waves >4m A simple model
(of the Greenhouse effect)
Radiative heat balances in “1” & “2”
I = (1-e) U + B
I = U – B
So,
U = I/(1-e/2)
T = (U/B)1/4
If e = 1 (maximum), then T is warmer than 270K found in slide8(where e = 0) by a factor = (2)1/4 1.19; so that Tmax 321K 48 oC
Too warm, much too warm!
“1”
“2”

Since 1979, the size of the summer polar ice cap has shrunk more than 20%
Average temperatures in the Arctic region are rising twice as fast as they are elsewhere in the world. Arctic ice is getting thinner, melting and rupturing. For example, the largest single block of ice in the Arctic, the Ward Hunt Ice Shelf, had been around for 3,000 years before it started cracking in 2000. Within two years it had split all the way through and is now breaking into pieces.
The polar ice cap as a whole is shrinking. Images from NASA satellites (above picture) show that the area of permanent ice cover is contracting at a rate of 9 percent each decade. If this trend continues, summers in the Arctic could become ice-free by the end of the century.
Arctic Ice Melt

Possible consequences of Arctic ice melt• What atmospheric chain reactions occur when warming causes the Arctic ice to melt?• Why has the tropospheric pressure increased, so that the cyclonic polar wind weakened?• What happens to the Jet Stream when the Arctic warms?• Why as the jet stream slows, the amplitude of its meander can become larger?