lecture 18 community structures slides modified from huan liu, lei tang, nitin agarwal
TRANSCRIPT

Lecture 18
Community structures
Slides modified from Huan Liu, Lei Tang, Nitin Agarwal
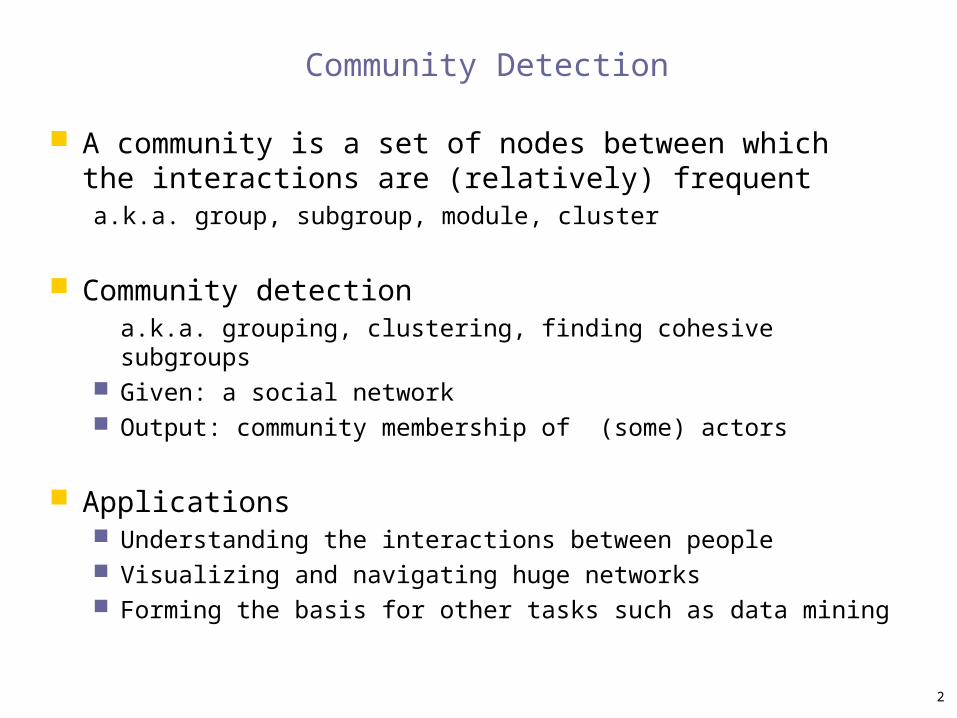
Community Detection
A community is a set of nodes between which the interactions are (relatively) frequenta.k.a. group, subgroup, module, cluster
Community detectiona.k.a. grouping, clustering, finding cohesive subgroups
Given: a social network Output: community membership of (some) actors
Applications Understanding the interactions between people Visualizing and navigating huge networks Forming the basis for other tasks such as data mining
2
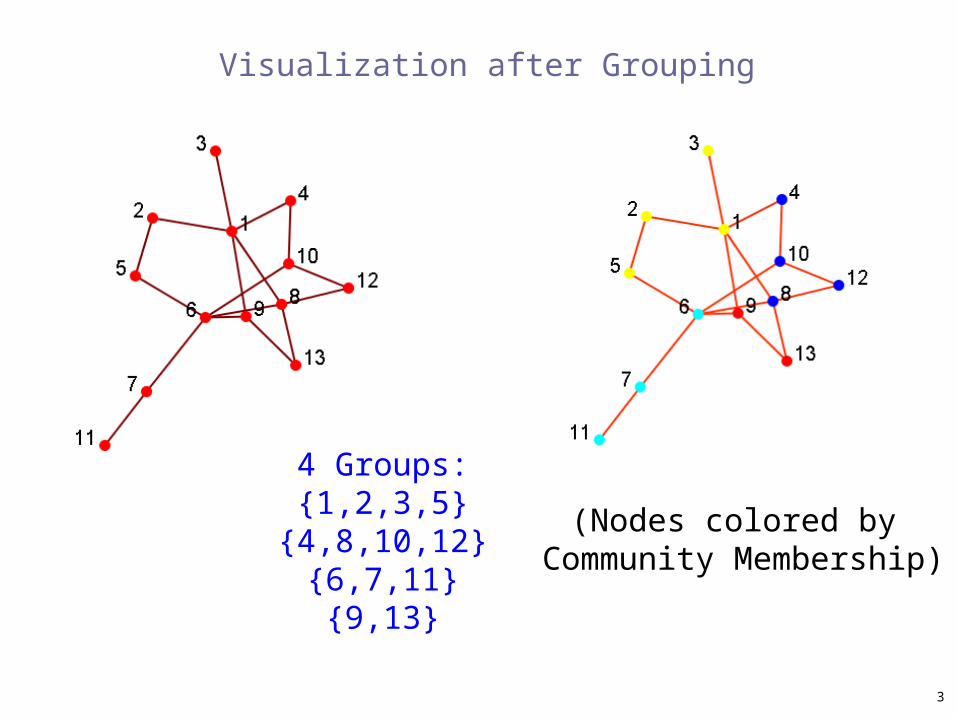
Visualization after Grouping
(Nodes colored by Community Membership)
4 Groups:{1,2,3,5}
{4,8,10,12}{6,7,11}{9,13}
3
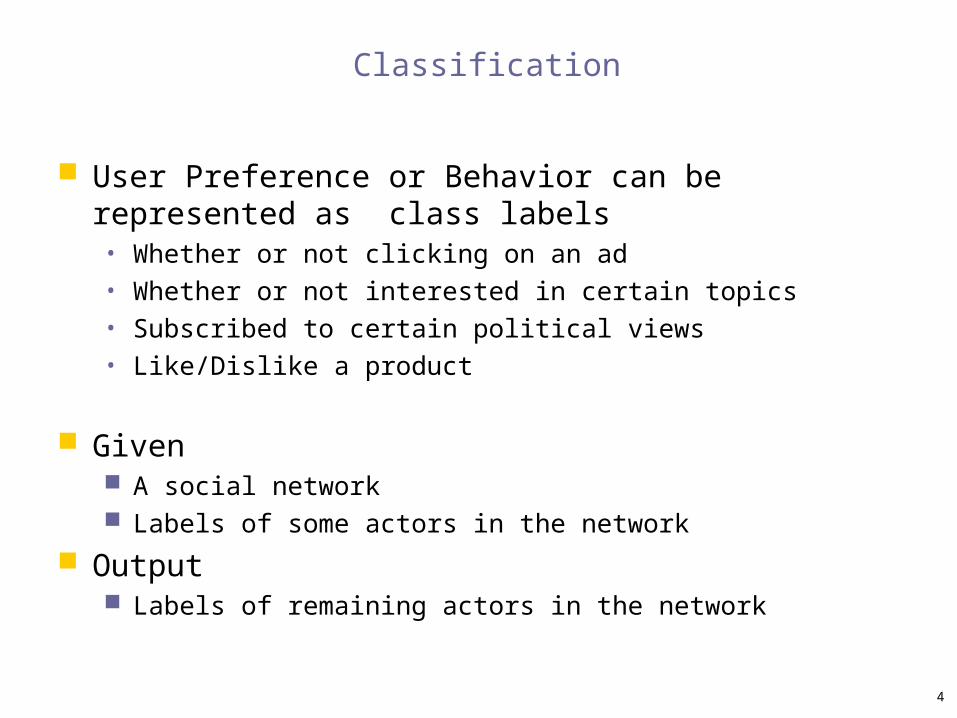
Classification
User Preference or Behavior can be represented as class labels• Whether or not clicking on an ad• Whether or not interested in certain topics• Subscribed to certain political views• Like/Dislike a product
Given A social network Labels of some actors in the network
Output Labels of remaining actors in the network
4
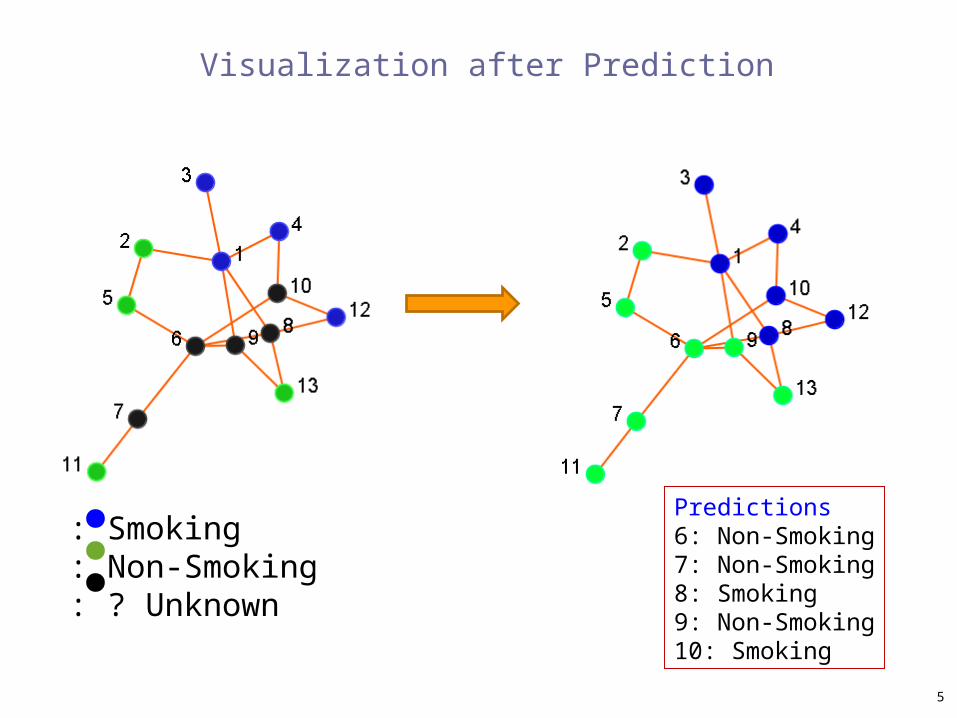
Visualization after Prediction
: Smoking: Non-Smoking: ? Unknown
Predictions6: Non-Smoking7: Non-Smoking8: Smoking9: Non-Smoking10: Smoking
5
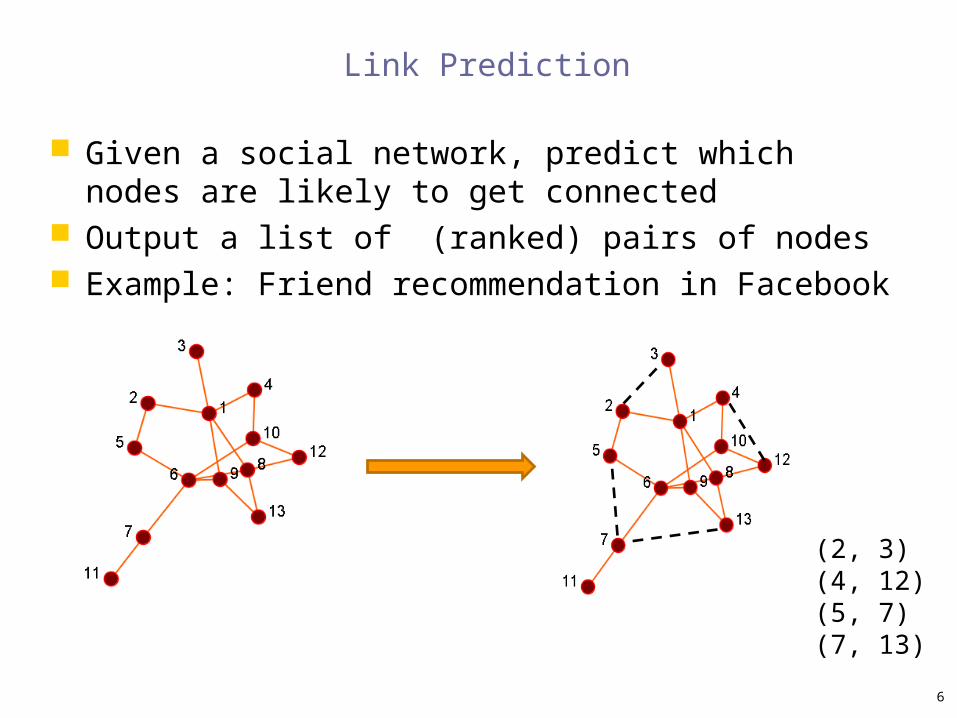
Link Prediction
Given a social network, predict which nodes are likely to get connected
Output a list of (ranked) pairs of nodes Example: Friend recommendation in Facebook
(2, 3)(4, 12)(5, 7)(7, 13)
6
Viral Marketing/Outbreak Detection
Users have different social capital (or network values) within a social network, hence, how can one make best use of this information?
Viral Marketing: find out a set of users to provide coupons and promotions to influence other people in the network so my benefit is maximized
Outbreak Detection: monitor a set of nodes that can help detect outbreaks or interrupt the infection spreading (e.g., H1N1 flu)
Goal: given a limited budget, how to maximize the overall benefit?
7
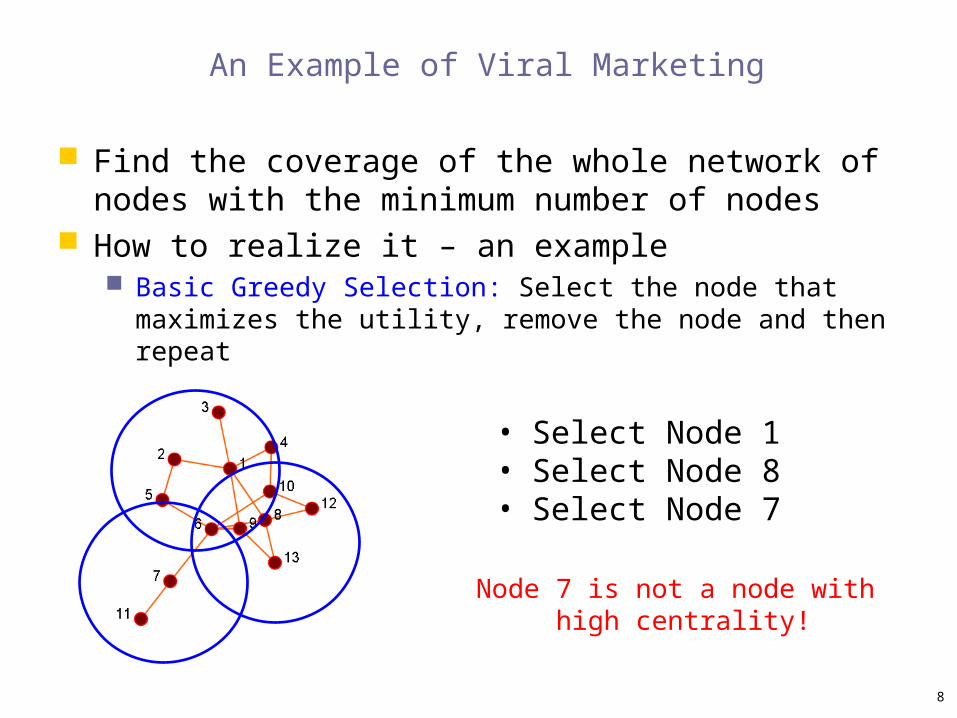
An Example of Viral Marketing
Find the coverage of the whole network of nodes with the minimum number of nodes
How to realize it – an example Basic Greedy Selection: Select the node that maximizes the
utility, remove the node and then repeat
• Select Node 1• Select Node 8• Select Node 7
Node 7 is not a node with high centrality!
8
PRINCIPLES OF COMMUNITY DETECTION
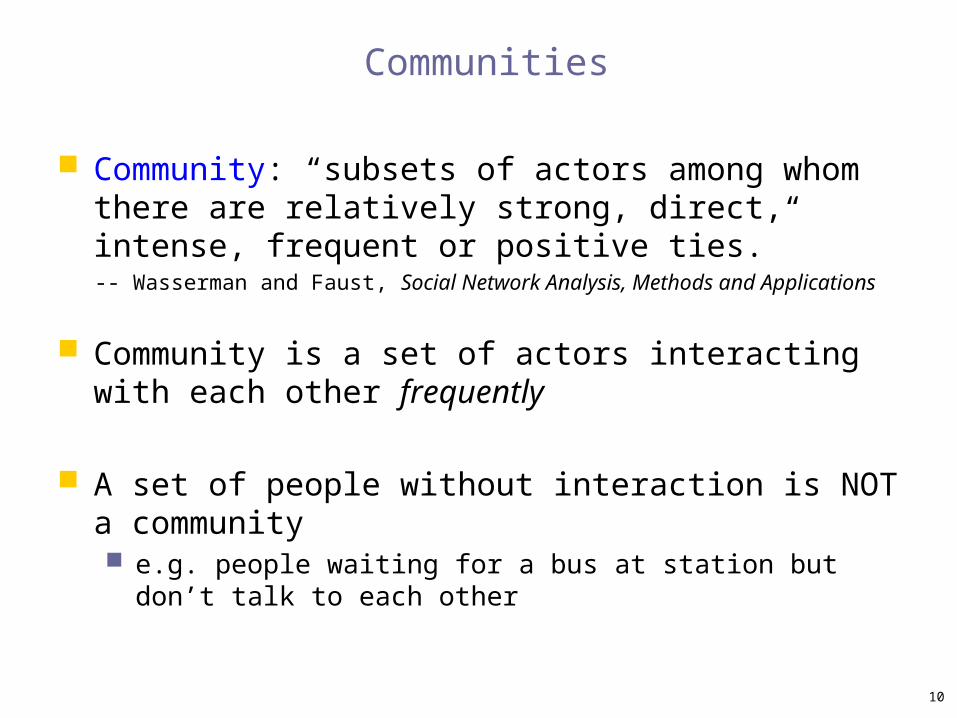
Communities
Community: “subsets of actors among whom there are relatively strong, direct, intense, frequent or positive ties.”-- Wasserman and Faust, Social Network Analysis, Methods and Applications
Community is a set of actors interacting with each other frequently
A set of people without interaction is NOT a community e.g. people waiting for a bus at station but don’t talk to each
other
10
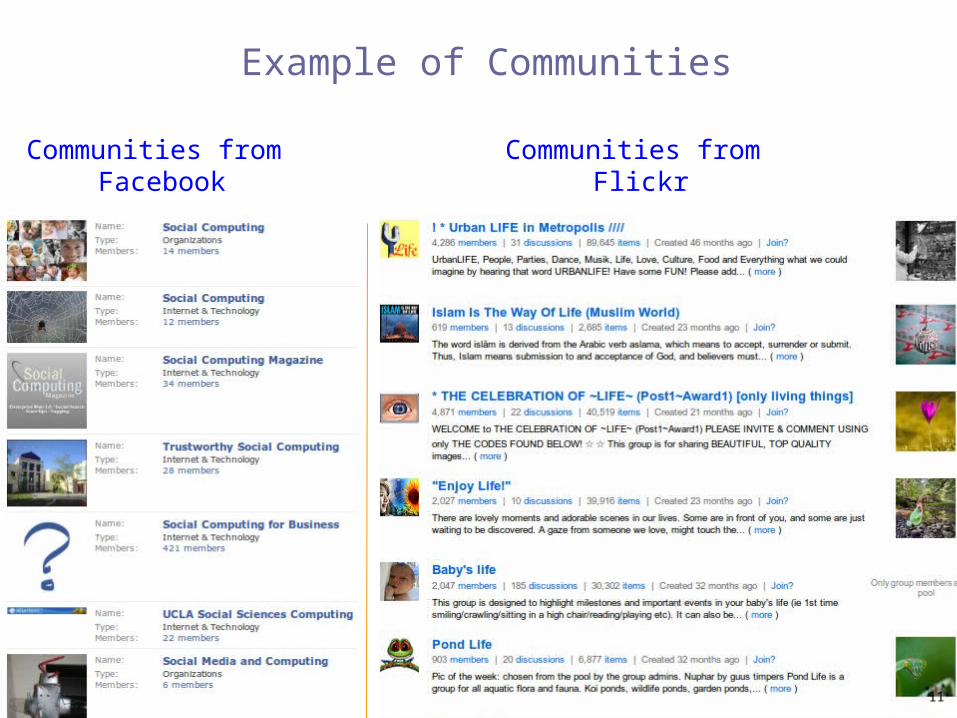
Example of Communities
Communities from Facebook
Communities from Flickr
11
Community Detection
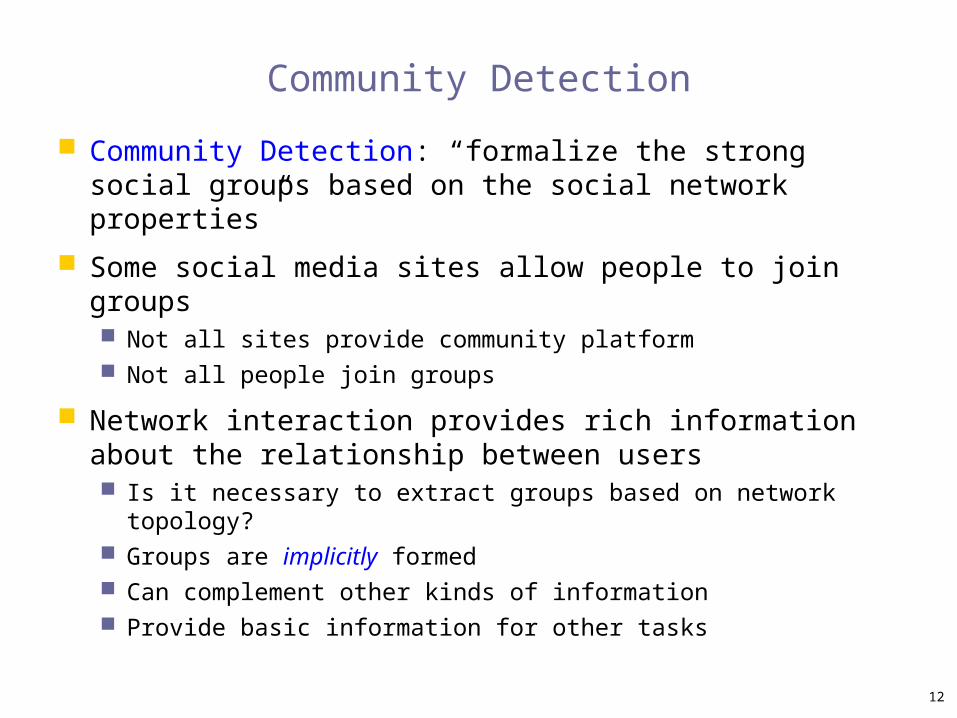
Community Detection: “formalize the strong social groups based on the social network properties”
Some social media sites allow people to join groups Not all sites provide community platform Not all people join groups
Network interaction provides rich information about the relationship between users Is it necessary to extract groups based on network topology? Groups are implicitly formed Can complement other kinds of information Provide basic information for other tasks
12
Subjectivity of Community Definition
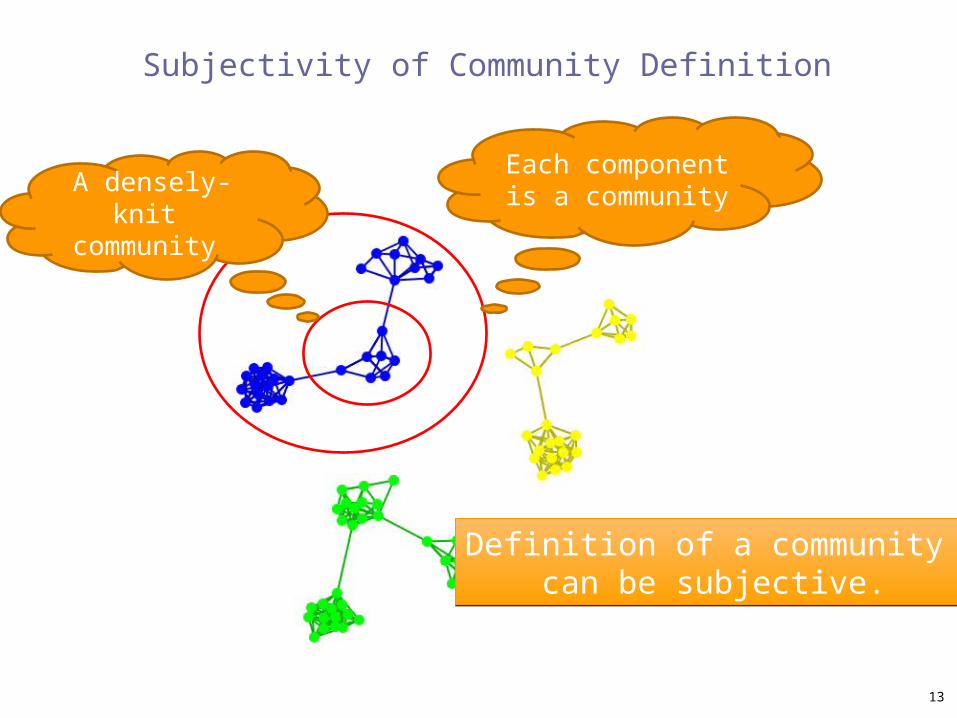
Each component is a communityA densely-knit
community
Definition of a community can be subjective.
Definition of a community can be subjective.
13
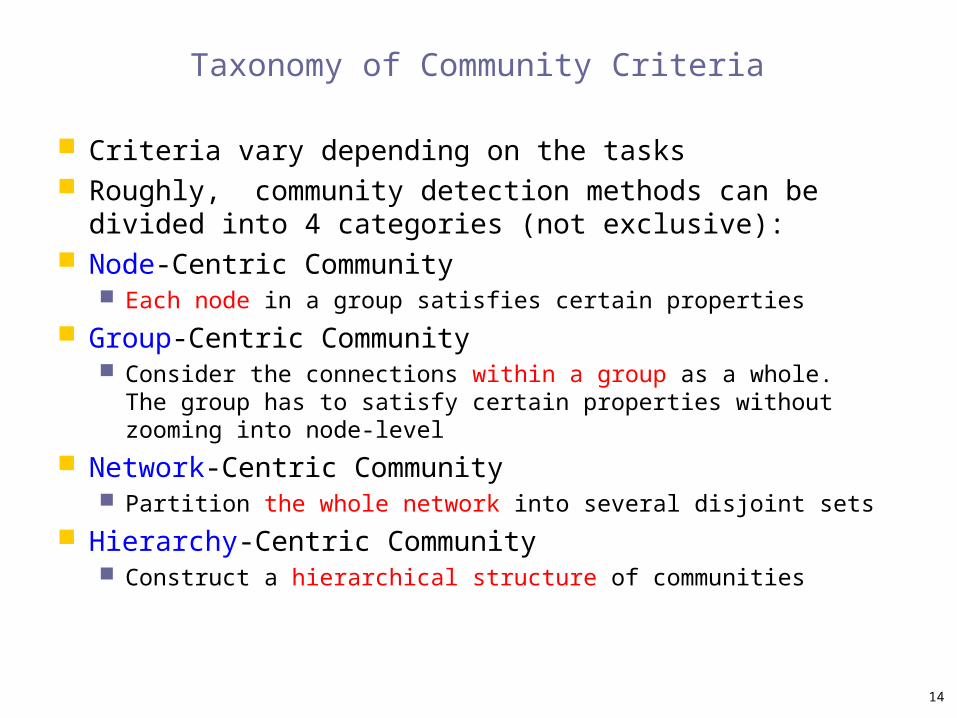
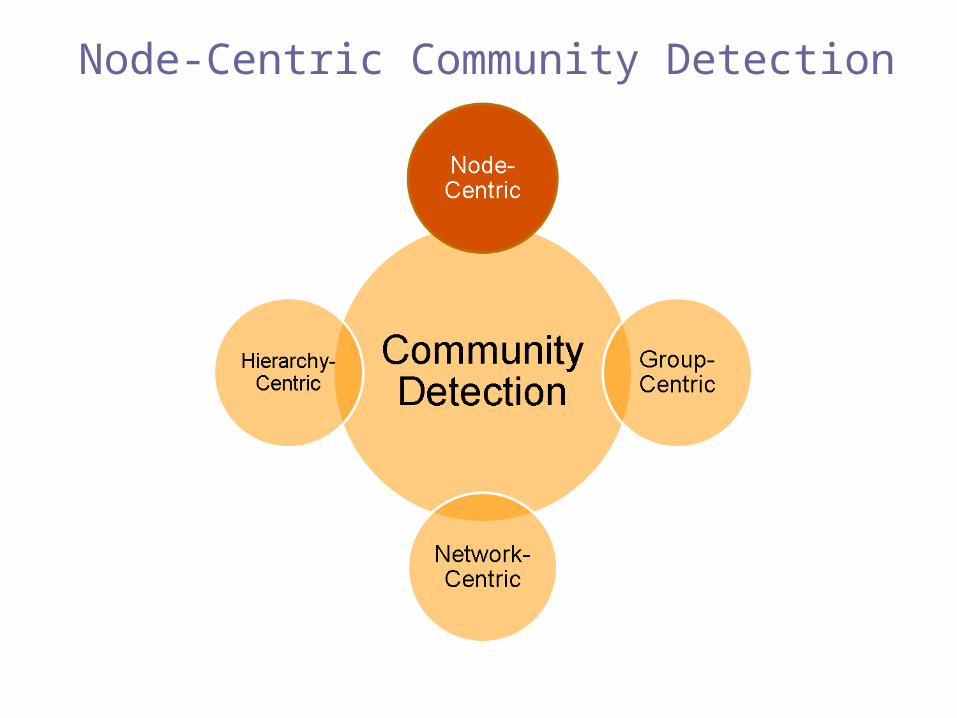
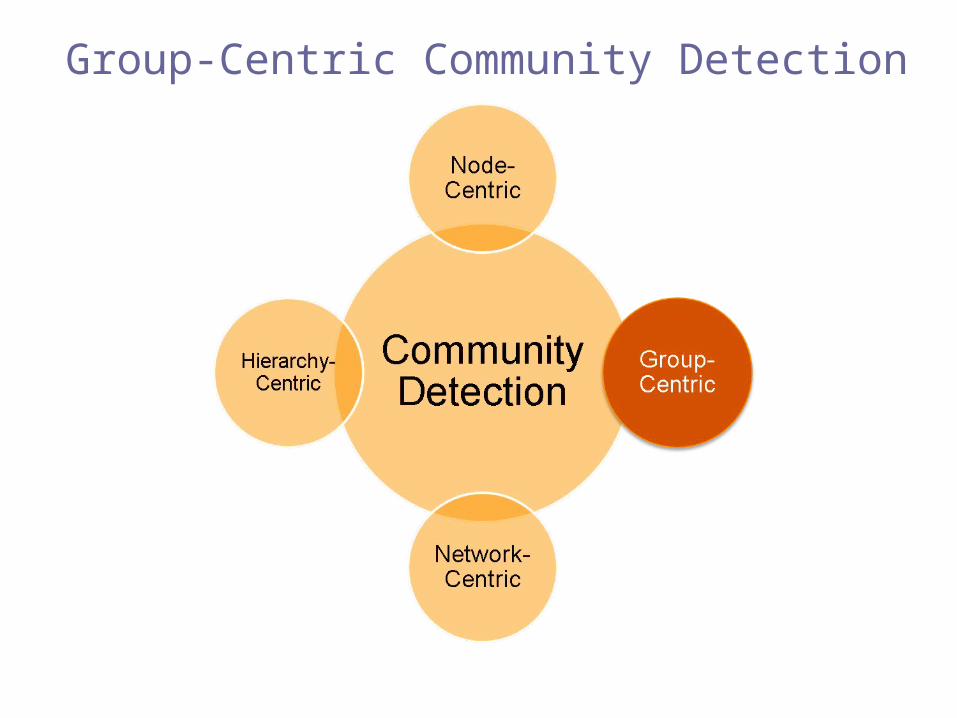
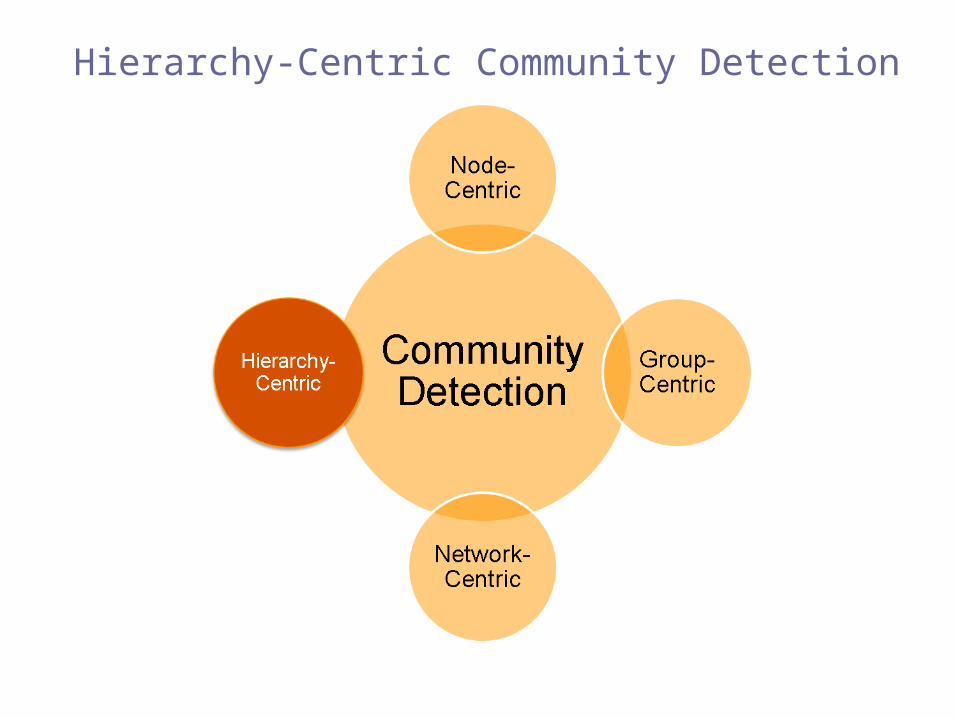
Taxonomy of Community Criteria
Criteria vary depending on the tasks Roughly, community detection methods can be divided
into 4 categories (not exclusive): Node-Centric Community
Each node in a group satisfies certain properties
Group-Centric Community Consider the connections within a group as a whole. The group
has to satisfy certain properties without zooming into node-level
Network-Centric Community Partition the whole network into several disjoint sets
Hierarchy-Centric Community Construct a hierarchical structure of communities
14
Node-Centric Community Detection
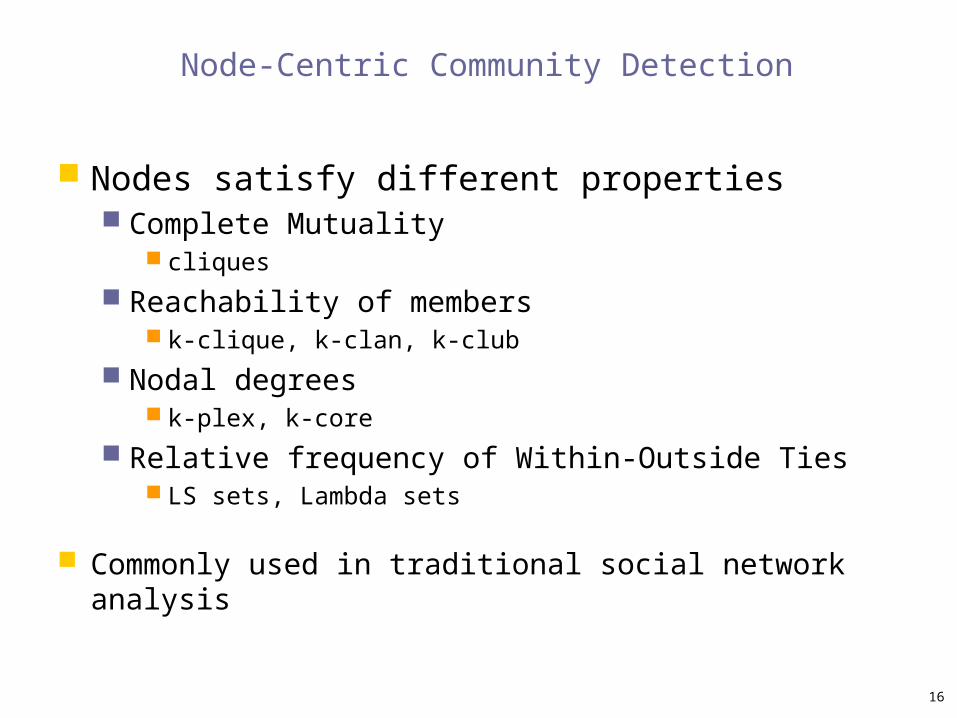
Node-Centric Community Detection
Nodes satisfy different properties Complete Mutuality
cliques
Reachability of members k-clique, k-clan, k-club
Nodal degrees k-plex, k-core
Relative frequency of Within-Outside Ties LS sets, Lambda sets
Commonly used in traditional social network analysis
16
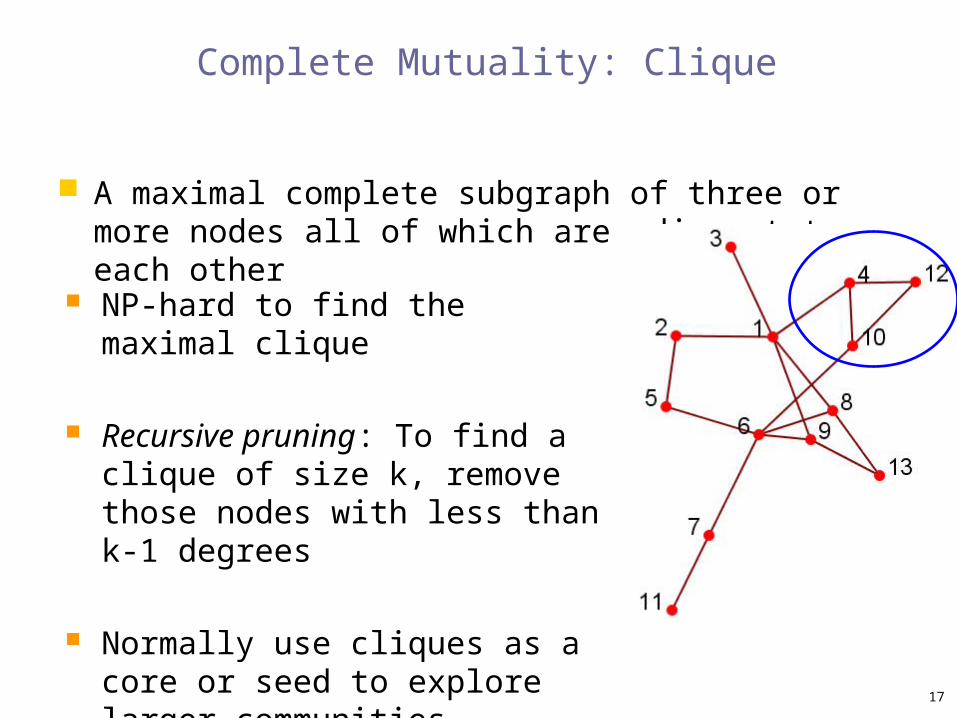
Complete Mutuality: Clique
A maximal complete subgraph of three or more nodes all of which are adjacent to each other
NP-hard to find the maximal clique
Recursive pruning: To find a clique of size k, remove those nodes with less than k-1 degrees
Normally use cliques as a core or seed to explore larger communities
17
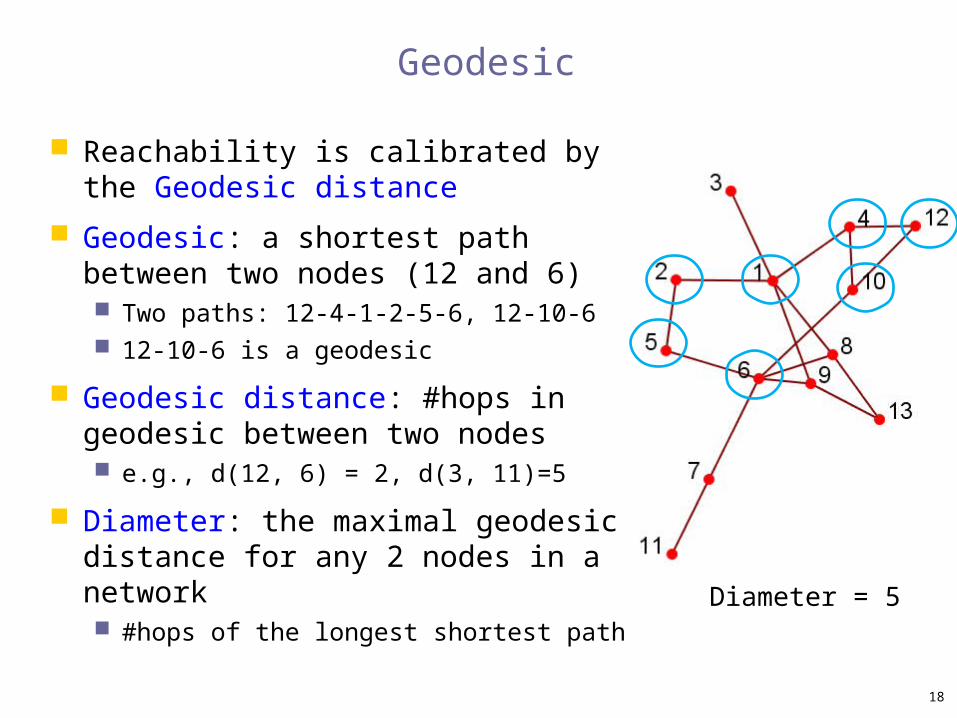
Geodesic
Reachability is calibrated by the Geodesic distance
Geodesic: a shortest path between two nodes (12 and 6) Two paths: 12-4-1-2-5-6, 12-10-6 12-10-6 is a geodesic
Geodesic distance: #hops in geodesic between two nodes e.g., d(12, 6) = 2, d(3, 11)=5
Diameter: the maximal geodesic distance for any 2 nodes in a network #hops of the longest shortest path
Diameter = 5
18
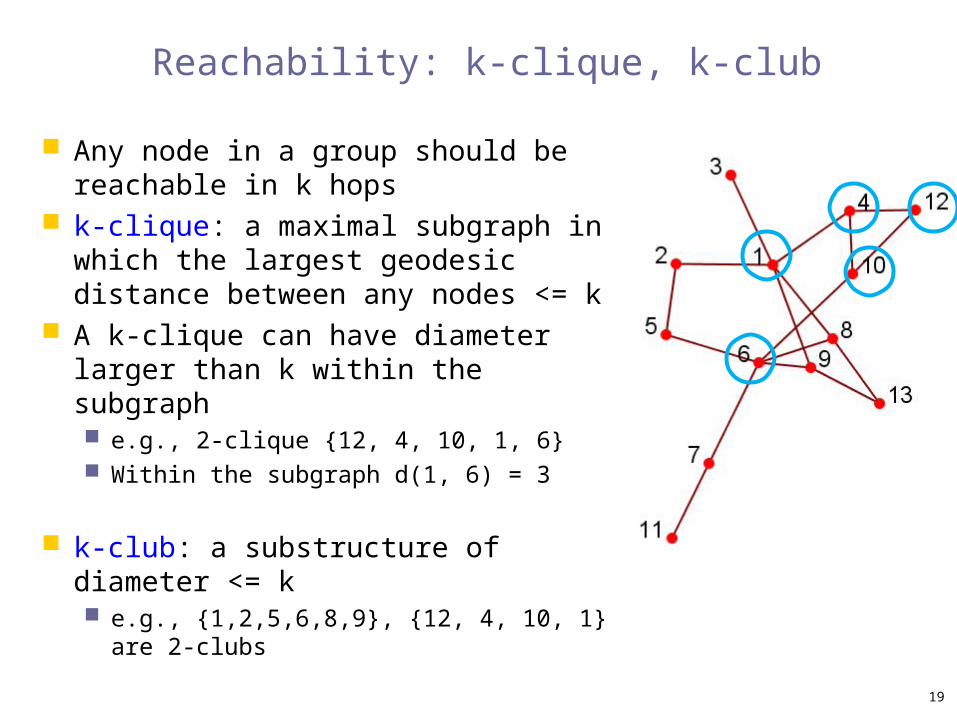
Reachability: k-clique, k-club
Any node in a group should be reachable in k hops
k-clique: a maximal subgraph in which the largest geodesic distance between any nodes <= k
A k-clique can have diameter larger than k within the subgraph e.g., 2-clique {12, 4, 10, 1, 6} Within the subgraph d(1, 6) = 3
k-club: a substructure of diameter <= k e.g., {1,2,5,6,8,9}, {12, 4, 10, 1} are 2-clubs
19
Nodal Degrees: k-core, k-plex
Each node should have a certain number of connections to nodes within the group
k-core: a substracture that each node connects to at least k members within the group
k-plex: for a group with ns nodes, each node should be adjacent no fewer than ns-k in the group
The definitions are complementary
A k-core is a (ns-k)-plex
20
Within-Outside Ties: LS sets
LS sets: Any of its proper subsets has more ties to other nodes in the group than outside the group
Too strict, not reasonable for network analysis
A relaxed definition is Lambda sets Require the computation of edge-connectivity between any
pair of nodes via minimum-cut, maximum-flow algorithm
21
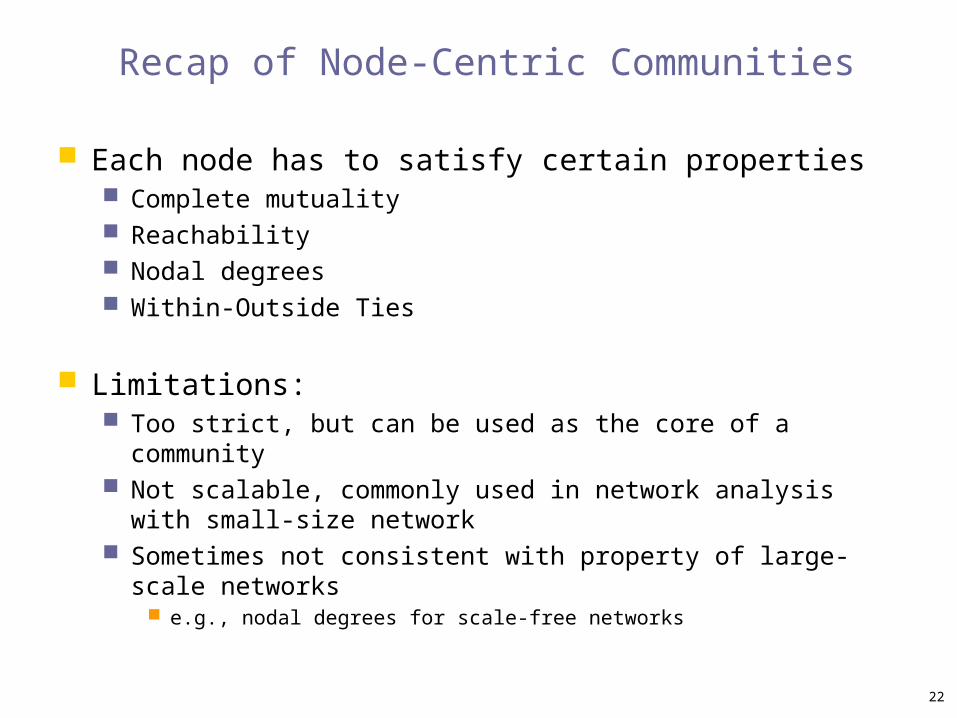
Recap of Node-Centric Communities
Each node has to satisfy certain properties Complete mutuality Reachability Nodal degrees Within-Outside Ties
Limitations: Too strict, but can be used as the core of a community Not scalable, commonly used in network analysis with small-size
network Sometimes not consistent with property of large-scale networks
e.g., nodal degrees for scale-free networks
22
Group-Centric Community Detection
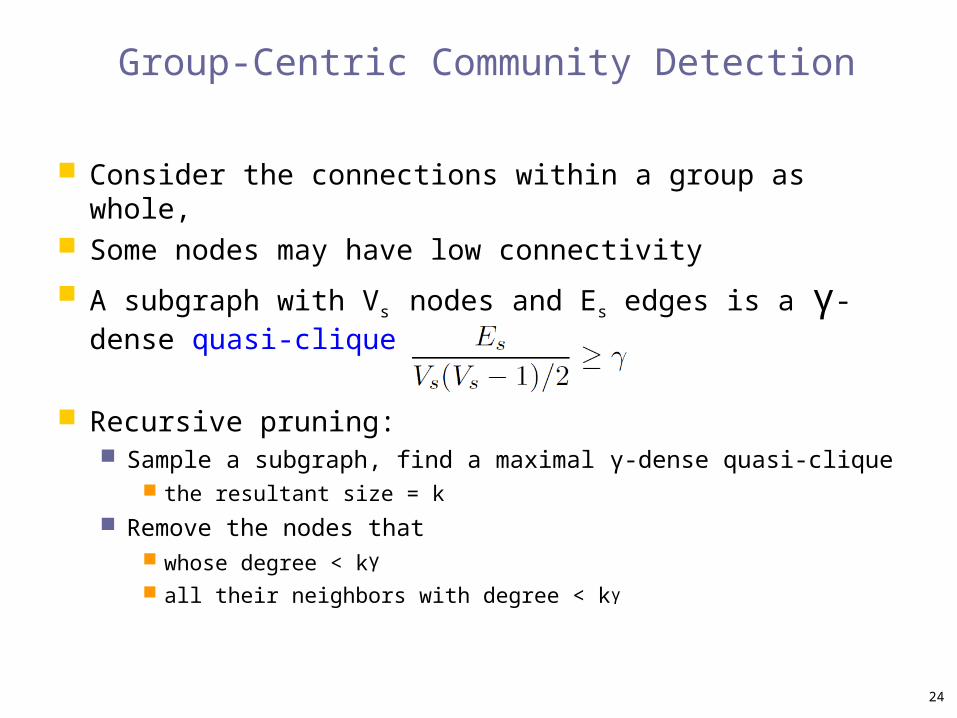
Group-Centric Community Detection
Consider the connections within a group as whole, Some nodes may have low connectivity
A subgraph with Vs nodes and Es edges is a γ-dense quasi-clique if
Recursive pruning: Sample a subgraph, find a maximal γ-dense quasi-clique
the resultant size = k
Remove the nodes that whose degree < kγ
all their neighbors with degree < kγ
24
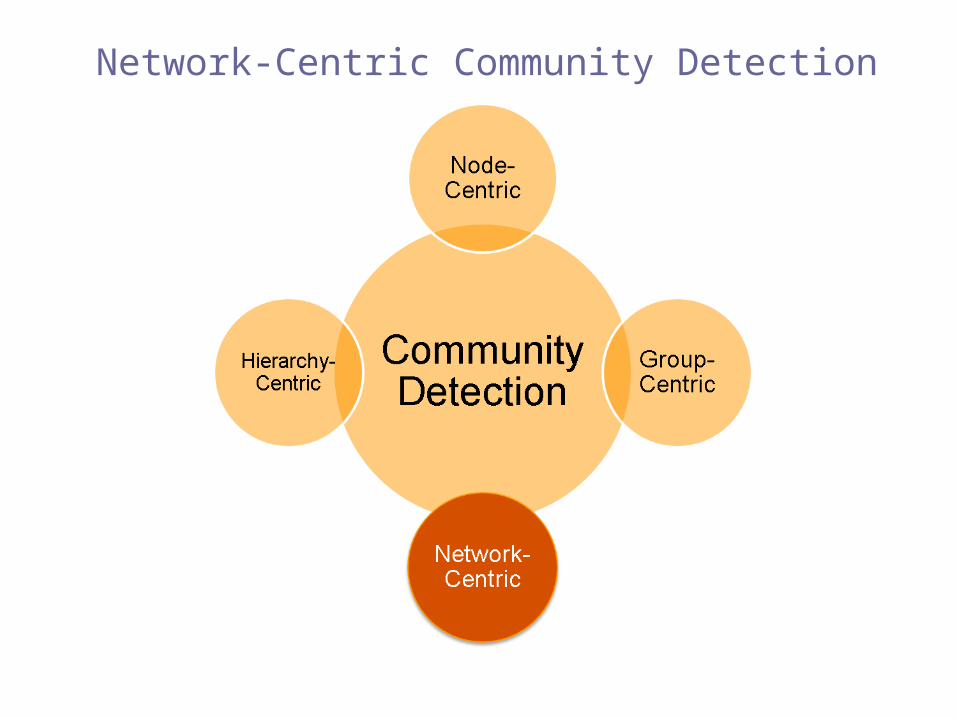
Network-Centric Community Detection
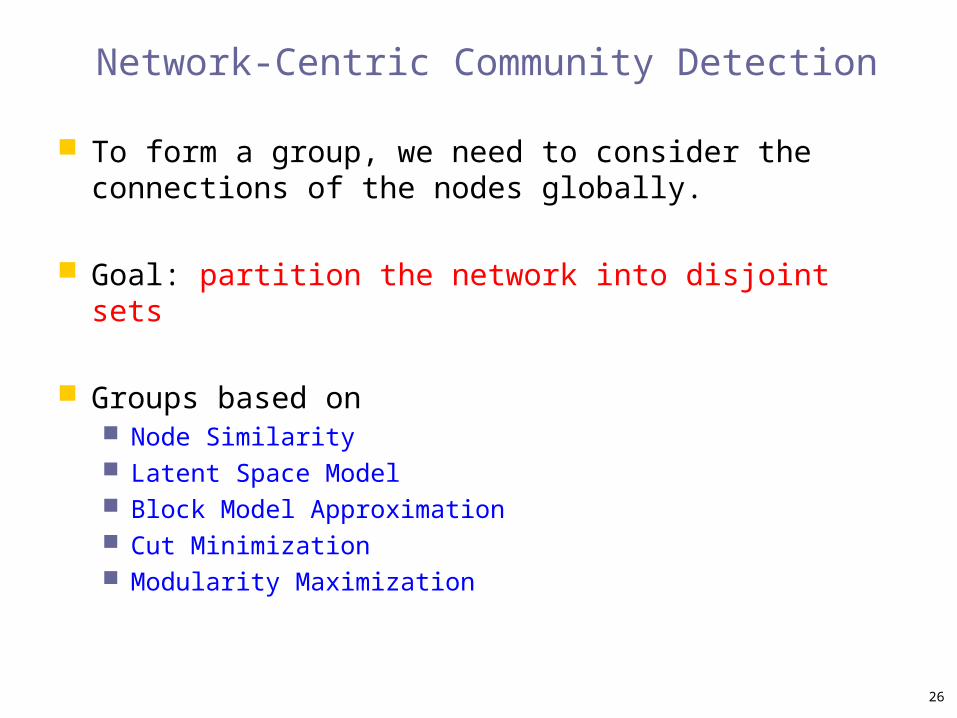
Network-Centric Community Detection
To form a group, we need to consider the connections of the nodes globally.
Goal: partition the network into disjoint sets
Groups based on Node Similarity Latent Space Model Block Model Approximation Cut Minimization Modularity Maximization
26
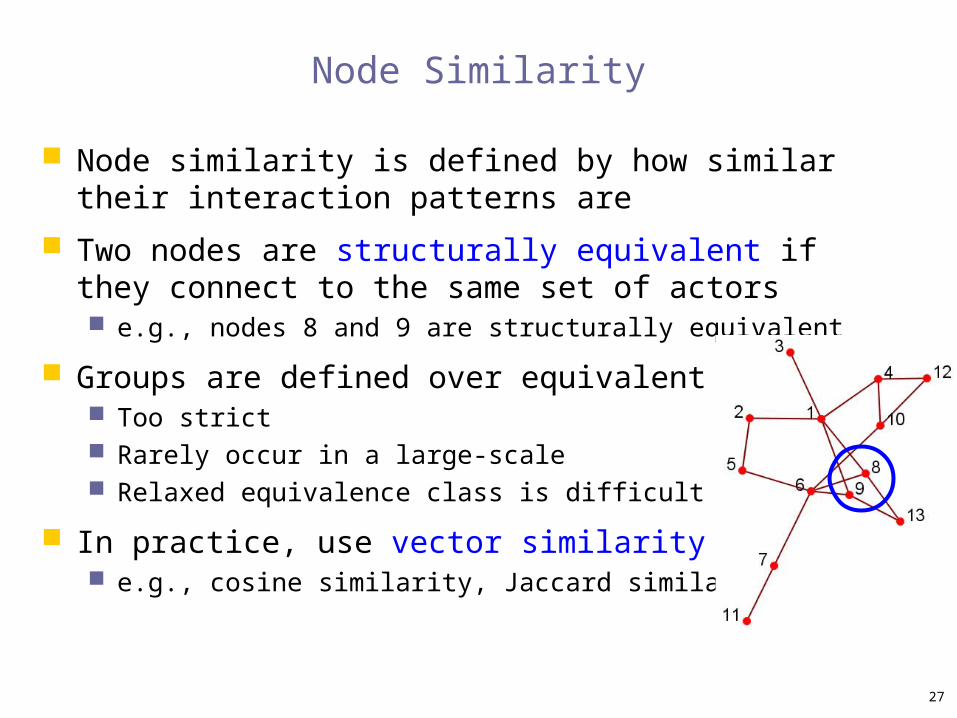
Node Similarity
Node similarity is defined by how similar their interaction patterns are
Two nodes are structurally equivalent if they connect to the same set of actors e.g., nodes 8 and 9 are structurally equivalent
Groups are defined over equivalent nodes Too strict Rarely occur in a large-scale Relaxed equivalence class is difficult to compute
In practice, use vector similarity e.g., cosine similarity, Jaccard similarity
27

Vector Similarity
1 2 3 4 5 6 7 8 9 10 11 12 13
5 1 1
8 1 1 1
9 1 1 1
Cosine Similarity:
6
1
32
1)8,5(
sim
4/1)8,5( |}13,6,2,1{||}6{| J
a vector
structurallyequivalent
28
Jaccard Similarity:
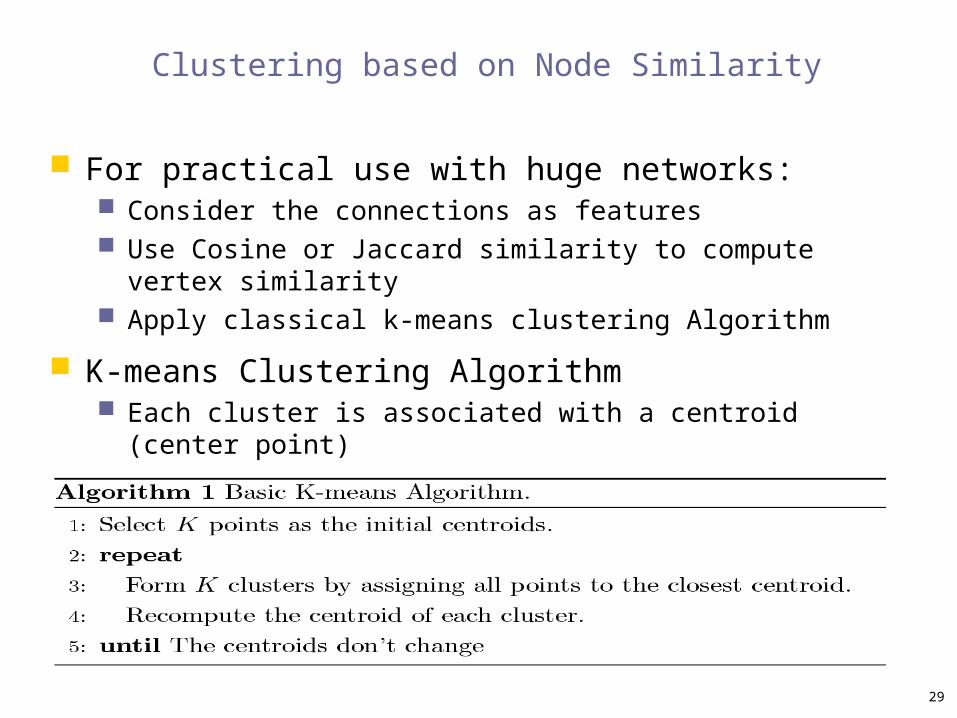
Clustering based on Node Similarity
For practical use with huge networks: Consider the connections as features Use Cosine or Jaccard similarity to compute vertex similarity Apply classical k-means clustering Algorithm
K-means Clustering Algorithm Each cluster is associated with a centroid (center point) Each node is assigned to the cluster with the closest centroid
29
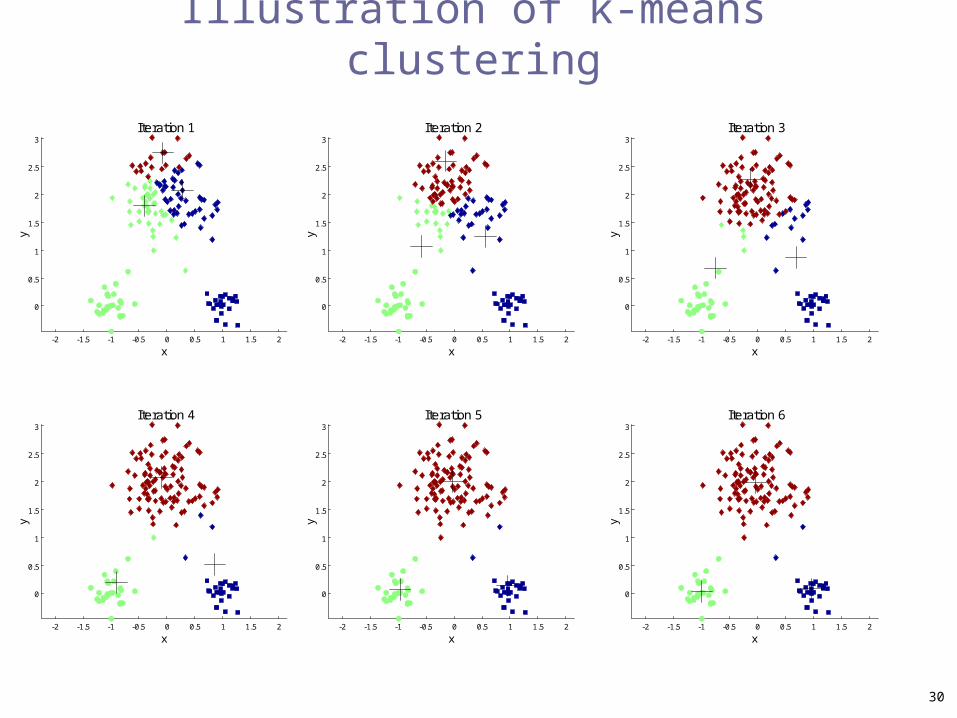
Illustration of k-means clustering
-2 -1.5 -1 -0.5 0 0.5 1 1.5 2
0
0.5
1
1.5
2
2.5
3
x
y
Iteration 1
-2 -1.5 -1 -0.5 0 0.5 1 1.5 2
0
0.5
1
1.5
2
2.5
3
x
y
Iteration 2
-2 -1.5 -1 -0.5 0 0.5 1 1.5 2
0
0.5
1
1.5
2
2.5
3
x
y
Iteration 3
-2 -1.5 -1 -0.5 0 0.5 1 1.5 2
0
0.5
1
1.5
2
2.5
3
x
y
Iteration 4
-2 -1.5 -1 -0.5 0 0.5 1 1.5 2
0
0.5
1
1.5
2
2.5
3
x
y
Iteration 5
-2 -1.5 -1 -0.5 0 0.5 1 1.5 2
0
0.5
1
1.5
2
2.5
3
x
y
Iteration 6
30
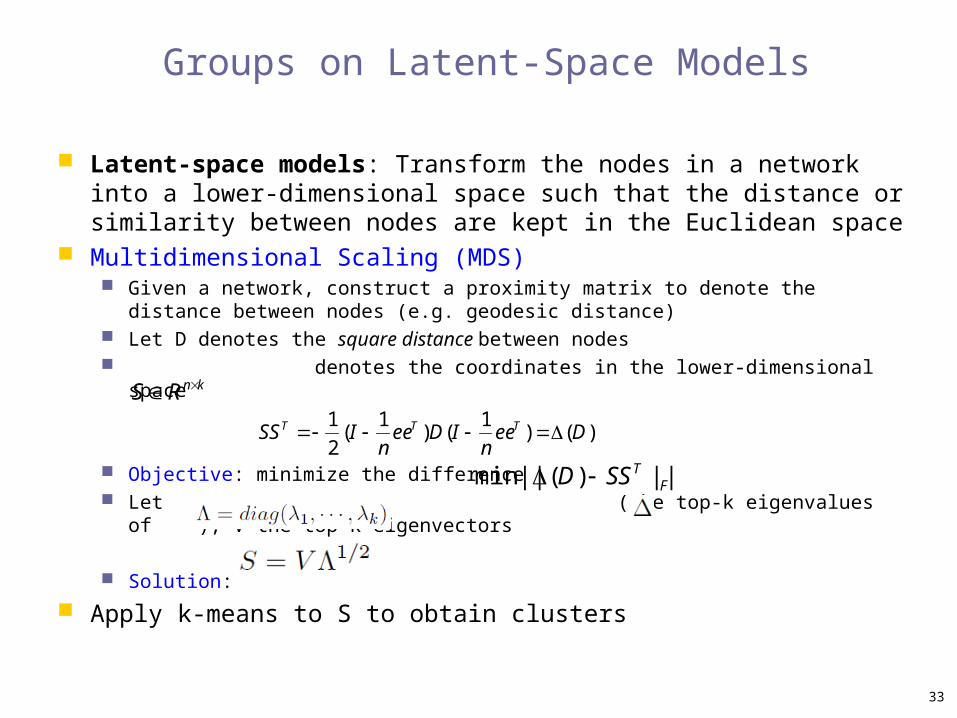
Groups on Latent-Space Models
Latent-space models: Transform the nodes in a network into a lower-dimensional space such that the distance or similarity between nodes are kept in the Euclidean space
Multidimensional Scaling (MDS) Given a network, construct a proximity matrix to denote the distance between
nodes (e.g. geodesic distance) Let D denotes the square distance between nodes denotes the coordinates in the lower-dimensional space
Objective: minimize the difference Let (the top-k eigenvalues of ), V the top-k eigenvectors
Solution:
Apply k-means to S to obtain clusters
)()1
()1
(2
1Dee
nIDee
nISS TTT
knRS
FTSSD ||)(||min
33
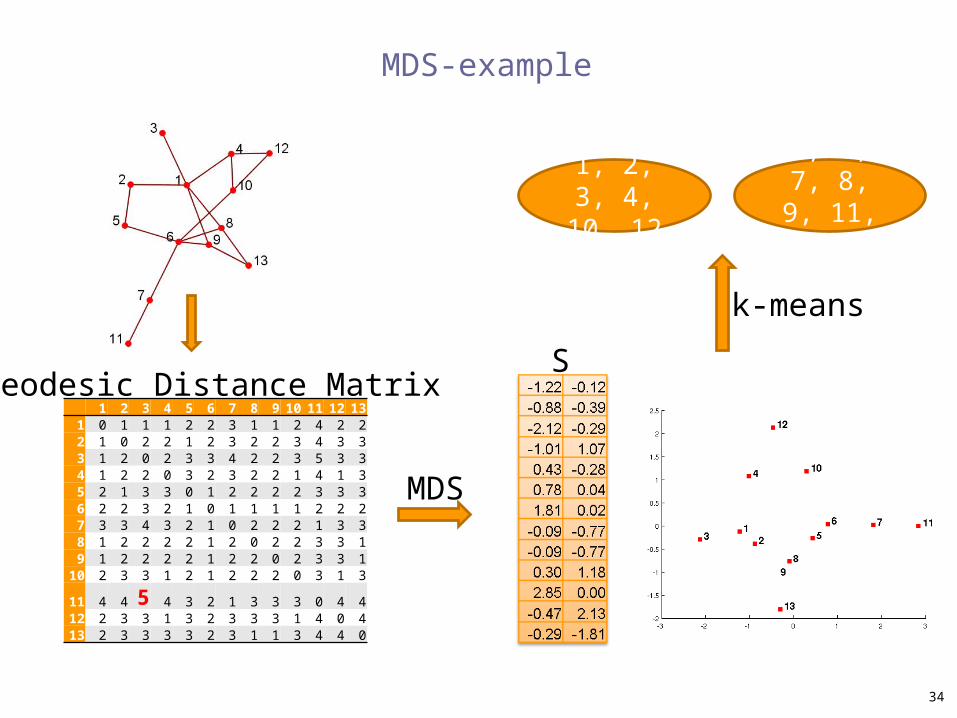
MDS-example
1 2 3 4 5 6 7 8 9 10 11 12 131 0 1 1 1 2 2 3 1 1 2 4 2 22 1 0 2 2 1 2 3 2 2 3 4 3 33 1 2 0 2 3 3 4 2 2 3 5 3 34 1 2 2 0 3 2 3 2 2 1 4 1 35 2 1 3 3 0 1 2 2 2 2 3 3 36 2 2 3 2 1 0 1 1 1 1 2 2 27 3 3 4 3 2 1 0 2 2 2 1 3 38 1 2 2 2 2 1 2 0 2 2 3 3 19 1 2 2 2 2 1 2 2 0 2 3 3 1
10 2 3 3 1 2 1 2 2 2 0 3 1 3
11 4 4 5 4 3 2 1 3 3 3 0 4 412 2 3 3 1 3 2 3 3 3 1 4 0 413 2 3 3 3 3 2 3 1 1 3 4 4 0
1, 2, 3, 4, 10, 12
5, 6, 7, 8, 9, 11, 13
Geodesic Distance Matrix
MDS
k-means
S
34
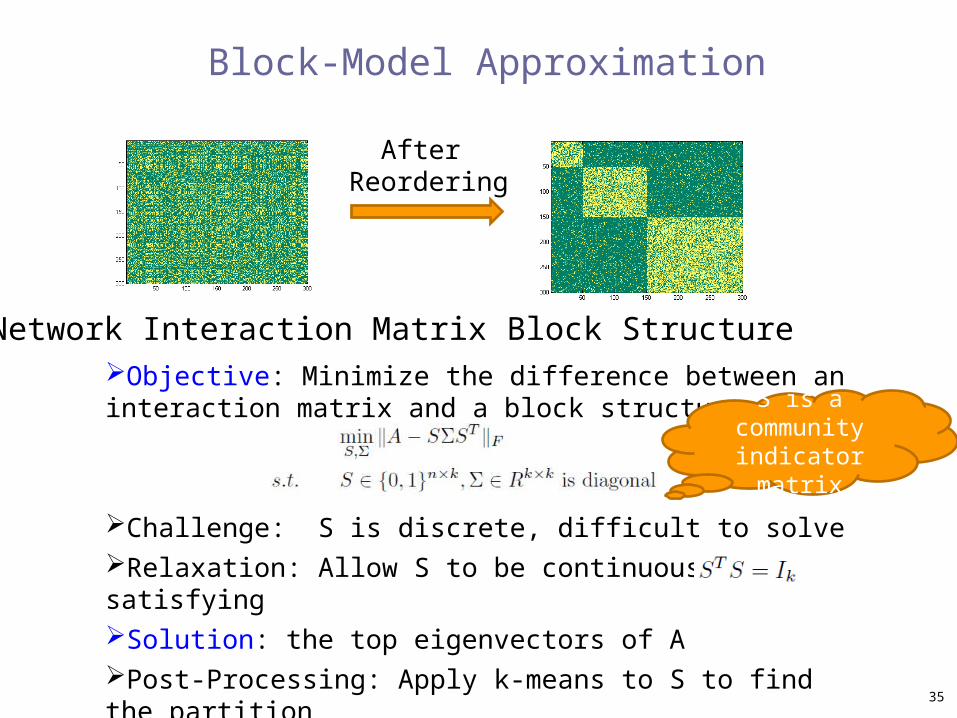
Block-Model Approximation
Network Interaction Matrix
After Reordering
Objective: Minimize the difference between an interaction matrix and a block structure
Challenge: S is discrete, difficult to solveRelaxation: Allow S to be continuous satisfyingSolution: the top eigenvectors of APost-Processing: Apply k-means to S to find the partition
Block Structure
S is a community
indicator matrix
35
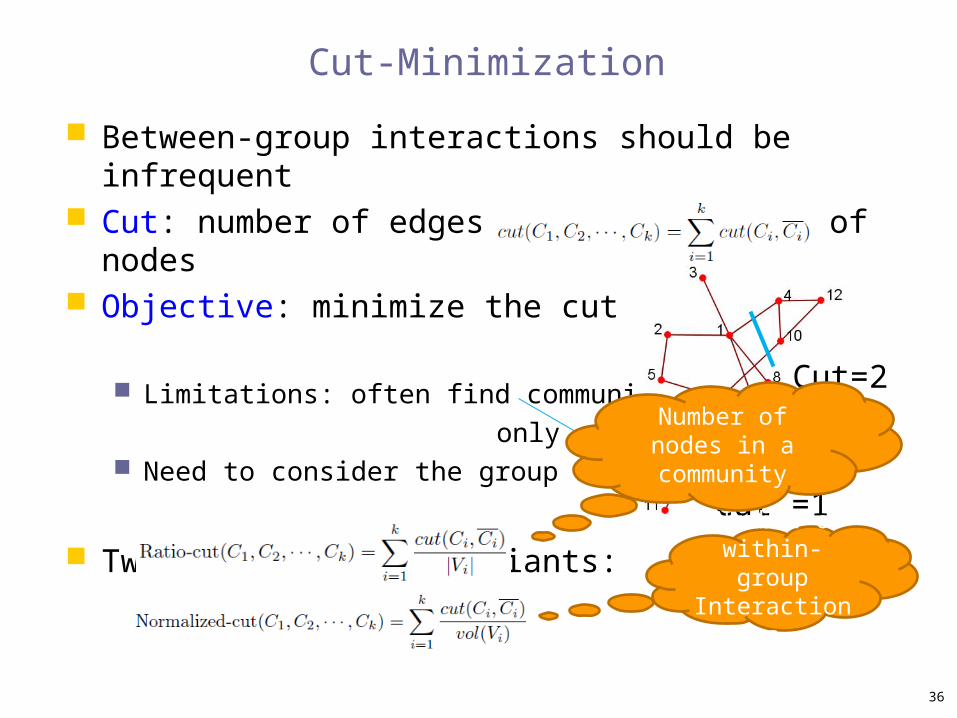
Cut-Minimization
Between-group interactions should be infrequent Cut: number of edges between two sets of nodes Objective: minimize the cut
Limitations: often find communities of
only one node Need to consider the group size
Two commonly-used variants:Cut =1
Cut=2
Number of nodes in a community
Number of within-group Interactions
36
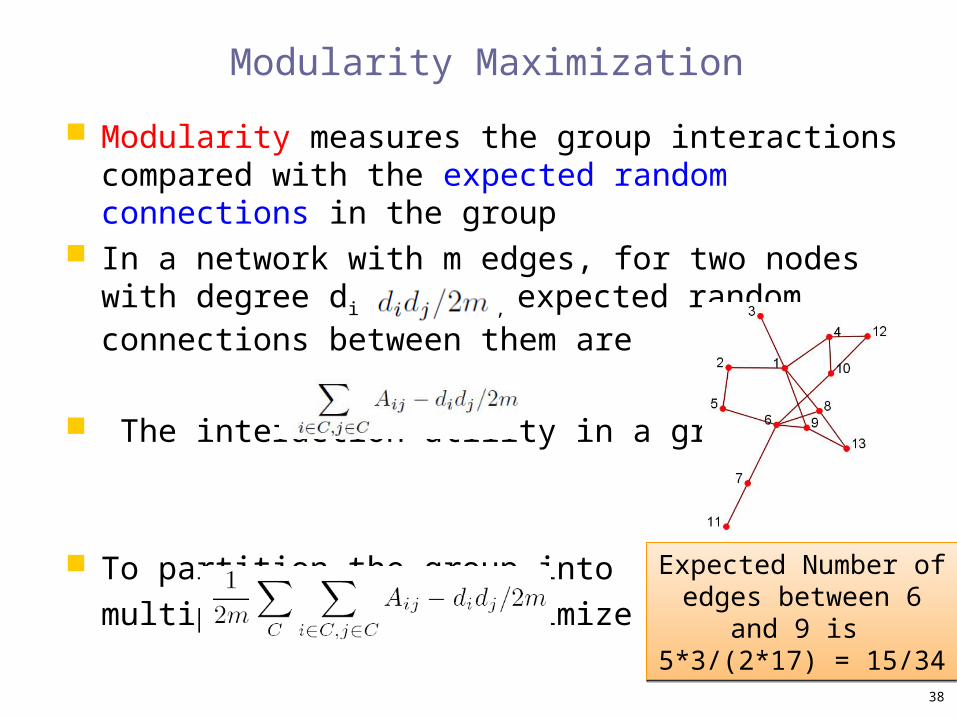
Modularity Maximization
Modularity measures the group interactions compared with the expected random connections in the group
In a network with m edges, for two nodes with degree di and dj , expected random connections between them are
The interaction utility in a group:
To partition the group into
multiple groups, we maximizeExpected Number of
edges between 6 and 9 is
5*3/(2*17) = 15/34
Expected Number of edges between 6 and 9
is 5*3/(2*17) = 15/34
38
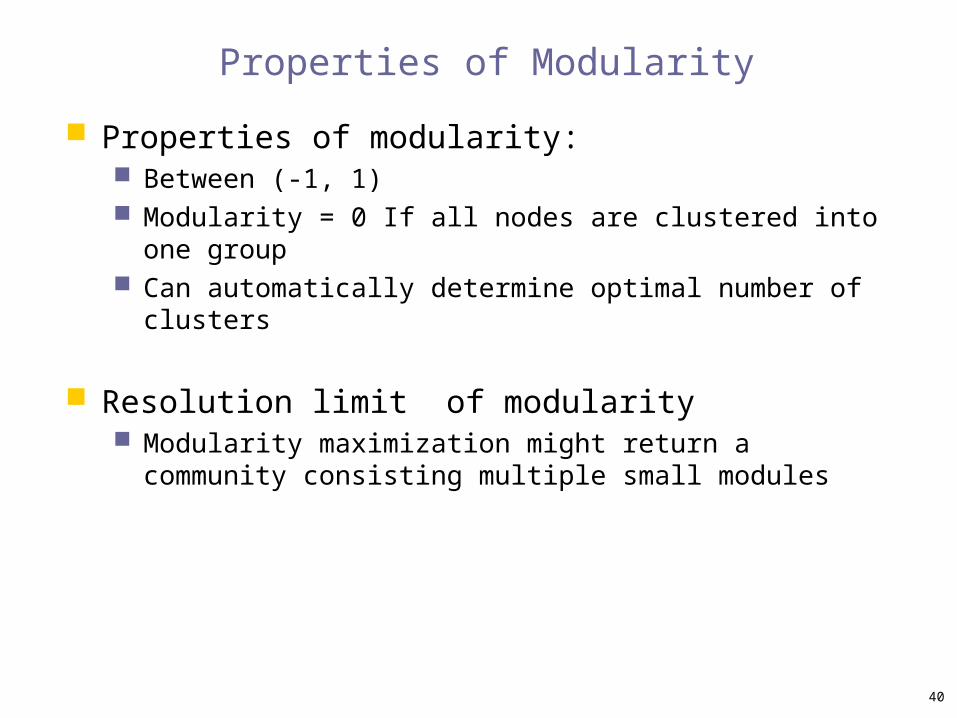
Properties of Modularity
Properties of modularity: Between (-1, 1) Modularity = 0 If all nodes are clustered into one group Can automatically determine optimal number of clusters
Resolution limit of modularity Modularity maximization might return a community consisting
multiple small modules
40
Recap of Network-Centric Community
Network-Centric Community Detection Groups based on
Node Similarity Latent Space Models Cut Minimization Block-Model Approximation Modularity maximization
Goal: Partition network nodes into several disjoint sets
Limitation: Require the user to specify the number of communities beforehand
42
Hierarchy-Centric Community Detection
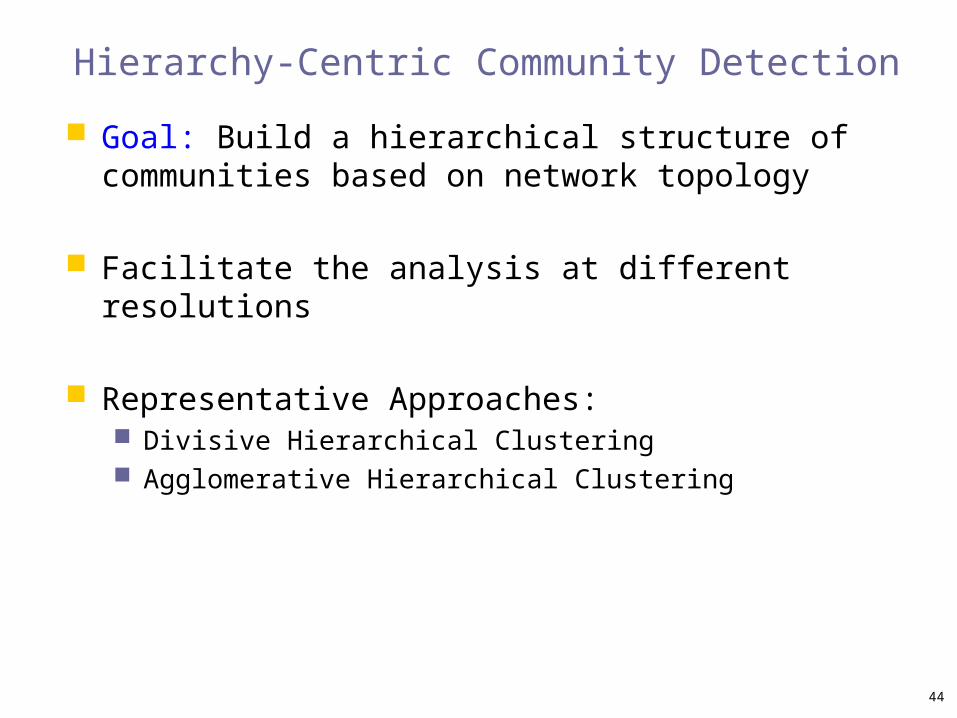
Hierarchy-Centric Community Detection
Goal: Build a hierarchical structure of communities based on network topology
Facilitate the analysis at different resolutions
Representative Approaches: Divisive Hierarchical Clustering Agglomerative Hierarchical Clustering
44
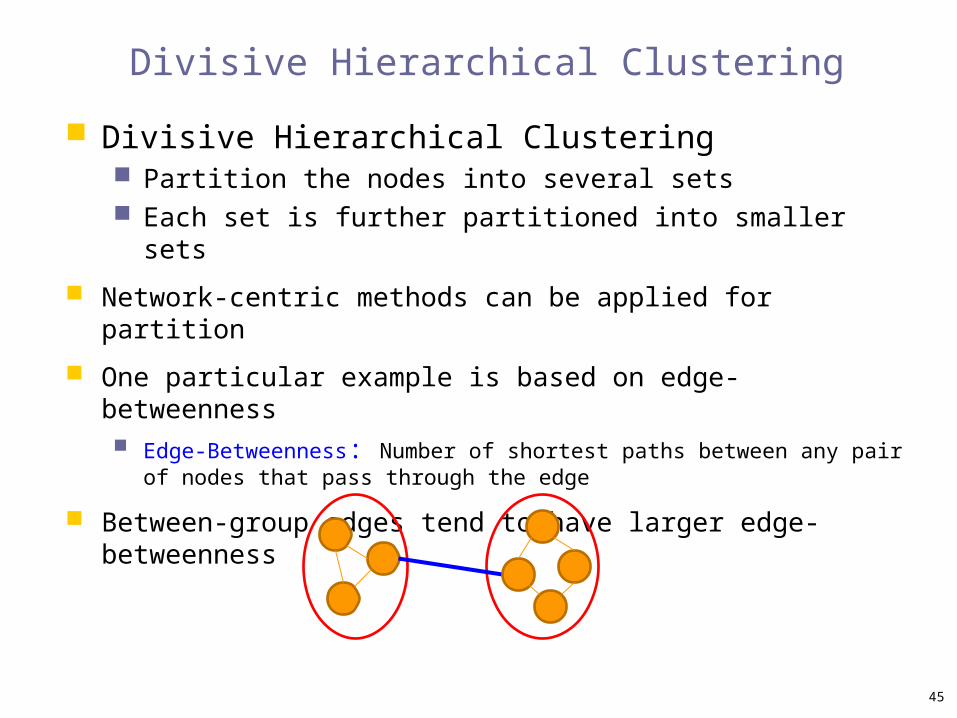
Divisive Hierarchical Clustering
Divisive Hierarchical Clustering Partition the nodes into several sets Each set is further partitioned into smaller sets
Network-centric methods can be applied for partition
One particular example is based on edge-betweenness Edge-Betweenness: Number of shortest paths between any pair of nodes that
pass through the edge
Between-group edges tend to have larger edge-betweenness
45
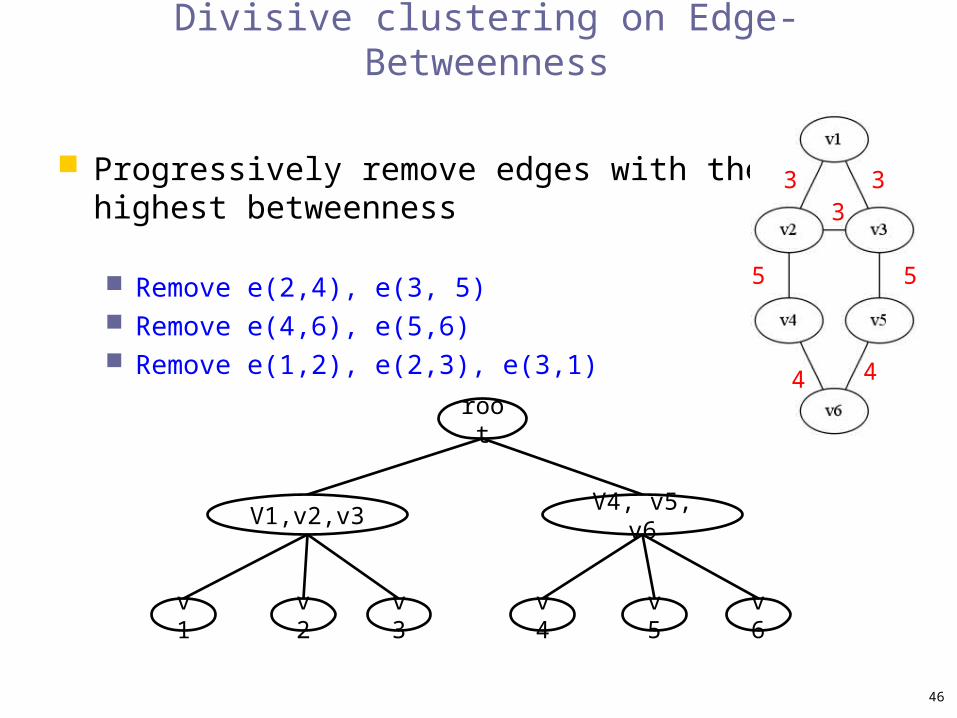
Divisive clustering on Edge-Betweenness
Progressively remove edges with the highest betweenness
Remove e(2,4), e(3, 5) Remove e(4,6), e(5,6) Remove e(1,2), e(2,3), e(3,1)
3 33
5 5
4 4
root
V1,v2,v3 V4, v5, v6
v1 v2 v3 v5 v6v4
46

Agglomerative Hierarchical Clustering
Initialize each node as a community Choose two communities satisfying certain criteria and
merge them into larger ones Maximum Modularity Increase Maximum Node Similarity
root
V1,v2
V4, v5, v6
v1 v2
v3
v5 v6
v4
V1, v2, v3
V1,v2
(Based on Jaccard Similarity)
47

Recap of Hierarchical Clustering
Most hierarchical clustering algorithm output a binary tree Each node has two children nodes Might be highly imbalanced
Agglomerative clustering can be very sensitive to the nodes processing order and merging criteria adopted.
Divisive clustering is more stable, but generally more computationally expensive
48

Summary of Community Detection
The Optimal Method? It varies depending on applications, networks,
computational resources etc.
Other lines of research Communities in directed networks Overlapping communities Community evolution Group profiling and interpretation
49