lecture 12: spreadsheets for engineering applications - part 2 bj furman 14nov2011
TRANSCRIPT

Lecture 12: Spreadsheets for Engineering Applications - part 2
BJ Furman
14NOV2011

The Plan for Today
Solver Review Non-linear regression analysis
Aerospace engineering computation using a spreadsheet
Macros and VBA programming

Learning Objectives
Use Solver to solve mathematical equations
Apply Solver to perform regression (linear and non-linear)
Explain the utility of Visual Basic for Applications (VBA)
Create a VBA macro to automate tasks

Excel Solver
Add-in tool comprised of optimization algorithms Goal: minimize or maximize an objective
function subject to constraints by changing a set of parameters that the objective function depends upon
Can be used to find roots, solve simultaneous equations, solve problems requiring iteration, etc.

Activating Solver - Excel 2003
Make sure Solver Add-in is checked!

Activating Solver - Excel 2007
Office Button

Solving Simultaneous Equations
Circuit analysis(EE 98) Find the currents
VRiRi
VRi
3222
13
ViiRRi
VRiii
iii
32321
1321
321
00
00
0
V
V
i
i
i
RR
R
0
00
00
111
3
2
1
32
1
Kirchhoff’s Current Law at A
Kirchhoff’s Voltage Law across R1 and R3
R2
R1
R3
+V
i1i2
i3
A321 iii
Equations in matrix form
Could solve by matrix inversion:[ i ] = [A]-1[V], but let’s use the Solver instead.

Steps for Solving Simultaneous Equations With Solver
Steps1. Define constants and variables. Put guesses in for the
variables.
2. Express m equations in n variables (and constants) as:
fi (xj)= 0, where i =1 to m, and j = 1 to n
3. Form the equation: y = ∑ fi2
4. Use the Solver, and change the xj values to drive y (the
Target Cell) to be zero
Example: Excel_pt2.xls

Circuit Analysis Example with Solver1. Define constants and variables. Add guesses for variables
2. Express equations in the variables and constants
3. Form the equations: y = ∑ fi2
4. Solver, and change the variables to drive y (the Target Cell) to 0
Note: named ranges
On to Regression Analysis

Adding Names to RangesHighlight names and values
2003: Insert / Name / Create / Left column2007: Formulas / Defined Names tab / Create from Selection / Left column
Result
Back

Regression Analysis Coined by biologist Francis Galton (1822-1911)
Searching for a mathematical law describing the tendency of offspring’s characteristics to revert (regress) back to the average of ancestors its ancestors
Statistical method to investigate the relationship between dependent and independent variables Fit a mathematical model to a set of data
Ex. “best-fit” straight line (trendline) through data points from a phenomena that is thought to be of the form: y=mx + b
Find the coefficients of the model equation that minimizes the sum-of-squared error (SSE) between the actual dependent variable values and those predicted by the model

Least Squares Curve Fit
y = 1.1693x
R2 = 0.9538
0
2
4
6
8
10
12
14
0 2 4 6 8 10 12
X
Y
Linear Regression Linear
regression Where the
coefficients of the model are linear
Examplesy = mx + b
y = a + b log(x)y = a + bX + cX2
error

Non-linear Regression Non-linear
regression Where the
coefficients of the model are non-linear
Example
y = Ae-t/t + C
Temperature Response
0
20
40
60
80
100
120
0 2 4 6 8 10 12
Time, Sec.
Tem
per
atu
re,
°C
error
Which coefficient is“non-linear”?

Regression Analysis Procedure Steps
1. Select a regression model (e.g., y=mx+b)2. Enter the data set (dependent and independent variable values) and
initial guesses for the regression model coefficients3. Calculate the predicted dependent values using the regression model
and the independent variable(s)4. Calculate the 'error' values (actual-predicted)5. Calculate the squared errors6. Calculate the sum of the squared errors (SSE)7. Use Solver to minimize the SSE (the Target Cell, and select 'Min') by
changing the value of the coefficients (m and b) 8. Test your result by: 1) calculating the coefficient of determination (R2), 2)
plotting your model curve to the data, 3) plotting Ypred vs. Yi, and 4) plotting the deviations (Yi - Ypred).
variabledependent actual theof values theare theand
setdata thein variabledependent (actual) theof average theis where
Squares of Sum Total theis TSS where1
1
2
2
i
N
i
y
yyyTSS
TSS
SSER

Non-linear Regression Example
Thermal step response Expose an object at uniform temperature to a
step change in surrounding temperature Ex: Lobster put into a pot of boiling water
thermocouple at the center of the lobster measure lobster temperature as function of time
Use the data to determine parameters of a first order model:
hA
mCTT
dt
dTdt
dTmCTThA
where
)(
energy internal in change inHeat
/0 )()( teTTTtT
Assumed Solution
Example: Excel_pt2.xls
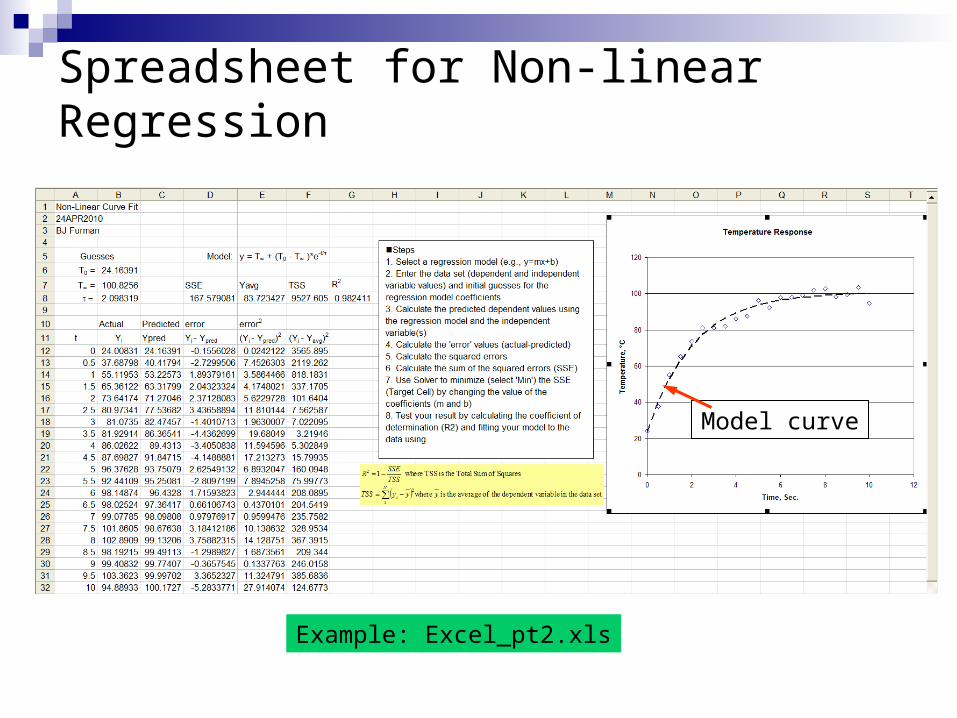
Spreadsheet for Non-linear Regression
Example: Excel_pt2.xls
Model curve

Plot of Ypred vs Yi
A good fit:•Data close to the diagonal line, Yi vs. Yi
(but will depend on scatter in the data)
•No discernable pattern in thedata points aroundthe diagonal axis
Ypred vs. Yi
0
20
40
60
80
100
120
0 20 40 60 80 100 120
Measured Yi, °C
Yp
red,
°C
Yi vs. Yi

Deviation Plot
Deviation Plot
-6
-5
-4
-3
-2
-1
0
1
2
3
4
5
0 2 4 6 8 10 12
Time, Sec.
Yi -
Yp
red
A good fit:
•Yi-Ypred small
(but will depend on scatter in the data)
•No discernable pattern in thedata points aroundthe horizontal axis

Excel, Macros, and VBA
Macro: a set of recorded key strokes or program written in Visual Basic (VB) to automate tasks
Visual Basic for Applications (VBA) An implementation of VB integrated into MS
Office applications Enables user to write VB code to automate tasks
and much more.

Security and Working With Macros
Be careful with macro enabled files! Excel 2007
.xlsx - macro dis-abled workbooks (default) .xlsm - macro enabled workbooks You can write and work with a macro in a .xlsx file,
but you can only save the macro to a .xlsm file. You may need to modify Macro Settings
Office button | Excel Options | Trust Center Settings | Macro Settings | Disable all macros with notification
Excel 2003 Set security level to ‘medium’
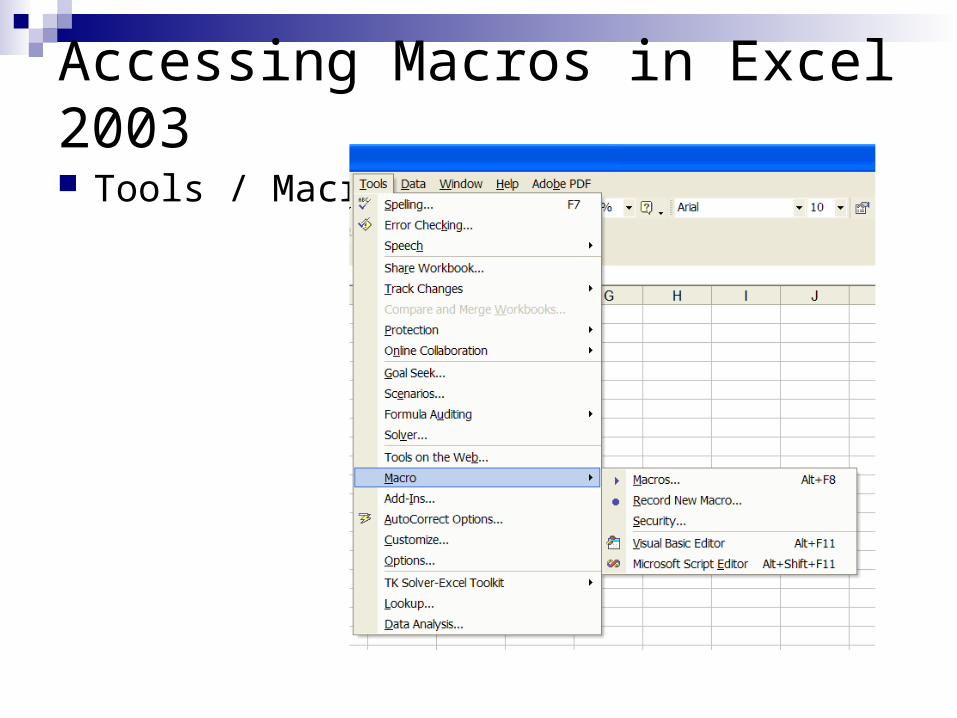
Accessing Macros in Excel 2003
Tools / Macro

Accessing Macros in Excel 2007
View / Macro

Recording Macros
Excel 2007 View / Macros / Macros (menu) / Record
Macro Excel 2003
Tools / Macro / Record New Macro Ex. lbf to N conversion

lbf to N Conversion Macro

VB Editor

Review

References Larsen, R. W. (2009). Engineering with Excel, Pearson
Prentice Hall, New Jersey. ISBN 0-13-601775-4 Engineering with Excel companion website:
http://www.chbe.montana.edu/excel/EngExcel3.htm. Visited 25OCT2009.
First-Order System: Transient Response of a Thermocouple to a Step Temperature Change. [Available on-line]. http://www.colorado.edu/MCEN/Measlab/background1storder.pdf. Visted 24APR2010.