lecture 11 storm runoff
TRANSCRIPT

8/8/2019 Lecture 11 Storm Runoff
http://slidepdf.com/reader/full/lecture-11-storm-runoff 1/20
11-
GEOG415 Lecture 11: Storm Runoff
Runoff
Runoff occurs when part of rain or snowmelt water flowsoverland – runoff generation.
Runoff water eventually reaches streams and causes the
discharge to increase – storm flow.
Where in a basin is runoff generated?
How does it reach streams?
Significance for environmental planning?

8/8/2019 Lecture 11 Storm Runoff
http://slidepdf.com/reader/full/lecture-11-storm-runoff 2/20
11-
Baseflow and storm runoff
Dunne and Leopold (1978, Fig. 9-1)
This diagram shows a typical storm runoff
“hydrograph”. Note the relationship between
rainfall and storm flow.
Baseflow – Dry period flow, sustained by groundwater
Main objective of engineering hydrology is to predict the
storm runoff hydrograph when precipitation data are given.
How?
(1)
(2)
We need to understand the mechanisms of runoff generation.

8/8/2019 Lecture 11 Storm Runoff
http://slidepdf.com/reader/full/lecture-11-storm-runoff 3/20
11-
Dunne and Leopold (1978, Fig. 9-1)
1. Horton overland flow
2. Groundwater (baseflow)
3. Subsurface storm flow
4. Saturation overland flow
Horton overland flow
Runoff occurs when infiltration capacity is exceeded by
rainfall intensity, and depression storage is filled up.
Dunne and Leopold (1978, Fig. 9-4)
depression
storage
surface retention

8/8/2019 Lecture 11 Storm Runoff
http://slidepdf.com/reader/full/lecture-11-storm-runoff 4/20
11-
Is Horton overland flow common? Does it occur everywhere?
Recall: Infiltration capacity is always greater than saturated
hydraulic conductivity ( K s).
K s of most undisturbed soils > 100 mm/hr
Rainfall intensity?
Conclusion:
Subsurface storm flow (SSSF)
The water table rises near a stream during a storm.
Consequences?
Intensity?
What will happen with
more rain?
Dunne and Leopold (1978, Fig. 9-7)
rain
Pre-storm soil
moisture profile
infiltration
front

8/8/2019 Lecture 11 Storm Runoff
http://slidepdf.com/reader/full/lecture-11-storm-runoff 5/20
8/8/2019 Lecture 11 Storm Runoff
http://slidepdf.com/reader/full/lecture-11-storm-runoff 6/20
11-
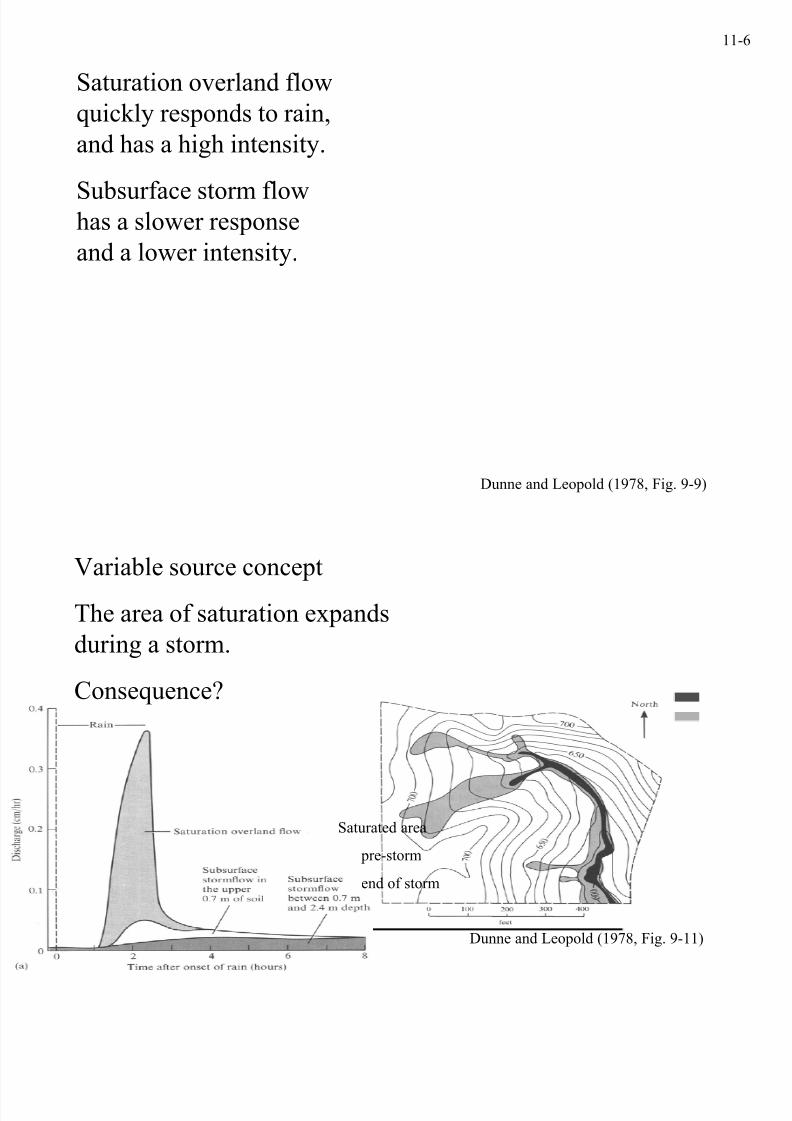
Dunne and Leopold (1978, Fig. 9-9)
Saturation overland flow
quickly responds to rain,
and has a high intensity.
Subsurface storm flowhas a slower response
and a lower intensity.
Variable source concept
The area of saturation expands
during a storm.
Consequence?
Dunne and Leopold (1978, Fig. 9-11)
Saturated area
pre-storm
end of storm

8/8/2019 Lecture 11 Storm Runoff
http://slidepdf.com/reader/full/lecture-11-storm-runoff 7/20
11-
Factors affecting runoff generation
steep slope gentle slope
concave slope flat slope
thick soil thin soil
initially wet initially dry
undisturbed disturbed (compaction etc.)
Implication on environmental protection/management?
Effects of urbanization
More opportunities for Horton overland flow.
“Efficient” transmission of storm water to major rivers by
storm sewers – smaller flow resistance than natural drainage.
Combined effects?
8/8/2019 Lecture 11 Storm Runoff
http://slidepdf.com/reader/full/lecture-11-storm-runoff 8/20
11-
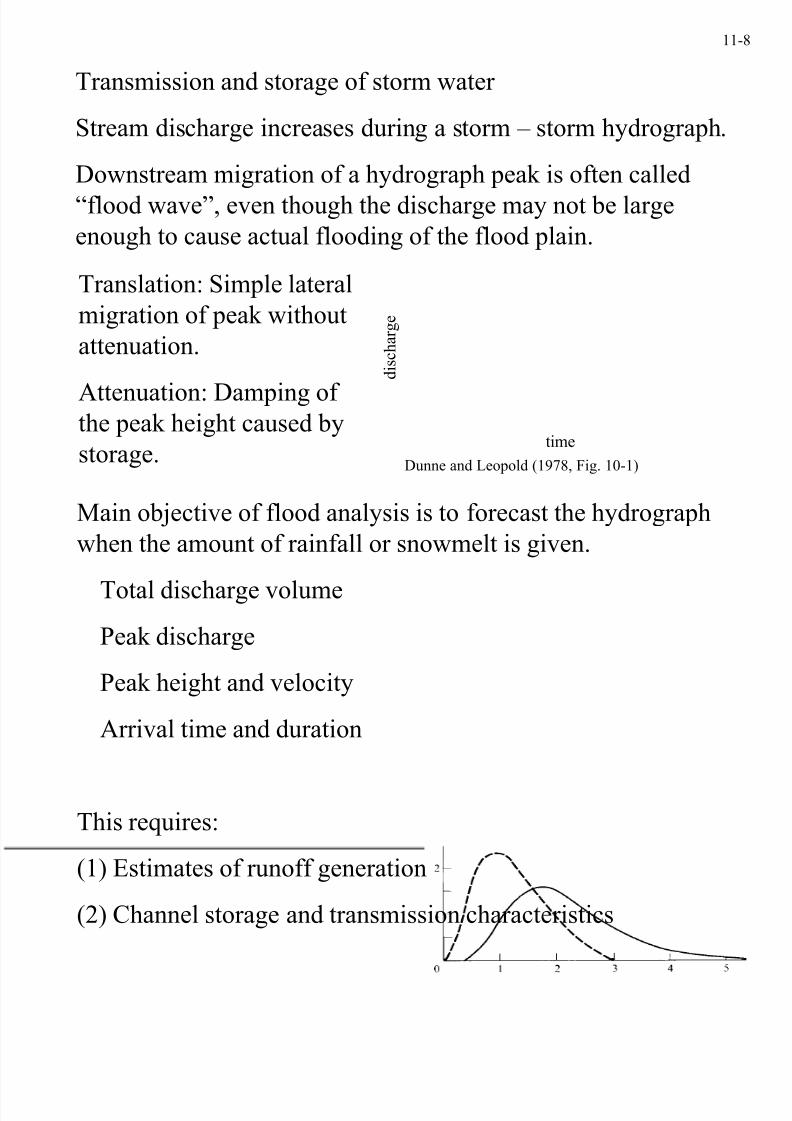
Transmission and storage of storm water
Stream discharge increases during a storm – storm hydrograph.
Downstream migration of a hydrograph peak is often called
“flood wave”, even though the discharge may not be large
enough to cause actual flooding of the flood plain.
Translation: Simple lateral
migration of peak without
attenuation.
Attenuation: Damping of the peak height caused by
storage.Dunne and Leopold (1978, Fig. 10-1)
time
d i s c h a r g e
Main objective of flood analysis is to forecast the hydrograph
when the amount of rainfall or snowmelt is given.
Total discharge volume
Peak discharge
Peak height and velocity
Arrival time and duration
This requires:
(1) Estimates of runoff generation
(2) Channel storage and transmission characteristics

8/8/2019 Lecture 11 Storm Runoff
http://slidepdf.com/reader/full/lecture-11-storm-runoff 9/20
11-
Flood records
Estimates of runoff are usually based on empirical relation
between rainfall and runoff depending on a number of
parameters (vegetation, soil, slope, etc.).
Empirical relations are derived from historical records of
floods. In Canada, daily stream discharge data are available on
a CD-ROM database called HYDAT, published by the Water
Survey of Canada.→MADGIC section in the library (2LT).
Baseflow separation
For the analysis storm runoff, the baseflow contribution needs
to be subtracted from total stream discharge.
How?
Is it an accurate representation of baseflow?
Dunne and Leopold (1978, Fig. 10-4)
8/8/2019 Lecture 11 Storm Runoff
http://slidepdf.com/reader/full/lecture-11-storm-runoff 10/20
11-1
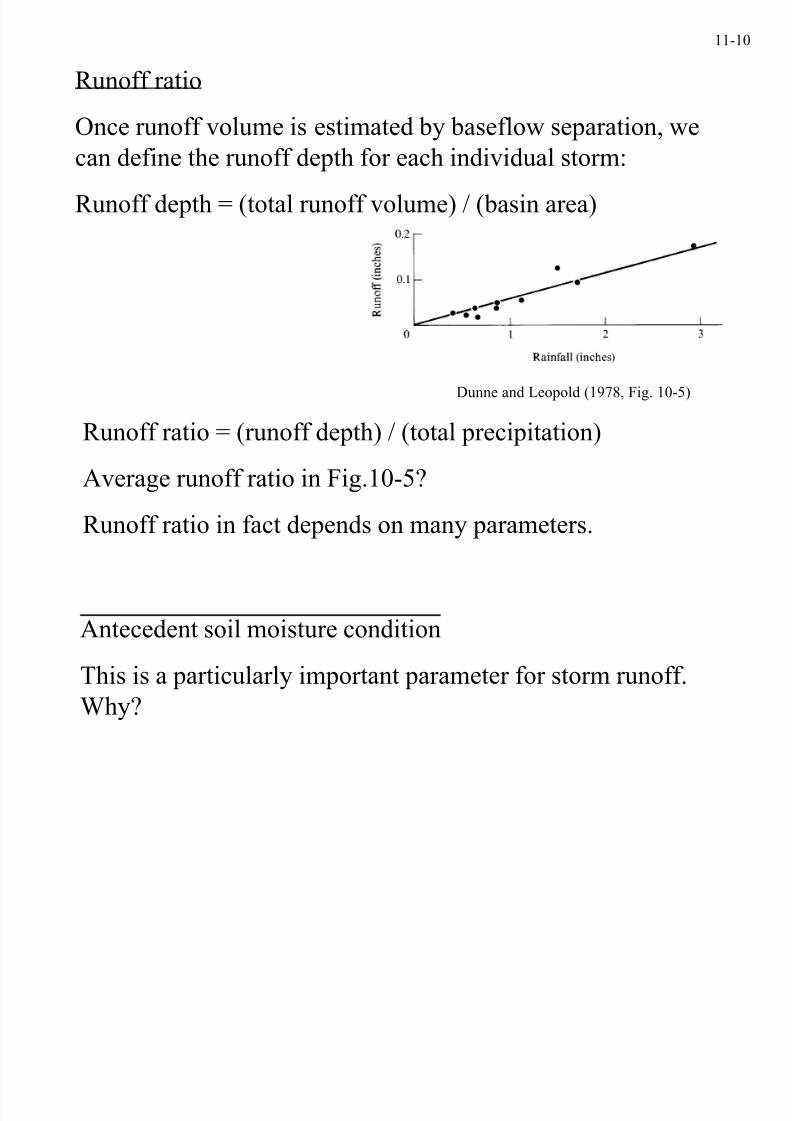
Runoff ratio
Once runoff volume is estimated by baseflow separation, we
can define the runoff depth for each individual storm:
Runoff depth = (total runoff volume) / (basin area)
Dunne and Leopold (1978, Fig. 10-5)
Runoff ratio = (runoff depth) / (total precipitation)
Average runoff ratio in Fig.10-5?
Runoff ratio in fact depends on many parameters.
Antecedent soil moisture condition
This is a particularly important parameter for storm runoff.
Why?

8/8/2019 Lecture 11 Storm Runoff
http://slidepdf.com/reader/full/lecture-11-storm-runoff 11/20
11-1
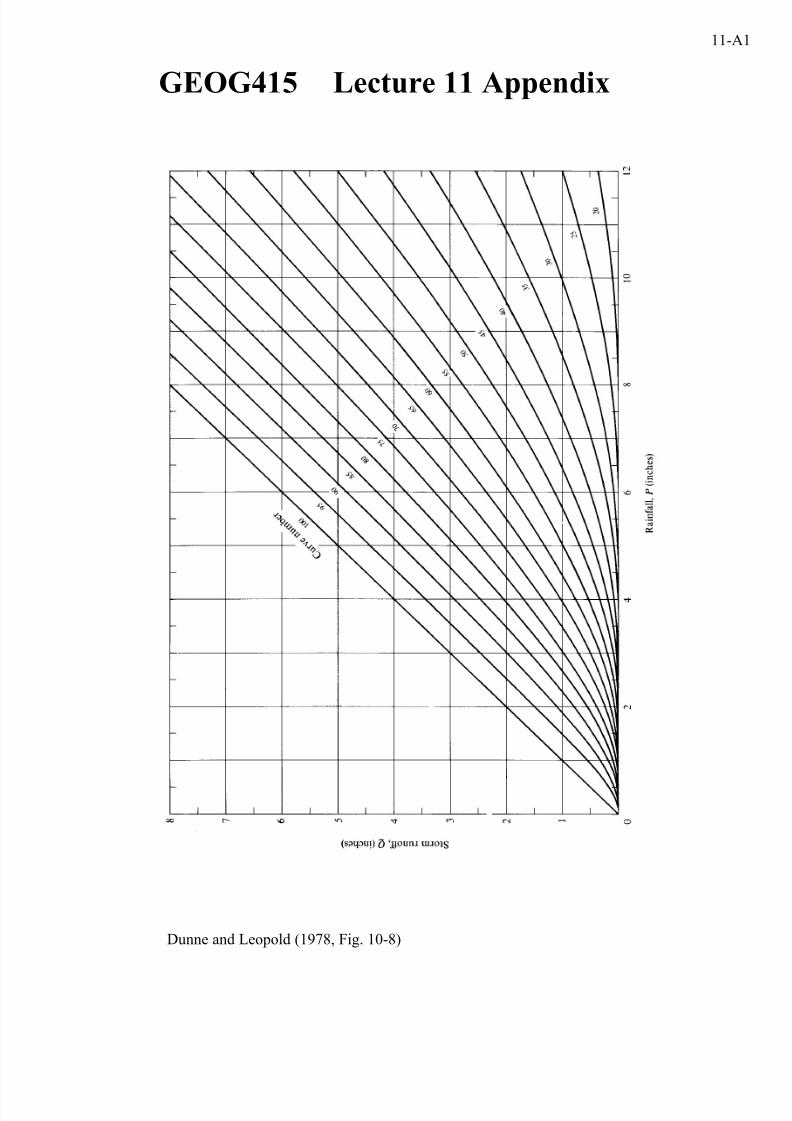
Curve Number method
It is impossible to characterize all parameters in a large basin.
As a practical tool for rough estimation, hydrologists
commonly use the curve number method put together by theUS Soil Conservation Service (SCS).
Curve number (CN) represents integrated effects of soil
texture, antecedent moisture, land use, vegetation, slope, etc.
Storm runoff is estimated from precipitation and curve
number.
e.g. Given CN = 80 and P = 4 inches, what is storm runoff?
Dunne and Leopold (1978, Fig. 10-8)
S t o r m
r u n o f f , Q
( i n c h e s )
Rainfall, P (inches)
8/8/2019 Lecture 11 Storm Runoff
http://slidepdf.com/reader/full/lecture-11-storm-runoff 12/20
11-1
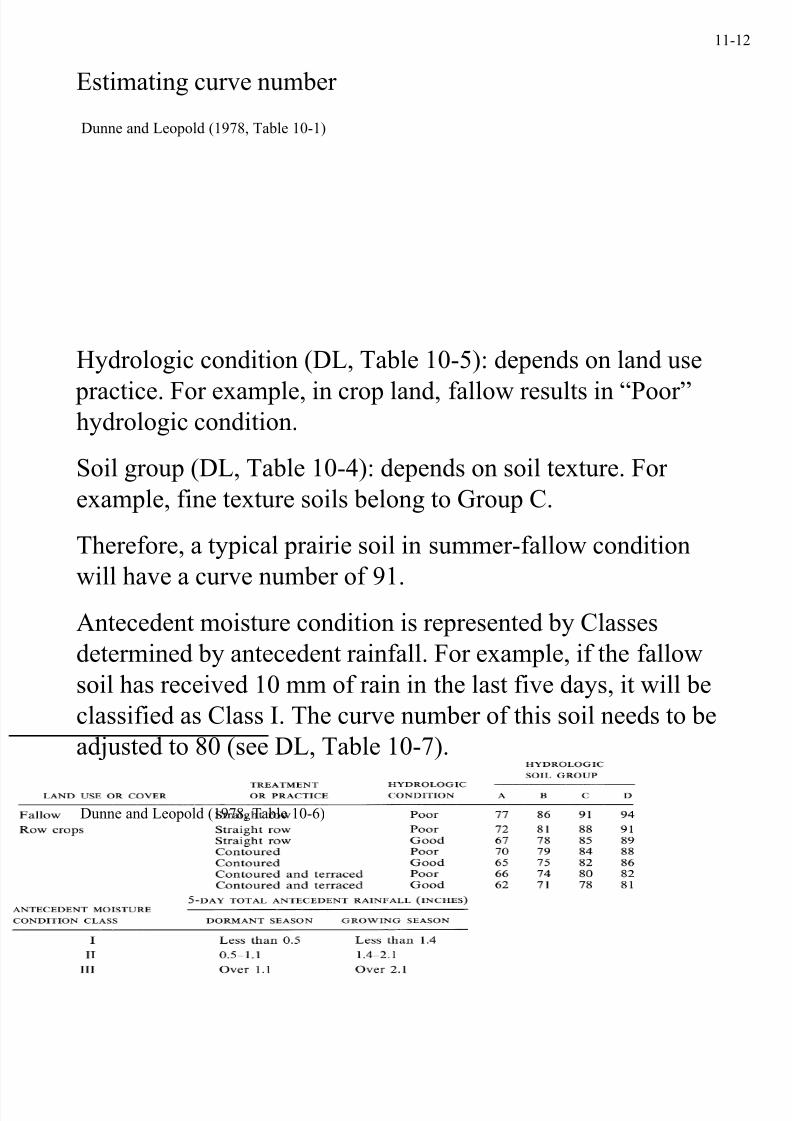
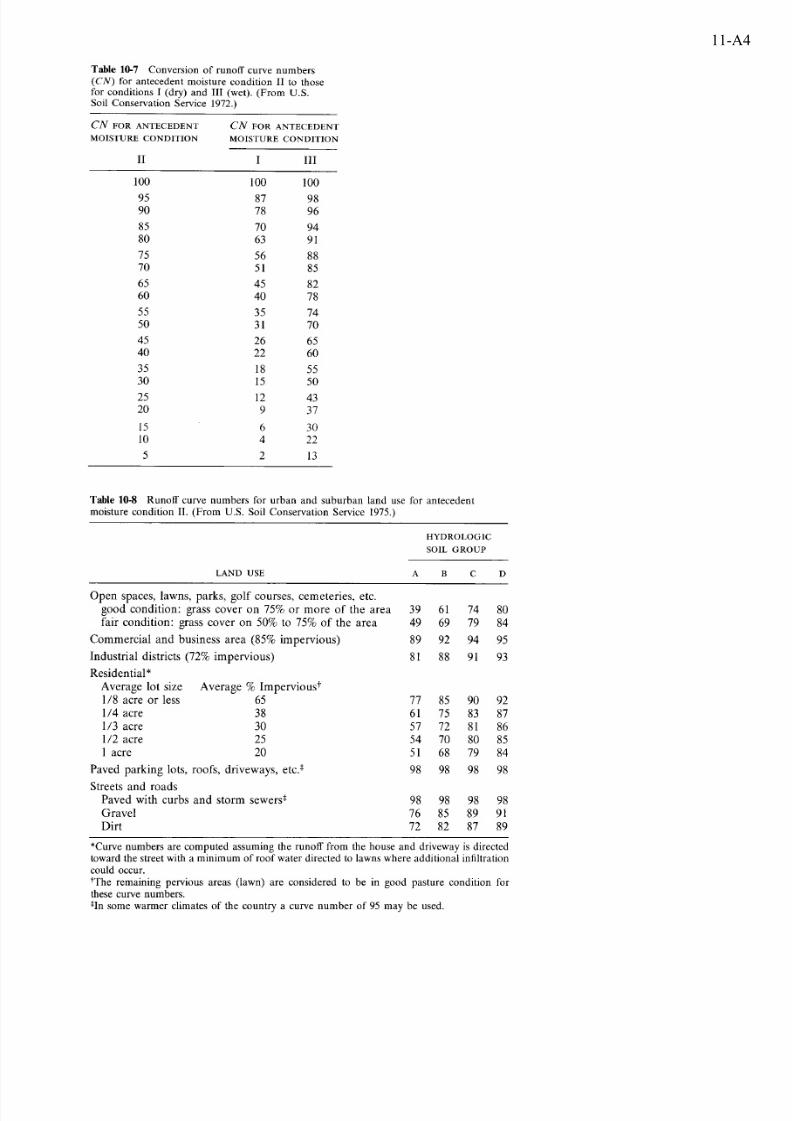
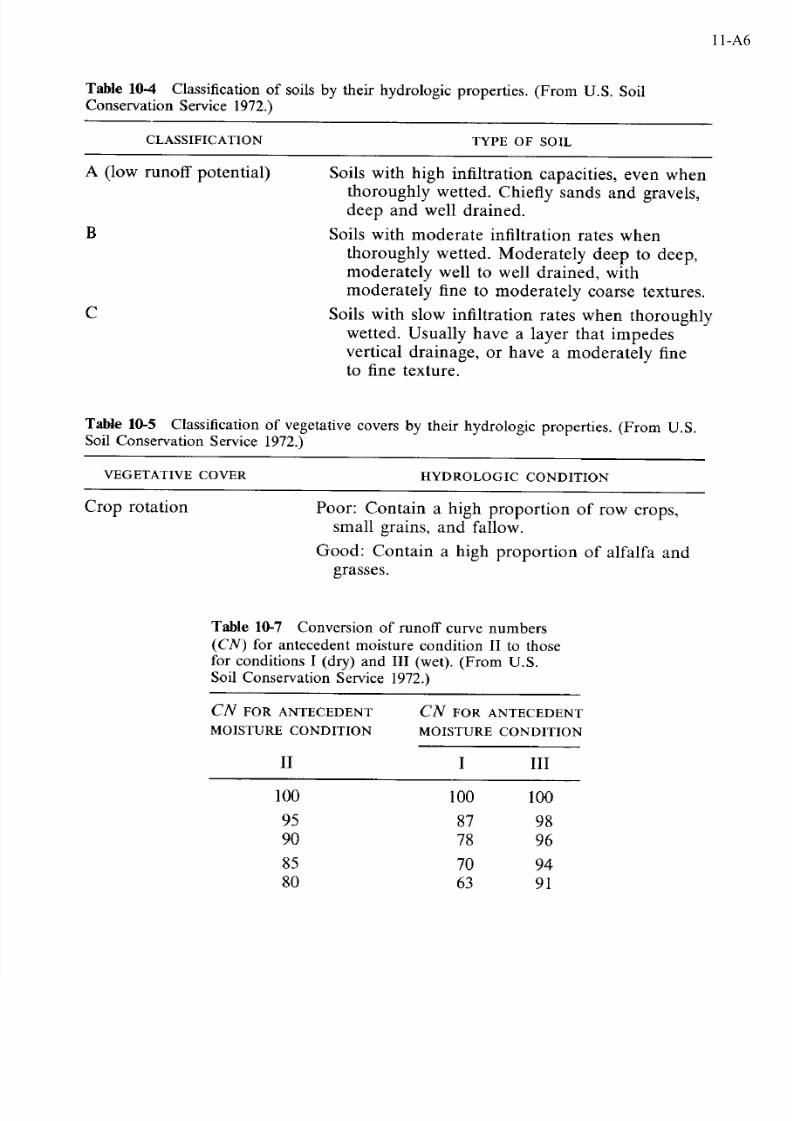
Estimating curve number
Dunne and Leopold (1978, Table 10-1)
Hydrologic condition (DL, Table 10-5): depends on land use
practice. For example, in crop land, fallow results in “Poor”hydrologic condition.
Soil group (DL, Table 10-4): depends on soil texture. For
example, fine texture soils belong to Group C.
Therefore, a typical prairie soil in summer-fallow condition
will have a curve number of 91.Antecedent moisture condition is represented by Classes
determined by antecedent rainfall. For example, if the fallow
soil has received 10 mm of rain in the last five days, it will be
classified as Class I. The curve number of this soil needs to be
adjusted to 80 (see DL, Table 10-7).
Dunne and Leopold (1978, Table 10-6)
8/8/2019 Lecture 11 Storm Runoff
http://slidepdf.com/reader/full/lecture-11-storm-runoff 13/20
11-1
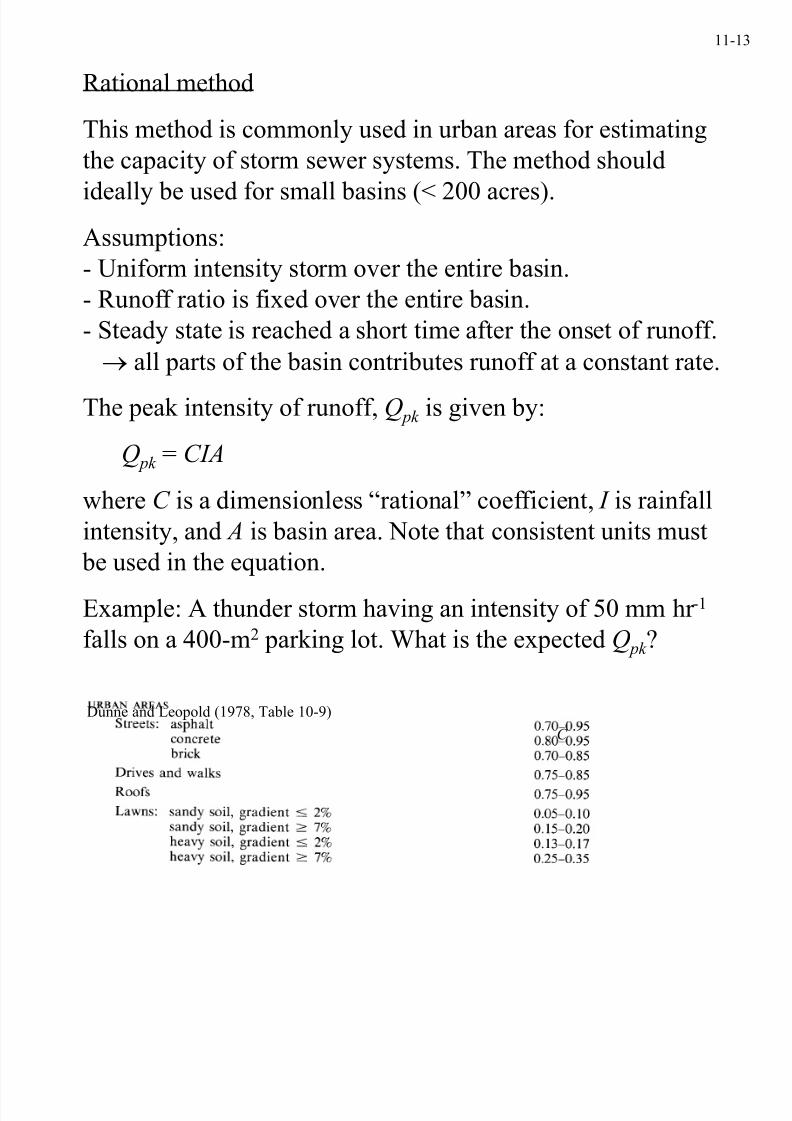
Rational method
This method is commonly used in urban areas for estimating
the capacity of storm sewer systems. The method should
ideally be used for small basins (< 200 acres).
Assumptions:
- Uniform intensity storm over the entire basin.
- Runoff ratio is fixed over the entire basin.
- Steady state is reached a short time after the onset of runoff.
→ all parts of the basin contributes runoff at a constant rate.
The peak intensity of runoff, Q pk is given by:
Q pk = CIA
where C is a dimensionless “rational” coefficient, I is rainfall
intensity, and A is basin area. Note that consistent units must
be used in the equation.
Example: A thunder storm having an intensity of 50 mm hr -1
falls on a 400-m2 parking lot. What is the expected Q pk ?
Dunne and Leopold (1978, Table 10-9)
C
8/8/2019 Lecture 11 Storm Runoff
http://slidepdf.com/reader/full/lecture-11-storm-runoff 14/20
11-1
Time of Concentration
Time required for runoff water to travel from the most distant
part of the basin to the outlet.
In rational method, it is the time required to reach steady state.Time of concentration (t c hr) is commonly estimated from:
t c = L1.15 / (7700 H 0.38)
where L (ft) is the length of the basin along the main stream
from the most distant ridge to the outlet, and H (ft) is the
elevation difference between the most distant edge and theoutlet. Note that this equation is only valid when specified
units are used.
8/8/2019 Lecture 11 Storm Runoff
http://slidepdf.com/reader/full/lecture-11-storm-runoff 15/20
11-A
GEOG415 Lecture 11 Appendix
Dunne and Leopold (1978, Fig. 10-8)

8/8/2019 Lecture 11 Storm Runoff
http://slidepdf.com/reader/full/lecture-11-storm-runoff 16/20
11-A

8/8/2019 Lecture 11 Storm Runoff
http://slidepdf.com/reader/full/lecture-11-storm-runoff 17/20
11-A
8/8/2019 Lecture 11 Storm Runoff
http://slidepdf.com/reader/full/lecture-11-storm-runoff 18/20
11-A

8/8/2019 Lecture 11 Storm Runoff
http://slidepdf.com/reader/full/lecture-11-storm-runoff 19/20
11-A
8/8/2019 Lecture 11 Storm Runoff
http://slidepdf.com/reader/full/lecture-11-storm-runoff 20/20
11-A