leather value chain investment profile leather investment profile 3-1_web.pdf · leather production...
TRANSCRIPT
LEATHER VALUE CHAIN INVESTMENT PROFILE
KENYA
© IT
C

(cc)
Mak
e it
Ken
ya
2018
LEATHER VALUE CHAININVESTMENT PROFILE
KENYA
4
LEAT
HE
R V
ALU
E C
HA
IN IN
VES
TME
NT
PR
OFI
LE K
EN
YA
FOREWORD
As Kenya strives to become an industrialized, middle-income country by 2030, developing the leather and leather goods sector offers an opportunity for industrialization and diversification of exports, according to a recent World Bank report. Indeed, leather processing has been identified as a priority manufacturing sub-sector in Kenya’s Big 4 Agenda for the period up to 2022. The target for the manufacturing
industry is to raise the sector’s contribution to the Gross Domestic Product (GDP) from less than 9% to 15% by 2022.
Despite owning a fifth of the global livestock population, African countries account for 4% of world leather production and 3.3% of value addition in leather according to the report.
The world trade in leather is currently growing and is estimated at more than $100 billion a year and the demand for leather and leather products is growing faster than supply.
For Kenya, home to the third largest livestock populations in Africa, leather represents a potential area for sustainable economic growth and employment. However, value addition in the leather sector has been minimal, and most of Kenya’s exports have been in the form of unprocessed, raw hides and skins. The leather sector can contribute to economic growth through expanding exports of both semi-processed and finished leather goods. The development of the sector involves improving the raw material base (especially the quality of hides and skins), boosting the tanning subsector, producing leather goods, and marketing.
The leather sector in Kenya is estimated to be worth over Sh50 billion annually. Unfortunately, exporting raw hides and skins has denied the country billions of shillings in direct earnings and thousands of job opportunities. Over 90% of Kenya’s $94 million (Sh9.4 billion) leather exports are unfinished wet blue leather, yet further processing could create at least 50,000 jobs and $150-250 million (Sh15-25 billion) in GDP.
The Kenya Investment Authority (KenInvest) is a statutory body currently operating under an Act of Parliament (Investment Promotion Act No. 6 of 2004) with the main objective of promoting investments in Kenya, including the investment opportunities in the leather sector. It is responsible for facilitating the implementation of new leather sector related investment projects, providing after care services for new and existing investments, as well as organizing investment promotion activities both locally and internationally. A modern one stop centre has been set up to provide public services to investors under one roof and with utmost effectiveness.
Kenya seeks to produce 20 million shoes by 2022 in the leather industry in order to reduce the current import of finished shoes. The focus will be on training and setting up of 5,000 cottage industries to boost production in addition to a leather park to be established in Machakos to take advantage of the country’s hide and skin production.
This profile guideline prepared by KenInvest in partnership with the International Trade Centre’s SITA project is therefore timely. It is expected to provide all the necessary information required by investors interested to invest in the country in the livestock value chain particularly the leather subsector. It is our sincere hope that this guide will encourage and drive the transformation of the leather sector in the country. Kenya is ready and open for business; we welcome investors in the leather sector to consider the immense opportunities in the country.
Mr. Moses Ikiara
Managing Director KENYA INVESTMENT AUTHORITY ( KENINVEST )

5
LEAT
HE
R V
ALU
E C
HA
IN IN
VES
TME
NT
PR
OFI
LE K
EN
YA
ACKNOWLEDGEMENTS
This profile has been produced under the framework of the Supporting Indian Trade and Investment for Africa ( SITA ) project, funded by the Department for International Development, Government of the United Kingdom, and implemented by International Trade Centre. SITA is a South-South trade and investment project aimed at improving the competitiveness of select value chains and increasing investment in five East African countries through partnerships with institutions and businesses from India.
Special contributions to writing this report have been provided by:
Quality Assurance: International Trade Centre ( ITC ), Supporting Indian Trade and Investment for Africa ( SITA ) – T.C.A. Ranganathan,
External Consultant; Jarmila Sarda, Investment Expert ( SITA );Authors: Aristide Djimgou Tchakounte, Nicholas Mudungwe
Layout: Jesús Alés
Editor: Vanessa Finaughty
The views expressed in this report are those of the authors and do not represent the official position of International Trade Centre, Tanzania Investment Centre or the Government of the United Kingdom. The images used in this profile may not always accurately reflect the country context.
© International Trade Centre 2018
ITC encourages reprints and translations for wider dissemination. Short extracts may be freely reproduced, with due acknowledgement, using the suggestion citation. For more extensive reprints or translations, please contact ITC, using the online permission request form: http://www.intracen.org/Reproduction-Permission-Request/

6
LEAT
HE
R V
ALU
E C
HA
IN IN
VES
TME
NT
PR
OFI
LE K
EN
YA
Table of Contents
WHY KENYA? 10
OVERVIEW 10
Favourable geographical location 10
Political stability and progress 10
Vibrant GDP performance 10
Effective monetary policy and inflation stability 11
Liberal foreign exchange regime 12
Strong financial sector performance 12
Rapid growth in global competitiveness 13
Foreign direct investment dynamics on an upward trend 13
Export and import policies 14
Competitive operating and utility costs 16
An attractive human resource pool and a rising middle class 16
GLOBAL AND REGIONAL IMPORTANCE OF LEATHER 18
KENYAN LEATHER INDUSTRY OVERVIEW 19
KENYAN LEATHER VALUE CHAIN 21
INVESTMENT OPPORTUNITIES IN THE KENYAN LEATHER SECTOR 22
Investment in modernized slaughterhouses 22
Investment opportunities in the production of finished leather 23
Investment opportunities in the production of footwear 23
Kariokor Market 24
Kenya Leather Park 25
TRADE AND INVESTMENT CLIMATE 27
TRADE 27
Liberal trade policy 27
Commitment to bilateral and multilateral investment and trade agreements 27
INVESTMENT INCENTIVES 29
Fiscal and financial incentives 30
Export and import incentives 31
TAXES 32
Transparent taxation system 32
Taxation and company registration procedures 32
Customs duties 33
VISAS AND WORK PERMITS 33
REGISTRATION PROCEDURES FOR COMPANIES 34
Registration requirements 34
Sector-specific rules 36
BUYING LAND 37
Land purchase procedures 37
USEFUL CONTACTS 38
REFERENCES 42

7
LEAT
HE
R V
ALU
E C
HA
IN IN
VES
TME
NT
PR
OFI
LE K
EN
YA
List of Tables
TABLE 1: GLOBAL ECONOMIC GROWTH ( % ) 11
TABLE 2: NOMINAL INTEREST RATE, 2013–2017 ( % ) 13
TABLE 3: COSTS OF UTILITIES AND OTHER PRODUCTION FACTORS 16
TABLE 4: SELECTED SLAUGHTERHOUSES IN KENYA 22
TABLE 5: SELECTED TANNERIES AND THEIR CAPACITY USAGE 23
TABLE 6: SELECTED KENYAN FOOTWEAR MANUFACTURERS 24
TABLE 7: SELECTED KENYAN LEATHER GOODS MANUFACTURERS 25
TABLE 8: NGOZI KENYA LEATHER PARK, KINANIE, MACHAKO COUNTY 26
TABLE 9: INVESTMENT INCENTIVES FOR EXPORT PROCESSING ZONES AND SPECIAL ECONOMIC ZONES IN KENYA 30
TABLE 10: OVERVIEW OF CAPITAL DEDUCTION MEASURES FOR INVESTORS IN KENYA 31
TABLE 11: EXPORT AND IMPORT INCENTIVES 32
TABLE 12: INDIVIDUAL INCOME TAX 32
TABLE 13: BUSINESS TAXES AND EXEMPTION OF TAXES 32
EXEMPTION OF TAXES 33
TABLE 14: CUSTOMS DUTIES IN KENYA 33
TABLE 15: REGULATIONS FOR THE ESTABLISHMENT OF A FOREIGN-OWNED COMPANY IN KENYA 34
TABLE 16: REGISTERING A LOCAL COMPANY ( BY FOREIGNERS ) 35
TABLE 17: REGISTERING A BRANCH OF A FOREIGN COMPANY 35
KENYAN INVESTMENT FACILITATION INSTITUTIONS 38
FINANCIAL INSTITUTIONS 38

8
LEAT
HE
R V
ALU
E C
HA
IN IN
VES
TME
NT
PR
OFI
LE K
EN
YA
List of Figures
FIGURE 1: KENYA’S GDP GROWTH AND ANNUAL INFLATION RATE AT CONSUMER PRICE ( 2012–2016 ) 11
FIGURE 2: KENYAN SHILLING EXCHANGE RATE 12
FIGURE 3: SHARE OF FDI INFLOWS IN KENYA BY ECONOMIC BLOCS 14
FIGURE 4: DISTRIBUTION OF IMPORTING MARKETS FOR KENYAN EXPORTS 15
FIGURE 5: DISTRIBUTION OF SUPPLYING MARKETS FOR KENYAN IMPORTS 15
FIGURE 6: KENYA’S POPULATION BY AGE GROUP 17
FIGURE 7: LEATHER INDUSTRY VALUE CHAIN 18
FIGURE 8: PRODUCTION TREND OF HIDES AND SKINS IN AFRICA ( 2003–2014 ) 19
FIGURE 9: GROWING TRENDS IN THE LEATHER INDUSTRY 20
FIGURE 10: MAIN SUPPLIERS OF LEATHER FOOTWEAR IMPORTED BY KENYA ( 2009–2016 ) 20
FIGURE 11: OVERVIEW OF THE KENYAN LEATHER VALUE CHAIN 21
FIGURE 12: KENYAN IMPORT OF FOOTWEAR AND PARTS OF FOOTWEAR ( 2006–2015 ) 24
FIGURE 13: TRIPARTITE FREE TRADE AREA MAP 28
FIGURE 14: KENYAN MULTILATERAL TRADE AGREEMENTS 29
FIGURE 15: FORMS OF FOREIGN COMPANY SET-UPS IN KENYA 34
BOX 1: STEPS TO GET AN OPERATIONAL ENTITY 36

9
LEAT
HE
R V
ALU
E C
HA
IN IN
VES
TME
NT
PR
OFI
LE K
EN
YA
Abbreviations & Acronyms
ACP African, Caribbean and Pacific
Countries and Regions
AGOA African Growth and Opportunity Act
AoA Articles of Association
CBK Central Bank of Kenya
CBR: Central Bank Rate
CFTA Continental Free Trade Agreement
CMA Capital Markets Authority
CoI Certificate of Incorporation
COMESA Common Market for Eastern
and Southern Africa
CPA Cotonou Partnership Agreement
DFTP Duty Free Tariff Preference
EA East Africa
EAC East African Community
EBA Everything But Arms
EPA Economic Partnership Agreements
EPZ Export processing zone
FAO Food and Agriculture Organisation
FDI Foreign direct investment
FIPA Foreign Investment Protection Act
FIS Foreign investment survey
GSP General Systems of Preferences
H&S Hides and skins
IMF International Monetary Fund
KAM Kenyan Association of Manufacturers
KenInvest Kenya Investment Authority
KES Kenyan shilling
KNBS Kenyan National Bureau of Statistics
KLDC Kenya Leather Development Council
KRA Kenya Revenue Authority
LCB Land Control Board
LDC Least Developed Country
MFN Most favoured nation
MoA Memorandum of Articles
MUB Manufacture Under Bond
NEMA National Environment Management Authority
NHIF National Hospital Insurance Fund
NSE Nairobi Securities Exchange
OSC One Stop Centre
PAYE Pay As You Earn
PIN Personal identification number
SEZ Special economic zone
SME Small and Medium Enterprise
TIFA Trade and Investment Framework Agreement
TREO Tax Remission for Exports Office
VAT Value-added tax
WTO World Trade Organization

10
LEAT
HE
R V
ALU
E C
HA
IN IN
VES
TME
NT
PR
OFI
LE K
EN
YA
OVERVIEW
FAVOURABLE GEOGRAPHICAL LOCATION
The Republic of Kenya is located on the coast of East Africa. Its coastline is approximately 600 km, making it an easy access point to land-linked Eastern and Central African nations like the Republic of Burundi, the Democratic Republic of the Congo ( DRC ), the Republic of Rwanda and the Republic of Uganda.
POLITICAL STABILITY AND PROGRESS
With a Human Development Index of 0.555, Kenya has the highest score in the East African Community ( EAC ). This is partly due to its recent political reform that stems from the passage of a new constitution in 2010 ( introduction of a bicameral legislative house, devolved county government, and a constitutionally tenured judiciary and electoral body ). Devolution remains the biggest gain from the August 2010 constitution, which ushered in a new political and economic governance system. It is transformative and has strengthened accountability as well as public service delivery at local levels.
VIBRANT GDP PERFORMANCE
Kenya belongs to the top 10 biggest economies in Africa. Its gross domestic product ( GDP ) rose from $ 25 800 million in 2006 to $ 81 880 million in 2017. With an average real growth rate of 5.8 %, Kenya is gradually emerging as one of the economic powerhouses of the Global South. Even though the estimated economic growth for 2017 is lower compared to 2016, this figure is expected to rise in 2018. Moreover, Kenya’s average economic growth is well above the Sub-Saharan Africa average ( Table 1 ). The key drivers for growth include a vibrant services sector, currency stability, low inflation, low fuel prices, a growing middle-class and rising incomes, a surge in remittances, and increased public investment in energy and transportation. Its position as the economic, commercial and logistical hub in Eastern and Central Africa places the country as one of the best investment destinations globally.
Why Kenya?
Key facts
Capital: Nairobi
Area: 580 370 km2
Population: 48.5 million ( 2017 )
0-14 years: 41.2 %
15-64 years: 55.5 %
Economically active population: 19.8 million ( 2017 )
Female: 47.2 %
Male: 52.7 %
Population growth: 2.6 % ( 2017 )
Female: 81.6 % ( 2008–2012 )
Male: 83.2 % ( 2008–2012 )
Urban population: 26.9 % ( 2017 )
Literacy rate: 89.1 % ( 2017 )
Men: 92.4 %
Women: 87.8 %
GDP at current market prices: $ 81 880 million ( 2017 )
GDP per capita ( current ) $ 1 507.8 ( 2017 )
GDP per capita ( PPP ): $ 3 120 ( 2016 )
GDP growth: 4.8 % ( 2017 )
Inflation rate: 4.18 % ( March 2018 )
FDI inflow: $ 1 420 million ( 2015 )
Credit rating
Standard & Poor’s: B+ ( stable )
Fitch: B+ ( stable )
Moody’s: B1 ( stable )
Exports: $ 5 747 million ( 2017 )
Imports: $ 16 690 million ( 2017 )
Currency: Kenyan shillings ( KES )
Exchange rate ( per USD ):KES 100.8 ( stand: 03.07.2018 ).
Volatility last 90 days = 0.17 %
Govt. expenditure: $ 14 800 million ( March 2018 )
Govt. revenue: $ 9 500 million ( Feb. 2018 )
Other major cities: Mombasa, Kisumu and Nakuru
Language: English, Swahili
Sources: AfDB, 2018; KNBS, 2018; International Trade Centre, 2018; Trading Economics, 2018; World Bank, 2017; CIA, 2016.

© IT
C
11
LEAT
HE
R V
ALU
E C
HA
IN IN
VES
TME
NT
PR
OFI
LE K
EN
YA
Table 1: Global economic growth ( % )
Actual Estimated Projected
2016 2017 2018
World output 3.2 3.7 3.9
Advanced economies 1.7 2.3 2.3
Of which: The United States of America 1.5 2.3 2.7
Emerging and developing economies 4.4 4.7 4.9
Of which: The People’s Republic of China 6.7 6.8 6.6
The Republic of India 7.1 6.7 7.4
Sub-Saharan Africa 1.4 2.7 3.3
Of which: The Republic of South Africa 0.3 0.9 0.9
The Federal Republic of Nigeria -1.6 0.8 2.1
The Republic of Kenya 5.8 4.8 5.6
Source: WEO cited in Kenyan Budget Policy Statement, 2018; Projections by the National Treasury.
According to the Kenya National Bureau of Statistics ( KNBS ), the overall year-on-year inflation eased to 4.83 % in January 2018 from 6.99 % in the same month in 2017. This figure is not far from Statista’s projection of the average inflation in Kenya until 2022, which is expected to stabilize at 5 %. Drought, however, remains a potential upside risk to inflation, as the country is dependent on rain-fed agriculture.
Figure 1: Kenya’s GDP growth and annual inflation rate at consumer price ( 2012–2016 )
Source: World Bank, 2018.
EFFECTIVE MONETARY POLICY AND INFLATION STABILITY
Kenya has a sound monetary policy system, which has resulted in general stability in inflation over the past 10 years. This environment is highly conducive to supporting and sustaining new local investment and foreign direct investment ( FDI ). The inflation stability, averaging 6.97 % per annum between 2012 and 2016, has been instrumental in supporting economic growth.

12
LEAT
HE
R V
ALU
E C
HA
IN IN
VES
TME
NT
PR
OFI
LE K
EN
YA
LIBERAL FOREIGN EXCHANGE REGIME
Kenya is an open economy with a liberalized capital account and a floating exchange rate. Indeed, the exchange rate regime is fully liberalized, which allows easier and simpler repatriation of foreign currency. In addition, Kenya’s Foreign Investment Protection Act ( FIPA ) guarantees capital repatriation and remittance of dividends. Kenya has maintained a solid import cover. Reserves stood at $ 7.7 billion ( 5.1 months of import cover ) at the end of October 2016 compared to $ 7.6 billion ( equivalent to 5 months of import cover ) at the end of April 2016. These reserves, together with the precautionary arrangements with the International Monetary Fund ( IMF ), continue to provide an adequate buffer against short-term shocks. The economy is diversified in terms of export products and external markets. This has been a major source of resilience against the adverse effects of external shocks on exports. As a result, the Kenyan shilling exchange rate as compared to most Sub-Saharan African currencies has continued to display relatively less volatility ( Figure 2 ).
STRONG FINANCIAL SECTOR PERFORMANCE
Domestic lending has been on an upward trend in Kenya, contributing immensely to economic performance. New credit lines and products to support short-term and medium-term investments have been developed in tandem with the improved
sophistication of the Kenyan financial sector. As a result, the Kenyan financial sector is one of the most sophisticated and strongest in the East African region and the African continent at large.
Indeed, the annual growth rates of money supply and private-sector credit were consistent with the developments in the financial sector, in particular, the enforcement of the Banking ( Amendment ) Act 2016. While money supply ( M1 ) expanded by 6.7 % in December 2017, the extended broad money supply ( M3 ) grew by 8.9 % in December 2017. Credit to the private sector expanded by 2.4 % in 2017 and total domestic credit grew by 7.9 % in 2017. Average deposit rates rose by 1.07 % from December 2016 to December 2017 to reach 8.22 %. The commercial banks’ average interest rates charged on loans and advances declined from 13.69 % in December 2016 to 13.64 % in December 2017, whereas the Central Bank Rate ( CBR ) remained unchanged at 10 %. Table 2 presents nominal interest rates for the period of 2013 to 2017.
There are 44 banks in Kenya, of which 30 have local ownership and 14 have foreign ownership. Six of the domestically owned banks are institutions with government participation. The foreign-owned financial institutions comprise four foreign-owned, not locally incorporated banks ( e.g. Bank of India ) and 10 foreign-owned, locally incorporated banks. A list of these financial institutions and their respective contacts can be found under the section Useful Contacts.
Figure 2: Kenyan shilling exchange rate
Source: Central Bank of Kenya, cited in Kenyan Budget Policy Statement, 2018.

(cc)
Mak
e it
Ken
ya
13
LEAT
HE
R V
ALU
E C
HA
IN IN
VES
TME
NT
PR
OFI
LE K
EN
YA
FOREIGN DIRECT INVESTMENT DYNAMICS ON AN UPWARD TREND
Kenya became one of the largest recipients of FDI in Africa after benefiting from a 50 % increase in FDI projects in 2015, compared to the previous year ( Santander, 2017 ). From the most recent Foreign Investment Survey ( FIS ) of the Kenya National Bureau of Statistics ( KNBS ), total FDI inflows were reported to have increased by 8 % from approximately $ 1.3 billion in 2014 to approximately $ 1.4 billion in 2015. According to the FIS report, FDI inflows from the European Union ( EU ) and the Far East accounted for 31.9 % and 21.7 % respectively in 2014. This trend was reversed in 2015, as the FDI inflow from the Far East and the Republic of India increased by 21.3 % to reach 43 %, and that of the EU declined to 25.9 %.
The People’s Republic of China, Japan and the Republic of India are reported to be the dominant sources of FDI inflows within Asia, jointly accounting for 92.17 % in 2015. FDI inflow from the Republic of India more than doubled from approximately $ 39 million in 2014 to approximately $ 79.2 million in 2015. For further information on the share of FDI inflow by economic blocs for the year 2015, please see Figure 3.
RAPID GROWTH IN GLOBAL COMPETITIVENESS
Kenya registered 3.85 points out of 7 on the 2016–2017 Global Competitiveness Report published by the World Economic Forum. Its competitiveness index averaged 3.8 points from 2007 until 2017, reaching an all-time high of 3.93 points in 2016. Kenya is making significant inroads in improving its business environment. Its ranking has been improving rapidly over the last years and moved from 113 to 80 between 2016 and 2018 ( World Bank ). Significant improvements were recorded in resolving insolvency, starting a new business, protecting minority investments and getting electricity. This has seen its overall performance index ( distance to frontier, DTF ) moving up by 7.65 points, to reach 65.15 points in 2018.
Table 2: Nominal interest rate, 2013–2017 ( % )
2013 2014 2015 2016 2017
Dec. Dec. Dec. Dec. Dec.
CENTRAL BANK OF KENYA
91-Day Treasury Bills Rate 9.52 8.58 9.81 8.44 8.01
Central Bank Rate 8.50 8.50 11.50 10.00 10.00
Repo rate 9.38 8.29 9.23 N/A 7.75
Inter-bank rate 8.98 6.91 7.72 5.92 7.27
COMMERCIAL BANKS*
Average deposits 6.65 6.81 8.02 7.33 8.22
Saving deposits 1.58 1.85 1.56 6.37 6.91
Loans and advances ( maximum ) 16.99 15.99 18.30 13.69 13.64
Overdraft 16.51 15.86 18.48 13.49 13.54
Loans–deposits spread 10.34 9.18 10.28 6.36 5.41
Note: *Weighted average commercial bank interest rates. Source: Economic Survey, KNBS, 2018.

14
LEAT
HE
R V
ALU
E C
HA
IN IN
VES
TME
NT
PR
OFI
LE K
EN
YA
Moreover, the Foreign Investment Protection Act ( FIPA ) guarantees the repatriation of capital, after tax profits and remittance of dividends and interests that result from investing in the country. The constitution also provides a guarantee against expropriation of private property unless for security or public interest, and, in these cases, a fair and prompt compensation is paid.
EXPORT AND IMPORT POLICIES
Duties are charged on exports, imports and particular services and goods as described in the amended East Africa Custom Management Act of 2004. This act sets out the services and goods chargeable as well as the rates of these duties, along with the exempt services and goods. Usually, exports are not taxed if the person who profits from the services or goods being exported is not a Kenyan resident. Importing into Kenya entails using a clearing agent to electronically process the import documentation through Kenya’s customs and clear the goods. The country trade regime is liberalized, except for a few import-licensing controls based on environmental, health and security concerns. As a result of this liberal trade policy, the country’s estimated value of its overall product import in 2017 was well above the estimated value of its overall product export in the same year; that is approximately $ 16.7 billion for overall product import and $ 5.7 billion for overall product export. While the United States of America is the largest importer of Kenyan products, followed by the Kingdom of the Netherlands and the United Kingdom of Great Britain and Northern Ireland, it is the People’s Republic of China that heads the imports of products to Kenya, with the Republic of India being the second and Japan the third.
Figure 3: Share of FDI inflows in Kenya by economic blocs
Note: Rest of world ( ROW ) includes other European and African countries, Middle East countries, Australia/Oceanic and international organizations.
Source: KNBS, FIS report 2016. Calculations based on an exchange rate of 1 USD = 100.74 KES.
(cc)
Mak
e it
Ken
ya

15
LEAT
HE
R V
ALU
E C
HA
IN IN
VES
TME
NT
PR
OFI
LE K
EN
YA
Figure 4: Distribution of importing markets for Kenyan exports
Figure 5: Distribution of supplying markets for Kenyan imports
Source: International Trade Centre, 2018.
Source: International Trade Centre, 2018.

16
LEAT
HE
R V
ALU
E C
HA
IN IN
VES
TME
NT
PR
OFI
LE K
EN
YA
As a lower-middle income country, consumer spending is considered a key economic driver in Kenya. BMI Research ( cited in Deloitte, 2016 ) predicts that private spending will increase twofold from $ 47 billion in 2015 to $ 87 billion in 2020. As a result of rising incomes, Kenya has a favourable population structure ( expected to increase by 40 million between 2015 and 2050, giving rise to an expanding working age population ) and growing financial inclusion. Subsequently, the country’s middle class, which is currently estimated at 44.9 % of the population, is expected to continue expanding by an average annual growth rate of 5 %.
COMPETITIVE OPERATING AND UTILITY COSTS
Operating costs like utilities ( water and electricity ), wages, the price of land and transport costs, among others, have a bearing in the determination of industrial competitiveness and consequently attracting investment. The cost structure of some these variables in Kenya are summarized in Table 3.
AN ATTRACTIVE HUMAN RESOURCE POOL AND A RISING MIDDLE CLASS
Kenya prides itself on a large pool of young, highly educated, English-speaking, skilled and sought-after workforce in Africa, trained from within the country and in institutions around the world. Of the adult population, 89.1 % are literate, with a life expectancy of 67 years at birth. Kenya also has one of the largest youth populations in Africa, with almost 16 million people in the age group of 15–34 years. Kenya’s entrepreneurship and human capital give it a huge potential for further growth, job creation and poverty reduction.
Table 3: Costs of utilities and other production factors
Item Cost ( in USD )
Cost of water ( per 1 000-litre unit ) 0.53 to 0.63
Cost of power ( charge per unit, kWh ) and
government taxes on power and lighting
0.041 to 0.061
• Sixteen per cent value-added tax ( VAT ) of standing charge and taxable value of electricity energy consumed with the exemption of the first 200 units under domestic consumption
• Rural Electrification Programme ( REP ) levy at 5 % of revenue from unit sales
• Energy Regulatory Commission ( ERC ) levy at 3 cents per kWh
Cost of construction ( USD per sq. metre ). Rates
are for Mombasa, Nairobi and Kisumu.
Industrial complex ( two-storey )
• 290–320Warehouses ( Ditto )
• 270–310Office blocks ( four-storey )
• 350–380
Minimum wages* ( averages per month )
Minimum wages for agricultural industry:
• Unskilled employees – 64.16• Skilled and semi-skilled employees – 85.95Minimum wages in urban areas:
• Nairobi, Mombasa and Kisumu cities – 198• All other towns – 160-174
*Kenya minimum wage rate is set by the government and varies by location, age and skill level.
All figures were converted at a rate of USD 1 = KES 100.
Source: Kenya Power and Lighting Co. Ltd., 2018; Nairobi City Water and Sewerage Company, 2018; Trading Economics, 2018; Kenyan Ministry of Labour and Social Protection, 2018; Institute of Quantity Surveyors of Kenya, 2015.
© IT
C

© IT
C
17
LEAT
HE
R V
ALU
E C
HA
IN IN
VES
TME
NT
PR
OFI
LE K
EN
YA
Figure 6: Kenya’s population by age group
Source: United Nations Department of Economic and Social Affairs ( UN DESA ), 2015 ( cited in Deloitte, 2016 ).

18
LEAT
HE
R V
ALU
E C
HA
IN IN
VES
TME
NT
PR
OFI
LE K
EN
YA
The leather industry value chain comprises four broad stages ( see Figure 7 ). During the first stage, raw hides and skins ( H&S ) are obtained. In the second stage, raw H&S are converted to semi-processed ( pickled and tanned ) and the third stage produces fully processed ( finished ) leather. In the fourth stage, leather products are manufactured, e.g. footwear, garments, accessories such as watch straps, handbags, tabletops and notepad covers, and automotive or furniture upholstery.
Leather is one of the most widely traded commodities in the world. The leather industry plays a major role in the global economy, with an estimated global trade value of approximately $ 100 billion per year, which is greater than the combined value chain of meat, sugar, coffee and tea. The leather industry has grown at a different pace in the different parts of the world depending on the general economic development of the country and geography.
Global and regional importance of leather
Figure 7: Leather industry value chain
Source: S. Dubey, cited in ITC, 2016.
19
LEAT
HE
R V
ALU
E C
HA
IN IN
VES
TME
NT
PR
OFI
LE K
EN
YA
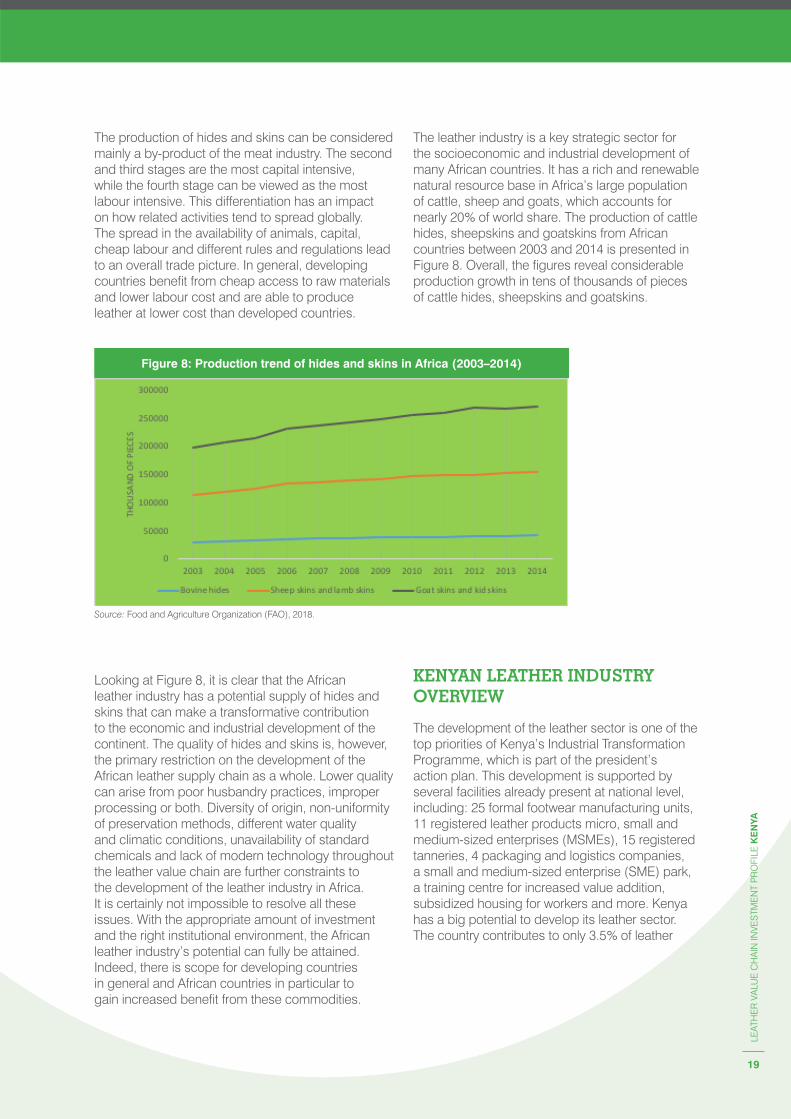
The leather industry is a key strategic sector for the socioeconomic and industrial development of many African countries. It has a rich and renewable natural resource base in Africa’s large population of cattle, sheep and goats, which accounts for nearly 20 % of world share. The production of cattle hides, sheepskins and goatskins from African countries between 2003 and 2014 is presented in Figure 8. Overall, the figures reveal considerable production growth in tens of thousands of pieces of cattle hides, sheepskins and goatskins.
The production of hides and skins can be considered mainly a by-product of the meat industry. The second and third stages are the most capital intensive, while the fourth stage can be viewed as the most labour intensive. This differentiation has an impact on how related activities tend to spread globally. The spread in the availability of animals, capital, cheap labour and different rules and regulations lead to an overall trade picture. In general, developing countries benefit from cheap access to raw materials and lower labour cost and are able to produce leather at lower cost than developed countries.
Looking at Figure 8, it is clear that the African leather industry has a potential supply of hides and skins that can make a transformative contribution to the economic and industrial development of the continent. The quality of hides and skins is, however, the primary restriction on the development of the African leather supply chain as a whole. Lower quality can arise from poor husbandry practices, improper processing or both. Diversity of origin, non-uniformity of preservation methods, different water quality and climatic conditions, unavailability of standard chemicals and lack of modern technology throughout the leather value chain are further constraints to the development of the leather industry in Africa. It is certainly not impossible to resolve all these issues. With the appropriate amount of investment and the right institutional environment, the African leather industry’s potential can fully be attained. Indeed, there is scope for developing countries in general and African countries in particular to gain increased benefit from these commodities.
Figure 8: Production trend of hides and skins in Africa ( 2003–2014 )
Source: Food and Agriculture Organization ( FAO ), 2018.
KENYAN LEATHER INDUSTRY OVERVIEW
The development of the leather sector is one of the top priorities of Kenya’s Industrial Transformation Programme, which is part of the president’s action plan. This development is supported by several facilities already present at national level, including: 25 formal footwear manufacturing units, 11 registered leather products micro, small and medium-sized enterprises ( MSMEs ), 15 registered tanneries, 4 packaging and logistics companies, a small and medium-sized enterprise ( SME ) park, a training centre for increased value addition, subsidized housing for workers and more. Kenya has a big potential to develop its leather sector. The country contributes to only 3.5 % of leather
(cc)
Mak
e it
Ken
ya
20
LEAT
HE
R V
ALU
E C
HA
IN IN
VES
TME
NT
PR
OFI
LE K
EN
YA
production on the African continent, despite having the third-biggest livestock resource in Africa after the Federal Democratic Republic of Ethiopia and the United Republic of Tanzania. This forms a good base on which to develop the leather value chain. In 2014, Kenya’s large livestock resource base had an estimated population of 17.5 million cattle, 27.7 million goats and 17.1 million sheep. These figures are projected to reach 27 million, 50 million and 29 million respectively by 2022. The growing importance of the leather industry in Kenya as seen in Figure 9 shows that the potential is slowly but gradually being tapped. Nonetheless, much more still needs to be done, as there are still many shortcomings and much room for improvement, especially in relation to capital availability.
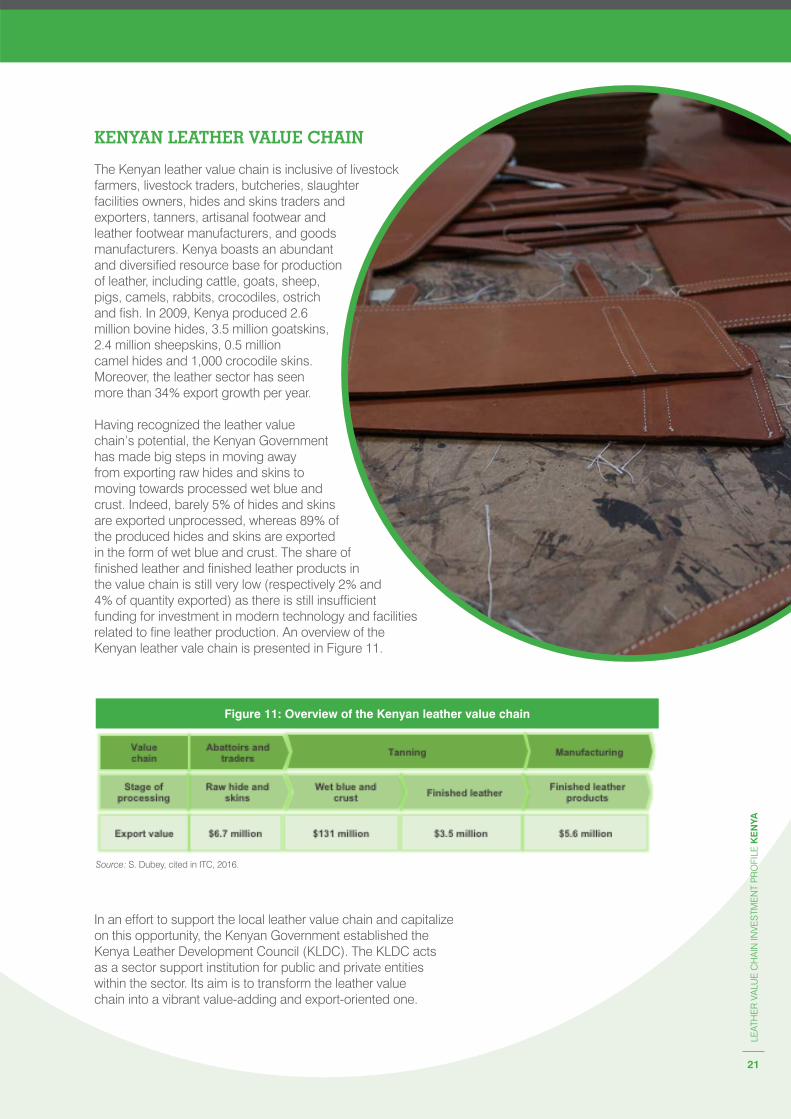
The rapid growth of Kenya’s economy is increasing the aggregate demand of all consumer goods, including footwear and leather goods, and there is a sizeable domestic market for leather products in the country. The demand for footwear in Kenya was estimated at 42 million pairs in 2014, of which 36 % were leather shoes. The demand is projected to expand to 46.8 million pairs in 2022. Shoe supply was estimated at 3.5 million in 2016, thus resulting in a shortfall of 36.7 million pairs per annum. This shortage of domestic supply is seen in the rising value of leather footwear imports, which grew more than fivefold between 2001 and 2017 as depicted in Figure 10. For the fiscal year 2017, the three biggest suppliers of imported Kenyan leather footwear were China, India and the Philippines, respectively.
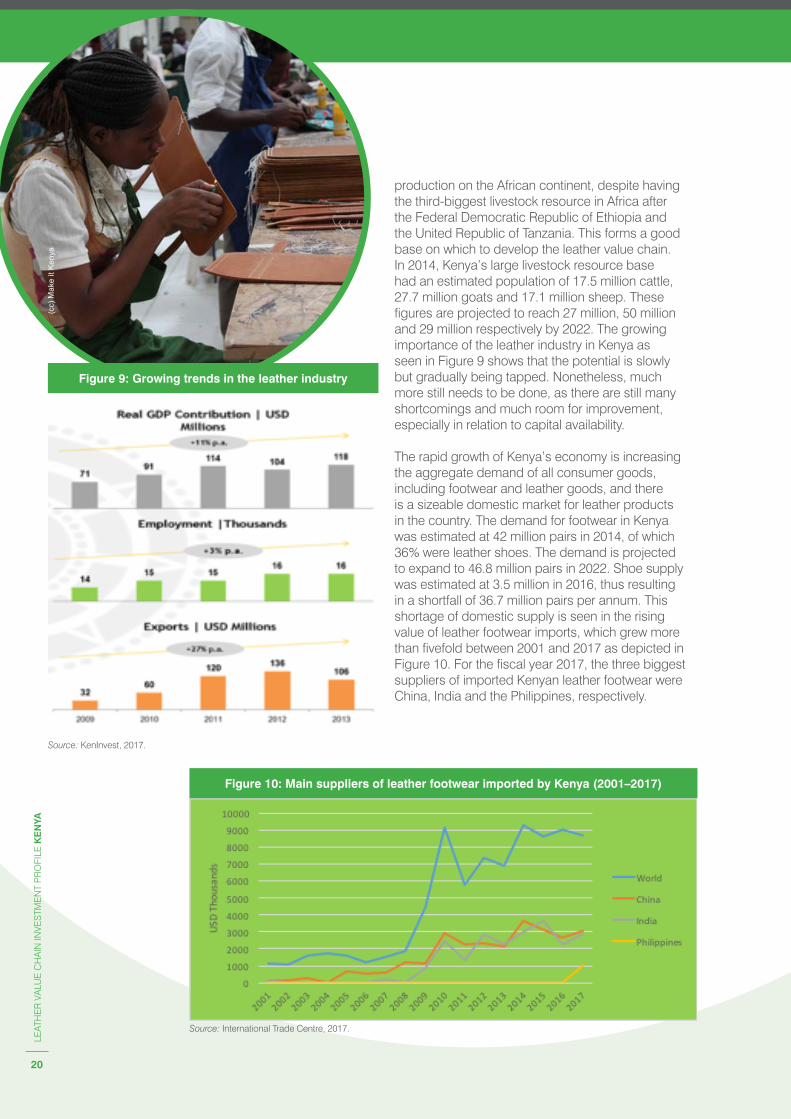
Figure 9: Growing trends in the leather industry
Source: KenInvest, 2017.
Figure 10: Main suppliers of leather footwear imported by Kenya (2001–2017)
Source: International Trade Centre, 2017.
(cc)
Mak
e it
Ken
ya
21
LEAT
HE
R V
ALU
E C
HA
IN IN
VES
TME
NT
PR
OFI
LE K
EN
YA
KENYAN LEATHER VALUE CHAIN
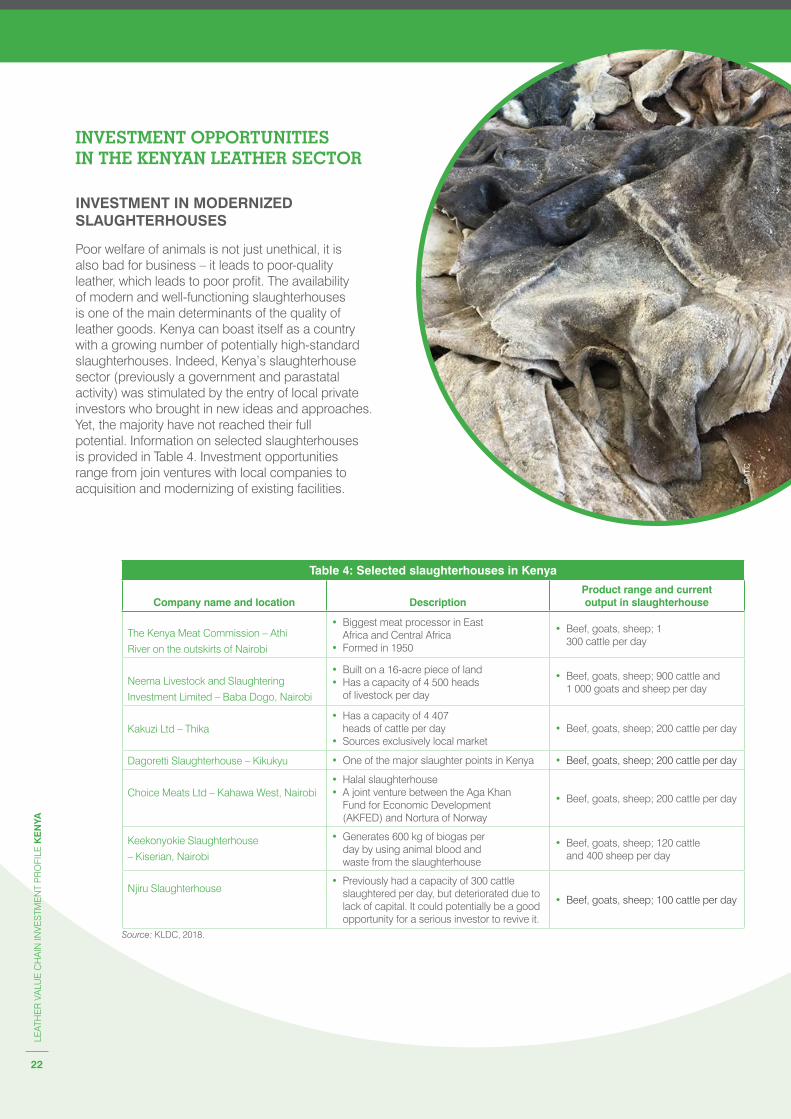
The Kenyan leather value chain is inclusive of livestock farmers, livestock traders, butcheries, slaughter facilities owners, hides and skins traders and exporters, tanners, artisanal footwear and leather footwear manufacturers, and goods manufacturers. Kenya boasts an abundant and diversified resource base for production of leather, including cattle, goats, sheep, pigs, camels, rabbits, crocodiles, ostrich and fish. In 2009, Kenya produced 2.6 million bovine hides, 3.5 million goatskins, 2.4 million sheepskins, 0.5 million camel hides and 1,000 crocodile skins. Moreover, the leather sector has seen more than 34 % export growth per year.
Having recognized the leather value chain’s potential, the Kenyan Government has made big steps in moving away from exporting raw hides and skins to moving towards processed wet blue and crust. Indeed, barely 5 % of hides and skins are exported unprocessed, whereas 89 % of the produced hides and skins are exported in the form of wet blue and crust. The share of finished leather and finished leather products in the value chain is still very low ( respectively 2 % and 4 % of quantity exported ) as there is still insufficient funding for investment in modern technology and facilities related to fine leather production. An overview of the Kenyan leather vale chain is presented in Figure 11.
Figure 11: Overview of the Kenyan leather value chain
Source: S. Dubey, cited in ITC, 2016.
In an effort to support the local leather value chain and capitalize on this opportunity, the Kenyan Government established the Kenya Leather Development Council ( KLDC ). The KLDC acts as a sector support institution for public and private entities within the sector. Its aim is to transform the leather value chain into a vibrant value-adding and export-oriented one.
© IT
C
22
LEAT
HE
R V
ALU
E C
HA
IN IN
VES
TME
NT
PR
OFI
LE K
EN
YA
INVESTMENT OPPORTUNITIES IN THE KENYAN LEATHER SECTOR
INVESTMENT IN MODERNIZED SLAUGHTERHOUSES
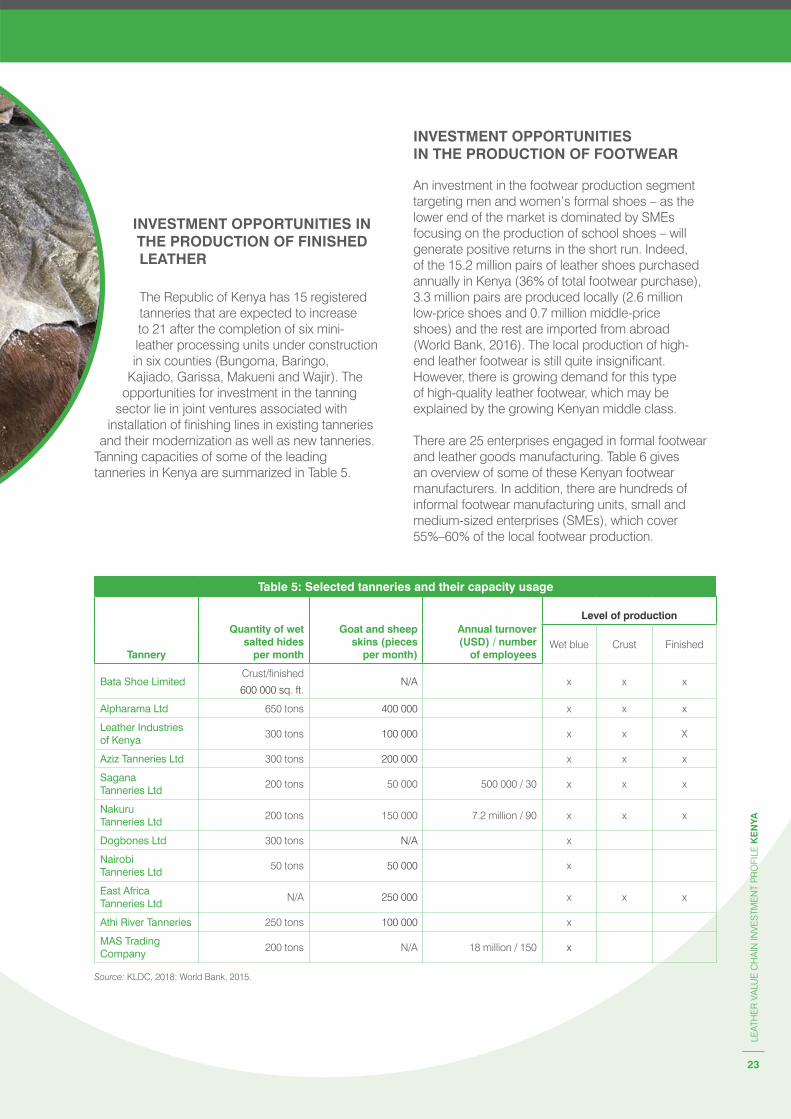
Poor welfare of animals is not just unethical, it is also bad for business – it leads to poor-quality leather, which leads to poor profit. The availability of modern and well-functioning slaughterhouses is one of the main determinants of the quality of leather goods. Kenya can boast itself as a country with a growing number of potentially high-standard slaughterhouses. Indeed, Kenya’s slaughterhouse sector ( previously a government and parastatal activity ) was stimulated by the entry of local private investors who brought in new ideas and approaches. Yet, the majority have not reached their full potential. Information on selected slaughterhouses is provided in Table 4. Investment opportunities range from join ventures with local companies to acquisition and modernizing of existing facilities.
Table 4: Selected slaughterhouses in Kenya
Company name and location DescriptionProduct range and current output in slaughterhouse
The Kenya Meat Commission – Athi
River on the outskirts of Nairobi
• Biggest meat processor in East Africa and Central Africa
• Formed in 1950
• Beef, goats, sheep; 1 300 cattle per day
Neema Livestock and Slaughtering
Investment Limited – Baba Dogo, Nairobi
• Built on a 16-acre piece of land• Has a capacity of 4 500 heads
of livestock per day
• Beef, goats, sheep; 900 cattle and 1 000 goats and sheep per day
Kakuzi Ltd – Thika• Has a capacity of 4 407
heads of cattle per day• Sources exclusively local market
• Beef, goats, sheep; 200 cattle per day
Dagoretti Slaughterhouse – Kikukyu • One of the major slaughter points in Kenya • Beef, goats, sheep; 200 cattle per day
Choice Meats Ltd – Kahawa West, Nairobi• Halal slaughterhouse• A joint venture between the Aga Khan
Fund for Economic Development ( AKFED ) and Nortura of Norway
• Beef, goats, sheep; 200 cattle per day
Keekonyokie Slaughterhouse
– Kiserian, Nairobi
• Generates 600 kg of biogas per day by using animal blood and waste from the slaughterhouse
• Beef, goats, sheep; 120 cattle and 400 sheep per day
Njiru Slaughterhouse• Previously had a capacity of 300 cattle
slaughtered per day, but deteriorated due to lack of capital. It could potentially be a good opportunity for a serious investor to revive it.
• Beef, goats, sheep; 100 cattle per day
Source: KLDC, 2018.
23
LEAT
HE
R V
ALU
E C
HA
IN IN
VES
TME
NT
PR
OFI
LE K
EN
YA
INVESTMENT OPPORTUNITIES IN THE PRODUCTION OF FOOTWEAR
An investment in the footwear production segment targeting men and women’s formal shoes – as the lower end of the market is dominated by SMEs focusing on the production of school shoes – will generate positive returns in the short run. Indeed, of the 15.2 million pairs of leather shoes purchased annually in Kenya ( 36 % of total footwear purchase ), 3.3 million pairs are produced locally ( 2.6 million low-price shoes and 0.7 million middle-price shoes ) and the rest are imported from abroad ( World Bank, 2016 ). The local production of high-end leather footwear is still quite insignificant. However, there is growing demand for this type of high-quality leather footwear, which may be explained by the growing Kenyan middle class.
There are 25 enterprises engaged in formal footwear and leather goods manufacturing. Table 6 gives an overview of some of these Kenyan footwear manufacturers. In addition, there are hundreds of informal footwear manufacturing units, small and medium-sized enterprises ( SMEs ), which cover 55 %–60 % of the local footwear production.
INVESTMENT OPPORTUNITIES IN THE PRODUCTION OF FINISHED LEATHER
The Republic of Kenya has 15 registered tanneries that are expected to increase to 21 after the completion of six mini-leather processing units under construction in six counties ( Bungoma, Baringo,
Kajiado, Garissa, Makueni and Wajir ). The opportunities for investment in the tanning
sector lie in joint ventures associated with installation of finishing lines in existing tanneries
and their modernization as well as new tanneries. Tanning capacities of some of the leading tanneries in Kenya are summarized in Table 5.
Table 5: Selected tanneries and their capacity usage
Tannery
Quantity of wet salted hides
per month
Goat and sheep skins ( pieces
per month )
Annual turnover ( USD ) / number
of employees
Level of production
Wet blue Crust Finished
Bata Shoe LimitedCrust/finished
600 000 sq. ft.N/A x x x
Alpharama Ltd 650 tons 400 000 x x x
Leather Industries of Kenya
300 tons 100 000 x x X
Aziz Tanneries Ltd 300 tons 200 000 x x x
Sagana Tanneries Ltd
200 tons 50 000 500 000 / 30 x x x
Nakuru Tanneries Ltd
200 tons 150 000 7.2 million / 90 x x x
Dogbones Ltd 300 tons N/A x
Nairobi Tanneries Ltd
50 tons 50 000 x
East Africa Tanneries Ltd
N/A 250 000 x x x
Athi River Tanneries 250 tons 100 000 x
MAS Trading Company
200 tons N/A 18 million / 150 x
Source: KLDC, 2018; World Bank, 2015.

© IT
C
24
LEAT
HE
R V
ALU
E C
HA
IN IN
VES
TME
NT
PR
OFI
LE K
EN
YA
The footwear market is also growing rapidly into the EAC and Common Market for Eastern and Southern Africa ( COMESA ) markets, where Kenya has duty-free access for all products meeting the rules of origin. This trend can be seen in Figure 12, which illustrates a rapid growth of footwear imports into Kenya ( this does not include second-hand imports, whose quantity is estimated to be two times that of new footwear imports ).
Table 6: Selected Kenyan footwear manufacturers
Company name and location Product range Capacity
Bata Shoe
Limited – Limuru
• Men, women and children shoes ( especially slippers )
60 000 pairs per day
United Footwear
Ltd – Nairobi
• Safety and military boots ( using vulcanizing process )
• School and sports shoes• Sandals
7 000 pairs per month
Crown Industries
Ltd – Nairobi
• Leather shoes and soles designer
3 000 pairs per day
Khan Ltd – Nairobi• Handcrafted men and
women shoes4 000 pairs per month
Shoe Wind
Industries – Nairobi
• Handcrafted men and women shoes
5 000 pairs per month
Source: KLDC, 2018.
Figure 12: Kenyan import of footwear and parts of footwear ( 2006–2015 )
Source: International Trade Centre, 2018.
* Parts of footwear, incl. uppers whether or not attached to soles other than outer soles; removable in-soles, heel cushions and similar articles; gaiters, leggings and similar articles, and parts thereof ( excluding articles of asbestos ).
KARIOKOR MARKET
The recent increase of leather goods units ( some of these leather goods manufacturers can be found in Table 7 ) has contributed to KLDC’s decision to launch the Kariokor Market Upgrade project. The project aims to transform the Kariokor Market, situated at the heart of Nairobi, into a common manufacturing facility for the production of quality footwear and
leather goods. The Kariokor Market is a concentration point for manufacturing companies with MSMEs ( more than 200 stalls and thousands of MSMEs ) specializing in the production of a wide range of footwear and other items made from leather and other materials. The main objective of this measure is to enhance the Kenyan leather sector’s productivity and efficiency and go a step further on the value addition chain. This project ( along with the Kenyan Leather Park presented in the next section ) is a concrete example of the local authorities’ engagement in promoting the leather sector, and thus represents a huge opportunity on which investors can capitalize.

© IT
C
25
LEAT
HE
R V
ALU
E C
HA
IN IN
VES
TME
NT
PR
OFI
LE K
EN
YA
KENYA LEATHER PARK
In an effort to boost local leather production, the Kenyan Government is investing $ 62 million into the establishment of the Ngozi Kenya Leather Park at Kinanie, Machakos County ( 60 km away from Nairobi International Airport ). The Ngozi Kenya Leather Park, set on a 500-acre site, will promote value addition and innovation towards unlocking the Kenyan leather sector’s economic potential ( KLDC, 2017 ). The land has been provided by the Export Processing Zones Authority ( EPZA ). The park aims to create an enabling environment for the attraction and facilitation of increased foreign direct investment into Kenya. The details of this project can be seen in Table 8.
Table 7: Selected Kenyan leather goods manufacturers
Name of manufacturing company Physical address, e-mail and website Product range
Adele DejakP.O. Box 944-00621, Village Market, Nairobi
http://www.adeledejak.com
Produces assorted leather goods
Adelphi, the Leather ShopYaya Centre, 1st Floor, Argwings Kodhek Rd, Nairobi
www.adelphileather.biz
Produces bags, handbags, folders, wallets, briefcases, accessories and corporate gift items
African Lily ABC Place Waiyaki Way, Nairobi
http://www.african-lily.com
Produces leather accessories, including wallets, purses, handbags and belts, among others
Annabelle Thom – African
Classics Ltd.
Ground Floor, Junction Shopping Mall, Dagoretti Corner, Ngong Road, Nairobi
[email protected] www.annabellethom.com
Produces assorted leather goods
Gonzala Leathers Santack Estate, Ngong Road 2204, Nairobi
https://gonzalaleathers.wordpress.com/
Produces quality leather, canvas and African print products
Habib Leather IndustryP.O. Box 100848 ( 00101 ), Nairobi
https://habibleather.wordpress.com/
Produces high-quality leather products, including corporate gift items, sports items and items for the catering and hotel industry
Kraw Leathers LtdFalcon Road, Nairobi
http://krawleathers.yolasite.com
Produces leather bags, sandals, purses, footwear and other leather accessories
Rift Valley Leather Ltd Tembo Road, Karen, Nairobi
https://www.rift-africa.com/
Produces high-quality leather products, including bags, wallets and belts, among others
Sanabora Design House Ltd
Aqua Plaza, opposite Kenya Institute of Curriculum Development, 3rd Floor, Murang’a Road, Nairobi
www.sanabora.com/
Produces assorted leather goods
Sources: KLDC, 2018; Kenyaplex, 2018.

(cc)
Mak
e it
Ken
ya
26
LEAT
HE
R V
ALU
E C
HA
IN IN
VES
TME
NT
PR
OFI
LE K
EN
YA
Table 8: Ngozi Kenya Leather Park, Kinanie, Machako County
Dimension Benefits
Project overview
The establishment of a 500-acre leather cluster with a host of services to promote the sector, including:
• Five to six leather footwear manufacturers• Eight to ten leather tanneries• Three to four packaging and logistic companies• A small and medium-sized enterprise park• Training centre to enhance value addition• Reduced labour and electricity cost• Export processing zone ( EPZ ) benefits on taxation and trade• Integrated facilities such as residential complex, schools, health and recreational centres
Convenience
• Located next to Nairobi, with access to key labour markets and local partnerships• Ease and cost of transportation ( air and road ) critical for re-exporting• The existing 339-hectare site hosts more than 40 industries• Standard of living high given proximity to Nairobi• Close to existing leather industries, e.g. tanneries and slaughterhouses• Distance from Port of Mombasa is 450 km• Connected to Mombasa by a major highway and new standard gauge railway• Convenient infrastructure• On-site training
World-class infrastructure• Plug and play location• High environmental standards in line with EU regulations• Shared production facilities – laser cutting machines and computer-aided design machines
Investment incentives
Taxation, with regard to export-oriented investors
• Corporate tax holiday of 10 years• Withholding tax holiday of 10 years• Exempted from stamp duty• Inputs exempted from import and export duties• Exempted from VAT
Business services
• Full operation under one single licence• Project approval and licensing within 30 days• Foreign currency accounts and offshore borrowing allowed – no exchange controls• Unrestricted investment by foreigners• One-stop shop service for facilitation and after care• On-site customs documentation
Source: KLDC, 2017.

27
LEAT
HE
R V
ALU
E C
HA
IN IN
VES
TME
NT
PR
OFI
LE K
EN
YA
� African Growth and Opportunity Act ( AGOA ): This is a non-reciprocal trade preference agreement offering certain commodities from eligible Sub-Saharan African countries duty-free access to the United States of America’s market. AGOA has been renewed until 2025;
� Trade and Investment Framework Agreement ( TIFA ): Signed between the United States of America and the East African Community ( EAC ) in 2008. This provides strategic frameworks and principles for dialogue on trade and investment issues between the United States of America and the other parties to the agreement;
� Economic partnership agreements ( EPAs ): These are agreements between the EU and African, Caribbean and Pacific countries and regions ( ACP ) that aim to promote ACP–EU trade – and ultimately contribute, through trade and investment, to sustainable development and poverty reduction;
� Cotonou Partnership Agreement ( CPA ), also known as African Caribbean Pacific European Union ( ACP-EU ) Partnership Agreement: This agreement established the Generalized System of Preferences ( GSP ) – a non-reciprocal preferential treatment granted to developing countries;
� Everything But Arms ( EBA ): This is a European Union ( EU ) initiative under which all imports to the EU from the least developed countries ( LDCs ) are duty-free and quota-free, with the exception of armaments;
� African Continental Free Trade Area ( AfCFTA ): This refers to the free trade area agreement between 44 member states of the African Union signed during the 10th Ordinary Session of African Union Heads of State summit held in Kigali in March 2018. The AfCFTA is now the largest free trade area since the creation of the WTO.
TRADE
LIBERAL TRADE POLICY
Trade policy in Kenya has evolved over time, changing from an inward-looking import substitution policy regime to a trade policy whose primary objective is the promotion of exports of consumer and intermediate goods, while simultaneously laying the base for eventual production of capital goods for domestic and export markets. This is expected to lead to higher earnings of foreign exchange, which, in turn, will help to reduce the balance of payments deficit and the unemployment problems. The Kenyan Government has put in place various incentives, such as the duty and VAT remission, Manufacturing under Bond Scheme, and export processing zones. This is reinforced by the pursuance of a flexible and realistic exchange rate that promotes exports.
COMMITMENT TO BILATERAL AND MULTILATERAL INVESTMENT AND TRADE AGREEMENTS
Kenya’s external trade policies are designed to create an environment conducive to promoting its products in international markets, especially those of the developed countries in Europe, the United States of America and Japan, without prejudice to the promotion of intra-African trade. Trade policies are formulated with the view to speed up Kenya’s industrialization process, and in such a way make access to foreign markets easier for Kenyan products. In pursuing these objectives, Kenya has entered into multilateral, regional, bilateral and preferential trade arrangements.
Kenya is a member of several trade arrangements and a beneficiary to trade-enhancing schemes, including:
� World Trade Organization ( WTO ): Being a member of the WTO implies that Kenyan products have access to more than 90 % of world markets at most-favoured-nation ( MFN ) treatment;
Trade and investment climate

28
LEAT
HE
R V
ALU
E C
HA
IN IN
VES
TME
NT
PR
OFI
LE K
EN
YA
Furthermore, Kenya is also a member of the East African Community ( EAC ) and the Common Market for Eastern and Southern Africa ( COMESA ). For EAC imports, the duty rate is zero, whereas for COMESA imports, the duty rates are in the range of 0 %–1 %. The following COMESA countries have reduced customs duty rates ( 0 % ) for eligible products in order to fully participate in the free trade area: the Republic of Burundi, the Union of the Comoros, the Republic of Djibouti, the Arab Republic of Egypt, the Republic of Kenya, Libya, the Republic of Madagascar, the Republic of Malawi, the Republic of Mauritius, the Republic of Rwanda, the Republic of the Sudan, the Republic of Zambia and the Republic of Zimbabwe. See Figure 13 for more understanding on the geographical distribution of countries within COMESA, EAC and Southern African Development Community ( SADC ) regional blocks.
The aim of this agreement is to create a continental market for products and services ( a market of approximately 1.2 billion people and cumulated GDP of approximately $ 3.4 trillion ) with free movement of business partners and investment. This is expected to promote intra-African trade, to support the regional and continental integration of Africa, and to further develop the African economy’s manufacturing sector. The free trade area agreement will become operational after 22 countries have ratified it. In the meantime, it is still possible for countries that did not sign the agreement to do so before it comes into force.
Figure 13: Tripartite Free Trade Area map
Source: UNCTAD

29
LEAT
HE
R V
ALU
E C
HA
IN IN
VES
TME
NT
PR
OFI
LE K
EN
YA
Under these agreements, Kenya and its contracting partners accord each other most-favoured-nation treatment in all matters with respect to their mutual trade relations. This is also an instrument used to promote trade and improve economic relations between Kenya and these countries.
INVESTMENT INCENTIVES
Kenya’s investment code, articulated in the Investment Promotion Act of 2004, is designed to shape the administrative and legal procedures to achieve a more effective investment climate. The Investment Promotion Act’s goal is to attract and facilitate investment by assisting investors in obtaining the licences necessary to invest and providing other assistance and incentives.
These multilateral trade agreements not only give Kenya preferential access to a global market valued at approximately $ 36.8 trillion, but also to a network of more than 1.4 billion potential consumers. These figures are detailed in Figure 14. The recently signed African Continental Free Trade Area ( AfCFTA ) agreement adds to the already impressive statistics of Kenya’s global market potential.
The Republic of Kenya has also signed bilateral trade agreements with several countries: the Argentine Republic, the People’s Republic of Bangladesh, the Republic of Bulgaria, the People’s Republic of China, the Union of the Comoros, the Democratic Republic of the Congo ( DRC ), the Republic of Djibouti, the Arab Republic of Egypt, Hungary, the Republic of India, the Republic of Iraq, the Republic of Korea, the Kingdom of Lesotho, the Republic of Liberia, the Kingdom of the Netherlands, the Federal Republic of Nigeria, the Islamic Republic of Pakistan, the Republic of Poland, Romania, the Russian Federation, the Republic of Rwanda, the Federal Republic of Somalia, the Kingdom of Swaziland, the United Republic of Tanzania, the Kingdom of Thailand, the Republic of Zambia, and the Republic of Zimbabwe. Additional agreements are under negotiation with several other countries: the Republic of Belarus, the Czech Republic, the Federal Democratic Republic of Ethiopia, the State of Eritrea, the Islamic Republic of Iran, the Republic of Kazakhstan, the Republic of Mauritius, the Republic of Mozambique and the Republic of South Africa.
Figure 14: Kenyan multilateral trade agreements
Source: KenInvest, updated with World Bank figures, 2015 / 2016.
(cc)
Mak
e it
Ken
ya
30
LEAT
HE
R V
ALU
E C
HA
IN IN
VES
TME
NT
PR
OFI
LE K
EN
YA
� The OSC has a few incubation rooms where investors can start operations before they have offices;
� Investors can get information on investment opportunities available in all counties and across all sectors;
� Advice on the best investment schemes in special economic zones, export processing zones or other options available in Kenya; and
� Registration of businesses, acquisition of work permits, and facilitation of other permits and licences that are necessary for their investment can be done at the OSC.
FISCAL AND FINANCIAL INCENTIVES
In order to encourage investment, the Kenyan Government has put in place incentives such as investment allowance, offsetting of losses by future taxable profits, remissions from capital goods, and export promotion programmes like EPZs. Investors in export zones enjoy a 10-year tax holidays followed by a 25 % corporate tax rate for the following 10 years, and investors in EPZs are exempted from paying import duties.
Fiscal incentives are mainly in the form of capital deductions. Generally, these deductions are made when computing the profits of the company or individual for any year. Capital deduction can be divided into: industrial building deductions, farm works deduction, wear and tear deduction, and investment deduction. Details can be found in Table 10.
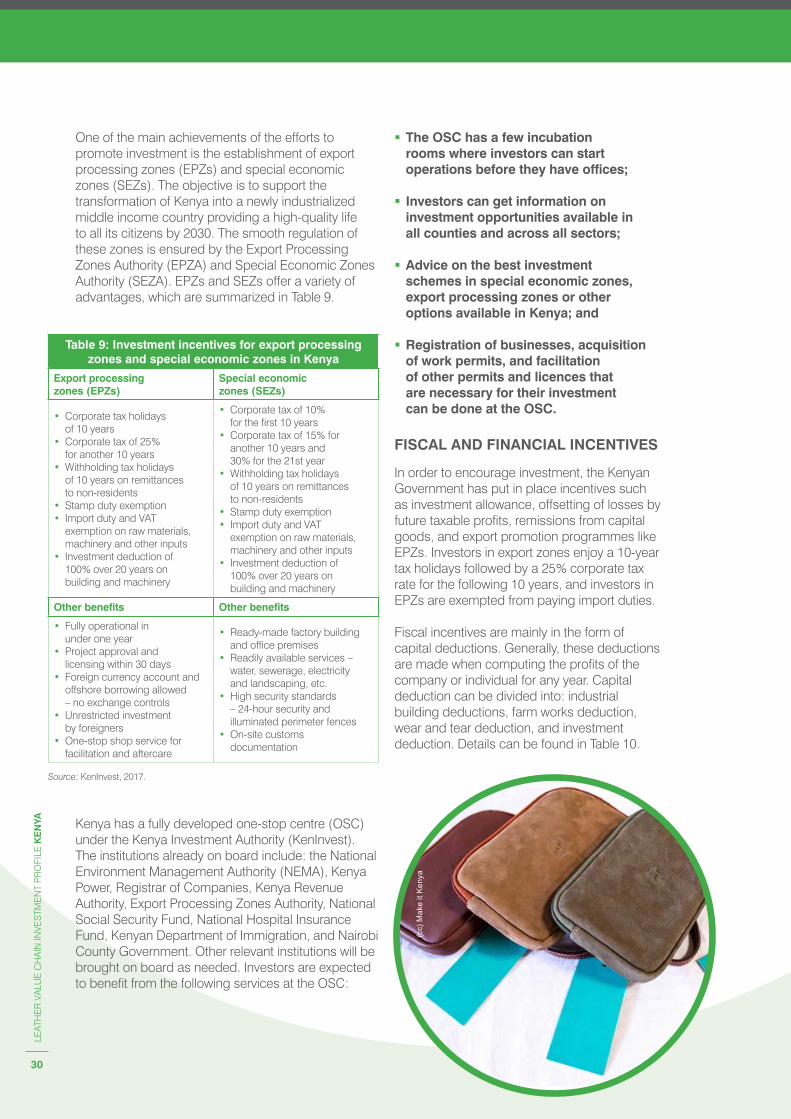
Kenya has a fully developed one-stop centre ( OSC ) under the Kenya Investment Authority ( KenInvest ). The institutions already on board include: the National Environment Management Authority ( NEMA ), Kenya Power, Registrar of Companies, Kenya Revenue Authority, Export Processing Zones Authority, National Social Security Fund, National Hospital Insurance Fund, Kenyan Department of Immigration, and Nairobi County Government. Other relevant institutions will be brought on board as needed. Investors are expected to benefit from the following services at the OSC:
One of the main achievements of the efforts to promote investment is the establishment of export processing zones ( EPZs ) and special economic zones ( SEZs ). The objective is to support the transformation of Kenya into a newly industrialized middle income country providing a high-quality life to all its citizens by 2030. The smooth regulation of these zones is ensured by the Export Processing Zones Authority ( EPZA ) and Special Economic Zones Authority ( SEZA ). EPZs and SEZs offer a variety of advantages, which are summarized in Table 9.
Table 9: Investment incentives for export processing zones and special economic zones in Kenya
Export processing zones ( EPZs )
Special economic zones ( SEZs )
• Corporate tax holidays of 10 years
• Corporate tax of 25 % for another 10 years
• Withholding tax holidays of 10 years on remittances to non-residents
• Stamp duty exemption• Import duty and VAT
exemption on raw materials, machinery and other inputs
• Investment deduction of 100 % over 20 years on building and machinery
• Corporate tax of 10 % for the first 10 years
• Corporate tax of 15 % for another 10 years and 30 % for the 21st year
• Withholding tax holidays of 10 years on remittances to non-residents
• Stamp duty exemption• Import duty and VAT
exemption on raw materials, machinery and other inputs
• Investment deduction of 100 % over 20 years on building and machinery
Other benefits Other benefits
• Fully operational in under one year
• Project approval and licensing within 30 days
• Foreign currency account and offshore borrowing allowed – no exchange controls
• Unrestricted investment by foreigners
• One-stop shop service for facilitation and aftercare
• Ready-made factory building and office premises
• Readily available services – water, sewerage, electricity and landscaping, etc.
• High security standards – 24-hour security and illuminated perimeter fences
• On-site customs documentation
Source: KenInvest, 2017.
(cc)
Mak
e it
Ken
ya
31
LEAT
HE
R V
ALU
E C
HA
IN IN
VES
TME
NT
PR
OFI
LE K
EN
YA
EXPORT AND IMPORT INCENTIVES
In relation to exports, there are several incentives to promote investment and value addition in the Kenyan leather industry. Some of these include:
� Provision of technical advice to exporters by the Department of Veterinary Services;
� 1 % of the free on board ( FOB ) value of wet blue leather charged by the Department of Veterinary Services. The Kenya Revenue Authority ( KRA ) does not charge any levy, thus encouraging value addition;
� 0.5 % of the FOB value of crust leather charged by the Department of Veterinary Services, which goes to the Veterinary Services Development Fund ( VSDF ). KRA does not charge any levy;
� No levies charged on finished leather by either KRA or the Department of Veterinary Services.
More generally, there are also several incentives to promote international trade in Kenya. Table 11 summarizes the most important ones.
Table 10: Overview of capital deduction measures for investors in Kenya
Capital deduction Description and advantages
Industrial building
deduction
Deduction on capital expenditure incurred for the construction of an industrial building. Some deductions include:
• Capital deduction of 2.5 % applicable within the first 40 years of operation;
• Capital deduction of 25 % on rental residential building approved by the minister in a planned developed area;
• Capital deduction of 25 % on commercial building in a developed area.
Investment
deduction
Deduction granted on cost of a building and machinery installed therein. Some applicable rates include:
• Investment allowance of 100 % for investments situated within Nairobi, Mombasa and Kisumu;
• Investment allowance of 150 % for investments worth 200 million Kenyan shillings and situated outside Nairobi, Mombasa and Kisumu.
Wear and tear
deductions
An allowance granted to the investor to cater for wear and tear on machinery. Some include:
• Allowance of 37.5 % on heavy earth-moving, self-propelling equipment and 25 % allowance on other self-propelling machines;
• Allowance of 12.5 % on non-self-propelling machines;
• Allowance of 30 % on office electronic machinery and equipment;
• Allowance of 20 % for five years on a straight line basis for computer software and for telecommunication equipment.
Source: Kenya.eRegulations/KenInvest.
Other fiscal and financial incentives include:
� Depreciation – liberal rates are allowed for depreciation of assets based on value;
� Loss carryforward – business enterprises must recover from previous losses before paying corporate tax again;
� Duty remission facility – exemption on duties and VAT on raw material used to process confirmed exports orders;
� Capital expenditure – duties paid for capital expenditure of more than $ 70,000 can be recovered from corporate tax; and
� Capital goods and basic raw material – are duty-free.
(cc)
Mak
e it
Ken
ya
32
LEAT
HE
R V
ALU
E C
HA
IN IN
VES
TME
NT
PR
OFI
LE K
EN
YA
TAXES
TRANSPARENT TAXATION SYSTEM
In tandem with all segments of business in Kenya, the taxation system has also undergone significant reforms in order to enhance its capacity to meet the basic conditions of a good taxation system following the principles of fairness, adequacy, simplicity, transparency and administrative ease. The country’s tax system has many modern elements, including a pay as you earn ( PAYE ) individual income tax with graduated, but moderate rates and a credit invoice value-added tax ( VAT ). The main sources of tax revenue in Kenya are duties on goods and services and income tax, which account for 47 % and 40 % respectively of total tax revenue.
TAXATION AND COMPANY REGISTRATION PROCEDURES
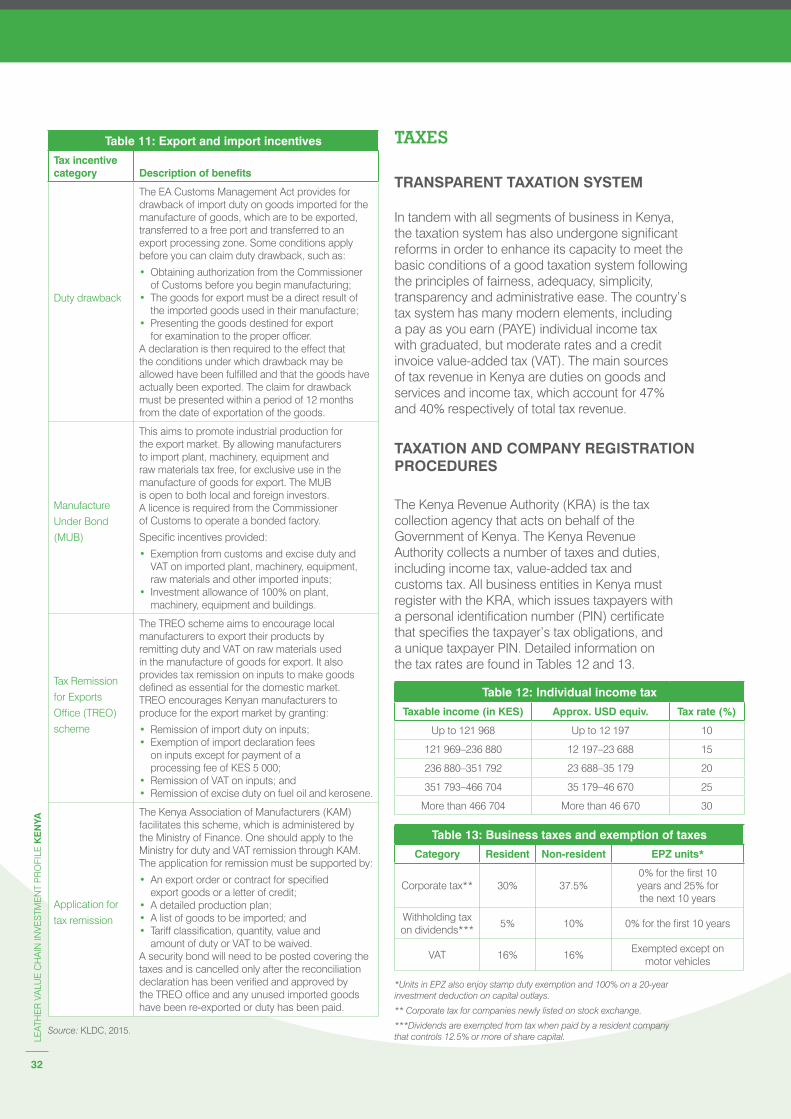
The Kenya Revenue Authority ( KRA ) is the tax collection agency that acts on behalf of the Government of Kenya. The Kenya Revenue Authority collects a number of taxes and duties, including income tax, value-added tax and customs tax. All business entities in Kenya must register with the KRA, which issues taxpayers with a personal identification number ( PIN ) certificate that specifies the taxpayer’s tax obligations, and a unique taxpayer PIN. Detailed information on the tax rates are found in Tables 12 and 13.
Table 12: Individual income tax
Taxable income ( in KES ) Approx. USD equiv. Tax rate ( % )
Up to 121 968 Up to 12 197 10
121 969–236 880 12 197–23 688 15
236 880–351 792 23 688–35 179 20
351 793–466 704 35 179–46 670 25
More than 466 704 More than 46 670 30
Table 13: Business taxes and exemption of taxes
Category Resident Non-resident EPZ units*
Corporate tax** 30 % 37.5 %0 % for the first 10 years and 25 % for the next 10 years
Withholding tax on dividends***
5 % 10 % 0 % for the first 10 years
VAT 16 % 16 %Exempted except on
motor vehicles
*Units in EPZ also enjoy stamp duty exemption and 100 % on a 20-year investment deduction on capital outlays.
** Corporate tax for companies newly listed on stock exchange.
***Dividends are exempted from tax when paid by a resident company that controls 12.5 % or more of share capital.
Table 11: Export and import incentives
Tax incentive category Description of benefits
Duty drawback
The EA Customs Management Act provides for drawback of import duty on goods imported for the manufacture of goods, which are to be exported, transferred to a free port and transferred to an export processing zone. Some conditions apply before you can claim duty drawback, such as:
• Obtaining authorization from the Commissioner of Customs before you begin manufacturing;
• The goods for export must be a direct result of the imported goods used in their manufacture;
• Presenting the goods destined for export for examination to the proper officer.
A declaration is then required to the effect that the conditions under which drawback may be allowed have been fulfilled and that the goods have actually been exported. The claim for drawback must be presented within a period of 12 months from the date of exportation of the goods.
Manufacture
Under Bond
( MUB )
This aims to promote industrial production for the export market. By allowing manufacturers to import plant, machinery, equipment and raw materials tax free, for exclusive use in the manufacture of goods for export. The MUB is open to both local and foreign investors. A licence is required from the Commissioner of Customs to operate a bonded factory.
Specific incentives provided:
• Exemption from customs and excise duty and VAT on imported plant, machinery, equipment, raw materials and other imported inputs;
• Investment allowance of 100 % on plant, machinery, equipment and buildings.
Tax Remission
for Exports
Office ( TREO )
scheme
The TREO scheme aims to encourage local manufacturers to export their products by remitting duty and VAT on raw materials used in the manufacture of goods for export. It also provides tax remission on inputs to make goods defined as essential for the domestic market. TREO encourages Kenyan manufacturers to produce for the export market by granting:
• Remission of import duty on inputs;• Exemption of import declaration fees
on inputs except for payment of a processing fee of KES 5 000;
• Remission of VAT on inputs; and• Remission of excise duty on fuel oil and kerosene.
Application for
tax remission
The Kenya Association of Manufacturers ( KAM ) facilitates this scheme, which is administered by the Ministry of Finance. One should apply to the Ministry for duty and VAT remission through KAM. The application for remission must be supported by:
• An export order or contract for specified export goods or a letter of credit;
• A detailed production plan;• A list of goods to be imported; and• Tariff classification, quantity, value and
amount of duty or VAT to be waived.A security bond will need to be posted covering the taxes and is cancelled only after the reconciliation declaration has been verified and approved by the TREO office and any unused imported goods have been re-exported or duty has been paid.
Source: KLDC, 2015.
33
LEAT
HE
R V
ALU
E C
HA
IN IN
VES
TME
NT
PR
OFI
LE K
EN
YA
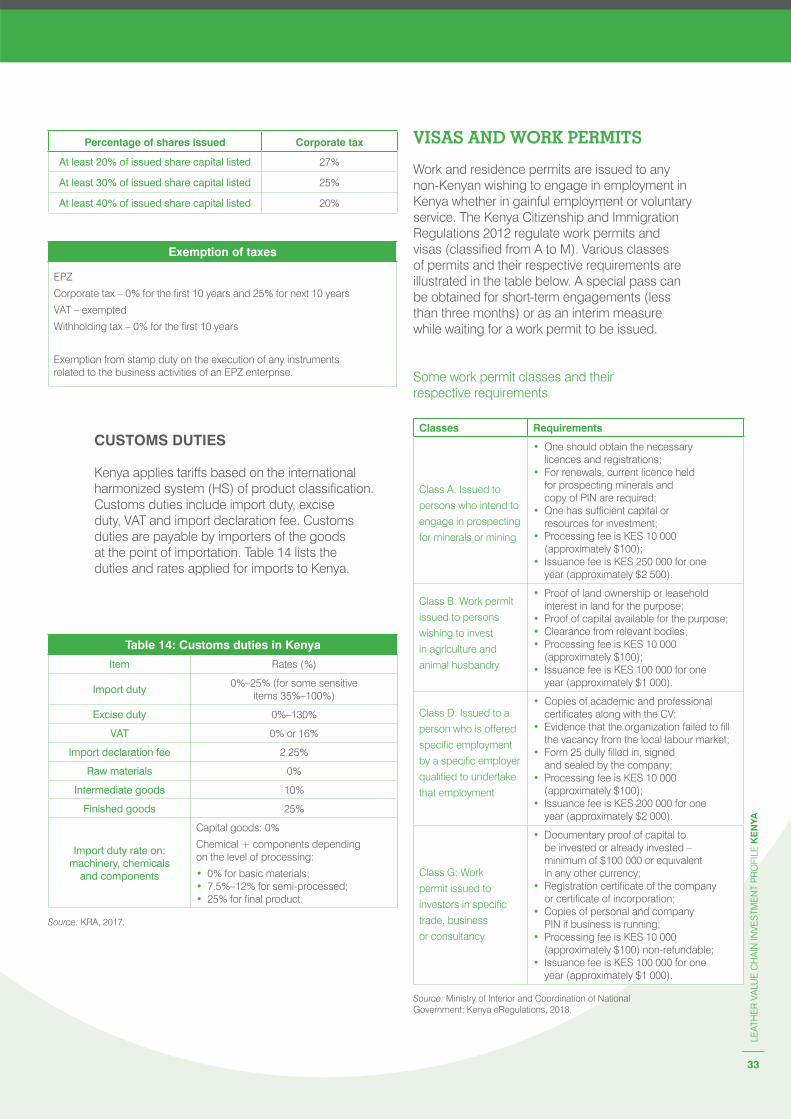
VISAS AND WORK PERMITS
Work and residence permits are issued to any non-Kenyan wishing to engage in employment in Kenya whether in gainful employment or voluntary service. The Kenya Citizenship and Immigration Regulations 2012 regulate work permits and visas ( classified from A to M ). Various classes of permits and their respective requirements are illustrated in the table below. A special pass can be obtained for short-term engagements ( less than three months ) or as an interim measure while waiting for a work permit to be issued.
Some work permit classes and their respective requirements
Classes Requirements
Class A: Issued to
persons who intend to
engage in prospecting
for minerals or mining
• One should obtain the necessary licences and registrations;
• For renewals, current licence held for prospecting minerals and copy of PIN are required;
• One has sufficient capital or resources for investment;
• Processing fee is KES 10 000 ( approximately $ 100 );
• Issuance fee is KES 250 000 for one year ( approximately $ 2 500 ).
Class B: Work permit
issued to persons
wishing to invest
in agriculture and
animal husbandry
• Proof of land ownership or leasehold interest in land for the purpose;
• Proof of capital available for the purpose;• Clearance from relevant bodies;• Processing fee is KES 10 000
( approximately $ 100 );• Issuance fee is KES 100 000 for one
year ( approximately $ 1 000 ).
Class D: Issued to a
person who is offered
specific employment
by a specific employer
qualified to undertake
that employment
• Copies of academic and professional certificates along with the CV;
• Evidence that the organization failed to fill the vacancy from the local labour market;
• Form 25 dully filled in, signed and sealed by the company;
• Processing fee is KES 10 000 ( approximately $ 100 );
• Issuance fee is KES 200 000 for one year ( approximately $ 2 000 ).
Class G: Work
permit issued to
investors in specific
trade, business
or consultancy
• Documentary proof of capital to be invested or already invested – minimum of $ 100 000 or equivalent in any other currency;
• Registration certificate of the company or certificate of incorporation;
• Copies of personal and company PIN if business is running;
• Processing fee is KES 10 000 ( approximately $ 100 ) non-refundable;
• Issuance fee is KES 100 000 for one year ( approximately $ 1 000 ).
Source: Ministry of Interior and Coordination of National Government; Kenya eRegulations, 2018.
Percentage of shares issued Corporate tax
At least 20 % of issued share capital listed 27 %
At least 30 % of issued share capital listed 25 %
At least 40 % of issued share capital listed 20 %
Exemption of taxes
EPZ
Corporate tax – 0 % for the first 10 years and 25 % for next 10 years
VAT – exempted
Withholding tax – 0 % for the first 10 years
Exemption from stamp duty on the execution of any instruments related to the business activities of an EPZ enterprise.
Table 14: Customs duties in Kenya
Item Rates ( % )
Import duty0 %–25 % ( for some sensitive
items 35 %–100 % )
Excise duty 0 %–130 %
VAT 0 % or 16 %
Import declaration fee 2.25 %
Raw materials 0 %
Intermediate goods 10 %
Finished goods 25 %
Import duty rate on: machinery, chemicals
and components
Capital goods: 0 %
Chemical + components depending on the level of processing:
• 0 % for basic materials;• 7.5 %–12 % for semi-processed;• 25 % for final product.
Source: KRA, 2017.
CUSTOMS DUTIES
Kenya applies tariffs based on the international harmonized system ( HS ) of product classification. Customs duties include import duty, excise duty, VAT and import declaration fee. Customs duties are payable by importers of the goods at the point of importation. Table 14 lists the duties and rates applied for imports to Kenya.

(cc)
Mak
e it
Ken
ya
34
LEAT
HE
R V
ALU
E C
HA
IN IN
VES
TME
NT
PR
OFI
LE K
EN
YA
REGISTRATION PROCEDURES FOR COMPANIES
The Companies Act governs the set-up and operation of corporate entities. The exact type of company set-up depends on the company’s nature of operations and plans in Kenya. Any person who wishes to establish a corporate entity in the country is required to submit the necessary documentation, e.g. memorandum and articles of association, and details of directors and shareholders, etc. to the registrar of companies. A foreign company that intends to conduct business in the country can operate either as a company on its own ( subsidiary or branch ) or partner with a local entity ( Figure 15 ). Table 15 describes some regulations concerning the set-up of a foreign-owned company in Kenya.
Figure 15: Forms of foreign company set-ups in Kenya
Source: Writer’s illustration based on Business Sweden Analysis, 2017.
Table 15: Regulations for the establishment of a foreign-owned company in Kenya
Limited liability company ( private and public ) Branch office of a foreign company
Shareholding and capital
• At least one and at most 50 shareholders for private companies. A minimum of seven shareholders for public companies and no limit on the maximum number of shareholders.
• $ 1 000 is the minimum paid-up share capital required in the incorporation process.
• Same shareholder as per foreign country set-up.• Allowed to keep accounting books and pay tax
on everything a part of representation activities.• Allowed to carry out its sales and service
activities via a branch office in Kenya as long as it is registered as a foreign company in terms of the Companies Act.
Number of directors • At least one for private companies ( a natural person ). At least two for public companies.
• Same director as per foreign company set-up. However, at least one local representative should be appointed.
Time-frame• Takes an average of five weeks to obtain
the certificate of incorporation ( CoI ).• In addition to the CoI, public companies are
issued a trading certificate from the Registrar.
• Takes an average of three and a half weeks to obtain the certificate of compliance ( equivalent to the CoI for branch office ).
Sources: Kenya eRegulations, 2018; Business Sweden Analysis, 2017.
REGISTRATION REQUIREMENTS
As established under the Companies Act, the responsibility of the Registrar of Companies entails registering and regulating the operations of all corporate entities in Kenya. The Registrar is also responsible for registering incorporated trusts and business names. Under the Companies Act, companies are required to file annual returns with the Registrar. They are also required to file notice of any changes to the business, including to the corporate status, company name, share capital and directorship. Table 16 and Table 17 give an overview of steps to be taken to register a foreign-owned local company or a branch of a foreign company in Kenya ( companies incorporated outside of Kenya who wish to do business in Kenya ).
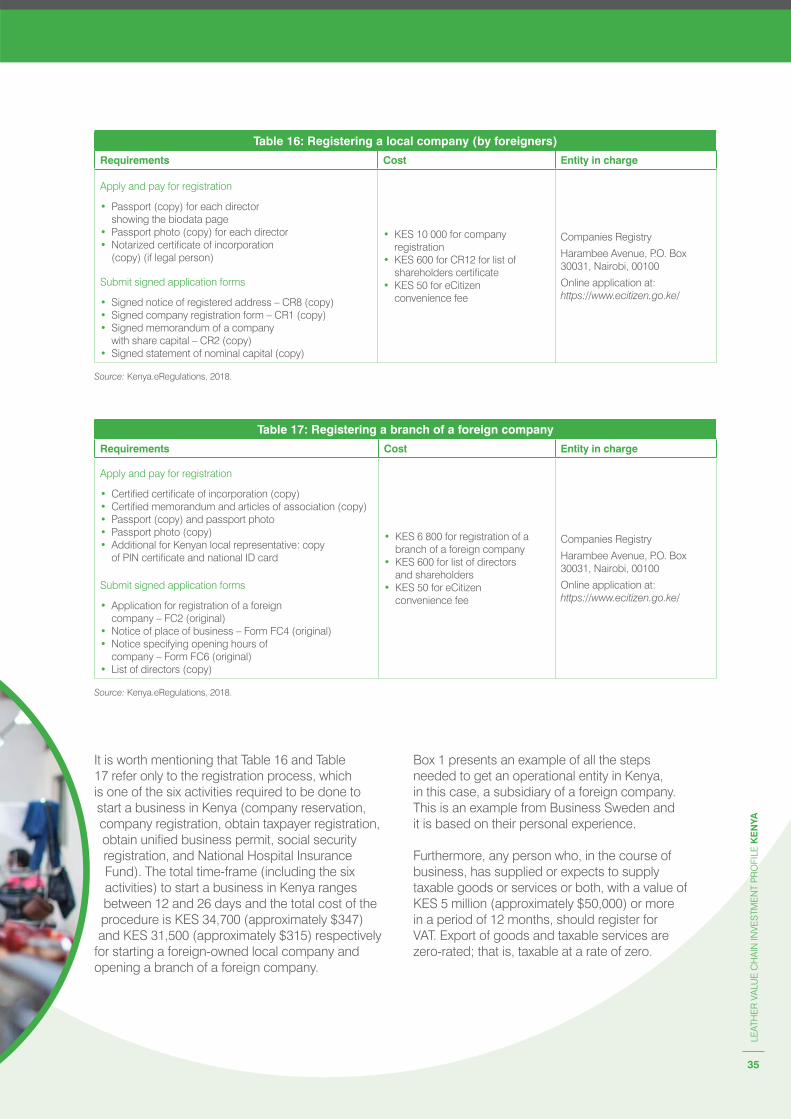
35
LEAT
HE
R V
ALU
E C
HA
IN IN
VES
TME
NT
PR
OFI
LE K
EN
YA
Table 16: Registering a local company ( by foreigners )
Requirements Cost Entity in charge
Apply and pay for registration
• Passport ( copy ) for each director showing the biodata page
• Passport photo ( copy ) for each director• Notarized certificate of incorporation
( copy ) ( if legal person )
Submit signed application forms
• Signed notice of registered address – CR8 ( copy )• Signed company registration form – CR1 ( copy )• Signed memorandum of a company
with share capital – CR2 ( copy )• Signed statement of nominal capital ( copy )
• KES 10 000 for company registration
• KES 600 for CR12 for list of shareholders certificate
• KES 50 for eCitizen convenience fee
Companies Registry
Harambee Avenue, P.O. Box 30031, Nairobi, 00100
Online application at: https://www.ecitizen.go.ke/
Source: Kenya.eRegulations, 2018.
Table 17: Registering a branch of a foreign company
Requirements Cost Entity in charge
Apply and pay for registration
• Certified certificate of incorporation ( copy )• Certified memorandum and articles of association ( copy )• Passport ( copy ) and passport photo• Passport photo ( copy )• Additional for Kenyan local representative: copy
of PIN certificate and national ID card
Submit signed application forms
• Application for registration of a foreign company – FC2 ( original )
• Notice of place of business – Form FC4 ( original )• Notice specifying opening hours of
company – Form FC6 ( original )• List of directors ( copy )
• KES 6 800 for registration of a branch of a foreign company
• KES 600 for list of directors and shareholders
• KES 50 for eCitizen convenience fee
Companies Registry
Harambee Avenue, P.O. Box 30031, Nairobi, 00100
Online application at: https://www.ecitizen.go.ke/
Source: Kenya.eRegulations, 2018.
It is worth mentioning that Table 16 and Table 17 refer only to the registration process, which is one of the six activities required to be done to start a business in Kenya ( company reservation, company registration, obtain taxpayer registration, obtain unified business permit, social security registration, and National Hospital Insurance Fund ). The total time-frame ( including the six activities ) to start a business in Kenya ranges between 12 and 26 days and the total cost of the procedure is KES 34,700 ( approximately $ 347 ) and KES 31,500 ( approximately $ 315 ) respectively
for starting a foreign-owned local company and opening a branch of a foreign company.
Box 1 presents an example of all the steps needed to get an operational entity in Kenya, in this case, a subsidiary of a foreign company. This is an example from Business Sweden and it is based on their personal experience.
Furthermore, any person who, in the course of business, has supplied or expects to supply taxable goods or services or both, with a value of KES 5 million ( approximately $ 50,000 ) or more in a period of 12 months, should register for VAT. Export of goods and taxable services are zero-rated; that is, taxable at a rate of zero.

36
LEAT
HE
R V
ALU
E C
HA
IN IN
VES
TME
NT
PR
OFI
LE K
EN
YA
the remit of the Communication Authority of Kenya. Furthermore, county governments have certain by-laws governing businesses operating in their localities, which establish levies, fees and related charges, as well as business permits.
The Capital Markets Authority ( CMA ) governs the issuance of shares to the public. All companies that intend to list in the Nairobi Securities Exchange ( NSE ) must make an application to the CMA and the NSE.
SECTOR-SPECIFIC RULES
Companies operating in certain sectors of the economy might be required to obtain additional approvals and licences from the relevant regulatory bodies governing them. For instance, banks are regulated by the Central Bank of Kenya ( CBK ) through the Banking Act, and insurance companies are overseen by the Insurance Regulatory Authority through the Insurance Act, while telecommunication companies come under
As a concrete example, the figure below summarizes the main steps required to make a subsidiary operational. However, it is worth noting that this is just a rough estimation. The duration could vary depending on external factors. It is, therefore, advisable to put a margin into account.
Source: Writer’s illustration based on Business Sweden Analysis, 2017.
Box 1: Steps to get an operational entity

37
LEAT
HE
R V
ALU
E C
HA
IN IN
VES
TME
NT
PR
OFI
LE K
EN
YA
the mode of payment and documents to be supplied by the seller to facilitate registration of the transfer of the land to the buyer. At this point, the seller may ask the buyer to pay a 10 % deposit, but it is advisable not to part with a penny until you get clearance from the Land Control Board ( LCB ), which has the final say on land transactions;
� Land Control Board clearance ( LCB ) – this is a forum that comprises area elders and county commissioners and its duty is to ensure that land transactions are conducted in a transparent manner – e.g. stopping a husband from selling family land without the wife’s consent. This costs $ 100. However, instead of waiting for the main LCB meeting, the parties can schedule a special meeting involving the assistant commissioner at a cost of $ 50;
� Transfer and procurement of completion documents – once the payments are made and the seller signs the land transfer forms, the buyer should proceed to the ministry armed with the consent from LCB, land search, clearance from the county, three passport photos, KRA PIN certificate, sale agreement and the old title deed to change the ownership of the land. It takes two weeks and $ 50 to process the new title deed;
� Stamping the transfer – the buyer is required to apply for the valuation of the land by the government value using the valuation form filled in by the seller. The lands officer will use these documents to compute the stamp duty payable. The stamp duty, which should be paid to the Commissioner of Domestic Taxes, is 4 % of the land value for urban areas and 2 % of the land value for the rural areas;
� As of 1 January 2015, stamp duty has been collected concurrently with a 5 % capital gains tax.
BUYING LAND
LAND PURCHASE PROCEDURES
The Kenyan Constitution ( from 2010, together with the Land Act of 2016 and the Land Registration Act of 2012 ) permits foreign investors to acquire land within any county providing they comply with the following procedures of buying and selling land in Kenya. The key steps are as follows:
� Land identification – this is where potential buyers identify land that suits their needs;
� Search at the lands registry – a prospective buyer should obtain a copy of the land title deed from the seller to facilitate the search ( normally, it takes two hours and costs $ 5.20 ). Search results show details of the land, including the registered owner of the land, acreage and any caveats registered against the title deed. A valid search should not be more than six months;
� Search at the county office – the search helps to identify any unpaid land rates, which should be factored into the purchase price. A certificate of clearance from City Hall will cost $ 75, but the fees vary across counties;
� Obtain ( two ) land maps – the maps can be acquired from either the land ministry or the local surveyor at a cost of $ 3 each. One map is normally drawn to scale and the other is an overview of the land showing adjacent plots;
� Ground verification – after obtaining the maps, the buyer visits the land ( together with the seller and the surveyor ) to verify the dimensions. Once this is done, the soon-to-be owner must erect beacons to avoid future disputes;
� Sale agreement – buyers are advised to appoint a lawyer to represent them in the signing of the sale agreement. The agreement, which is usually prepared by the seller’s lawyer, indicates the terms of sale, including the names of the buyer and seller, the price of the land,
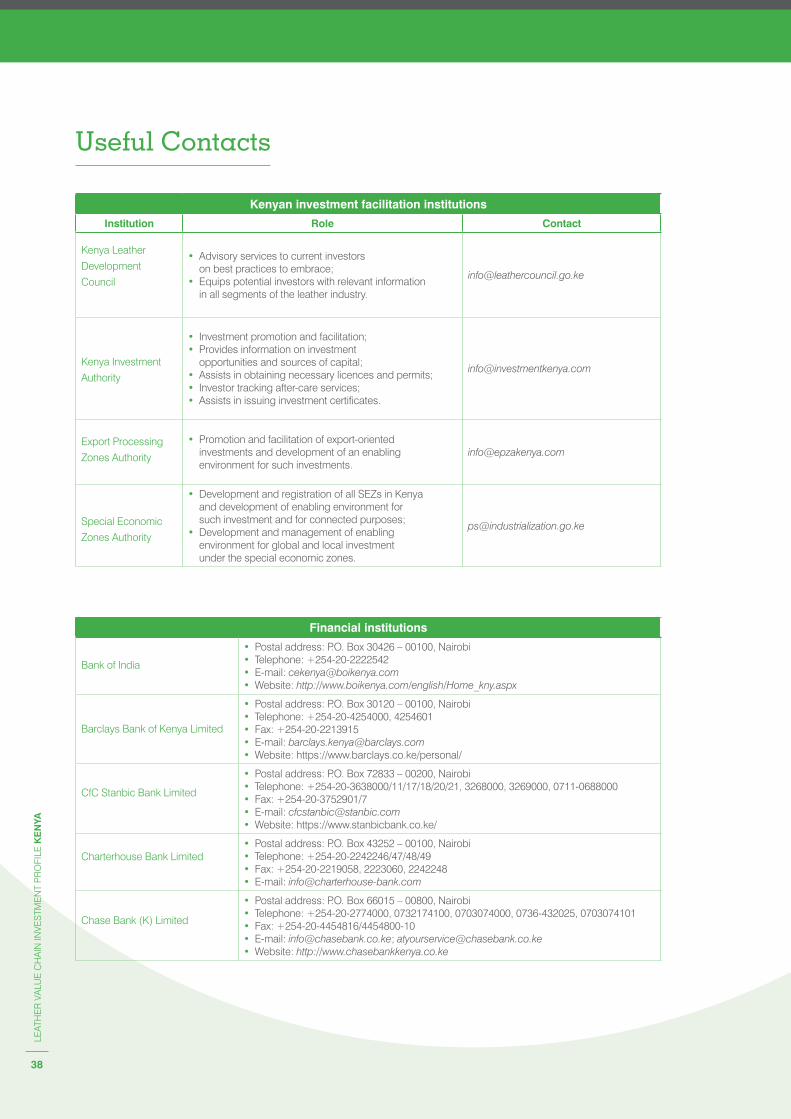
38
LEAT
HE
R V
ALU
E C
HA
IN IN
VES
TME
NT
PR
OFI
LE K
EN
YA
Useful Contacts
Kenyan investment facilitation institutions
Institution Role Contact
Kenya Leather
Development
Council
• Advisory services to current investors on best practices to embrace;
• Equips potential investors with relevant information in all segments of the leather industry.
Kenya Investment
Authority
• Investment promotion and facilitation;• Provides information on investment
opportunities and sources of capital;• Assists in obtaining necessary licences and permits;• Investor tracking after-care services;• Assists in issuing investment certificates.
Export Processing
Zones Authority
• Promotion and facilitation of export-oriented investments and development of an enabling environment for such investments.
Special Economic
Zones Authority
• Development and registration of all SEZs in Kenya and development of enabling environment for such investment and for connected purposes;
• Development and management of enabling environment for global and local investment under the special economic zones.
Financial institutions
Bank of India
• Postal address: P.O. Box 30426 – 00100, Nairobi• Telephone: +254-20-2222542• E-mail: [email protected]• Website: http://www.boikenya.com/english/Home_kny.aspx
Barclays Bank of Kenya Limited
• Postal address: P.O. Box 30120 – 00100, Nairobi• Telephone: +254-20-4254000, 4254601• Fax: +254-20-2213915• E-mail: [email protected]• Website: https://www.barclays.co.ke/personal/
CfC Stanbic Bank Limited
• Postal address: P.O. Box 72833 – 00200, Nairobi• Telephone: +254-20-3638000/11/17/18/20/21, 3268000, 3269000, 0711-0688000• Fax: +254-20-3752901/7• E-mail: [email protected]• Website: https://www.stanbicbank.co.ke/
Charterhouse Bank Limited• Postal address: P.O. Box 43252 – 00100, Nairobi• Telephone: +254-20-2242246/47/48/49• Fax: +254-20-2219058, 2223060, 2242248• E-mail: [email protected]
Chase Bank ( K ) Limited
• Postal address: P.O. Box 66015 – 00800, Nairobi• Telephone: +254-20-2774000, 0732174100, 0703074000, 0736-432025, 0703074101• Fax: +254-20-4454816/4454800-10• E-mail: [email protected]; [email protected]• Website: http://www.chasebankkenya.co.ke

39
LEAT
HE
R V
ALU
E C
HA
IN IN
VES
TME
NT
PR
OFI
LE K
EN
YA
Financial institutions
Citibank N.A. Kenya
• Postal address: P.O. Box 30711 – 00100, Nairobi• Telephone: +254-20-2754000/2711221• Fax: +254-20-2714810/1• E-mail: [email protected]• Website: https://www.citigroup.com/citi/about/countries-and-jurisdictions/kenya.html
Commercial Bank of
Africa Limited
• Postal Address: P. O. Box 30437-00100 Nairobi• Telephone: +254-20-2884000, 2884444, 0711056000,
0732156000, 0734600234, 0732156444• Fax: +254-20-2734599• E-mail: [email protected]• Website: www.cbagroup.com
Consolidated Bank of
Kenya Limited
• Postal address: P.O. Box 51133 – 00200, Nairobi• Telephone: +254-20-340208/340836, 340551, 340298,
340747, 340298, 211950, 0703016000• Fax: +254-20-340836• E-mail: [email protected]• Website: www.consolidated-bank.com
Co-operative Bank of
Kenya Limited
• Postal address: P.O. Box 48231 – 00100, Nairobi• Telephone: +254-20-3276000, 2776000, 0711049000, 0732106000• Fax: +254-20-2245506• E-mail: [email protected]• Website: www.co-opbank.co.ke
Credit Bank Limited
• Postal address: P.O. Box 61064 – 00200, Nairobi• Telephone: +254-20-2222300/2220789/2222317, 2283000, 0728607701, 0738222300• Fax: +254-20-2216700• E-mail: [email protected]• Website: www.creditbank.co.ke
Development Bank of
Kenya Limited
• Postal address: P.O. Box 30483 – 00100, Nairobi• Telephone: +254-20-3340401/2/3, 3340416, 2251082, 3340198, 3340478,
3317449, 3344184, 2250143, 3317449, 3340416 0724253980/1, 0735046336• Fax: +254-20-2250399• E-mail: [email protected]• Website: www.devbank.com
Diamond Trust Bank
Kenya Limited
• Postal address: P.O. Box 61711 – 00200, Nairobi• Telephone: +254-20-2849000, 0732121000, 0719031000, 0732121000, 0719031000• Fax: +254-20-2245495• E-mail: [email protected]• Website: http://www.dtbafrica.com
Ecobank Kenya Limited
• Postal address: P.O. Box 49584 – 00100, Nairobi• Telephone: +254-20-2883000, 4968000, 0719098000• Fax: +254-20-2883304, 2883815• E-mail: [email protected]• Website: www.ecobank.com
Spire Bank Ltd• Postal address: P.O. Box 52467 – 00200, Nairobi• Telephone: +254-20-4981000, 4981202, 4981301, 4981405, 0713600724, 0733333780• E-mail: [email protected]• Website: www.spirebank.co.ke
Equity Bank Kenya Limited
• Postal address: P.O. Box 75104 – 00200, Nairobi• Telephone: +254 20 2262000/2262956/2262828,
0763026000, 07633026956, 0763026828• Fax: +254-020-2737276• E-mail: [email protected]• Website: www.equitybankgroup.com
Family Bank Limited
• Postal address: P.O. Box 74145 – 00200, Nairobi• Telephone: +254-020-3252000, 3318940/2/7, 2244166,
2240601, 0733332300, 0728120444/555• Fax: +254-020-318174• E-mail: [email protected]; [email protected]• Website: www.familybank.co.ke

40
LEAT
HE
R V
ALU
E C
HA
IN IN
VES
TME
NT
PR
OFI
LE K
EN
YA
Financial institutions
First Community Bank Limited
• Postal address: P.O. Box 26219 – 00100, Nairobi• Telephone: +254-20-2843000-3, 07202843000, 0738-407521• Fax: +254-20-344101• E-mail: [email protected]• Website: www.firstcommunitybank.co.ke
Guaranty Trust Bank ( K ) Ltd
• Postal address: P.O. Box 20613 – 00200, Nairobi• Telephone: +254-20-3284000, 073084000• Fax: +254-20-342024• E-mail: [email protected]• Website: www.gtbank.com
Guardian Bank Limited
• Postal address: P.O. Box 67681 – 00200, Nairobi• Telephone: +254-020-2226771, 2226774, 2226341, 2226483, 0722-282213, 0733-888060• Fax: +254-020-2216633• E-mail: [email protected]; [email protected]• Website: www.guardian-bank.com
Gulf African Bank Limited
• Postal address: P.O. Box 43683 – 00100, Nairobi• Telephone: +254-20-2740000, 2718608/9, 2740111, 0711075000• Fax: +254-20-2715655• E-mail: [email protected]• Website: www.gulfafricanbank.com
Habib Bank A.G. Zurich
• Postal address: P.O. Box 30584 – 00100, Nairobi• Telephone: +254 20 310 694• E-mail: [email protected]• Website: www.habibbank.com
Habib Bank Limited
• Postal address: P.O. Box 43157 – 00100, Nairobi• Telephone: +254-20-2226433, 2222786, 2226401/7• Fax: +254-20-2224636, 2214636• E-mail: [email protected]• Website: www.hbl.com
Imperial Bank Limited
• IN RECEIVERSHIP• Postal address: P.O. Box 44905 – 00100, Nairobi• Telephone: +254-20-2874000, 3343416, 0711-019000, 0732-119000• Fax: +254-20-2719705/2719652, 3342374, 2719498• E-mail: [email protected]• Website: www.imperialbank.co.ke
I & M Bank Limited
• Postal address: P.O. Box 30238 – 00100, Nairobi• Telephone: +254-20-3221000, 3271375/27, 0719088000, 0753221000• Fax: +254-20-2711994• E-mail: [email protected]• Website: www.imbank.com
Jamii Bora Bank Limited
• Postal address: P.O. Box 22741 – 00400, Nairobi• Telephone: +254-20- 2224238/9, 2214976, 2219626,
2210338/9, 0722-201112, 0734600682• Fax: +254-20-341825• E-mail: [email protected]• Website: www.jamiiborabank.co.ke
KCB Bank Kenya Limited
• Postal address: P.O. Box 48400 – 00100, Nairobi• Telephone: +254-20-3270000, 2851000, 2852000, 0711012000, 0734108200• Fax: +254-20-2242408’ 2216405• E-mail: [email protected]• Website: www.kcbbankgroup.com
Middle East Bank ( K ) Limited
• Postal address: P.O. Box 47387 – 0100, Nairobi• Telephone: +254-20-2723120/24, 2722879, 2723124, 2723130,
0722-205903, 0733-333441, 0731001310, 0717531448• Fax: +254-20-343776/2256901• E-mail: [email protected]• Website: www.mebkenya.com

41
LEAT
HE
R V
ALU
E C
HA
IN IN
VES
TME
NT
PR
OFI
LE K
EN
YA
Financial institutions
National Bank of Kenya Limited
• Postal address: P.O. Box 72866 – 00200, Nairobi• Telephone: +254-20-2828000, 0711-038000• Fax: +254-20-311444/2223044• E-mail: [email protected]• Website: www.nationalbank.co.ke
NIC Bank Limited
• Postal address: P.O. Box 44599 – 00100, Nairobi• Telephone: +254-20-2888000, 4849000, 0711041000, 0732141000• Fax: +254-20-2888505/13• E-mail: [email protected]• Website: https://www.nic-bank.com/ke/
M-Oriental Bank Limited
• Postal address: P.O. Box 44080 – 00100, Nairobi• Telephone: +254-20-2228461/2, 0734333291, 0722209585• Fax: +254 20 2219469• E-mail: [email protected]• Website: www.moriental.co.ke
Paramount Bank Limited
• Postal address: P.O. Box 14001 – 00800, Nairobi• Telephone: +254-20-4449266/7/8, 446106 /7, 4441528, 4441527,
0723564254, 0734258020, 0728-606652, 0735445506• Fax: +254-20-449265• E-mail: [email protected]• Website: www.paramountbank.co.ke
Prime Bank Limited
• Postal address: P.O. Box 43825 – 00100, Nairobi• Telephone: +254-20-4203000/116/148, 4450810, 0722205491• Fax: +254-20-4451247• E-mail: [email protected]• Website: www.primebank.co.ke
SBM Bank ( Kenya ) Limited • Postal address: P.O. Box 34886 – 00100• Telephone: +254-20-2242348, 2248842, 2244187• Email: [email protected]• Website: https://globalpresence.sbmgroup.mu/sbm-bank-kenya
Sidian Bank Limited
• Postal address: P.O. Box 25363 – 00603, Nairobi• Telephone: +254-20-3906000-7, 0711-058000-7, 0732-158000• Fax: +254-20-3568995• E-mail: [email protected]• Website: www.sidianbank.co.ke
Standard Chartered
Bank Kenya Limited
• Postal address: P.O. Box 30003 – 00100, Nairobi• Telephone: +254-20-3293000, 3293900, 3291000, 3294000,
0719081000, 0732104000, 0703093000• Fax: +254-20-3747880• E-mail: [email protected]• Website: www.standardchartered.com
UBA Kenya Bank Limited
• Postal address: P.O. Box 34154 – 00100, Nairobi• Telephone: +254-020-3612000/1/2• Fax: +: +254-020-3612049, 0726-926367, 0735-500196/180/175• E-mail: [email protected]• Website: https://www.ubagroup.com/countries/ke
Victoria Commercial Bank Limited
• Postal address: P.O. Box 41114 – 00100, Nairobi• Telephone: +254-20-2719499, 2719815, 2710271, 2716108,
2719814.2713208, 2716196, 0721328183• Fax: +254-20-2713778/2715857• E-mail: [email protected]• Website: www.victoriabank.co.ke
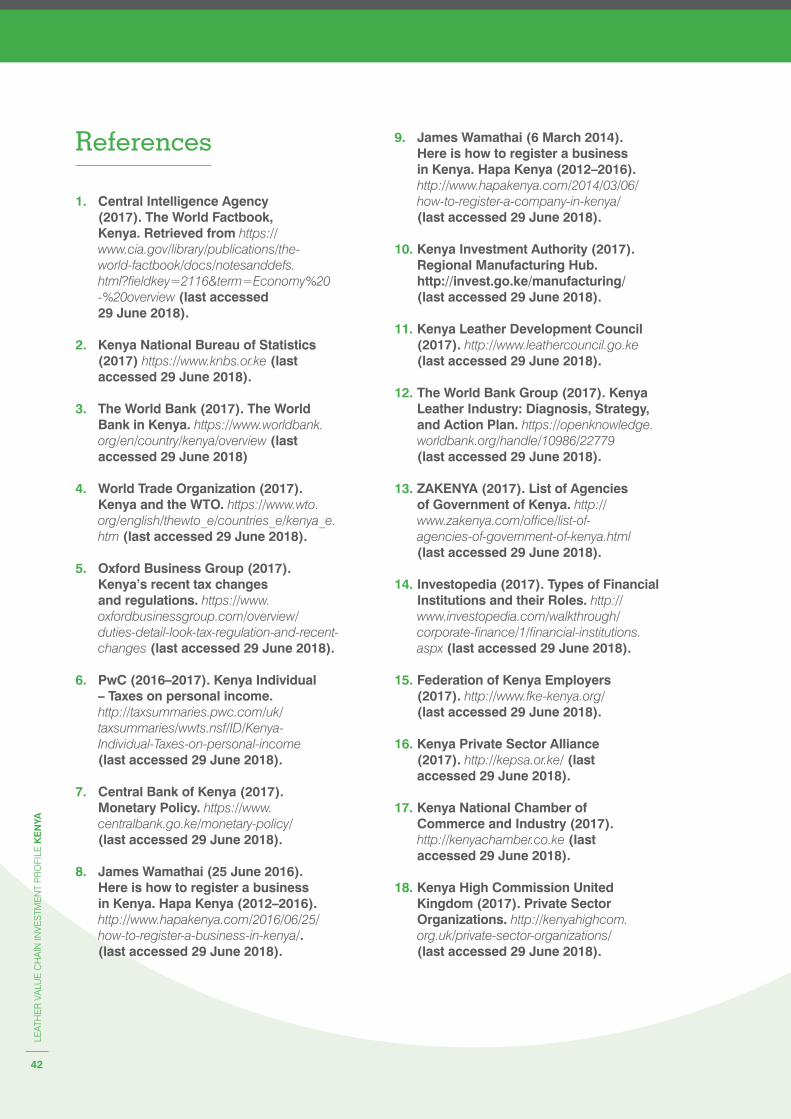
42
LEAT
HE
R V
ALU
E C
HA
IN IN
VES
TME
NT
PR
OFI
LE K
EN
YA
9. James Wamathai ( 6 March 2014 ). Here is how to register a business in Kenya. Hapa Kenya ( 2012–2016 ). http://www.hapakenya.com/2014/03/06/how-to-register-a-company-in-kenya/ ( last accessed 29 June 2018 ).
10. Kenya Investment Authority ( 2017 ). Regional Manufacturing Hub. http://invest.go.ke/manufacturing/ ( last accessed 29 June 2018 ).
11. Kenya Leather Development Council ( 2017 ). http://www.leathercouncil.go.ke ( last accessed 29 June 2018 ).
12. The World Bank Group ( 2017 ). Kenya Leather Industry: Diagnosis, Strategy, and Action Plan. https://openknowledge.worldbank.org/handle/10986/22779 ( last accessed 29 June 2018 ).
13. ZAKENYA ( 2017 ). List of Agencies of Government of Kenya. http://www.zakenya.com/office/list-of-agencies-of-government-of-kenya.html ( last accessed 29 June 2018 ).
14. Investopedia ( 2017 ). Types of Financial Institutions and their Roles. http://www.investopedia.com/walkthrough/corporate-finance/1/financial-institutions.aspx ( last accessed 29 June 2018 ).
15. Federation of Kenya Employers ( 2017 ). http://www.fke-kenya.org/ ( last accessed 29 June 2018 ).
16. Kenya Private Sector Alliance ( 2017 ). http://kepsa.or.ke/ ( last accessed 29 June 2018 ).
17. Kenya National Chamber of Commerce and Industry ( 2017 ). http://kenyachamber.co.ke ( last accessed 29 June 2018 ).
18. Kenya High Commission United Kingdom ( 2017 ). Private Sector Organizations. http://kenyahighcom.org.uk/private-sector-organizations/ ( last accessed 29 June 2018 ).
References
1. Central Intelligence Agency ( 2017 ). The World Factbook, Kenya. Retrieved from https://www.cia.gov/library/publications/the-world-factbook/docs/notesanddefs.html?fieldkey=2116&term=Economy %20- %20overview ( last accessed 29 June 2018 ).
2. Kenya National Bureau of Statistics ( 2017 ) https://www.knbs.or.ke ( last accessed 29 June 2018 ).
3. The World Bank ( 2017 ). The World Bank in Kenya. https://www.worldbank.org/en/country/kenya/overview ( last accessed 29 June 2018 )
4. World Trade Organization ( 2017 ). Kenya and the WTO. https://www.wto.org/english/thewto_e/countries_e/kenya_e.htm ( last accessed 29 June 2018 ).
5. Oxford Business Group ( 2017 ). Kenya’s recent tax changes and regulations. https://www.oxfordbusinessgroup.com/overview/duties-detail-look-tax-regulation-and-recent-changes ( last accessed 29 June 2018 ).
6. PwC ( 2016–2017 ). Kenya Individual – Taxes on personal income. http://taxsummaries.pwc.com/uk/taxsummaries/wwts.nsf/ID/Kenya-Individual-Taxes-on-personal-income ( last accessed 29 June 2018 ).
7. Central Bank of Kenya ( 2017 ). Monetary Policy. https://www.centralbank.go.ke/monetary-policy/ ( last accessed 29 June 2018 ).
8. James Wamathai ( 25 June 2016 ). Here is how to register a business in Kenya. Hapa Kenya ( 2012–2016 ). http://www.hapakenya.com/2016/06/25/how-to-register-a-business-in-kenya/. ( last accessed 29 June 2018 ).
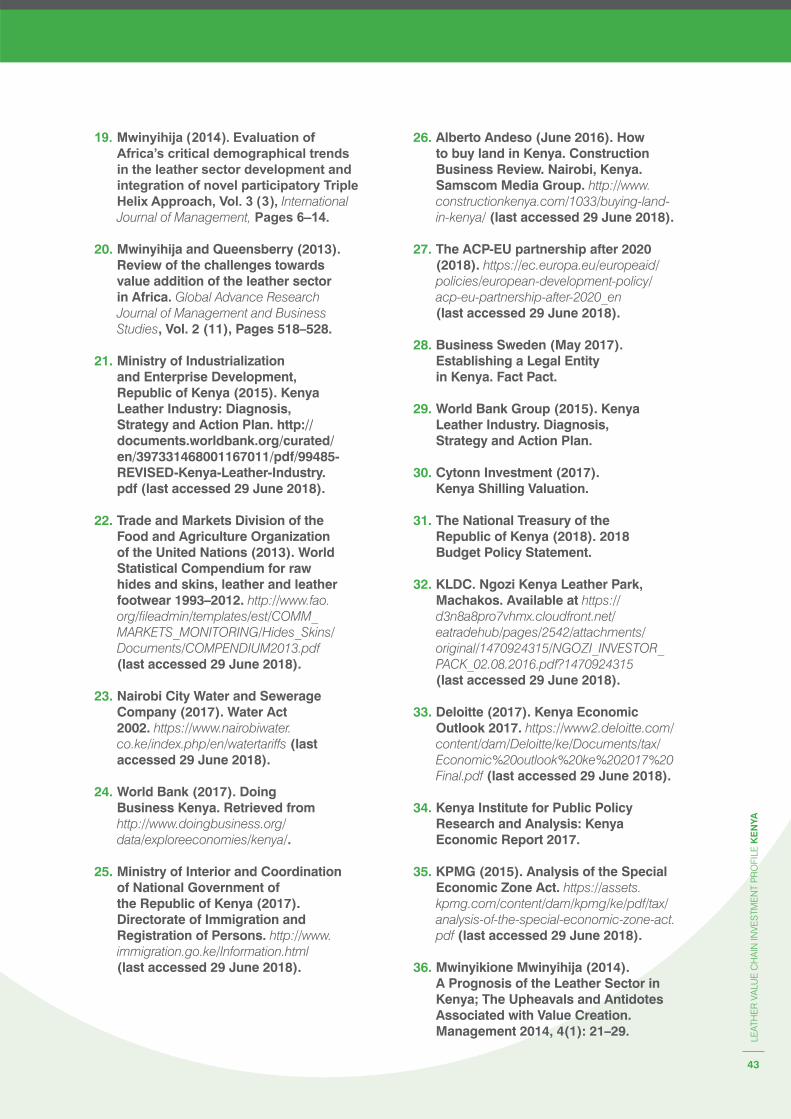
43
LEAT
HE
R V
ALU
E C
HA
IN IN
VES
TME
NT
PR
OFI
LE K
EN
YA
26. Alberto Andeso ( June 2016 ). How to buy land in Kenya. Construction Business Review. Nairobi, Kenya. Samscom Media Group. http://www.constructionkenya.com/1033/buying-land-in-kenya/ ( last accessed 29 June 2018 ).
27. The ACP-EU partnership after 2020 ( 2018 ). https://ec.europa.eu/europeaid/policies/european-development-policy/acp-eu-partnership-after-2020_en ( last accessed 29 June 2018 ).
28. Business Sweden ( May 2017 ). Establishing a Legal Entity in Kenya. Fact Pact.
29. World Bank Group ( 2015 ). Kenya Leather Industry. Diagnosis, Strategy and Action Plan.
30. Cytonn Investment ( 2017 ). Kenya Shilling Valuation.
31. The National Treasury of the Republic of Kenya ( 2018 ). 2018 Budget Policy Statement.
32. KLDC. Ngozi Kenya Leather Park, Machakos. Available at https://d3n8a8pro7vhmx.cloudfront.net/eatradehub/pages/2542/attachments/original/1470924315/NGOZI_INVESTOR_PACK_02.08.2016.pdf?1470924315 ( last accessed 29 June 2018 ).
33. Deloitte ( 2017 ). Kenya Economic Outlook 2017. https://www2.deloitte.com/content/dam/Deloitte/ke/Documents/tax/Economic %20outlook %20ke %202017 %20Final.pdf ( last accessed 29 June 2018 ).
34. Kenya Institute for Public Policy Research and Analysis: Kenya Economic Report 2017.
35. KPMG ( 2015 ). Analysis of the Special Economic Zone Act. https://assets.kpmg.com/content/dam/kpmg/ke/pdf/tax/analysis-of-the-special-economic-zone-act.pdf ( last accessed 29 June 2018 ).
36. Mwinyikione Mwinyihija ( 2014 ). A Prognosis of the Leather Sector in Kenya; The Upheavals and Antidotes Associated with Value Creation. Management 2014, 4( 1 ): 21–29.
19. Mwinyihija ( 2014 ). Evaluation of Africa’s critical demographical trends in the leather sector development and integration of novel participatory Triple Helix Approach, Vol. 3 ( 3 ), International Journal of Management, Pages 6–14.
20. Mwinyihija and Queensberry ( 2013 ). Review of the challenges towards value addition of the leather sector in Africa. Global Advance Research Journal of Management and Business Studies, Vol. 2 ( 11 ), Pages 518–528.
21. Ministry of Industrialization and Enterprise Development, Republic of Kenya ( 2015 ). Kenya Leather Industry: Diagnosis, Strategy and Action Plan. http://documents.worldbank.org/curated/en/397331468001167011/pdf/99485-REVISED-Kenya-Leather-Industry.pdf ( last accessed 29 June 2018 ).
22. Trade and Markets Division of the Food and Agriculture Organization of the United Nations ( 2013 ). World Statistical Compendium for raw hides and skins, leather and leather footwear 1993–2012. http://www.fao.org/fileadmin/templates/est/COMM_MARKETS_MONITORING/Hides_Skins/Documents/COMPENDIUM2013.pdf ( last accessed 29 June 2018 ).
23. Nairobi City Water and Sewerage Company ( 2017 ). Water Act 2002. https://www.nairobiwater.co.ke/index.php/en/watertariffs ( last accessed 29 June 2018 ).
24. World Bank ( 2017 ). Doing Business Kenya. Retrieved from http://www.doingbusiness.org/data/exploreeconomies/kenya/.
25. Ministry of Interior and Coordination of National Government of the Republic of Kenya ( 2017 ). Directorate of Immigration and Registration of Persons. http://www.immigration.go.ke/Information.html ( last accessed 29 June 2018 ).

44
LEAT
HE
R V
ALU
E C
HA
IN IN
VES
TME
NT
PR
OFI
LE K
EN
YA
45. World Bank ( 2018 ). Kenya, Country Overview. http://www.worldbank.org/en/country/kenya/overview ( last accessed 29 June 2018 ).
46. Embassy of Kenya in Rome ( 2017 ). Leather, Hides and Skins Sector in Kenya. https://www.embassyofkenya.it/agric/live/hides ( last accessed 29 June 2018 ).
47. Softkenya ( 2018 ). Banks in Kenya. https://softkenya.com/directory/banks-in-kenya/ ( last accessed 29 June 2018 ).
48. Central Bank of Kenya ( 2017 ). Commercial Banks & Mortgage Finance Shareholding Information. https://www.centralbank.go.ke/commercial-banks/shareholding-information/ ( last accessed 29 June 2018 ).
49. eRegulations Kenya ( 2018 ). Starting a business. KenInvest. https://eregulations.invest.go.ke/menu/1?l=en#smenu139 ( last accessed 29 June 2018 ).
50. Minimum-Wage ( 2018 ). Kenya Minimum Wage, Labor Law, and Employment Data Sheet Kenya Minimum Wage Rate 2018. https://www.minimum-wage.org/international/kenya ( last accessed 2 July 2018 ).
51. Institute of Quantity Surveyors of Kenya ( 2015 ). How much will your building cost to construct in Kenya? Architecture Kenya Media Ltd. http://architecturekenya.com/much-will-building-cost-construct-kenya/ ( last accessed 2 July 2018 ).
37. Trading Economics ( 2018 ). https://tradingeconomics.com/ ( last accessed 29 June 2018 ).
38. Zambia Revenue Authority: International Trade Agreements. A Brief Guide to Importers and Exporters. https://www.zra.org.zm/download.htm?URL_TO_DOWNLOAD=//web_upload//PUB//International %20Agreements22052015093352.pdf ( last accessed 29 June 2018 ).
39. Deloitte ( 2016 ). Kenya, Grounding Africa’s Economic Growth. https://www2.deloitte.com/content/dam/Deloitte/za/Documents/africa/za_Kenya_Report_Formatted.pdf ( last accessed 29 June 2018 ).
40. COMESA Tax Guide ( 2009 ). http://www.comesaria.org/site/en/download.php?id_doc=1 ( last accessed 29 June 2018 ).
41. The Kenya Power & Lighting Co. Ltd. New Power Tariffs. http://www.kplc.co.ke/fileadmin/user_upload/kplc09_files/UserFiles/File/Advert %20- %20KPLC %20New %20Power %20Tariffs.pdf ( last accessed 29 June 2018 ).
42. Export.gov ( 2018 ). Kenya Country Commercial Guide. https://www.export.gov/article?id=Kenya-trade-agreements ( last accessed 29 June 2018 ).
43. Africanews ( 2018 ). Forty-four countries sign historic African Union free trade agreement. http://www.africanews.com/2018/03/21/forty-four-countries-sign-historic-africa-union-free-trade-agreement/ ( last accessed 29 June 2018 ).
44. Ministry of Interior and Coordination of National Government, Republic of Kenya ( 2018 ). Permits and Passes. http://www.immigration.go.ke/Information.html ( last accessed 29 June 2018 ).

45
LEAT
HE
R V
ALU
E C
HA
IN IN
VES
TME
NT
PR
OFI
LE K
EN
YA
© IT
C

© s
hutte
rsto
ck.c
om
SITA project implemented by: SITA project funded by: