least tern dropped prey analyses at alameda point, san ... · least tern dropped prey analyses at...
TRANSCRIPT

Least Tern Dropped Prey Analyses at Alameda Point,
San Francisco Bay, California.
by
Meredith L. Elliott
Marine Ecology Division
PRBO Conservation Science
3820 Cypress Drive, #11
Petaluma, CA 94954
January 11, 2008
Submitted to:
Richard Morat
U. S. Fish and Wildlife Service
2800 Cottage Way, Room W-2605
Sacramento, CA 95825-1846
and
Joelle Buffa
U. S. Fish and Wildlife Service
San Francisco Bay National Wildlife Refuge Complex
9500 Thornton Ave.
Newark, CA 94560
Analyses and reporting funded by FWS Coastal Program at San Francisco Bay

EXECUTIVE SUMMARY
Prey dropped on seabird colonies may be used as an indicator of foraging and diet. Dropped
fish have been collected from the Alameda Point Least Tern colony in most years since 1981,
and findings were compared to California Department of Fish and Game (CDFG) fish trawl data
of Central and South San Francisco Bay; sizes of dropped fish have been collected since 2000,
and these results were compared to sizes of fish found in the Bay. Most of the dropped prey
were jacksmelt (Atherinopsis californiensis), topsmelt (Atherinops affinis), and northern anchovy
(Engraulis mordax). Surfperch species (family Embiotocidae) were also present in the dropped
fish and likely represent fish too large to fit through the gape of a tern chick. Northern
anchovy and jacksmelt were the most common prey species sampled in San Francisco Bay. Fish
dropped at the colony were generally smaller than Bay fish, although terns chose larger fish
than expected during the early part of the breeding season (during courtship and incubation).
The largest dropped prey were found in 2006; this was also found in the Bay fish results and
was probably driven by significantly larger jacksmelt and northern anchovy in the Bay in that
same year. Dropped prey appeared to get smaller as the season progressed, indicating that
adult terns switch from feeding larger fish to their mates to feeding smaller fish to chicks. Intra-
annual Bay fish size results were the opposite, reflecting the growth of the age-0 class fish that
had spawned in the winter and spring months. Selectivity analyses illustrate the importance of
small, pelagic, schooling fishes to Least Terns, particularly northern anchovy, Pacific herring
(Clupea pallasii), and Pacific sardine (Sardinops sagax). Terns also forage on benthic fishes found
in the nearshore environment, such as arrow goby (Clevelandia ios) and cheekspot goby (Ilypnus
gilberti). Despite the large numbers of jacksmelt and topsmelt collected from the Least Tern
colony, results suggest that terns are not selecting these species over northern anchovy.
Northern anchovy, Pacific herring, and Pacific sardine are all relatively high in fat and may be the
preferred prey to terns. However, if these species are not locally available, terns may switch to
catching jacksmelt and topsmelt, as these species may be more abundant near the colony during
the breeding season.
2

TABLE OF CONTENTS EXECUTIVE SUMMARY.................................................................................................................................2
TABLE OF CONTENTS .................................................................................................................................3
TABLES ...............................................................................................................................................................4
FIGURES .............................................................................................................................................................5
INTRODUCTION ...........................................................................................................................................6
METHODS .........................................................................................................................................................7
Least Tern data.............................................................................................................................................................7
Dropped prey collection ..............................................................................................................................................7
CDFG San Francisco Bay prey data .........................................................................................................................8
Size comparisons ....................................................................................................................................................... 10
Species compositions ................................................................................................................................................ 10
RESULTS.......................................................................................................................................................... 11
Dropped prey.............................................................................................................................................................. 11
San Francisco Bay fish .............................................................................................................................................. 12
Colony and Bay comparisons.................................................................................................................................. 13
DISCUSSION.................................................................................................................................................. 14
ACKNOWLEDGMENTS............................................................................................................................. 17
LITERATURE CITED.................................................................................................................................... 19
3

TABLES
Table 1. Definitions of breeding stages, 2000-2006............................................................................... 21
Table 2. San Francisco Bay Monitoring Program sampling months, 1980-2006. ............................. 22
Table 3. Minimum lengths of fish sampled in San Francisco Bay. ........................................................ 23
Table 4. Families and species of fish identified in dropped prey, 1981-2006. .................................. 24
Table 5. Standard lengths and body depths of dropped prey, 2000-2006. ....................................... 26
Table 6. Standard lengths and body depths of dropped prey by breeding stage, 2000-2006....... 27
Table 7. Two-factor ANOVA results for dropped fish sizes, 2000-2006......................................... 28
Table 8. Fish sampled in San Francisco Bay during the Least Tern breeding season (April –
August), 1980-2006. ...................................................................................................................................... 29
Table 9. Lengths of fish sampled with different gear types in San Francisco Bay, April-August,
2000-2006........................................................................................................................................................ 33
Table 10. Lengths of suitably-sized fish sampled with different gear types in San Francisco Bay,
April-August, 2000-2006. ............................................................................................................................. 34
Table 11. Lengths of suitably-sized fish sampled with different gear types in San Francisco Bay
and in different breeding periods, April-August, 2000-2006................................................................ 35
Table 12. Two-factor ANOVA results for Bay fish sizes, 2000-2006................................................ 36
Table 13. Three-factor ANOVA results comparing dropped fish and Bay fish sizes, 2000-2006.
........................................................................................................................................................................... 37
Table 14. Spearman correlations by species between species compositions from dropped fish at
the colony to fish sampled in San Francisco Bay. ................................................................................... 38
Table 15. Spearman correlations by year between species compositions from dropped fish at
the colony to fish sampled in San Francisco Bay. ................................................................................... 39
Table 16. Rank preference indices for fish species. ............................................................................... 40
Table 17. Sizes of northern anchovy and jacksmelt sampled in San Francisco Bay, April-August,
2000-2006........................................................................................................................................................ 41
4

FIGURES
Figure 1. Fish sampling stations of CDFG’s San Francisco Study........................................................ 42
Figure 2. Dropped prey composition by familiy, 1981-2006................................................................ 43
Figures 3. Mean midwater trawl CPUE values of suitably-sized fish, April-August, 1980-2006... 44
Figure 4. Mean otter trawl CPUE values of suitably-sized fish, April-August, 1980-2006............. 45
5

INTRODUCTION
The Least Tern (Sterna antillarum browni) is a federal and state endangered species (Thompson
et al. 1997). The Alameda Point Least Tern colony is the largest colony in California north of
San Luis Obsipo County, and data on population size and breeding success have been collected
since the colony’s inception in 1976 (Elliott et al. 2007). A four-year study on diet and foraging
habits was conducted (2002-2005), which gave some insight into the important prey species of
this colony (Elliott 2005, Ehrler et al. 2006). While diet data have been collected and analyzed,
comparisons of diet to available prey in San Francisco Bay have not been investigated.
San Francisco Bay is the main foraging area for the Alameda Point colony (Bailey 1992, Ehrler et
al. 2006). Data on available prey in San Francisco Bay was obtained from the California
Department of Fish and Game’s (CDFG) San Francisco Bay Study. CDFG has conducted
monthly surveys of fish populations at 35 predetermined locations in San Francisco Bay since
1980, and these data provide insight as to the species composition and sizes of fish available to
the terns over most of the years the colony has presided in Alameda.
The information on Least Tern diet is not as long-standing. While it would be ideal to compare
consumed fish to what fish were available in the Bay, there are only three years of diet data
determined from fecal sample analysis (2002-2004; Elliott 2005). Therefore, data on dropped
prey was chosen for this analysis, as this is the largest diet-related dataset available. Least Terns
drop prey items on the ground of the breeding colony mainly as a result of prey being too large
for mates or chicks, a lack of hunger by the recipient, or the tern dropping the fish in-transit.
There is debate over what dropped prey truly represent. Some argue that many of these fish
are suitable and represent a surplus of food (Palmer 1941), while others point out that dropped
prey are typically larger than consumed prey, especially with regard to the deep-bodied
surfperches (Atwood and Kelly 1984, Robinette et al. 2001). Atwood and Kelly (1984)
concluded that the species composition of dropped prey reflected what Least Terns consumed,
making these fish decent indicators of diet. Dropped fish are whole prey items that can be
identified and measured with relative ease. In addition, collecting dropped prey causes
6

relatively less disturbance to the colony than other methods of diet collection, an important
factor to consider in investigating diet in an endangered species.
METHODS
Least Tern data
Data on tern arrivals to the colony, departures from the colony, and breeding activity were
used to determine the three different phases of breeding in each year: courtship/incubation,
chick-rearing, and fledging (Table 1).
Dropped prey collection
Dropped prey were collected from the ground of the Alameda Least Tern colony by Golden
Gate Audubon Society (GGAS) personnel (1981-1995), and PRBO Conservation Science and
U.S. Fish and Wildlife (USFWS) personnel (2000-2006). GGAS collected prey on an
opportunistic basis, and only numbers of prey species collected in each year are provided
(Collins 1995).
PRBO and USFWS collected prey during standardized type I nest surveys (i.e., surveys
conducted in the breeding area). Type I surveys were generally conducted twice a week
throughout most of the breeding season and once a week towards the end of the breeding
season. We stored specimens in plastic bags labeled with the collection date. The specimens
were later soaked in water, cleaned with a fine artist’s paintbrush, and set out to dry. We
sequentially numbered the dry fish using a fine tip permanent marker. We measured the total
length (from the tip of the snout to the end of the caudal fin), standard length (from the tip of
the snout to the end of the hypural bone), and body depth (the widest part of the fish) of each
specimen to the nearest millimeter. We recorded the dry weight of each fish to the nearest 0.1
gram. Many specimens in each year of this study had only partial caudal fins, showed signs of
tissue loss (due to scavenging or evaporation), or dried in a twisted or bent position.
7

Therefore, average weights are likely underestimates, and length measurements are not exact.
In addition, while many fish and fish parts were collected and saved, we only analyzed whole fish
specimens (i.e., specimens containing a head, body, and caudal peduncle). For the purposes of
comparing these fish to the CDFG San Francisco Bay fish data, the standard lengths from
dropped fish were used (as this measurement is more accurate than total length), and
invertebrates (e.g. Crangon spp.) were dropped from analysis (as these comprised a very small
proportion of dropped prey collections).
Dropped prey composition has been summarized since collections began in 1981. In addition,
analysis of variance (ANOVA) with Bonferroni-adjusted t-tests was used to test for inter- and
intra-annual differences in size of dropped prey from 2000 to 2006.
CDFG San Francisco Bay prey data
Data on fish in San Francisco Bay have been collected since 1980 by the CDFG’s San Francisco
Bay Study. For the purposes of this study, we obtained the midwater trawl and otter trawl data
for Central and South Bay stations, as these are closest to the Alameda tern colony and likely
sample the areas used most frequently by foraging terns (Figure 1). Midwater and otter trawls
were conducted most months, particularly during the months Least Terns are present in the
Bay (April – August); the only exception were the midwater trawls for 1994 (Table 2).
Midwater and otter trawls do not sample areas <3-4 m in depth, or rocky areas or areas
containing eelgrass, so some species (e.g. topsmelt (Atherinops affinis), jacksmelt (Atherinopsis
californiensis), surfperch species (family Embiotocidae), and arrow goby (Clevelandia ios)) are
likely underrepresented in the dataset (Kathy Hieb, CDFG, personal communication).
However, this trawl data provide the best indices of fish abundances for the time period of
interest.
The midwater trawls sample the water column, while the otter trawls sample the bottom. The
midwater trawl net mouth was 3.7 m x 3.7 m (with a 10.7 m2 effective mouth opening), with
mesh graduated in nine sections from 20.3 cm stretch mesh at the mouth to 1.3 cm (0.5 inch)
stretch mesh at the codend. It was towed for 12 minutes obliquely to sample all parts of the
8

water column equally. Flow meter counts were recorded and used to calculate the volume of
water sampled. The otter trawl had a 4.9 m head rope, a 2.5 cm stretch mesh body, and a 0.6
cm (0.25 inch) delta knotless mesh codend. It was towed on the bottom for five minutes.
Distance towed was recorded using a Loran-C or GPS, and was used to calculate the area
sampled, assuming a 70% door spread of 3.4 m.
For each midwater and otter trawl completed, up to 50 individuals of each species were
measured (fork length) and the remainder counted; this subset of length frequency data were
used in size comparisons (see Size Comparisons). The length frequency data recorded were
expanded by the total catch to estimate the total number of fish for each length; this is called
the adjusted frequency. Adjusted frequency numbers for each species were used to calculate
the catch per unit effort (CPUE) values for the size range of interest (see Species
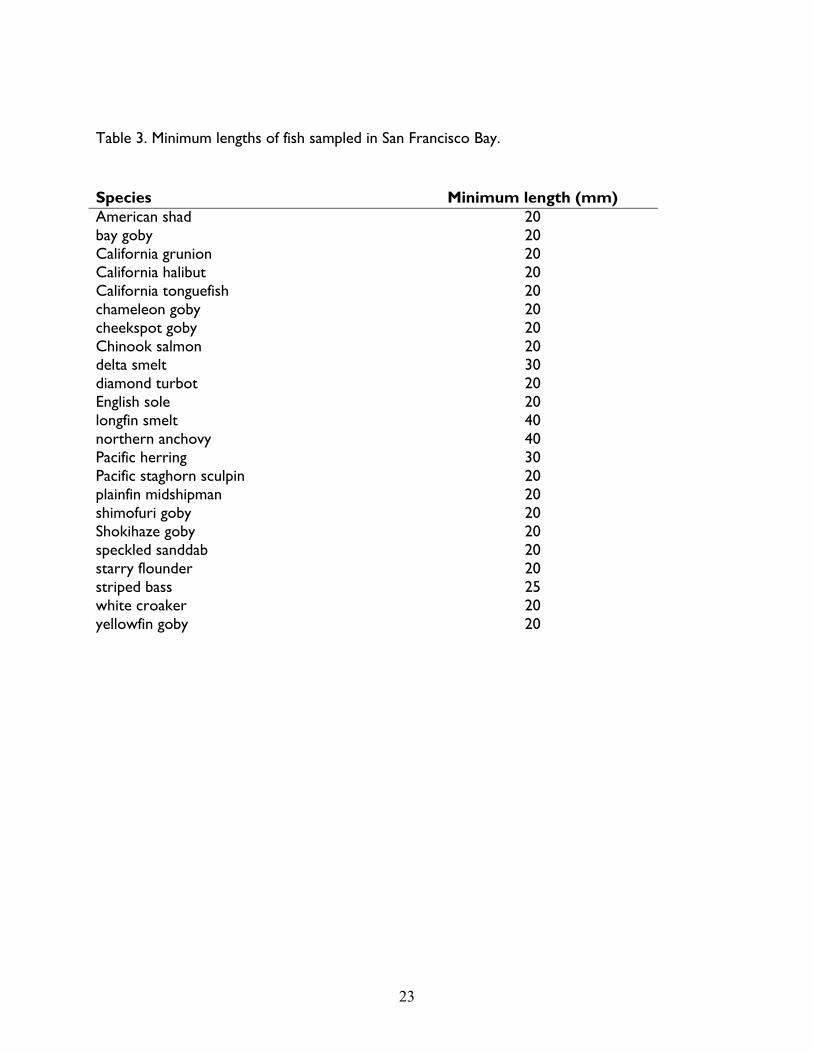
Compositions). In addition, minimum lengths were established for some species in 1984 (Table
3). Specimens below the designated minimum length were either not counted or recorded, or
they were dropped from analyses to be consistent with other years.
For more detailed descriptions of the methods for this study may be found at
http://www.iep.ca.gov/sf_bay_monitor/ .
Bay fish data were standardized to a CPUE of fish per 10,000 m3 for the midwater trawl and fish
per 10,000 m2 for the otter trawl. Each species was evaluated according to its general biology
to determine if the midwater or otter trawl was the most appropriate at sampling that species;
more specifically, fish that were generally pelagic were evaluated using the midwater trawl data,
while demersal fish were evaluated using the otter trawl data. Since Least Terns are small birds
and are known to consume small fish (Elliott 2005, Thompson et al. 1997, Atwood and Minsky
1983), CPUE values were calculated by determining the numbers of suitably-sized fish caught in
each tow. Based on Elliott (2005), fish less than or equal to 100 mm in length were deemed of
suitable size for the terns. This maximum length was applied to all fish except surfperches
(family Embiotocidae); these fish are deep-bodied and their body depth cannot exceed the gape
width of the tern (Hulsman 1981, Atwood and Kelly 1984, Zuria and Mellink 2005, Thompson
et al. 1997). Based on surfperch length and body depth data recorded on dropped fish, we
9

determined the maximum length of surfperches to be 50 mm. Inter- and intra-annual sizes in
fish were analyzed with ANOVA (and Bonferroni-adjusted t-tests).
Least Terns are present in the San Francisco Bay area from April through August (Collins 2000,
Elliott and Sydeman 2001, Elliott and Sydeman 2002, Hurt 2003, Hurt 2006); therefore, only
tows conducted in these months were used in the analyses.
Size comparisons
The standard lengths of dropped fish at the colony and the fork lengths of fish sampled in the
Bay were compared for 2000-2006. While standard length is shorter than fork length, there is
typically only a few millimeters difference in these two measurements. Length frequency data
for all fish sampled in the Bay were summarized; however, analyses were performed on only
the suitably-sized fish.
Species compositions
I investigated species compositions by comparing proportions of fish species collected from the
colony in each year and mean CPUE values for species sampled in the Bay. For Bay fish sampled
just prior to the arrival of terns or just after their departure, these data were assigned to the
nearest breeding period within that year. Spearman correlations were calculated for species and
years to see if colony and Bay fish varied similarly. In addition, rank preference indices were
calculated for species found in both the dropped prey and the Bay. In this procedure, ranks for
both usage and availability of a resource are calculated, and the difference (i.e., usage-availability)
is used in determining whether a resource is preferred (positive value), avoided (negative
value), or neutral (zero value; Johnson 1980).
10
RESULTS
Dropped prey
There were 19 families and 34 species of fish identified in dropped prey samples since 1981
(Table 4). Most of the fish collected were jacksmelt, northern anchovy (Engraulis mordax), and
topsmelt (Table 4). When condensing the dropped prey to the family level, there were
variations in composition and diversity of prey through the years; families Atherinopsidae,
Engraulidae, and Embiotocidae dominated most collections, representing 57.5%, 19.7%, and
11.0%, respectively, of all dropped prey samples (Figure 2).
The largest mean length and body depth of dropped fish were observed in 2006 (Table 5). A
summary of fish sizes by breeding stage showed that the largest fish were collected in the
courtship/incubation period, followed by the chick-rearing period, and the smallest fish
collected during the fledging period (Table 6). However, this pattern was not similar in each
individual year. The size of fish collected in the courtship/incubation period in 2006 were similar
to the sizes of fish collected during chick-rearing (Table 6). Also, fish collected in the fledging
stage were larger than the chick-rearing fish in 2000, 2001, and 2003 (Table 6).
Significant differences in the lengths of dropped prey were found when considering both year
and breeding stage (Table 7). The significant interaction term (year*breeding stage) indicated
that sizes of dropped prey did not vary similarly in each breeding stage in each year. An
examination of each year revealed that fish collected in the courtship/incubation stage were
significantly larger than chick-rearing fish in 2001 (ANOVA: F2,1768=19.66, p<0.001; Bonferroni-
adjusted t-test: p<0.001), 2002 (ANOVA: F2,1120=40.32, p<0.001; Bonferroni-adjusted t-test:
p<0.001), 2003 (ANOVA: F2,1727=26.32, p<0.001; Bonferroni-adjusted t-test: p<0.001), 2004
(ANOVA: F2,1847=39.80, p<0.001; Bonferroni-adjusted t-test: p<0.001), and 2005
(ANOVA:F2,2280=53.93, p<0.001; Bonferroni-adjusted t-test: p<0.001). Courtship fish were
significantly larger than fledging fish in 2002 (Bonferroni-adjusted t-test: p<0.001), 2003
(Bonferroni-adjusted t-test: p<0.001), 2004 (Bonferroni-adjusted t-test: p<0.001), 2005
11

(Bonferroni-adjusted t-test: p<0.001), and 2006 (ANOVA: F2,846=23.69, p<0.001; Bonferroni-
adjusted t-test: p<0.001). Chick-rearing fish were significantly larger than fledging fish in 2002
(Bonferroni-adjusted t-test: p<0.001), 2005 (Bonferroni-adjusted t-test: p<0.001), and 2006
(Bonferroni-adjusted t-test: p<0.001). Fish recovered in the fledging period were significantly
larger than chick-rearing fish in 2001 (Bonferroni-adjusted t-test: p<0.001) and 2003
(Bonferroni-adjusted t-test: p=0.039).
San Francisco Bay fish
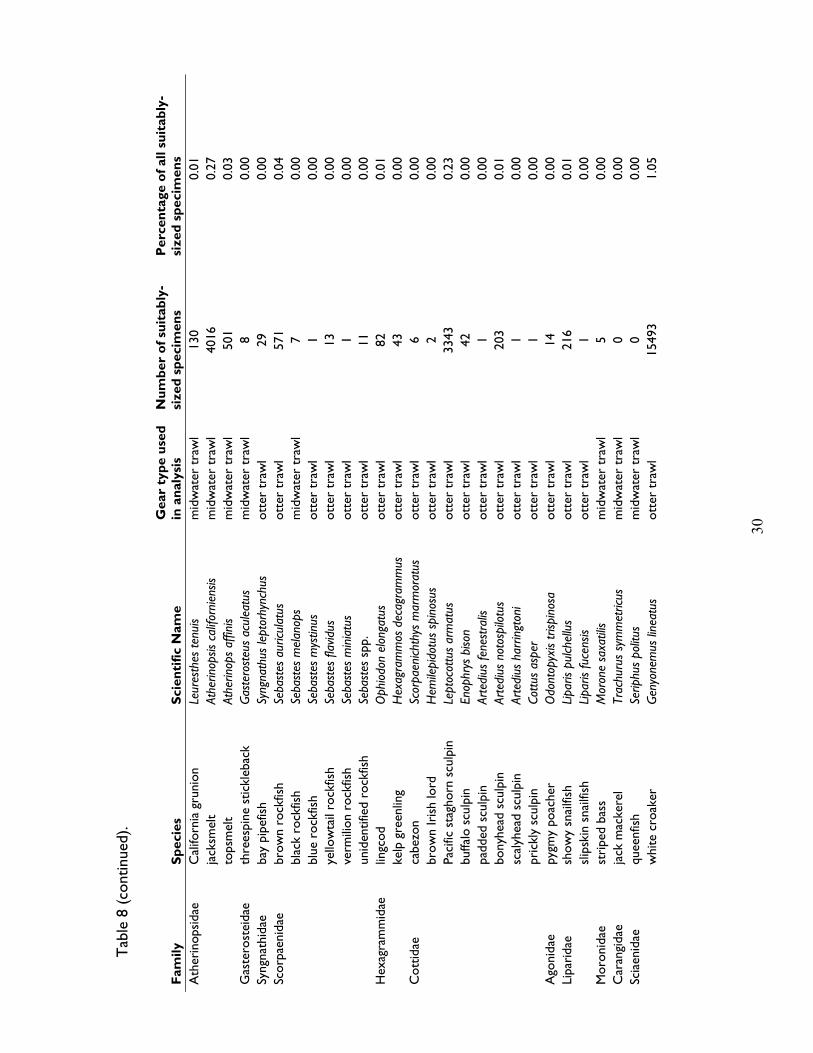
Out of the 46 families and 107 species of fish identified in the midwater and otter trawl tows
since 1980, there were 40 families and 93 species of fish captured during the Least Tern
breeding season (April – August; Table 8). Of these, 26 families and 68 species were found to
be of suitable-size to Least Terns (Table 8). Trends in species composition differed by species
(Figures 3 and 4). Some species displayed an apparent decline (e.g. Pacific herring (Clupea
pallasii); Figure 3b), strong abundance peaks (e.g. white croaker (Genyonemus lineatus), Figure 4b;
Pacific sand lance (Ammodytes hexapterus), Figure 4d), relatively high abundances compared to
the other species (e.g. northern anchovy, Figure 3a; bay goby (Lepidogobius lepidus), Figure 4a),
relatively low abundances (e.g. threespine stickleback (Gasterosteus aculeatus), Figure 3d), and
some only appeared in recent years (e.g. California grunion (Leuresthes tenuis); Figure 3c).
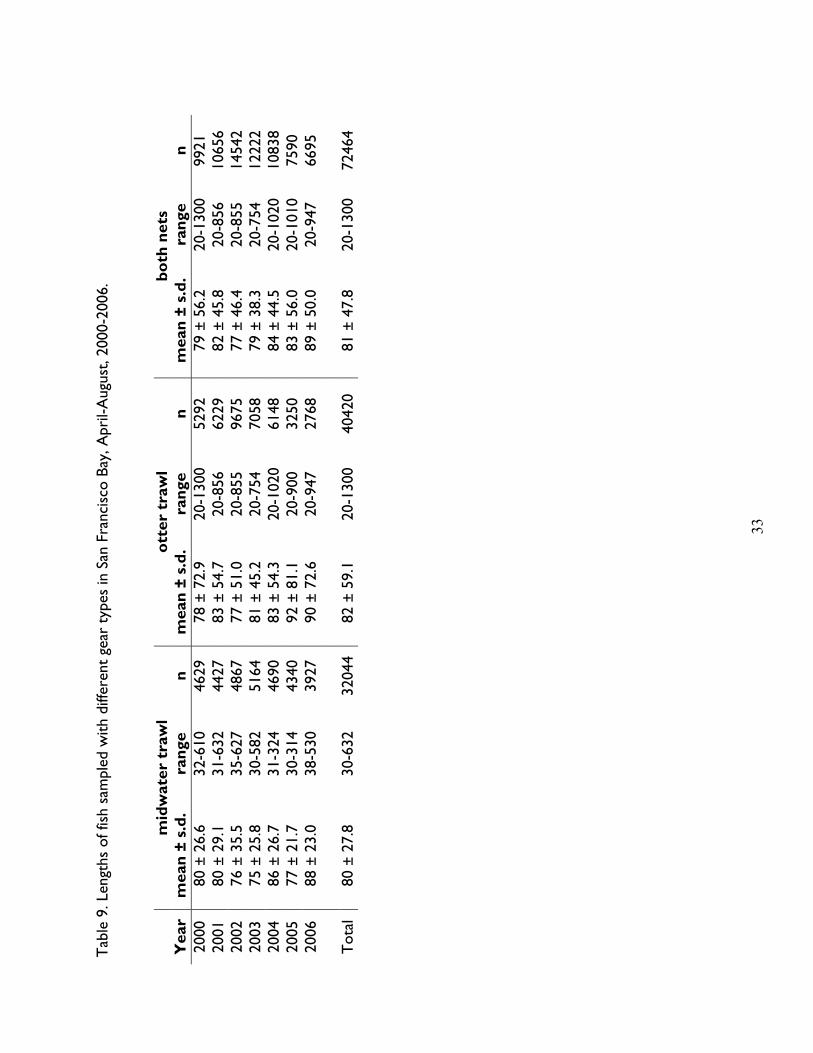
The length of prey varied among years (Table 9). The range in the sizes of fish caught goes well
beyond what Least Terns are capable of capturing and eating. When restricting the Bay fish data
to only the fish suitably-sized for Least Terns, size differed between years, with the largest fish
sampled in 2006 (Table 10). Intra-annual fish sizes showed a general trend of increasing size as
each season progressed (Table 11).
Statistical results showed significant differences in sizes of fish sampled when considering year
and breeding stage (Table 12). Similar to the dropped fish results, the significant interaction
term (year*breeding stage) signified varying results, which prompted analyses by year. Fish
sampled during the courtship/incubation stage were significantly smaller than chick-rearing fish
in 2000 (ANOVA: F2,8351=217.06, p<0.001; Bonferroni-adjusted t-test: p=0.040), 2001 (ANOVA:
12
F2,8114=250.00, p<0.001; Bonferroni-adjusted t-test: p<0.001), 2002 (ANOVA: F2,11877=532.17,
p<0.001; Bonferroni-adjusted t-test: p<0.001), 2003 (ANOVA: F2,10158=371.90, p<0.001;
Bonferroni-adjusted t-test: p<0.001), 2004 (ANOVA: F2,8211=113.44, p<0.001; Bonferroni-
adjusted t-test: p<0.001), and 2005 (ANOVA: F2,6372=82.75, p<0.001; Bonferroni-adjusted t-test:
p<0.001). Bay fish sampled during the chick-rearing period were significantly smaller than fish
sampled in the fledging period in all years (ANOVA (2006): F2,5435=103.19, p<0.001; Bonferroni-
adjusted t-test: p<0.001; Bonferroni-adjusted t-tests for 2000-2004: p<0.001; Bonferroni-
adjusted t-test for 2005: p=0.048).
Colony and Bay comparisons
The size of suitably-sized fish from the Bay varied significantly from the colony fish when
factoring in year and breeding stage (Table 13). Again, the significant interaction terms led to
investigating each year individually. Bay fish were significantly larger than colony fish in 2001
(ANOVA: F1,9886=17.03, p<0.001), 2003 (ANOVA: F1,11889=504.81, p<0.001), 2004 (ANOVA:
F1,10062=401.66, p<0.001), 2005 (ANOVA: F1,8656=631.44, p<0.001), and 2006 (ANOVA:
F1,6285=75.75, p<0.001). When examining the courtship/incubation period in each year, dropped
fish at the colony were significantly larger than Bay fish in 2002 (ANOVA: F1,5040=59.16,
p<0.001), 2003 (ANOVA: F1,1540=23.15, p<0.001), and 2004 (ANOVA: F1,2603=7.94, p=0.0049).
During the chick-rearing period, fish sampled in the Bay were significantly larger than colony
fish in 2001 (ANOVA: F1,2163=16.48, p=0.0001), 2003 (ANOVA: F1,4207=313.29, p<0.001), 2004
(ANOVA: F1,2778=175.14, p<0.001), 2005 (ANOVA: F1,1548=83.95, p<0.001), and 2006 (ANOVA:
F1,1643=5.19, p=0.0228). Similar to the chick-rearing stage, Bay fish were significantly larger than
colony fish in the fledging stage of every year (ANOVA results: 2000: F1,3786=36.68, p<0.001;
2001: F1,4827=217.90, p<0.001; 2002: F1,5215=199.17, p<0.001; 2003: F1,6138=502.76, p<0.001; 2004:
F1,4677=628.39, p<0.001; 2005: F1,4650=966.90, p<0.001; 2006: F1,2275=159.07, p<0.001).
When comparing species compositions between the colony and the Bay, 8 species had positive
significant correlations and 2 species had near-significant correlations (Table 14). Comparisons
by year showed 12 positive significant years and 2 near-significant years of the midwater trawl
data, and one positive and one negative near-significant correlations in otter trawls (Table 15).
13
Rank preference indices showed terns preferred 12 species, avoided 13 species, and neutral
towards 2 species (Table 16).
DISCUSSION
Most of the fish collected from the Least Tern breeding area were Atherinopsids (mainly
jacksmelt and topsmelt), northern anchovy, and surfperch species (family Embiotocidae).
Jacksmelt, topsmelt and northern anchovy are all pelagic, schooling fishes that can presumably
be spotted by Least Terns from the air; these species are also the main fish consumed by Least
Terns (Elliott 2005). Northern anchovy is the most abundant fish species in San Francisco Bay
(Baxter et al. 1999), and while their abundance in the Bay has varied from year to year (Figure
3a), it is more abundant than the other pelagic, schooling, slender-bodied species. While less
abundant than northern anchovy, jacksmelt is a fairly common fish of suitable-size sampled in
the Bay, even given that it is likely underrepresented. The Embiotocids are likely
overrepresented in the dropped fish samples; they are deep-bodied fish that are often unable to
fit through the gape of a tern chick (Hulsman 1981, Atwood and Kelly 1984). For the purposes
of this report, a tern gape width was defined as 15 mm (Atwood and Kelly 1984), but Zuria and
Mellink (2005) reported mean gape widths of 11.2 mm (adults), 7.2 mm (smaller chicks), and 9.1
mm (larger chicks). The mean body depth of 18 ± 3.6 mm (range=7-27, n=701) in surfperches
dropped at the colony is larger than the most conservative gape estimate, and it is more than
twice the gape width of small chicks. Therefore, the dropped surfperches are too large for
chicks (as well as most adults).
The mean length of 63 mm in dropped prey (Table 5) is larger than the mean length of
consumed prey (60 mm; Elliott 2005), suggesting that dropped fish represent fish that may be
too large to eat. The largest dropped prey were found in 2006, and the largest fish were also
sampled in the Bay in 2006. This may be driven by the presence of relatively large northern
anchovy and jacksmelt sampled during the Least Tern breeding season in that year (Table 17).
Dropped prey were significantly smaller than suitably-sized Bay fish in five of the seven years
14

analyzed. Some dropped fish (e.g. northern anchovy) are smaller than the minimum lengths used
by CDFG, so this may have affected results.
Intra-annual patterns in dropped prey size were somewhat unexpected. The literature on
different tern species shows that adults switch from bringing larger prey (for courtship and
incubating females) to smaller fish (for chicks; Atwood and Kelly 1984, Shealer 1998). While we
saw smaller fish in the chick-rearing period compared to the courtship stage in five of the seven
years studied, the fledging stage revealed even smaller fish in three of the years studied. I might
have expected to see slightly larger fish during the fledging period, as chicks are larger at this
time and capable of handling larger fish, and the fish in the Bay are larger at this time as well; yet
only two years showed larger fish in the fledging period, and observations of feedings at the
Alameda colony confirm that fledglings receive larger fish than smaller chicks (PRBO,
unpublished data). However, the breeding stage designations are rough estimates of breeding
phenology at the colony and do not necessarily reflect what may be occurring at the colony.
For instance, there may be many smaller chicks in the colony during the fledging period (due to
re-nesting or late nesting), which may explain why smaller fish are being collected. In addition,
fledglings may be receiving more feedings from parents on the surrounding tarmac areas or by
the shores of the Bay, so many of the dropped feedings of fledglings may not be collected
during the nest surveys in the colony. It is interesting to note that while dropped fish sizes
decrease as the season progresses, the opposite is true of Bay fish and the sizes of fish
consumed by Least Terns (Elliott 2005). I would expect Bay fish sizes to increase, as this
reflects the growth of the age-0 class fish that were spawned in the winter and spring months
(Baxter et al. 1999). The intra-annual colony and Bay fish size comparisons illustrate the switch
to foraging for appropriately-sized fish: dropped fish were larger than Bay fish during
courtship/incubation, and then Bay fish were larger than dropped fish for the remainder of the
season (when chicks and fledglings were present).
Correlations between species compositions of dropped prey and Bay fish give more insight into
the relationship between tern foraging and prey abundance and availability. The slender-bodied,
pelagic schooling fish (northern anchovy, Pacific herring, and Pacific sardine (Sardinops sagax)), as
well as fish inhabiting the nearshore environment (California grunion, arrow goby, cheekspot
15

goby (Ilypnus gilberti), and yellowfin goby (Acanthogobius flavimanus)), appear to be the significant
positive findings, indicating that terns may be choosing these species in accordance with their
availability. White croaker, bay goby, and brown rockfish (Sebastes auriculatus) are generally
demersal or benthopelagic species that are not necessarily found in nearshore habitats; these
species may have been made locally available in nearshore environments (e.g., during ebb tide).
Not surprisingly, other demersal fish (e.g. English sole (Parophrys vetulus), Pacific staghorn
sculpin (Leptocottus armatus)) and surfperch species showed no significant results with colony
fish. However, jacksmelt—the most abundant species collected at the colony—had a non-
significant negative relationship, as well as topsmelt (another important dropped fish); this may
be due to underrepresentation in the Bay fish trawls due to sampling methods. The correlations
by year also illustrate how midwater trawls sample the fish utilized by terns. Also, when
examining only the midwater trawls, Bay fish species compositions and dropped fish
compositions varied in similar ways in most years. This lends more evidence that the dropped
fish indicate changes in availability and abundance of species in San Francisco Bay.
The rank preference indices tell a somewhat different story. There appear to be preferences
toward the same slender-bodied pelagic species (northern anchovy, Pacific herring, and Pacific
sardine) and some benthic, nearshore species (cheekspot goby, bay goby, white croaker).
However, these values indicate that terns avoid jacksmelt and topsmelt, meaning their relative
abundance in the environment is large compared to their relative importance in the diet (or in
this case, in the dropped prey collections). If jacksmelt and topsmelt are truly underrepresented
in Bay trawl surveys, then their true availability in the environment would be even larger than
what is reflected here, and their true rank preference indices would show an even stronger
avoidance. It is possible that jacksmelt and topsmelt are underrepresented in the dropped fish
samples; they may be eaten more often and/or be less likely to be too large for consumption. In
addition, our classification of suitably-sized prey may actually include fish that are too large for
terns, making the CPUE calculations erroneously high and creating significant findings where
there may not be any (or vice versa). This may be the case for fish other than surfperches that
may have body depth limitations to consider (e.g., flatfishes), but data to calculate minimum
sizes were not available for this investigation. Therefore, these correlation and rank preference
indices should be viewed with caution, as they may not reflect selectivity accurately.
16

Despite the shortcomings of the selectivity analyses, northern anchovy, Pacific herring, and, to a
lesser extent, Pacific sardine are consistently shown to be important prey items to the Least
Terns. These are high-caloric species, making good meals for growing tern chicks, and positive
relationships between anchovy abundance in the dropped prey and reproductive success of the
Alameda Least Tern colony have already been shown (Elliott et al. 2007). Elegant Tern (Sterna
elegans) chicks fed anchovies (the high energy content food) showed a faster gain of body mass
and wing length, and had higher lipid reserves than chicks fed topsmelt (the low energy content
food; Dahdul and Horn 2003). The authors deduced that a tern colony that had to switch from
a high-energy food item (e.g. anchovy) to a low-energy food item (i.e. topsmelt) may produce
underweight fledglings with less fat reserves, and parents may have to increase provisioning to
chicks, thereby leading to decreased survival and reproductive success. Terns are opportunistic
foragers and generally stay within just a few miles of the breeding colony to catch their prey
(Atwood and Minsky 1983), so terns may be taking jacksmelt in large numbers as they are more
readily available and found closer to the colony than the preferred northern anchovy or Pacific
herring.
It is difficult to say what we can or cannot conclude about the dropped fish. Northern anchovy
are important, yet they are the second most common fish in the dropped fish collections. The
results on jacksmelt are less clear; this is the most abundant fish dropped at the colony and
their abundances at the colony do not match the trawl abundances. This could be due to
underrpresentation in the trawl data, or it could be a less desirable fish that is more abundant
near the colony and makes an easy fish to catch and bring back to the chick.
ACKNOWLEDGMENTS I would like to thank Kathy Hieb (CDFG) for providing the San Francisco Bay fish data and
giving suggestions on the analyses; these data were collected by the Interagency Program for
the San Francisco Estuary and the CDFG’s San Francisco Bay study. Rachel Hurt, Susan Euing
and Joelle Buffa (USFWS) provided breeding data on the Alameda Point Least Tern colony;
Rachel, Susan, other Refuge staff and interns collected dropped fish during in-colony
reproductive surveys in 2002-2006. I also thank Richard Morat and the FWS Coastal Program
17

at San Francisco Bay for contributing funding to conduct these analyses. Jennifer Roth (PRBO)
provided additional input into this report. In 2002-2005, dropped fish were collected during the
Least Tern foraging study for the Oakland Harbor deepening project (Ehrler et al. 2006) under
contract/subcontract with Tetra Tech, Inc.; data were collected under prime contract
DACW07-02-F-0028 (2002 - 2003), subcontract 2004-03/GS-10F-0268K (2004), and
subcontract 2005-21/GS-10F-0268K (2005).
This is PRBO Contribution Number 1613.
18
LITERATURE CITED
Atwood, J. L. and P. R. Kelly. 1984. Fish dropped on breeding colonies as indicators of Least Tern food habits. Wilson Bulletin 96: 34-47. Atwood, J. L. and D. E. Minsky. 1983. Least Tern foraging ecology at three major California breeding colonies. Western Birds 14: 57-71. Bailey, S. F. 1992. California Least Tern foraging and other off-colony activities around Alameda Naval Air Station during 1991. Unpublished Report, Dept. of Ornithology and Mammalogy, California Academy of Sciences. Baxter, R., K. Hieb, S. DeLeón, K. Fleming and J. Orsi. 1999. Report on the 1980-1995 fish, shrimp, and crab sampling in the San Francisco estuary, California. Prepared for the Interagency Ecological Program for the Sacramento-San Joaquin Estuary, California Department of Fish and Game, Technical Report 63. Collins, L. D. 1995. California Least Tern nesting season at the Alameda Naval Air Station, 1995. Unpublished report prepared for Western Division, Naval Facilities Engineering Command. Collins, L. D. 2000. California Least Tern monitoring report for 1999 at the Naval Air Station, Alameda. Unpublished report prepared for Engineering Field Activity West, Naval Facilities Engineering Command. Dahdul, W. M. and M. H. Horn. 2003. Energy allocation and postnatal growth in captive Elegant Tern (Sterna elegans) chicks: responses to high- versus low-energy diets. Auk 120(4): 1069-1081. Ehrler, C. P., M. L. Elliott, J. E. Roth, J. R. Steinbeck, A. K. Miller, W. J. Sydeman, and A. M. Zoidis. 2006. Oakland Harbor Deepening Project (-50’): Least Tern, Fish, and Plume Monitoring. Project Year 2005 and Four-Year Final Monitoring Report. Tetra Tech, Inc., San Francisco, California. July 2006. Elliott, M.L. and W.J. Sydeman, 2001. Breeding Status of the California Least Tern at Alameda Point (former Naval Air Station, Alameda), Alameda, California, 2000. Unpublished Report, Point Reyes Bird Observatory, Stinson Beach, California. Elliott, M.L. and W.J. Sydeman, 2002. Breeding Status of the California Least Tern at Alameda Point (former Naval Air Station, Alameda), Alameda, California, 2001. Unpublished Report, Point Reyes Bird Observatory, Stinson Beach, California. Elliott, M. L. 2005. Diet, prey, and foraging habits of the California Least Tern (Sterna antillarum browni). Unpublished Master’s thesis, San Francisco State University.
19

Elliott, M. L., R. Hurt, and W. J. Sydeman. 2007. Breeding biology and status of the California Least Tern Sterna antillarum browni at Alameda Point, San Francisco Bay, California. Waterbirds 30(3): 317-325. Hulsman, K. 1981. Width of gape as a determinant of size of prey eaten by terns. Emu 81: 29-32. Hurt, Rachel. 2003. Breeding Status of the California Least Tern at Alameda Point, Alameda, California, 2002. Unpublished Report, U.S. Fish and Wildlife Service, Fremont, California. Hurt, Rachel. 2006. Breeding Status of the California Least Tern at Alameda Point, Alameda, California, 2005. Unpublished Report Prepared for the U.S. Navy, U.S. Fish and Wildlife Service, Fremont, California. Johnson, D. H. 1980. The comparison of usage and availability measurements for evaluating resource preference. Ecology 61(1): 65-71. Palmer, R. S. 1941. A behavior study of the Common Tern (Sterna hirundo hirundo L.). Proceedings of the Boston Society of Natural History 42: 1-119. Robinette, D., N. Collier, A. Brown, and W. J. Sydeman. 2001. Monitoring and management of the California Least Tern colony at Purisma Point, Vandenberg Air Force Base, 1995-2001. Unpublished Report, Point Reyes Bird Observatory, Stinson Beach, CA. Shealer, D. A. 1998. Size-selective predation by a specialist forager, the Roseate Tern. Auk 115(2): 519-525. Thompson, B. C., J. A. Jackson, J. Burger, L. A. Hill, E. M. Kirsch and J. A. Atwood. 1997. Least Tern (Sterna antillarum) in Birds of North America, No. 290 (A. Poole and F. Gill, Eds.). The Academy of Natural Sciences, Philadelphia, PA, and The American Ornithologists’ Union, Washington, D.C. Zuria, I. and E. Mellink. 2005. Fish abundance and the 1995 nesting season of the Least Tern at Bahía de San Jorge, Northern Gulf of California, México. Waterbirds 28(2): 172-180.
20

Table 1. Definitions of breeding stages, 2000-2006. Breeding stage Year Courtship / Incubation Chick-rearing Fledging
2000 April 28 - June 3 June 4 - July 1 July 2 - Aug 16 2001 April 24 - June 1 June 2 - June 30 July 1 - August 4 2002 April 22 - June 1 June 2 - June 30 July 1 - July 21 2003 April 19 - May 30 May 31 - June 28 June 29 - August 25 2004 April 20 - May 28 May 29 - June 26 June 27 - August 11 2005 April 18 - May 29 May 30 - June 27 June 28 - August 1 2006 April 13 - May 30 June 1 - June 28 June 29 - August 14
21
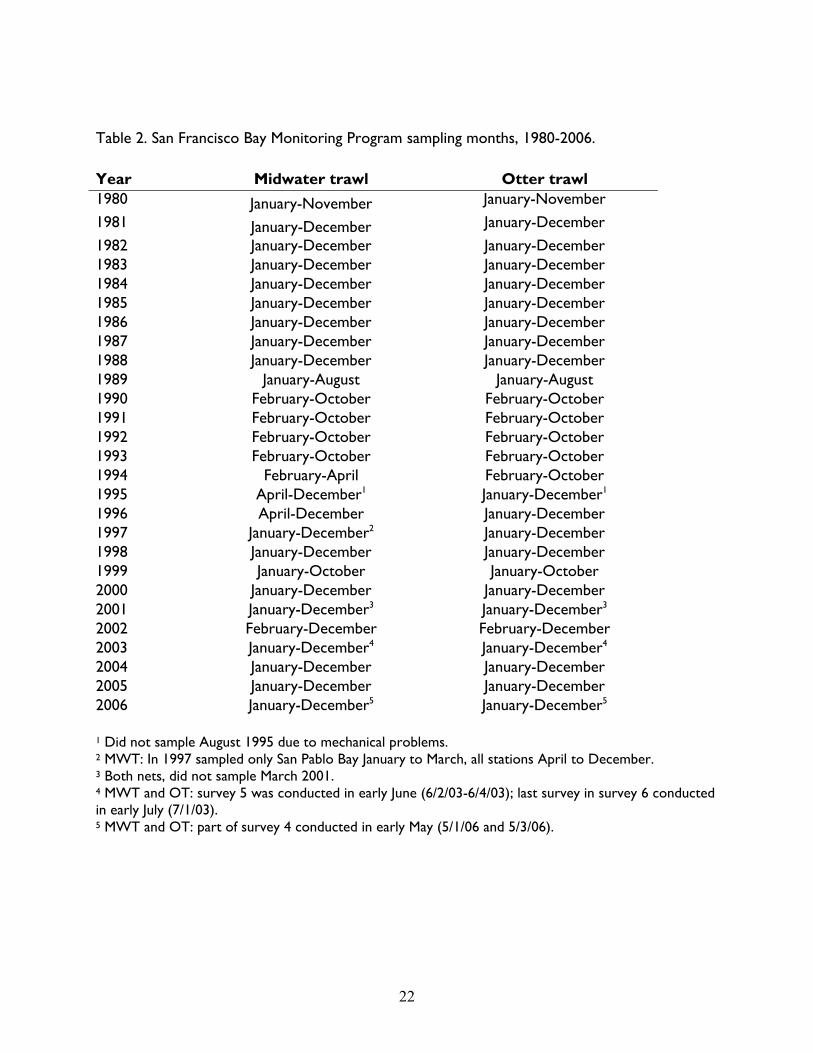
Table 2. San Francisco Bay Monitoring Program sampling months, 1980-2006. Year Midwater trawl Otter trawl 1980
January-November January-November 1981
January-December January-December 1982 January-December January-December 1983 January-December January-December 1984 January-December January-December 1985 January-December January-December 1986 January-December January-December 1987 January-December January-December 1988 January-December January-December 1989 January-August January-August 1990 February-October February-October 1991 February-October February-October 1992 February-October February-October 1993 February-October February-October 1994 February-April February-October 1995 April-December1 January-December1 1996 April-December January-December 1997 January-December2 January-December 1998 January-December January-December 1999 January-October January-October 2000 January-December January-December 2001 January-December3 January-December3 2002 February-December February-December 2003 January-December4 January-December4 2004 January-December January-December 2005 January-December January-December 2006 January-December5 January-December5 1 Did not sample August 1995 due to mechanical problems. 2 MWT: In 1997 sampled only San Pablo Bay January to March, all stations April to December. 3 Both nets, did not sample March 2001. 4 MWT and OT: survey 5 was conducted in early June (6/2/03-6/4/03); last survey in survey 6 conducted in early July (7/1/03). 5 MWT and OT: part of survey 4 conducted in early May (5/1/06 and 5/3/06).
22
23
Table 3. Minimum lengths of fish sampled in San Francisco Bay. Species Minimum length (mm) American shad 20 bay goby 20 California grunion 20 California halibut 20 California tonguefish 20 chameleon goby 20 cheekspot goby 20 Chinook salmon 20 delta smelt 30 diamond turbot 20 English sole 20 longfin smelt 40 northern anchovy 40 Pacific herring 30 Pacific staghorn sculpin 20 plainfin midshipman 20 shimofuri goby 20 Shokihaze goby 20 speckled sanddab 20 starry flounder 20 striped bass 25 white croaker 20 yellowfin goby 20

Tab
le 4
. Fam
ilies
and
spe
cies
of f
ish id
entif
ied
in d
ropp
ed p
rey,
198
1-20
06.
Fam
ily
Sp
ecie
sSc
ient
ific
nam
eN
umbe
r P
erce
ntag
e of
tot
al c
olle
ctio
n
Paci
fic h
erri
ng
Clup
ea p
alla
sii
997
6.59
%Pa
cific
sar
dine
Sa
rdin
ops
saga
x 50
0.33
%C
lupe
idae
Clu
peid
ae s
pp.
1
0.01
%En
grau
lidae
nort
hern
anc
hovy
Engr
aulis
mor
dax
2084
13.7
8%C
hino
ok s
alm
on
Onc
orhy
nchu
s ts
haw
ytsc
ha
582
3.85
%co
ho s
alm
on
Onc
orhy
nchu
s ki
sutc
h 31
0.20
%Sa
lmon
idae
Salm
onid
ae s
pp.
45
0.01
%de
lta s
mel
t H
ypom
esus
pre
tiosu
s 9
0.06
%lo
ngfin
sm
elt
Spiri
nchu
s th
alei
chth
ys
10.
01%
surf
sm
elt
Hyp
omes
us p
retio
sus
940.
62%
Osm
erid
ae
O
smer
idae
spp
.
60.
04%
Batr
acho
idid
aepl
ainf
in m
idsh
ipm
anPo
richt
hys
nota
tus
20.
01%
Scom
bere
soci
dae
Pa
cific
sau
ry
Colo
labi
s sa
ira
10.
01%
Fund
ulid
aera
inw
ater
kill
ifish
Lu
cani
a pa
rva
20.
01%
Cyp
rini
dae
Cyp
rini
dae
spp.
1
0.01
%C
alifo
rnia
gru
nion
Le
ures
thes
tenu
is 26
91.
78%
jack
smel
t At
herin
opsis
cal
iforn
iens
is 65
8243
.52%
tops
mel
t At
herin
ops
affin
is 19
4912
.89%
Mis
siss
ippi
silv
ersi
de
Men
idia
ber
yllin
a 11
0.07
%
Ath
erin
opsi
dae
Ath
erin
opsi
dae
spp.
1020
6.74
%G
aste
rost
eida
eth
rees
pine
stic
kleb
ack
Gas
tero
steu
s ac
ulea
tus
10.
01%
brow
n ro
ckfis
h Se
bast
es a
uricu
latu
s 2
0.01
%Sc
orpa
enid
ae
ro
ckfis
h sp
p.
Seba
stes
spp
. 10
0.07
%H
exag
ram
mid
aeun
iden
tifie
d gr
eenl
ing
Hex
agra
mm
os s
pp.
130.
09%
Paci
fic s
tagh
orn
scul
pin
Lept
ocot
tus
arm
atus
5
0.03
%C
ottid
ae
C
ottid
ae s
pp.
1
0.01
%M
oron
idae
stri
ped
bass
Mor
one
saxa
tilis
90.
06%
whi
te c
roak
er
Gen
yone
mus
line
atus
18
0.12
%Sc
iaen
idae
Scia
enid
ae s
pp.
5
0.03
%bl
ack
perc
h Em
biot
oca
jack
soni
4
0.03
%w
alle
ye s
urfp
erch
H
yper
pros
opon
arg
ente
um
276
1.82
%Em
biot
ocid
ae
silv
er s
urfp
erch
H
yper
pros
opon
ellip
ticum
7
0.05
%
24

25
nam
e
Tab
le 4
(co
ntin
ued)
. Fa
mily
Sp
ecie
s Sc
ient
ific
Num
ber
Per
cent
age
of t
otal
col
lect
ion
8 3.
%
shin
er p
erch
Cy
mat
ogas
ter a
ggre
gata
56
76st
ripe
d se
aper
ch
Embi
otoc
a la
tera
lis
1 0.
%
7 0.
%
4 0.
%
55
0.%
8
0.%
5
0.%
23
0.
%
90
0.%
19
0.
%
36
0.%
7
0.%
Eng
1 0.
%
le
1
0.%
T
OT
AL
23
10%
01dw
arf p
erch
M
icrom
etru
s m
inim
us
05pi
le p
erch
Rh
acoc
hilu
s va
cca
03w
hite
sea
perc
h Ph
aner
odon
furc
atus
36
Embi
otoc
idae
Embi
otoc
idae
spp
. la
nce
11
78A
mm
odyt
idae
Pa
cific
san
d Am
mod
ytes
hex
apte
rus
03ba
y go
by
Lepi
dogo
bius
lepi
dus
15ye
llow
fin g
oby
Acan
thog
obiu
s fla
viman
us
60ch
eeks
pot
goby
Ily
pnus
gilb
erti
13ar
row
gob
y Cl
evel
andi
a io
s 24
Gob
iidae
Gob
iidae
spp
. so
le
10
71Pl
euro
nect
idae
lish
Paro
phry
s ve
tulu
s
01un
iden
tifia
b01
151
0.00

Table 5. Standard lengths and body depths of dropped prey, 2000-2006. Standard length (mm) Body depth (mm) Year mean ± s.d. range n mean ± s.d. range n
2000 66 ± 12.8 26-93 785 12 ± 3.4 2-24 792 2001 65 ± 11.2 25-94 1771 12 ± 3.2 2-27 1798 2002 63 ± 15.2 26-106 1123 13 ± 3.9 3-25 1131 2003 59 ± 13.2 28-94 1730 12 ± 3.5 2-23 1939 2004 61 ± 13.7 25-100 1850 12 ± 3.6 2-25 1852 2005 62 ± 11.5 14-102 2283 12 ± 2.9 2-25 2285 2006 71 ± 12.5 25-105 849 11 ± 3.0 3-23 849
TOTAL 63 ± 13.1 14-106 10391 12 ± 3.5 2-27 10646
26

Table 6. Standard lengths and body depths of dropped prey by breeding stage, 2000-2006. a) Courtship/incubation Standard length (mm) Body depth (mm) Year mean ± s.d. range n mean ± s.d. range n
2000 69 ± 8.4 48-78 16 14 ± 2.2 11-17 16 2001 70 ± 10.7 47-88 16 15 ± 2.5 11-21 16 2002 72 ± 10.8 35-98 104 14 ± 2.4 5-20 105 2003 73 ± 14.4 42-92 39 14 ± 2.6 3-21 197 2004 74 ± 12.0 36-95 86 15 ± 2.6 4-22 86 2005 70 ± 12.2 30-91 143 14 ± 2.3 8-20 143 2006 72 ± 10.8 37-97 249 14 ± 2.5 8-21 249
TOTAL 71 ± 11.5 30-98 653 14 ± 2.5 3-22 812
b) Chick-rearing Standard length (mm) Body depth (mm) Year mean ± s.d. range n mean ± s.d. range n
2000 63 ± 14.4 29-88 93 13 ± 4.4 2-24 93 2001 61 ± 12.6 31-93 235 12 ± 4.1 3-27 236 2002 65 ± 15.6 31-103 420 14 ± 3.8 3-25 424 2003 58 ± 12.9 29-91 777 11 ± 3.3 2-23 793 2004 61 ± 14.2 25-100 787 12 ± 3.6 2-24 787 2005 64 ± 13.1 19-102 419 13 ± 3.4 3-25 418 2006 72 ± 12.8 25-105 470 15 ± 2.7 4-24 470
TOTAL 63 ± 14.4 19-105 3201 13 ± 3.7 2-27 3221
c) Fledging Standard length (mm) Body depth (mm) Year mean ± s.d. range n mean ± s.d. range n
2000 66 ± 12.6 26-93 676 12 ± 3.2 2-24 683 2001 66 ± 10.9 25-94 1520 12 ± 3.1 2-26 1546 2002 60 ± 14.6 26-106 599 12 ± 3.9 3-25 602 2003 59 ± 13.0 28-94 914 11 ± 3.6 2-23 949 2004 60 ± 12.8 28-100 977 12 ± 3.6 2-25 979 2005 60 ± 10.7 14-94 1721 11 ± 2.7 2-24 1724 2006 64 ± 12.2 34-92 130 13 ± 3.7 6-24 130
TOTAL 62 ± 12.3 14-106 6537 12 ± 3.3 2-26 6613
27

28
Table 7. Two-factor ANOVA results for dropped fish sizes, 2000-2006. Source Partial SS df MS F Prob>F Model 171740.5 20 8587.024 54.85 0.0000 year 11844.87 6 1974.145 12.61 0.0000 breeding stage 20959.64 2 10479.82 66.94 0.0000 year * breeding stage 35834.79 12 2986.233 19.08 0.0000 Residual 1623442 10370 156.5517 Total 1795182 10390 172.7798
Number of observations = 10391 Root MSE = 12.5121 R2 = 0.0957 Adjusted R2 = 0.0939

Tab
le 8
. Fis
h sa
mpl
ed in
San
Fra
ncisc
o Ba
y du
ring
the
Lea
st T
ern
bree
ding
sea
son
(Apr
il –
Aug
ust)
, 198
0-20
06.
Fam
ily
Spec
ies
Scie
ntifi
c N
ame
Gea
r ty
pe u
sed
in
ana
lysi
s N
umbe
r of
sui
tabl
y-si
zed
spec
imen
s P
erce
ntag
e of
all
suit
ably
-si
zed
spec
imen
s Pe
trom
yzon
tidae
Paci
fic la
mpr
eyLa
mpe
tra tr
iden
tata
ot
ter
traw
l 0
0.00
rive
r la
mpr
ey
Lam
petra
ayr
esii
otte
r tr
awl
0 0.
00
Hex
anch
idae
br
oadn
ose
seve
ngill
sha
rk
N
otor
ynch
us c
eped
ianu
s ot
ter
traw
l 0
0.00
Sq
ualid
ae
spin
y do
gfish
Squa
lus
acan
thia
s ot
ter
traw
l 0
0.00
A
lopi
idae
thre
sher
sha
rkAl
opia
s vu
lpin
us
mid
wat
er t
raw
l 0
0.00
T
riak
idae
leop
ard
shar
kTr
iaki
s se
mifa
scia
ta
otte
r tr
awl
0 0.
00
br
own
smoo
thho
und
Mus
telu
s he
nlei
ot
ter
traw
l 0
0.00
T
orpe
dini
dae
Paci
fic e
lect
ric
ray
To
rped
o ca
lifor
nica
ot
ter
traw
l 0
0.00
Pl
atyr
hyni
dae
thor
nbac
kPl
atyr
hino
idis
trise
riata
ot
ter
traw
l 0
0.00
R
hino
batid
aesh
ovel
nose
gui
tarf
ish
Rh
inob
atos
pro
duct
us
otte
r tr
awl
0 0.
00
Raj
idae
big
skat
e
Raja
bin
ocul
ata
otte
r tr
awl
0 0.
00
Myl
ioba
tidae
bat
ray
Myli
obat
is ca
lifor
nica
ot
ter
traw
l 9
0.00
A
cipe
nser
idae
gree
n st
urge
onAc
ipen
ser m
ediro
stris
ot
ter
traw
l 0
0.00
whi
te s
turg
eon
Ac
ipen
ser t
rans
mon
tanu
s ot
ter
traw
l 0
0.00
C
lupe
idae
thre
adfin
shad
Dor
osom
a pe
tene
nse
mid
wat
er t
raw
l 1
0.00
Paci
fic h
erri
ng
Clup
ea p
alla
sii
mid
wat
er t
raw
l 79
669
5.40
Paci
fic s
ardi
ne
Sard
inop
s sa
gax
mid
wat
er t
raw
l 33
19
0.22
Am
eric
an s
had
Alos
a sa
pidi
ssim
a m
idw
ater
tra
wl
1 0.
00
Engr
aulid
aeno
rthe
rn a
ncho
vyEn
grau
lis m
orda
x m
idw
ater
tra
wl
1228
462
83.2
2 Sa
lmon
idae
st
eelh
ead
trou
tO
ncor
hync
hus
myk
iss
mid
wat
er t
raw
l 0
0.00
ch
inoo
ksa
lmon
O
ncor
hync
hus
tsha
wyt
scha
m
idw
ater
tra
wl
521
0.04
O
smer
idae
surf
sm
elt
Hyp
omes
us p
retio
sus
otte
r tr
awl
6 0.
00
eu
lach
on
Thal
eich
thys
pac
ificu
s m
idw
ater
tra
wl
0 0.
00
w
hite
bait
smel
t Al
losm
erus
elo
ngat
us
otte
r tr
awl
6 0.
00
ni
ght
smel
t Sp
irinc
hus
star
ksi
otte
r tr
awl
8 0.
00
lo
ngfin
sm
elt
Spiri
nchu
s th
alei
chth
ys
otte
r tr
awl
9420
0.
64
Syno
dont
idae
Cal
iforn
ia li
zard
fish
Syno
dus
lucio
ceps
ot
ter
traw
l 16
0.
00
Batr
acho
idid
aepl
ainf
in m
idsh
ipm
anPo
richt
hys
nota
tus
otte
r tr
awl
6444
0.
44
Oph
idiid
aesp
otte
d cu
sk-e
elCh
ilara
taylo
ri ot
ter
traw
l 3
0.00
G
adid
aePa
cific
tom
cod
Micr
ogad
us p
roxi
mus
ot
ter
traw
l 15
4 0.
01
Fund
ulid
aera
inw
ater
kill
ifish
Luca
nia
parv
a m
idw
ater
tra
wl
2 0.
00
29
Tab
le 8
(co
ntin
ued)
.
Fam
ily
Spec
ies
Scie
ntifi
c N
ame
Gea
r ty
pe u
sed
in
ana
lysi
s N
umbe
r of
sui
tabl
y-si
zed
spec
imen
s P
erce
ntag
e of
all
suit
ably
-si
zed
spec
imen
s A
ther
inop
sida
eC
alifo
rnia
gru
nion
Leur
esth
es te
nuis
mid
wat
er t
raw
l 13
0 0.
01
ja
cksm
elt
Athe
rinop
sis c
alifo
rnie
nsis
mid
wat
er t
raw
l 40
16
0.27
tops
mel
t At
herin
ops
affin
is m
idw
ater
tra
wl
501
0.03
G
aste
rost
eida
e
thre
espi
ne s
tickl
ebac
k
Gas
tero
steu
s ac
ulea
tus
mid
wat
er t
raw
l 8
0.00
Sy
ngna
thid
aeba
y pi
pefis
hSy
ngna
thus
lept
orhy
nchu
s ot
ter
traw
l 29
0.
00
Scor
paen
idae
brow
n ro
ckfis
hSe
bast
es a
uricu
latu
s ot
ter
traw
l 57
1 0.
04
bl
ack
rock
fish
Seba
stes
mel
anop
s m
idw
ater
tra
wl
7 0.
00
bl
ue r
ockf
ish
Seba
stes
mys
tinus
ot
ter
traw
l 1
0.00
yello
wta
il ro
ckfis
h Se
bast
es fl
avid
us
otte
r tr
awl
13
0.00
verm
ilion
roc
kfis
h Se
bast
es m
inia
tus
otte
r tr
awl
1 0.
00
un
iden
tifie
d ro
ckfis
h
Seba
stes
spp
. ot
ter
traw
l 11
0.
00
Hex
agra
mm
idae
lingc
odO
phio
don
elon
gatu
s ot
ter
traw
l 82
0.
01
ke
lp g
reen
ling
Hex
agra
mm
os d
ecag
ram
mus
ot
ter
traw
l 43
0.
00
Cot
tidae
cabe
zon
Scor
paen
ichth
ys m
arm
orat
us
otte
r tr
awl
6 0.
00
br
own
Irish
lord
H
emile
pido
tus
spin
osus
ot
ter
traw
l 2
0.00
Paci
fic s
tagh
orn
scul
pin
Lept
ocot
tus
arm
atus
ot
ter
traw
l 33
43
0.23
buffa
lo s
culp
in
Enop
hrys
biso
n ot
ter
traw
l 42
0.
00
pa
dded
scu
lpin
Ar
tedi
us fe
nest
ralis
ot
ter
traw
l 1
0.00
bony
head
scu
lpin
Ar
tedi
us n
otos
pilo
tus
otte
r tr
awl
203
0.01
scal
yhea
d sc
ulpi
n Ar
tedi
us h
arrin
gton
i ot
ter
traw
l 1
0.00
pric
kly
scul
pin
Cottu
s as
per
otte
r tr
awl
1 0.
00
Ago
nida
epy
gmy
poac
her
Odo
ntop
yxis
trisp
inos
a ot
ter
traw
l 14
0.
00
Lipa
rida
esh
owy
snai
lfish
Lipa
ris p
ulch
ellu
s ot
ter
traw
l 21
6 0.
01
sl
ipsk
in s
nailf
ish
Lipa
ris fu
cens
is ot
ter
traw
l 1
0.00
M
oron
idae
stri
ped
bass
Mor
one
saxa
tilis
mid
wat
er t
raw
l 5
0.00
C
aran
gida
eja
ck m
acke
rel
Trac
huru
s sy
mm
etric
us
mid
wat
er t
raw
l 0
0.00
Sc
iaen
idae
quee
nfish
Serip
hus
polit
us
mid
wat
er t
raw
l 0
0.00
whi
te c
roak
er
Gen
yone
mus
line
atus
ot
ter
traw
l 15
493
1.05
30

Tab
le 8
(co
ntin
ued)
.
Fam
ily
Spec
ies
Scie
ntifi
c N
ame
Gea
r ty
pe u
sed
in
ana
lysi
s N
umbe
r of
sui
tabl
y-si
zed
spec
imen
s P
erce
ntag
e of
all
suit
ably
-si
zed
spec
imen
s Em
biot
ocid
aeru
bber
lip s
eape
rch
Rhac
ochi
lus
toxo
tes
otte
r tr
awl
0 0.
00
bl
ack
perc
h Em
biot
oca
jack
soni
ot
ter
traw
l 1
0.00
barr
ed s
urfp
erch
Am
phist
ichus
arg
ente
us
otte
r tr
awl
2 0.
00
ca
lico
surf
perc
h Am
phist
ichus
koe
lzi
otte
r tr
awl
0 0.
00
re
dtai
l sur
fper
ch
Amph
istich
us rh
odot
erus
ot
ter
traw
l 0
0.00
spot
fin s
urfp
erch
H
yper
pros
opon
ana
le
otte
r tr
awl
0 0.
00
w
alle
ye s
urfp
erch
H
yper
pros
opon
arg
ente
um
mid
wat
er t
raw
l 10
0.
00
si
lver
sur
fper
ch
Hyp
erpr
osop
on e
lliptic
um
otte
r tr
awl
0 0.
00
sh
iner
per
ch
Cym
atog
aste
r agg
rega
ta
otte
r tr
awl
2432
0.
16
st
ripe
d se
aper
ch
Embi
otoc
a la
tera
lis
otte
r tr
awl
0 0.
00
dw
arf p
erch
M
icrom
etru
s m
inim
us
otte
r tr
awl
7 0.
00
pi
le p
erch
Rh
acoc
hilu
s va
cca
otte
r tr
awl
0 0.
00
w
hite
sea
perc
h Ph
aner
odon
furc
atus
ot
ter
traw
l 5
0.00
unid
entif
ied
surf
perc
h Em
biot
ocid
ae s
pp.
otte
r tr
awl
0 0.
00
Cha
enop
sida
e
ones
pot
frin
gehe
adN
eocli
nus
unin
otat
us
otte
r tr
awl
4 0.
00
Phol
idae
sadd
leba
ck g
unne
lPh
olis
orna
ta
otte
r tr
awl
66
0.00
A
mm
odyt
idae
Paci
fic s
and
lanc
e
Amm
odyt
es h
exap
teru
s ot
ter
traw
l 28
0.
00
Gob
iidae
cham
eleo
ngo
byTr
iden
tiger
trig
onoc
epha
lus
otte
r tr
awl
853
0.06
bay
goby
Le
pido
gobi
us le
pidu
s ot
ter
traw
l 57
299
3.88
yello
wfin
gob
y Ac
anth
ogob
ius
flavim
anus
ot
ter
traw
l 59
5 0.
04
ch
eeks
pot
goby
Ily
pnus
gilb
erti
otte
r tr
awl
3576
0.
24
ar
row
gob
y Cl
evel
andi
a io
s ot
ter
traw
l 41
0.
00
sh
imof
uri g
oby
Trid
entig
er b
ifasc
iatu
s ot
ter
traw
l 2
0.00
Shok
ihaz
e go
by
Trid
entig
er b
arba
tus
otte
r tr
awl
1 0.
00
Stro
mat
eida
ePa
cific
pom
pano
Pepr
ilus
similli
mus
m
idw
ater
tra
wl
260
0.02
C
ynog
loss
idae
Cal
iforn
ia t
ongu
efis
h
Sym
phur
us a
trica
udus
ot
ter
traw
l 22
15
0.15
Pa
ralic
hthy
idae
Cal
iforn
ia h
alib
utPa
ralic
hthy
s ca
lifor
nicu
s ot
ter
traw
l 14
0.
00
Pa
cific
san
ddab
Ci
thar
ichth
ys s
ordi
dus
otte
r tr
awl
0 0.
00
sp
eckl
ed s
andd
ab
Cith
arich
thys
stig
mae
us
otte
r tr
awl
3368
5 2.
28
31

Tab
le 8
(co
ntin
ued)
.
Fam
ily
Spec
ies
Scie
ntifi
c N
ame
Gea
r ty
pe u
sed
in
ana
lysi
s N
umbe
r of
sui
tabl
y-si
zed
spec
imen
s P
erce
ntag
e of
all
suit
ably
-si
zed
spec
imen
s Pl
euro
nect
idae
curl
fin s
ole
Pleu
roni
chth
ys d
ecur
rens
ot
ter
traw
l 12
6 0.
01
ho
rnyh
ead
turb
ot
Pleu
roni
chth
ys v
ertic
alis
otte
r tr
awl
3 0.
00
sa
nd s
ole
Pset
ticht
hys
mel
anos
tictu
s ot
ter
traw
l 38
0.
00
di
amon
d tu
rbot
Pl
euro
nich
thys
gut
tula
tus
otte
r tr
awl
1 0.
00
En
glish
sol
e Pa
roph
rys
vetu
lus
otte
r tr
awl
2209
3 1.
50
st
arry
flou
nder
Pl
atich
thys
ste
llatu
s ot
ter
traw
l 38
0.
00
D
over
sol
e
Micr
osto
mus
pac
ificu
s
otte
r tr
awl
2
0.00
TO
TA
L14
7617
910
0.00
32
Tab
le 9
. Len
gths
of f
ish
sam
pled
with
diff
eren
t ge
ar t
ypes
in S
an F
ranc
isco
Bay
, Apr
il-A
ugus
t, 20
00-2
006.
mid
wat
er t
raw
l ot
ter
traw
l bo
th n
ets
Yea
r m
ean
± s.
d.
rang
e n
mea
n ±
s.d.
ra
nge
n m
ean
± s.
d.
rang
e n
2000
80
± 2
6.6
32-6
10
4629
78
± 7
2.9
20-1
300
5292
79
± 5
6.2
20-1
300
9921
20
01
80 ±
29.
1 31
-632
44
27
83 ±
54.
7 20
-856
62
29
82 ±
45.
8 20
-856
10
656
2002
76
± 3
5.5
35-6
27
4867
77
± 5
1.0
20-8
55
9675
77
± 4
6.4
20-8
55
1454
2 20
03
75 ±
25.
8 30
-582
51
64
81 ±
45.
2 20
-754
70
58
79 ±
38.
3 20
-754
12
222
2004
86
± 2
6.7
31-3
24
4690
83
± 5
4.3
20-1
020
6148
84
± 4
4.5
20-1
020
1083
8 20
05
77 ±
21.
7 30
-314
43
40
92 ±
81.
1 20
-900
32
50
83 ±
56.
0 20
-101
0 75
90
2006
88
± 2
3.0
38-5
30
3927
90
± 7
2.6
20-9
47
2768
89
± 5
0.0
20-9
47
6695
T
otal
80
± 2
7.8
30-6
32
3204
4 82
± 5
9.1
20-1
300
4042
0 81
± 4
7.8
20-1
300
7246
4
33

Tab
le 1
0. L
engt
hs o
f sui
tabl
y-si
zed
fish
sam
pled
with
diff
eren
t ge
ar t
ypes
in S
an F
ranc
isco
Bay,
Apr
il-A
ugus
t, 20
00-2
006.
m
idw
ater
tra
wl
otte
r tr
awl
both
net
s Y
ear
mea
n ±
s.d.
ra
nge
n m
ean
± s.
d.
rang
e n
mea
n ±
s.d.
ra
nge
n 20
00
73 ±
12.
4 32
-100
39
83
57 ±
20.
4 20
-100
43
71
65 ±
18.
8 20
-100
83
54
2001
71
± 1
6.1
31-1
00
3492
64
± 2
0.8
20-1
00
4625
67
± 1
9.2
20-1
00
8117
20
02
67 ±
13.
0 35
-100
42
59
61 ±
20.
4 20
-100
76
21
63 ±
18.
3 20
-100
11
880
2003
71
± 1
3.1
30-1
00
4800
66
± 1
8.4
20-1
00
5361
68
± 1
6.3
20-1
00
1016
1 20
04
78 ±
15.
2 31
-100
37
78
64 ±
19.
8 20
-100
44
36
70 ±
19.
1 20
-100
82
14
2005
73
± 1
2.7
30-1
00
4068
66
± 1
9.7
20-1
00
2307
71
± 1
5.9
20-1
00
6375
20
06
82 ±
13.
0 38
-100
33
24
67 ±
17.
9 20
-100
21
14
76 ±
16.
8 20
-100
54
38
Tot
al
73 ±
14.
3 30
-100
27
704
63 ±
20.
1 20
-100
30
835
68 ±
18.
3 20
-100
58
539
34

Tab
le 1
1. L
engt
hs o
f sui
tabl
y-si
zed
fish
sam
pled
with
diff
eren
t gea
r ty
pes
in S
an F
ranc
isco
Bay
and
in d
iffer
ent
bree
ding
per
iods
, Apr
il-A
ugus
t, 20
00-2
006.
m
idw
ater
tra
wl
otte
r tr
awl
both
net
s Y
ear
mea
n ±
s.d.
ra
nge
n m
ean
± s.
d.
rang
e n
mea
n ±
s.d.
ra
nge
n 20
00
69 ±
12.
8 32
-100
16
35
52 ±
20.
7 20
-100
15
20
61 ±
19.
1 20
-100
31
55
2001
60
± 1
6.2
31-1
00
1244
63
± 2
4.8
20-1
00
1634
62
± 2
1.6
20-1
00
2878
20
02
61 ±
15.
2 35
-100
13
42
56 ±
20.
8 20
-100
35
96
57 ±
19.
6 20
-100
49
38
2003
53
± 1
1.4
30-9
6 50
9 61
± 2
1.4
20-1
00
994
58 ±
19.
0 20
-100
15
03
2004
81
± 1
9.0
31-1
00
1025
56
± 2
1.8
21-1
00
1494
66
± 2
3.8
21-1
00
2519
20
05
70 ±
14.
7 30
-100
15
68
61 ±
19.
8 20
-100
74
5 67
± 1
7.1
20-1
00
2313
20
06
81 ±
14.
4 38
-100
13
15
60 ±
17.
0 20
-100
80
1 73
± 1
8.6
20-1
00
2116
T
OT
AL
69 ±
17.
3 30
-100
86
38
58 ±
21.
6 20
-100
10
784
63 ±
20.
6 20
-100
19
422
m
idw
ater
tra
wl
otte
r tr
awl
both
net
s Y
ear
mea
n ±
s.d.
ra
nge
n m
ean
± s.
d.
rang
e n
mea
n ±
s.d.
ra
nge
n 20
00
72 ±
13.
8 40
-100
86
7 55
± 1
9.5
21-1
00
1220
62
± 1
9.3
21-1
00
2087
20
01
74 ±
15.
1 43
-100
78
4 61
± 1
8.8
20-1
00
1146
66
± 1
8.5
20-1
00
1930
20
02
68 ±
13.
8 42
-100
69
2 63
± 1
9.0
20-1
00
1632
64
± 1
7.8
20-1
00
2324
20
03
72 ±
13.
7 41
-100
13
12
66 ±
17.
1 20
-100
21
20
69 ±
16.
1 20
-100
34
32
2004
77
± 1
4.3
41-1
00
840
65 ±
17.
6 22
-100
11
53
70 ±
17.
3 22
-100
19
93
2005
74
± 1
2.1
41-9
9 73
3 67
± 1
9.8
20-1
00
398
72 ±
15.
6 20
-100
11
31
2006
80
± 1
3.9
43-1
00
736
65 ±
17.
1 22
-100
43
9 74
± 1
6.8
22-1
00
1175
T
OT
AL
74 ±
14.
3 40
-100
59
64
63 ±
18.
7 20
-100
81
08
68 ±
17.
8 20
-100
14
072
m
idw
ater
tra
wl
otte
r tr
awl
both
net
s Y
ear
mea
n ±
s.d.
ra
nge
n m
ean
± s.
d.
rang
e n
mea
n ±
s.d.
ra
nge
n 20
00
78 ±
9.0
46
-100
14
81
63 ±
19.
2 20
-100
16
31
70 ±
16.
9 20
-100
31
12
2001
79
± 9
.7
36-1
00
1464
67
± 1
7.5
21-1
00
1845
72
± 1
5.8
21-1
00
3309
20
02
70 ±
9.6
37
-100
22
25
67 ±
18.
5 21
-100
23
93
69 ±
15.
0 21
-100
46
18
2003
73
± 1
0.4
45-1
00
2979
67
± 1
7.9
21-1
00
2247
71
± 1
4.4
21-1
00
5226
20
04
77 ±
13.
0 36
-100
19
13
70 ±
17.
1 20
-100
17
89
74 ±
15.
5 20
-100
37
02
2005
75
± 1
0.3
35-1
00
1767
69
± 1
8.9
21-1
00
1164
73
± 1
4.7
21-1
00
2931
20
06
84 ±
10.
5 55
-100
12
73
74 ±
16.
1 26
-100
87
4 80
± 1
4.0
26-1
00
2147
35
a) C
ourt
ship
/incu
batio
n
b) C
hick
-rea
ring
76 ±
11.
2 35
-100
13
102
68 ±
18.
2 20
-100
11
943
72 ±
15.
5 20
-100
25
045
c) F
ledg
ing
TO
TA
L

Table 12. Two-factor ANOVA results for Bay fish sizes, 2000-2006. Source Partial SS df MS F Prob>F Model 1866023 20 93301.13 306.62 0.0000 year 741175.8 6 123529.3 405.96 0.0000 breeding stage 824975.2 2 412487.6 1355.58 0.0000 year*breeding stage 109520.8 12 9126.737 29.99 0.0000 Residual 17806323 58518 304.8796 Total 19672347 58538 336.0611
Number of observations = 58539 Root MSE = 17.4439 R2 = 0.0949 Adjusted R2 = 0.0945
36

Table 13. Three-factor ANOVA results comparing dropped fish and Bay fish sizes, 2000-2006. Source Partiall SS df MS F Prob>F Model 2107745 17 123985 436.48 0.0000 collection (Bay or colony) 24422.28 1 24422.28 85.98 0.0000 year 207340.5 6 34556.75 121.65 0.0000 breeding 13873.04 2 6936.518 24.42 0.0000 collection*year 124285.1 6 20714.18 72.92 0.0000 collection*breeding 157781.6 2 78890.81 277.73 0.0000 Residual 19575120 68912 284.0597 Total 21682866 68929 314.5681
Number of observations = 68930 Root MSE = 16.8541 R2 = 0.0972 Adjusted R2 = 0.0970
37

Table 14. Spearman correlations by species between species compositions from dropped fish at the colony to fish sampled in San Francisco Bay. Gear type Species ρ n p
Chinook salmon - 0.1655 21 0.4734 northern anchovy 0.6039 21 0.0037 Pacific herring 0.4416 21 0.0451 Pacific sardine 0.8189 21 <0.001 topsmelt - 0.0261 21 0.9104 jacksmelt - 0.1000 21 0.6663 California grunion 0.8408 21 <0.001 striped bass - 0.0910 21 0.6949 threespine stickleback - 0.0910 21 0.6949
Midwater trawl
walleye surfperch - 0.1664 21 0.4709 surf smelt - 0.1389 21 0.5483 longfin smelt - 0.0739 21 0.7504 white croaker 0.4641 21 0.0341 yellowfin goby 0.526 21 0.0143 arrow goby 0.4343 21 0.0491 bay goby 0.3983 21 0.0737 cheekspot goby 0.5814 21 0.0057 Pacific sand lance 0.3515 21 0.1181 Pacific staghorn sculpin 0.3542 21 0.1152 brown rockfish 0.3798 21 0.0895 unidentified rockfish - 0.2320 21 0.3115 plainfin midshipman 0.1733 21 0.4526 dwarf perch - 0.0038 21 0.987 shiner perch 0.0461 21 0.8426 white seaperch 0.3076 21 0.1749 black perch - 0.0500 21 0.8296
Otter trawl
English sole - 0.0739 21 0.7504 Note: Yellow highlights designate significant results (p<0.05), and pink highlights indicate near-significant results (0.1>p>0.05).
38
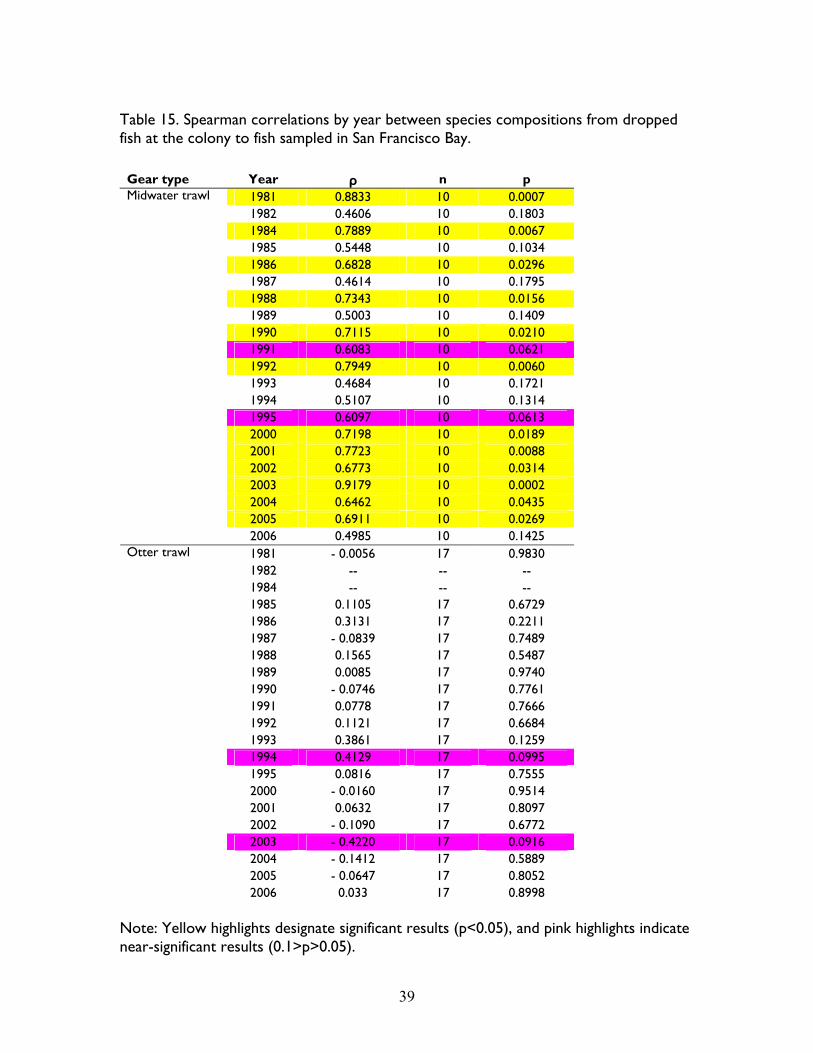
Table 15. Spearman correlations by year between species compositions from dropped fish at the colony to fish sampled in San Francisco Bay. Gear type Year ρ n p
1981 0.8833 10 0.0007 1982 0.4606 10 0.1803 1984 0.7889 10 0.0067 1985 0.5448 10 0.1034 1986 0.6828 10 0.0296 1987 0.4614 10 0.1795 1988 0.7343 10 0.0156 1989 0.5003 10 0.1409 1990 0.7115 10 0.0210 1991 0.6083 10 0.0621 1992 0.7949 10 0.0060 1993 0.4684 10 0.1721 1994 0.5107 10 0.1314 1995 0.6097 10 0.0613 2000 0.7198 10 0.0189 2001 0.7723 10 0.0088 2002 0.6773 10 0.0314 2003 0.9179 10 0.0002 2004 0.6462 10 0.0435 2005 0.6911 10 0.0269
Midwater trawl
2006 0.4985 10 0.1425 1981 - 0.0056 17 0.9830 1982 -- -- -- 1984 -- -- -- 1985 0.1105 17 0.6729 1986 0.3131 17 0.2211 1987 - 0.0839 17 0.7489 1988 0.1565 17 0.5487 1989 0.0085 17 0.9740 1990 - 0.0746 17 0.7761 1991 0.0778 17 0.7666 1992 0.1121 17 0.6684 1993 0.3861 17 0.1259 1994 0.4129 17 0.0995 1995 0.0816 17 0.7555 2000 - 0.0160 17 0.9514 2001 0.0632 17 0.8097 2002 - 0.1090 17 0.6772 2003 - 0.4220 17 0.0916 2004 - 0.1412 17 0.5889 2005 - 0.0647 17 0.8052
Otter trawl
2006 0.033 17 0.8998 Note: Yellow highlights designate significant results (p<0.05), and pink highlights indicate near-significant results (0.1>p>0.05).
39

Table 16. Rank preference indices for fish species. Gear type Species (Rank colony) – (Rank Bay) Selectivity
Pacific herring 2 preferred Pacific sardine 4 strongly preferred northern anchovy 1 mildly preferred Chinook salmon 0 neutral California grunion 0 neutral jacksmelt -2 avoided topsmelt -3 strongly avoided threespine stickleback 1 mildly preferred striped bass -1 mildly avoided
Midwater trawl
walleye surfperch -2 avoided longfin smelt 10 strongly preferred surf smelt -13 strongly avoided plainfin midshipman 8 preferred brown rockfish 4 preferred unidentified rockfish spp. -3 avoided Pacific staghorn sculpin 4 preferred white croaker 5 preferred black perch -5 avoided shiner perch -7 avoided dwarf surfperch -4 avoided white seaperch -12 strongly avoided Pacific sand lance -2 avoided bay goby 5 preferred yellowfin goby -7 avoided cheekspot goby 1 mildly preferred arrow goby -6 avoided
Otter trawl
English sole 12 strongly preferred
40

Table 17. Sizes of northern anchovy and jacksmelt sampled in San Francisco Bay, April-August, 2000-2006. Year mean ± s.d. range n
2000 77 ± 9.4 40-100 2989 2001 80 ± 12.0 41-100 1879 2002 73 ± 9.6 41-100 2326 2003 77 ± 9.9 47-100 3161 2004 83 ± 10.3 46-100 2721 2005 75 ± 10.8 40-100 3384 2006 86 ± 9.2 53-100 2740
northern anchovy
Total 79 ± 10.9 40-100 19200
2000 71 ± 18.6 44-99 52 2001 79 ± 9.5 36-100 299 2002 77 ± 10.9 50-98 313 2003 78 ± 8.9 48-98 75 2004 66 ± 14.9 36-100 174 2005 67 ± 14.1 40-96 92 2006 81 ± 7.4 59-98 111
jacksmelt
Total 75 ± 12.8 36-100 1116
41

Figure 1. Fish sampling stations of CDFG’s San Francisco Study.
Note: Data from stations in the South Bay (101-142) and Central Bay (211-244) were used in this report. Map obtained from the IEP/CDFG website: http://www.iep.ca.gov/sf_bay_monitor/
42

43
Figure 2. Dropped prey composition by familiy, 1981-2006.
(Note: No prey were collected in years 1983 and 1996-1999).

Figu
res
3. M
ean
mid
wat
er t
raw
l CPU
E va
lues
of s
uita
bly-
size
d fis
h, A
pril-
Aug
ust,
1980
-200
6.
44

Figu
re 4
. Mea
n ot
ter
traw
l CPU
E va
lues
of s
uita
bly-
size
d fis
h, A
pril-
Aug
ust,
1980
-200
6.
45