learning to rank for spatiotemporal search
TRANSCRIPT

Learning to Rank for Spatiotemporal Search
Blake Shaw, Jon Shea, Siddhartha Sinha, Andrew HogueFoursquare
568 BroadwayNew York, NY
{blake, jonshea, ssinha, ahogue}@foursquare.com
ABSTRACTIn this article we consider the problem of mapping a noisyestimate of a user’s current location to a semantically mean-ingful point of interest, such as a home, restaurant, or store.Despite the poor accuracy of GPS on current mobile devicesand the relatively high density of places in urban areas, it ispossible to predict a user’s location with considerable pre-cision by explicitly modeling both places and users and bycombining a variety of signals about a user’s current context.Places are often simply modeled as a single latitude and lon-gitude when in fact they are complex entities existing in bothspace and time and shaped by the millions of people that in-teract with them. Similarly, models of users reveal complexbut predictable patterns of mobility that can be exploited forthis task. We propose a novel spatial search algorithm thatinfers a user’s location by combining aggregate signals minedfrom billions of foursquare check-ins with real-time contex-tual information. We evaluate a variety of techniques anddemonstrate that machine learning algorithms for rankingand spatiotemporal models of places and users offer signifi-cant improvement over common methods for location searchbased on distance and popularity.
Categories and Subject DescriptorsH.2.8 [Database Applications]: Spatial databases; H.2.8[Database Applications]: Data Mining; I.5.1 [PatternRecognition]: Statistical
Keywordsspatial search, machine learning, learn to rank, spatiotempo-ral models, location data, data mining, geocoding, informa-tion retrieval, foursquare, human mobility, mobile devices
1. INTRODUCTIONToday’s location-aware mobile devices have dramatically
increased the availability and usefulness of location infor-mation. Many applications take advantage of the ability of
Permission to make digital or hard copies of all or part of this work forpersonal or classroom use is granted without fee provided that copies arenot made or distributed for profit or commercial advantage and that copiesbear this notice and the full citation on the first page. To copy otherwise, torepublish, to post on servers or to redistribute to lists, requires prior specificpermission and/or a fee.WSDM’13, February 4–8, 2012, Rome, Italy.Copyright 2013 ACM 978-1-4503-1869-3/13/02 ...$15.00.
these devices to report a user’s location in terms of latitudeand longitude, providing useful services to the user such asmaps, driving directions, tourist guides, photo sharing, andmore. Other services allow users to store content that hasbeen “geotagged” with a location and share it with friends.
Several applications go one step further than raw coor-dinates, attaching a semantically meaningful name to a lo-cation. The coarsest form of this labeling involves using areverse geocoding service [2] to find a city or neighborhoodname for a given location. Examples include Twitter, whichallows users to attach a location to a tweet, displaying itas a city or neighborhood, and Facebook, which tags mostposts by default with a user’s current city.
These coarse location names provide some context, butin many cases it is desirable to be significantly more gran-ular when choosing a name for a location. For example,Instagram allows users to choose a specific location whensharing a photo, such as “Washington Square Park” or “TheBlind Tiger.” Similarly, foursquare, Path, and other mobileapplications allow users to “check in” at a specific locationsuch as a restaurant or museum. Tying users and their datato specific, semantically meaningful locations enables theseservices to provide richer experiences, such as showing theuser relevant and timely information like a menu from arestaurant or a tip from a friend about what to order [31].Moreover, identifying precise locations facilitates the sharingand aggregation of local information. For example, a user offoursquare can see not only recent places their friends havechecked into, but also which of their friends have endorsednearby venues.
Unfortunately, mapping a user’s location to a database ofknown points of interest is complicated by several factors.While location services such as GPS, WiFi, and cell-towertriangulation can provide accuracies under 10 meters un-der ideal conditions [35], results in real-world environmentsare substantially worse, with median accuracies of 70 meters(see Figure 1). Additionally, many areas of the world are ex-tremely dense in terms of semantically meaningful locations;in many urban environments, interesting locations may evenbe located directly above or below each other. Finally, whilea user’s history may be useful in determining their location[7, 18], the system must still provide accurate results evenfor users with little or no history.
Despite these difficulties, there are many benefits to anaccurate system for finding specific, semantically meaningfulnames for a given set of coordinates. Tuning such a systemfor high recall in the top few results allows users to choosetheir location from a list of results and more easily share and

0 500 1000 1500 20000
10
20
30
40
Accuracy (m)
% o
f sea
rche
s
Figure 1: Distribution of reported location accuracyfrom 26,532 randomly sampled worldwide searcheson foursquare. The median is 70 meters, and themean is 551 meters.
retrieve local information. Alternatively, a system with highprecision in the first position could be used to automaticallylabel a user’s location or content with a specific locationname, or to tie together multiple pieces of content into acoherent grouping about a particular place. Furthermore,such a system could be used to trigger highly contextualnotifications, such as transit information when a user entersa train station, or targeted deals when a user enters a store.
In this article, we describe the development, training, andevaluation of the spatial search engine that powers the four-square application and API. We first introduce our approachto modeling people and places using check-in data, and thendescribe how these models can be used for retrieval and rank-ing. We focus on using machine learning techniques to cre-ate an optimal ranking function, which learns from largeamounts of implicit feedback. Finally, we demonstrate thefully working system and evaluate its performance in a vari-ety of real-world situations, showing significant improvementover common methods for location search and previously re-ported results.
1.1 Related WorkThe growing ubiquity of GPS-enabled consumer mobile
devices has only recently enabled the study of user locationat the scale described in the current work. Lian and Xie[18] describe a similar system for mapping a user to a pointof interest (POI) trained on data from 545 users in a singlecity using a database of approximately 16,000 points of in-terest. The system uses several features, such as distance,time, POI popularity, and user history, to train a modelthat predicts a user’s location with 64.5% recall in the top5 results. Our work improves these results by introducingseveral new features, more robust models, and significantlymore training data (in terms of both size and diversity) tosearch a much larger database of locations.
Similar techniques regarding context and personalizationhave been applied in the area of local business search andweb search. Lane et al. [17] report relevance improvementsof up to ten times in local search relevance by includingsimple context and behavioral similarity features in a rank-ing model. Church and Smyth [10] demonstrate the efficacyof including user-, location-, and time-dependent featuresin mobile web search. Many techniques incorporate signalsmined from query logs to improve search results [34, 32].
Outside of the realm of search, significant work has beendone with respect to analyzing and describing GPS data
Figure 2: The check-in screen of the foursquare ap-plication where a user searches for nearby venuesand selects a venue to check in to.
collected over time from users. Ashbrook and Starner [6,7] cluster GPS locations to model significant locations andpredict user movements using a Markov model. Gonzalez etal. [13] develop similar models to predict where a user willbe based on their history. Liao et al. [19] predict signifi-cant locations for a given user using hierarchical conditionalrandom fields, while Marmasse and Schmand [21] describea similar system to collect GPS trails and prompt the userto label the significant locations. Furthermore, many tech-niques combine social and location-based signals to signifi-cantly boost the accuracy of models for predicting user loca-tion as well as determining attributes of social relationships[30, 8, 28, 20].
Geolocating other types of data has also received substan-tial attention. Systems for mapping text to a location havebeen described for tweets [9], blogs [11], and web pages [5]using a variety of lexicographic and user features. Similarly,Serdyukov et al. [29] describe techniques for mapping photosto geographic coordinates using language models and userannotations.
1.2 Venue Search in FoursquareFoursquare is a location-based service which handles more
than 5 million check-ins each day, mapping each to one ofmore than 40 million locations worldwide. Foursquare hasaccumulated over 2.5 billion historical check-ins.1 These ac-tions are enabled by a search engine that maps user locationsinto a database of points of interest with high accuracy. Thisservice is also provided as an API for external developers toadd location mapping to their applications [1].
Figure 2 shows the check-in screen from the foursquare
1As of August 2012.
RetrievalQuerylat, lng,
timestamp, useridRanking
Responselist of ranked venues
Logging
Optimization
Modeling
ranking modelspatial indexresults, features,
clicks, and check-ins
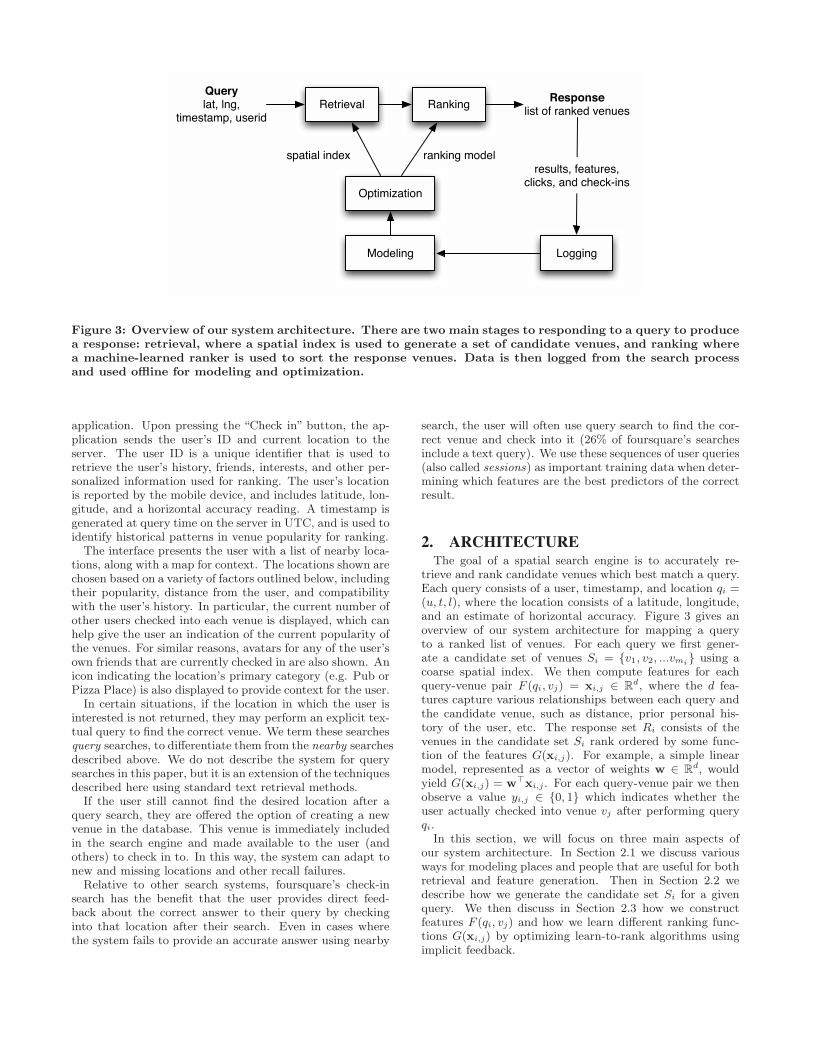
Figure 3: Overview of our system architecture. There are two main stages to responding to a query to producea response: retrieval, where a spatial index is used to generate a set of candidate venues, and ranking wherea machine-learned ranker is used to sort the response venues. Data is then logged from the search processand used offline for modeling and optimization.
application. Upon pressing the “Check in” button, the ap-plication sends the user’s ID and current location to theserver. The user ID is a unique identifier that is used toretrieve the user’s history, friends, interests, and other per-sonalized information used for ranking. The user’s locationis reported by the mobile device, and includes latitude, lon-gitude, and a horizontal accuracy reading. A timestamp isgenerated at query time on the server in UTC, and is used toidentify historical patterns in venue popularity for ranking.
The interface presents the user with a list of nearby loca-tions, along with a map for context. The locations shown arechosen based on a variety of factors outlined below, includingtheir popularity, distance from the user, and compatibilitywith the user’s history. In particular, the current number ofother users checked into each venue is displayed, which canhelp give the user an indication of the current popularity ofthe venues. For similar reasons, avatars for any of the user’sown friends that are currently checked in are also shown. Anicon indicating the location’s primary category (e.g. Pub orPizza Place) is also displayed to provide context for the user.
In certain situations, if the location in which the user isinterested is not returned, they may perform an explicit tex-tual query to find the correct venue. We term these searchesquery searches, to differentiate them from the nearby searchesdescribed above. We do not describe the system for querysearches in this paper, but it is an extension of the techniquesdescribed here using standard text retrieval methods.
If the user still cannot find the desired location after aquery search, they are offered the option of creating a newvenue in the database. This venue is immediately includedin the search engine and made available to the user (andothers) to check in to. In this way, the system can adapt tonew and missing locations and other recall failures.
Relative to other search systems, foursquare’s check-insearch has the benefit that the user provides direct feed-back about the correct answer to their query by checkinginto that location after their search. Even in cases wherethe system fails to provide an accurate answer using nearby
search, the user will often use query search to find the cor-rect venue and check into it (26% of foursquare’s searchesinclude a text query). We use these sequences of user queries(also called sessions) as important training data when deter-mining which features are the best predictors of the correctresult.
2. ARCHITECTUREThe goal of a spatial search engine is to accurately re-
trieve and rank candidate venues which best match a query.Each query consists of a user, timestamp, and location qi =(u, t, l), where the location consists of a latitude, longitude,and an estimate of horizontal accuracy. Figure 3 gives anoverview of our system architecture for mapping a queryto a ranked list of venues. For each query we first gener-ate a candidate set of venues Si = {v1, v2, ...vmi} using acoarse spatial index. We then compute features for eachquery-venue pair F (qi, vj) = xi,j ∈ R
d, where the d fea-tures capture various relationships between each query andthe candidate venue, such as distance, prior personal his-tory of the user, etc. The response set Ri consists of thevenues in the candidate set Si rank ordered by some func-tion of the features G(xi,j). For example, a simple linearmodel, represented as a vector of weights w ∈ R
d, wouldyield G(xi,j) = w�xi,j . For each query-venue pair we thenobserve a value yi,j ∈ {0, 1} which indicates whether theuser actually checked into venue vj after performing queryqi.
In this section, we will focus on three main aspects ofour system architecture. In Section 2.1 we discuss variousways for modeling places and people that are useful for bothretrieval and feature generation. Then in Section 2.2 wedescribe how we generate the candidate set Si for a givenquery. We then discuss in Section 2.3 how we constructfeatures F (qi, vj) and how we learn different ranking func-tions G(xi,j) by optimizing learn-to-rank algorithms usingimplicit feedback.
(a) JFK Airport (b) Golden Gate Bridge (close up) (c) The Blind Tiger
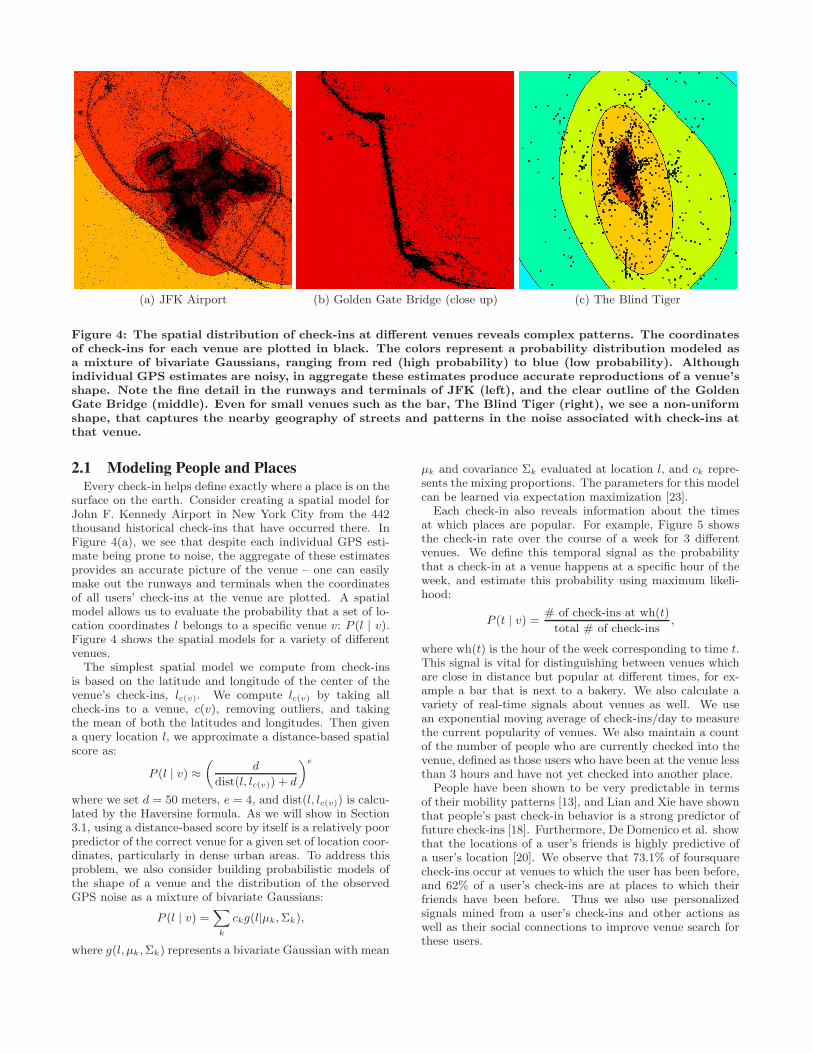
Figure 4: The spatial distribution of check-ins at different venues reveals complex patterns. The coordinatesof check-ins for each venue are plotted in black. The colors represent a probability distribution modeled asa mixture of bivariate Gaussians, ranging from red (high probability) to blue (low probability). Althoughindividual GPS estimates are noisy, in aggregate these estimates produce accurate reproductions of a venue’sshape. Note the fine detail in the runways and terminals of JFK (left), and the clear outline of the GoldenGate Bridge (middle). Even for small venues such as the bar, The Blind Tiger (right), we see a non-uniformshape, that captures the nearby geography of streets and patterns in the noise associated with check-ins atthat venue.
2.1 Modeling People and PlacesEvery check-in helps define exactly where a place is on the
surface on the earth. Consider creating a spatial model forJohn F. Kennedy Airport in New York City from the 442thousand historical check-ins that have occurred there. InFigure 4(a), we see that despite each individual GPS esti-mate being prone to noise, the aggregate of these estimatesprovides an accurate picture of the venue – one can easilymake out the runways and terminals when the coordinatesof all users’ check-ins at the venue are plotted. A spatialmodel allows us to evaluate the probability that a set of lo-cation coordinates l belongs to a specific venue v: P (l | v).Figure 4 shows the spatial models for a variety of differentvenues.
The simplest spatial model we compute from check-insis based on the latitude and longitude of the center of thevenue’s check-ins, lc(v). We compute lc(v) by taking allcheck-ins to a venue, c(v), removing outliers, and takingthe mean of both the latitudes and longitudes. Then givena query location l, we approximate a distance-based spatialscore as:
P (l | v) ≈(
d
dist(l, lc(v)) + d
)e
where we set d = 50 meters, e = 4, and dist(l, lc(v)) is calcu-lated by the Haversine formula. As we will show in Section3.1, using a distance-based score by itself is a relatively poorpredictor of the correct venue for a given set of location coor-dinates, particularly in dense urban areas. To address thisproblem, we also consider building probabilistic models ofthe shape of a venue and the distribution of the observedGPS noise as a mixture of bivariate Gaussians:
P (l | v) =∑k
ckg(l|µk,Σk),
where g(l, µk,Σk) represents a bivariate Gaussian with mean
µk and covariance Σk evaluated at location l, and ck repre-sents the mixing proportions. The parameters for this modelcan be learned via expectation maximization [23].
Each check-in also reveals information about the timesat which places are popular. For example, Figure 5 showsthe check-in rate over the course of a week for 3 differentvenues. We define this temporal signal as the probabilitythat a check-in at a venue happens at a specific hour of theweek, and estimate this probability using maximum likeli-hood:
P (t | v) = # of check-ins at wh(t)
total # of check-ins,
where wh(t) is the hour of the week corresponding to time t.This signal is vital for distinguishing between venues whichare close in distance but popular at different times, for ex-ample a bar that is next to a bakery. We also calculate avariety of real-time signals about venues as well. We usean exponential moving average of check-ins/day to measurethe current popularity of venues. We also maintain a countof the number of people who are currently checked into thevenue, defined as those users who have been at the venue lessthan 3 hours and have not yet checked into another place.
People have been shown to be very predictable in termsof their mobility patterns [13], and Lian and Xie have shownthat people’s past check-in behavior is a strong predictor offuture check-ins [18]. Furthermore, De Domenico et al. showthat the locations of a user’s friends is highly predictive ofa user’s location [20]. We observe that 73.1% of foursquarecheck-ins occur at venues to which the user has been before,and 62% of a user’s check-ins are at places to which theirfriends have been before. Thus we also use personalizedsignals mined from a user’s check-ins and other actions aswell as their social connections to improve venue search forthese users.

M 12AM M 12PM T 12AM T 12PM W 12AM W 12PM T 12AM T 12PM F 12AM F 12PM S 12AM S 12PM S 12AM S 12PM M 12AM0
0.5
1
1.5
2
2.5
Time of Week
% o
f che
ck−
ins
Weekly Popularity Patterns
Amy’s Bread
PerillaBleecker Street Pizza
Figure 5: Places have distinct temporal signatures based on when they are popular during the week. Herewe see normalized weekly check-ins for 3 venues within a 1 block radius in the West Village of New YorkCity: Amy’s Bread, a cafe which serves breakfast and lunch; Perilla, a nice restaurant that serves dinner andbrunch on the weekends, and Bleecker Street Pizza, popular for both dinner and late night food on weekends.
2.2 RetrievalThe first step in our spatial search process is to retrieve
a set of candidate venues for a given query. The primarysource of these candidates is a geospatial index which wequery for the m most popular venues closest to the user’squery position. The current system uses m = 150 as a trade-off between recall and performance considerations.
Unfortunately, due to poor accuracy in the position re-ported at query time, this initial query can fail to retrievethe desired venue under a variety of different circumstances.The geospatial query is particularly problematic in denseurban areas. For example, in some areas of Manhattan re-trieving the 150 venues closest to a given position will resultin an effective search radius of less than 75 meters (approxi-mately the median of reported location accuracy as reportedin Figure 1). Additionally, because venues are indexed bytheir the center point (computed as described in Section 2.1),the geospatial query can fail when the desired venue itself isparticularly large. In these cases, the query position mightphysically exist within the venue’s boundary, but nonethe-less still be a considerable distance from the venue’s indexedcenter point. For example, a user who searches for an airportwhile sitting on the airport’s runway might be 1000 metersor more from the position at which the airport is indexed,which is usually near the center of the airport terminal.
To mitigate these shortcomings, we retrieve supplementalcandidates from three other sources. We query the last 6months of the user’s check-in history for any venues within1000 meters of the user’s current location. We include thesevenues in the candidate set even if they were not retrieved bythe geospatial query. Similarly, we include any venue within1200 meters at which the user has a friend who is currentlychecked in. Finally, we keep a list of several hundred of themost frequently checked into large venues in the world (suchas airports), and include these in the candidate set if theyare within a few kilometers of the query position.
Our geospatial index is built on top of the S2 Geome-try Library, open sourced by Google.2 S2 models sphericalgeometries by mapping the sphere to a cube, and then recur-sively dividing each face of the cube into four child squares,which it refers to as“cells”. There are 31 levels of cells, start-ing with the faces of the cube itself, which are level 0. Eachcell has a 64-bit identifier called its “cell ID”. For a sphere
2S2 Geometry Library, http://code.google.com/p/s2-geometry-library
the size of the Earth, a typical level 30 S2 cell has an areaof less than 1 cm2.
The S2 representation has several benefits. Mapping alatitude and longitude to any of the 31 S2 cell IDs whichcontain it is very efficient. Similarly, given two S2 cell IDs,determining containment is a single bitwise operation. Addi-tionally, given a geometric region on a sphere, the S2 librarycan efficiently compute a set of S2 cells which cover thatregion. The number of cells in this “cover” can be tunedby choosing larger or smaller cells at a given point, at theexpense of a less accurate representation of the given region.
Using the S2 library, it is easy to build a performantgeospatial search system on top of any standard databaseor key-value store.3 For each venue in our index, we addan indexed field to the key-value store which contains a listof the 31 S2 cell IDs which contain the venue, one for eachS2 level. At query time, we compute the set of S2 cell IDswhich cover the query region. We restrict the query to thatregion by adding those S2 cell IDs to the query as a booleanOR (Figure 6).
In order to find our target of approximately 150 candidatevenues, we need to scale the size of the retrieval region basedon the expected density of venues in that region. That is,we need to retrieve from a smaller region in areas wherevenues are dense (for example, metropolitan areas) than wedo in areas where venues are sparse. To solve this problemwe compute “venue density”, which is defined as the numberof venues per unit area in a given region. In practice, wechoose the region to be a reasonably-sized S2 level (level15, roughly 250 meters on a side), and calculate the venuedensity for every S2 cell at that level using an offline process.We use this density to automatically scale the query radiusto retrieve approximately the desired number of venues giventhe density of the query location.
The complete venue retrieval process is thus:
1. Calculate the S2 cell at the chosen venue density S2level for the user’s reported location.
2. Look up the venue density for that cell, and calcu-late the estimated radius, r, that will retrieve approx-imately 150 venues for that density.
3. Calculate an S2 covering of the spherical cap within rof the query position.
3We have built our geospatial index on top of the ApacheSolr project, http://lucene.apache.org/solr/.

Figure 6: An example of an S2 cell-based retrieval.The query area is shown by the red circle around thequery location. The set of S2 cells used for retrieval(known as a “cover”) is shown as red polygons (notethat an S2 cover is an approximation of the givenregion). The desired venue is shown as a pin on themap, with its enclosing S2 cell highlighted in yellow.
4. Query the index to retrieve all of the venues which areindexed with any of the cell IDs in the covering to geta list of nearby candidate venues.
5. Concatenate the nearby candidate venues with the sup-plementary retrieval sources (venues that the user hasvisited previously, venues that the user’s friends arechecked in at, and large venues that are nearby).
At the end of the retrieval process, we have between 150and 250 candidate venues, along with supplementary infor-mation about the venues’ history, shape, popularity overtime, and other factors. In parallel, we have also retrievedthe user’s own history and preferences, as well as informa-tion about their friends and their friends’ histories. All ofthis information is fed into the ranking system.
2.3 RankingMany state-of-the-art search systems rely on machine learn-
ing to create models for ranking [12, 27]. Traditionally, thedata for training such models is generated by people explic-itly annotating previously logged search results. There are afew drawbacks to this approach. First, it is time-consumingand expensive to collect explicit feedback at a large scale.Second, it is difficult for annotators to make judgementsabout personalized results, thus making this approach lessdesirable for use in a highly personalized search product suchas foursquare’s. Consider the case where two users performa search from approximately the same location in a shoppingmall. The desired result depends heavily on their personalpreferences making it difficult for an annotator to label thecorrect result given only the list of nearby shops.
An alternative approach that has recently gained popular-ity is based on interpreting the implicit behavior of users as
they are interacting with search results. Such implicit feed-back is often available at a large scale and is easy to collect.Unfortunately, implicit feedback is ambiguous. Clicks, themost common form of implicit feedback in search, do notnecessarily indicate that users have found the right result.Clicks are biased towards the top results and are often ac-cidental. Users reformulate queries or abandon the search ifthe clicked results are not satisfactory. Joachims et al. havemade great progress in interpreting clicks by extracting pair-wise preferences [16] using query chains [15] and randomlymodifying the presentation of search results [26].
In this work, we use a different form of implicit feed-back: check-ins. A check-in at one of the venues in the searchresults is an unambiguous endorsement of that result by theuser. Using this labeling technique, we can construct a train-ing set consisting of features and labels for each candidatevenue xi,j and yi,j for j = 1 . . .mi of each query qi, whereyi,j denotes the binary label for the jth result in the candi-date set for the ith query. The label is 1 if the user checkedinto the venue and is 0 otherwise.
2.3.1 Data CollectionFrom the perspective of collecting data, a search query and
a check-in are distinct and independent actions. Dependingupon the version of the foursquare product, a check-in canimmediately follow a query or it may have a few intermediatesteps (e.g. viewing additional information about a venueprior to checking in). Each of these user actions is associatedwith independent calls to foursquare services running overa large pool of machines. Each call to a foursquare serviceresults in an event log being written by the service to adistributed log collection mechanism.4
The candidate results Ri and the derived ranking featuresF (qi, vj) = xi,j for j = 1 . . .mi used to train our searchalgorithm are recorded in the server event logs whenever auser performs a search query qi. Since many of our modelsand indices are updated continuously, regenerating the exactfeature values that were used to rank the results for a queryin the past is difficult. Instead, the candidate venues andtheir corresponding features are pushed to logs at the timeof the query, removing the need for regenerating featuresaltogether.
To derive training data from event logs, we use automatedMapReduce jobs written in Scala [24] and Pig [25]. The firststep in the process joins the independent logs into user “ses-sions” which contain all actions taken by a user during agiven time frame (e.g. opening the application, performinga nearby check-in search, performing a query search for “TheBlind Tiger”, then checking in to a specific venue). Each ses-sion involving either a nearby or query search is then catego-rized as successful or not if it also includes a correspondingcheck-in.
Next, we sample a specified number of successful searchsessions and split them into training, validation, and testsets. This process extracts from the logs all candidate venues,their features, and their original rank as presented to theuser. It then joins these with other datasets containing ex-ploratory features, allowing us to evaluate the efficacy ofthese features without implementing them at productionscale. The training and test sets are then exported as files
4Apache Flume, https://cwiki.apache.org/flume/

Feature Description
Spatial score P (l | v)Timeliness P (t | v)Popularity Smoothed estimate of expected check-ins/day at the venueHere now # of users currently checked in to the venue at query timePersonal History # of previous visits from the user at the venueCreator 1 if the user created the venue, 0 otherwiseMayor 1 is the user is the mayor of the venue, 0 otherwise5
Friends Here Now # of the user’s friends currently checked in at query timePersonal History w/ Time of Day # of previous visits from the user at the venue at the same time of the day
Table 1: Overview of the features used for ranking. General signals (top) capture information about theuser’s proximity to a venue as well as information about when the venue is popular and to what degree.Personalized signals (bottom) capture past interactions between the user (and his friends) with the venue.
that can be used with various machine learning packages formodel training and exploration.
2.3.2 FeaturesThe primary features for ranking are derived from models
of venues and users as described in Section 2.1. In additionto the scores derived from these models we construct featuresusing contextual information about the users and venues atthe time of the query. These contextual signals are updatedin real time throughout our system. We also derive featuresusing the social relationships between users. Each of thesefeatures is generated and logged at query time. In Table 1,we see an overview of the features used by our search rankingalgorithm.
2.3.3 MetricsWe use 3 different metrics to evaluate the performance
of a ranking Ri given query qi and labels yi,j : precision atposition 1 (P@1):
P@1 = yi,1,
recall at 5 (R@5):
R@5 =
5∑j=1
yi,j ,
and normalized discounted cumulative gain (NDCG) [14]:
NDCG@5 =1
Zi
5∑j=1
2yi,j − 1
log(1 + j),
where yi,j indicates that the result shown at position j forquery i was the location the user checked into, and Zi isthe normalizing constant chosen such that a perfect rankingwould result in an NDCG of 1 for each query. Each of thesemetrics can then be averaged over all n queries in our eval-uation set to measure the performance of different rankingfunctions.
2.3.4 OptimizationWe consider 3 training procedures for learning the func-
tionG(xi,j) which combines features into a rankable score: lin-ear regression, coordinate ascent, and LambdaMART. For5On foursquare, the “mayor” of a venue is the person whohas been there more days than any other foursquare user inthe last 60 days.
the linear regression model, we simply learn a set of weightsw where G(xi,j) = w�xi,j . The weights are learned suchthat the L2 loss is minimized:
w = argminw
∑i,j
||w�xi,j − yi,j ||2.
The coordinate ascent training procedure similarly learnsa set of linear weights but can be used to optimize metricsother than L2 loss and has thus proved to be very usefulfor search ranking [22]. LambdaMART has been shown toprovide significant lift in search ranking tasks [33] by con-structing an ensemble of decision trees which non-linearlycombine features. We use MATLAB for our linear regres-sion implementation and use RankLib for implementationsof coordinate ascent and LambdaMART [3].
3. EXPERIMENTSWe present a variety of experiments which evaluate dif-
ferent aspects of our search algorithm. We start by eval-uating the impact of modeling places using spatiotemporalprobability distributions, as compared to the most commonbaseline technique of simply using distance. We then demon-strate the performance of variants of our search algorithmwhich use different sets of features and optimization pro-cedures. We compare these to baseline methods based ondistance, popularity, and user history.
3.1 Spatiotemporal ModelsTo better understand how spatiotemporal models of venues
improve unpersonalized venue search in dense urban areas,we present an experiment that compares different spatiotem-poral models for predicting check-ins in a small 10-block ra-dius of downtown Manhattan. Figure 7 shows a sample ofthe 143 thousand check-ins that have occurred at 127 popu-lar venues near Bleecker and Jones St. color-coded by venue.We have removed any venues from this set with less than 100check-ins (which represents less than 5% of the total num-ber of check-ins). The dataset is then divided 90%/10% intotraining and testing sets.
Given only the latitude, longitude, and timestamp of eachcheck-in, the goal is to predict which venue a user checksinto (precision @1). We consider three models for this task.The baseline model simply selects the nearest venue basedon distance. The spatial Gaussian mixture model uses aprobabilistic model, as described in Section 2.1. The num-

Figure 7: A scatterplot showing a sample of the143 thousand check-ins that have occurred in thefew blocks near the corner of Bleecker and JonesSt. in Manhattan. Each check-in is color-codedby the venue to which it belongs. We see that al-though some popular venues can easily be distin-guished from others nearby, there is a substantialoverlap of check-ins in some areas which makes dis-crimination difficult.
ber of Gaussians was limited between 1 and 5 and selectedvia cross-validation. A venue is then predicted by findingthe venue which maximizes the probability under this spa-tial distribution. The full spatiotemporal model uses themixture of Gaussians, the timeliness feature, as well as pop-ularity combined as a linear sum of log-likelihoods.
Table 2 shows the test accuracy of the 3 different models.We see that modelling venue shape offers 46% lift over a sim-ple distance-based algorithm, and incorporating timelinessand relative popularity yields a 112% lift in performance.
3.2 Learning to RankIn this section, we describe our experiments to determine
the optimal features and training procedure for our search al-gorithm. Using the methodology discussed in Section 2.3.1,we collected 38 thousand examples of successful worldwidevenue searches, randomly sampled from the week of 6/24/12,where a user selected the correct venue from a rank-orderedlist presented to them. Our goal is to create a better rankingalgorithm which ranks the correct venues at a higher posi-tion. The 38 thousand venue searches are comprised of over4 million candidate venues and are split 70%/15%/15% intotraining, validation, and test sets respectively. The mod-els for these venues were built using 282 million check-ins,collected over the 2 years prior to the query date.
We explore a variety of different combinations of featuresand models, including linear regression, coordinate ascent,and LambdaMART [33]. For the coordinate ascent model,we use domain knowledge to construct explicit cross-productsthat capture important non-linearities (such as spatial score× popularity). The LambdaMART algorithm automatically
Model P@1
Baseline (nearest by distance) 0.130Spatial Gaussian mixture model 0.193Spatiotemporal models 0.277
Table 2: Comparison of different models of venues.We see that using more complex spatial models andincorporating temporal signals greatly improves theaccuracy of the search algorithm.
Model P@1
Random 0.009Spatial only 0.201User history only 0.358Popularity only 0.143Linear regression: spatial + temporal 0.230Linear regression: spatial + temporal + popularity 0.251Linear regression: all features 0.434Coordinate ascent: all features w/ nonlinear pairs 0.493LambdaMART: all features 0.531
Table 3: The precision of various models and sets offeatures in ranking venue search results.
captures non-linearites by forming an ensemble of 2000 de-cision trees. Table 3 summarizes the performance of thesedifferent techniques in terms of precision at 1 on the held-outtest set. The NDCG@5 for our best model is 0.686, and re-call @5 is 0.822. Figure 9 shows our recall as rank increases.We see that using our best model, we find the correct resultin one of the top 5 positions in 82% of searches and in thetop 10 positions in 91% of searches.
The results in Table 3 indicate that distance and personalhistory are informative features; however their individualperformance is poor when compared to a full model trainedusing a combination of many features. We also find thatlinear models can perform poorly for ranking when manyfeatures are combined. Carefully constructing non-linearpairs of features or using a robust non-linear model suchas LambdaMART is crucial for combining many disparatesignals into an accurate model.
3.3 AnalysisTo better understand when venue search is difficult we
more closely examine how the performance of our search al-gorithm degrades based on varying degrees of personal his-tory, venue density, and reported horizontal accuracy fromthe GPS of the mobile device. In Figure 8(a), we see theperformance of the linear model as a function of the numberof nearby venues a user has been to when they perform asearch. Because users are more likely to check into venuesthey have visited before, the model performs best when thereare a small number of venues nearby that a user has previ-ously visited. As the number of nearby venues in the user’shistory increases, this history has less predictive value, andthe accuracy of the model decreases. In Figure 8(b), we seeperformance as a function of the number of venues withina 1km radius of the user’s query. As expected, we observe

0 5 10 15 20
0.45
0.5
0.55
0.6
# of venues nearby in users history
Pre
cisi
on @
1
(a) User History vs. Precision
0 1000 2000 3000
0.420.440.460.48
0.50.520.54
# of venues nearby within 1km
Pre
cisi
on @
1
(b) Venue Density vs. Precision
0 500 1000 1500 2000
0.4
0.5
0.6
0.7
Reported horizontal accuracy (m)
Pre
cisi
on @
1
(c) Reported Accuracy vs. Precision
Figure 8: Many factors influence the precision of venue search: the familiarity of users with nearby venues(left), the density of nearby venues (middle), and the reported horizontal accuracy from the mobile device(right).
2 4 6 8 10 12 14 16 18 20 220
0.2
0.4
0.6
0.8
1
Rank cutoff
Rec
all
Figure 9: Recall as a function of the rank cut-off.
that performance is higher in areas with fewer venues, anddegrades in dense urban areas. Similarly, Figure 8(c) showsthat as the horizontal accuracy reported by the device in-creases, performance also degrades.
4. DISCUSSIONThere are now over 5 billion consumer mobile devices in
the world that are constantly reporting a signal of latitudes,longitudes, and timestamps [4]. As location data becomemore pervasive, the need to map these signals to semanti-cally meaningful locations becomes increasingly important.In this article, we have demonstrated a spatial search enginefor mapping noisy location estimates from mobile devices topoints of interest. Furthermore, we show that simple base-line techniques for this task, such as those based on distanceand popularity, are insufficient for accurately predicting auser’s location. By leveraging machine learning algorithmsfor ranking and rich spatiotemporal models of places andusers, our spatial search engine achieves significant lift inperformance over these common baselines as well as previ-ously reported results.
4.1 Future WorkWe aim to incorporate more sophisticated models of user
behavior by exploiting additional metadata such as cate-gories of venues and demographics of users (e.g. age, gen-der, etc.). These additional signals would allow us to betterdistinguish between nearby venues that are frequented bydifferent types of people (e.g. a nail salon next to barbershop). Furthermore, a better model of user dynamics couldimprove accuracy as well, by leveraging information aboutcommon transitions between locations (both for the user aswell as in aggregate).
We plan to improve the modeling of venues in the retrievalstage of our search algorithm to better incorporate venueshapes (building on the Gaussian mixture models describedin Section 2.1) instead of points, eliminating the need forsupplementary retrieval of large venues. We also plan toincorporate weather information, modeling the popularitychanges of venues under different situations (e.g. parks aremore popular when it is sunny and art galleries are morepopular when the weather is inclement).
We are striving towards a venue search system that cansupport not only millions of explicit nearby searches everyday but millions of implicit searches as well, generated byusers’ mobile devices as users explore their cities. A passivevenue search system would react to changes in a user’s loca-tion and present relevant local information, such as details ofnearby events, tips from friends, or suggestions about whereto go next. Every location update can act as a search intolocal real-time information, surfacing highly contextual re-sults that can help people better understand and navigatethe real world.
5. REFERENCES[1] foursquare API. http://developer.foursquare.com.
[2] Geonames.org reverse geocoding services.http://www.geonames.org/export/reverse-geocoding.html.
[3] Ranklib.http://people.cs.umass.edu/ vdang/ranklib.html.
[4] The World in 2011 – ICT Facts and Figures.http://www.itu.int/ITU-D/ict/facts/2011/material/ICTFactsFigures2011.pdf.
[5] E. Amitay, N. Har’El, R. Sivan, and A. Soffer.Web-a-where: geotagging web content. In Proceedingsof the 27th Annual International ACM SIGIRConference on Research and Development inInformation Retrieval, pages 273–280. ACM, 2004.
[6] D. Ashbrook and T. Starner. Learning significantlocations and predicting user movement with gps. InProceedings of the Sixth International Symposium onWearable Computers. (ISWC 2002)., pages 101–108.IEEE, 2002.
[7] D. Ashbrook and T. Starner. Using gps to learnsignificant locations and predict movement acrossmultiple users. Personal and Ubiquitous Computing,7(5):275–286, 2003.
[8] Lars Backstrom, Eric Sun, and Cameron Marlow. Findme if you can: improving geographical prediction with
social and spatial proximity. In Proceedings of the 19thinternational conference on World wide web, WWW‘10, pages 61–70, New York, NY, USA, 2010. ACM.
[9] Z. Cheng, J. Caverlee, and K. Lee. You are where youtweet: a content-based approach to geo-locatingtwitter users. In Proceedings of the 19th ACMInternational Conference on Information andKnowledge Management, pages 759–768. ACM, 2010.
[10] K. Church and B. Smyth. Who, what, where & when:a new approach to mobile search. In Proceedings of the13th International Conference on Intelligent UserInterfaces, pages 309–312. ACM, 2008.
[11] C. Fink, C. Piatko, J. Mayfield, T. Finin, andJ. Martineau. Geolocating blogs from their textualcontent. In Working Notes of the AAAI SpringSymposium on Social Semantic Web: Where Web 2.0Meets Web 3.0. AAAI Press, 2009.
[12] J. Furnkranz and E. Hullermeier. Pairwise preferencelearning and ranking. Machine Learning: ECML 2003,pages 145–156, 2003.
[13] M.C. Gonzalez, C.A. Hidalgo, and A.L. Barabasi.Understanding individual human mobility patterns.Nature, 453(7196):779–782, 2008.
[14] K. Jarvelin and J. Kekalainen. IR evaluation methodsfor retrieving highly relevant documents. InProceedings of the 23rd Annual International ACMSIGIR Conference on Research and Development inInformation Retrieval, SIGIR ’00, pages 41–48. ACM,2000.
[15] T. Joachims, L. Granka, Bing Pan, H. Hembrooke,F. Radlinski, and G. Gay. Evaluating the accuracy ofimplicit feedback from clicks and query reformulationsin web search. ACM Transactions on InformationSystems (TOIS), 25(2), April 2007.
[16] T. Joachims, L. Granka, B. Pang, H. Hembrooke, andG. Gay. Accurately interpreting clickthrough data asimplicit feedback. In Proceedings of the 28thInternational ACM SIGIR Conference on Researchand Development in Information, pages 154–161, 2005.
[17] N.D. Lane, D. Lymberopoulos, F. Zhao, and A.T.Campbell. Hapori: context-based local search formobile phones using community behavioral modelingand similarity. In Proceedings of the 12th ACMInternational Conference on Ubiquitous Computing,pages 109–118. ACM, 2010.
[18] D. Lian and X. Xie. Learning location naming fromuser check-in histories. In Proceedings of the 19thACM SIGSPATIAL International Conference onAdvances in Geographic Information Systems, pages112–121. ACM, 2011.
[19] L. Liao, D. Fox, and H. Kautz. Extracting places andactivities from gps traces using hierarchicalconditional random fields. The International Journalof Robotics Research, 26(1):119–134, 2007.
[20] A. Lima M. De Domenico and M/ Musolesi.Interdependence and predictability of human mobilityand social interactions. Proceedings of the NokiaMobile Data Challenge Workshop, June 2012.
[21] N. Marmasse and C. Schmandt. Location-awareinformation delivery with commotion. In Handheld andUbiquitous Computing, pages 361–370. Springer, 2000.
[22] Donald Metzler and W. Bruce Croft. Linear
feature-based models for information retrieval.Information Retrieval, 10(3):257–274, June 2007.
[23] T.K. Moon. The expectation-maximization algorithm.Signal Processing Magazine, IEEE, 13(6):47–60, 1996.
[24] M. Odersky, P. Altherr, V. Cremet, B. Emir,S. Maneth, S. Micheloud, N. Mihaylov, M. Schinz,E. Stenman, and M. Zenger. An overview of the scalaprogramming language. Technical report, TechnicalReport IC/2004/64, EPFL Lausanne, Switzerland,2004.
[25] C. Olston, B. Reed, U. Srivastava, R. Kumar, andA. Tomkins. Pig latin: a not-so-foreign language fordata processing. In Proceedings of the 2008 ACMSIGMOD International Conference on Management ofData, SIGMOD ’08. ACM, 2008.
[26] F. Radlinski and T. Joachims. Minimally invasiverandomization for collecting unbiased preferences fromclickthrough logs. In Proceedings of the 21st NationalConference on Artificial Intelligence (AAAI), pages1406–1412, 2006.
[27] M. Richardson, A. Prakash, and E. Brill. Beyondpagerank: machine learning for static ranking. InProceedings of the 15th International World WideWeb Conference (WWW), pages 707–715. ACM, 2006.
[28] Adam Sadilek, Henry Kautz, and Jeffrey P. Bigham.Finding your friends and following them to where youare. In Proceedings of the fifth ACM internationalconference on Web search and data mining, WSDM’12, pages 723–732, New York, NY, USA, 2012. ACM.
[29] P. Serdyukov, V. Murdock, and R. Van Zwol. Placingflickr photos on a map. In Proceedings of the 32ndInternational ACM SIGIR Conference on Researchand Development in Information Retrieval, pages484–491. ACM, 2009.
[30] M. Terry, E.D. Mynatt, K. Ryall, and D. Leigh. Socialnet: using patterns of physical proximity over time toinfer shared interests. In CHI’02 Extended Abstractson Human Factors in Computing Systems, pages816–817. ACM, 2002.
[31] M. A. Vasconcelos, S. Ricci, J. Almeida,F. Benevenuto, and V. Almeida. Tips, dones andtodos: uncovering user profiles in foursquare. InProceedings of the Fifth ACM InternationalConference on Web Search and Data Mining, WSDM’12, pages 653–662, New York, NY, USA, 2012. ACM.
[32] Petros Venetis, Hector Gonzalez, Christian S. Jensen,and Alon Halevy. Hyper-local, directions-basedranking of places. Proc. VLDB Endow., 4(5):290–301,February 2011.
[33] Q. Wu, C. J. Burges, K. M. Svore, and J. Gao.Adapting boosting for information retrieval measures.Information Retrieval, 13(3):254–270, June 2010.
[34] J. Yi, F. Maghoul, and J. Pedersen. Decipheringmobile search patterns: a study of yahoo! mobilesearch queries. In Proceeding of the 17th InternationalWorld Wide Web Conference (WWW), pages257–266. ACM, 2008.
[35] P.A. Zandbergen. Accuracy of iPhone locations: Acomparison of assisted GPS, WiFi and cellularpositioning. Transactions in GIS, 13:5–25, 2009.