learning objectives - pearsonwps.prenhall.com/wps/media/objects/1443/1478156/keown_23_rp3.pdf ·...
TRANSCRIPT

� LEARN ING OB JECT IVES �After reading this chapter, you should be able to
1. Describe why mergers may create value. 2. Value an acquisition target.

Corporate Restructuring:Combinations and Divestitures
23-2
My, how times have changed as we roll into the 21st century.Cisco Systems, the Internet firm who provides the hardwareand software behind state-of-the-art Internet networks, isalso the king of mergers and acquisitions. Its acquisitionengine is so well tuned that between 1993 and July 2002 itmade 72 acquisitions. The frenzied pace of Cisco’s acquisitionactivity at its peak is reflected in its August 1999 acquisi-tions: During the month Cisco absorbed two start-up firms,closed two other acquisitions, and negotiated two more. Dur-ing fiscal year 1999 the company absorbed 10 companieswhile its sales grew 44 percent and profits grew 55 percent,resulting in a 162 percent increase in the firm’s stock price.But Cisco’s approach is unique in more ways than its phe-nomenal pace. When Cisco acquires a company it makes ano-layoffs pledge, which has produced a turnover rate foremployees acquired through mergers of only 2.1 percentcompared to an industry average of 20 percent. So what isCisco’s secret? Mike Volpi, Cisco’s Chief Strategy Officer,explains, “Cisco’s strategy can be boiled down to five things.We look at a company’s vision; its short-term success with
customers; its long-term strategy; the chemistry of the peo-ple with ours; and its geographic proximity.”1
History shows us that mergers and acquisitions come inwaves. During the 1960s and early 1970s, there was the diver-sification wave during which firms acquired very divergentbusinesses and combined them into huge conglomerates. Thisperiod saw the building of corporate giants that later becamethe target for bust-up mergers of the 1980s. During thisperiod, corporate raiders such as Carl Icahn and Sir JamesGoldsmith acquired many of the corporate behemoths formedduring the earlier merger wave and busted them up, sellingoff the pieces as independent companies in the belief that thecorporate giants were worth more dead than alive. The 1990sgave rise to the largest merger wave of all. This merger wavehas been characterized as one driven by strategic acquisitionswhereby the buyer hopes that, by merging with the seller, thevalue of the whole (merged firm) will be greater than the sumof the values of the parts (the buyer and seller firms).
� CHAPTER PREV IEW �Chapter 23 presents an overview of corporaterestructuring. Corporate restructuring can bethought of in terms of two broad categories of activ-ities: combining or merging independent firms into asingle entity and breaking up or de-merging firmsinto multiple independent components. The restruc-turing of the nineties provides an example of the for-mer whereas the restructuring of the eighties was allabout the latter.
Our discussion of corporate restructuring beginswith a discussion of why mergers might create value.As the term “might” suggests, not all mergers do cre-ate value. Next we discuss alternative methods for
valuing an entire business enterprise. This chapterwill emphasize these principles: Principle 1: TheRisk-Return Trade-Off—We won’t take on addi-tional risk unless we expect to be compensatedwith additional return; Principle 2: The TimeValue of Money—A dollar received today isworth more than a dollar received in the future;Principle 3: Cash—Not Profits—Is King;Principle 4: Incremental Cash Flows—It’s onlywhat changes that counts; Principle 7: TheAgency Problem—Managers won’t work for theowners unless it’s in their best interest; andPrinciple 8: Taxes Bias Business Decisions.
C H A P T E R 2 3
1 Based on Henry Goldblatt, “Cisco’s Secrets,” Fortune (November 8, 1999).
23-3 PA R T 6 S P E C I A L T O P I C S I N F I N A N C E
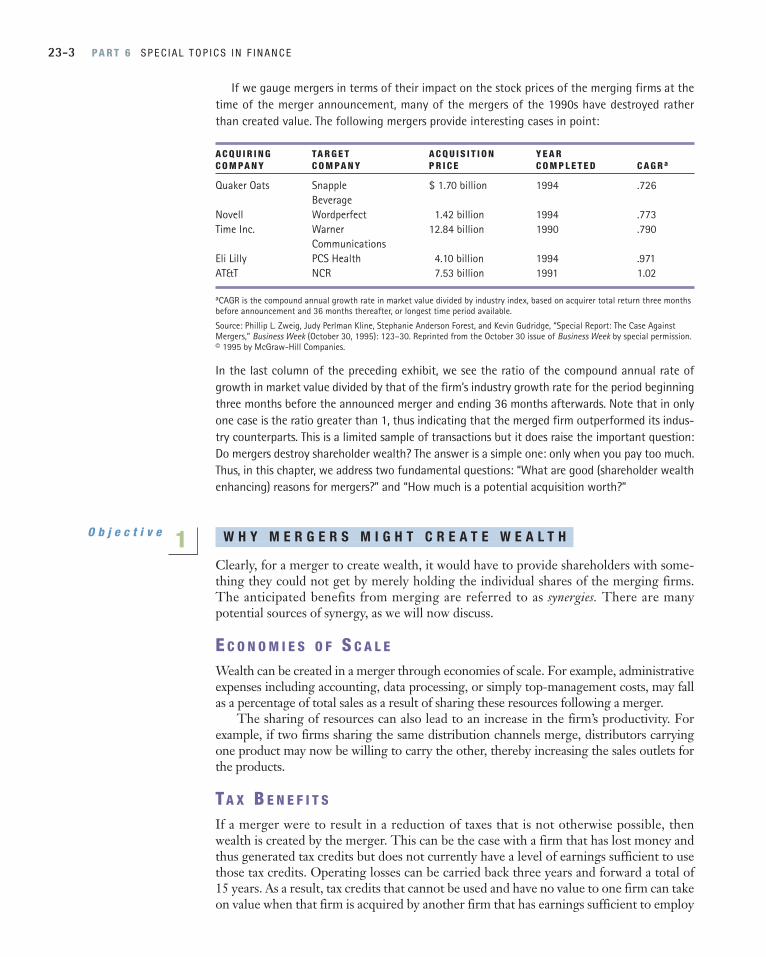
If we gauge mergers in terms of their impact on the stock prices of the merging firms at thetime of the merger announcement, many of the mergers of the 1990s have destroyed ratherthan created value. The following mergers provide interesting cases in point:
A C Q U I R I N G TA R G E T A C Q U I S I T I O N Y E A R C O M PA N Y C O M PA N Y P R I C E C O M P L E T E D C A G R a
Quaker Oats Snapple $ 1.70 billion 1994 .726Beverage
Novell Wordperfect 1.42 billion 1994 .773Time Inc. Warner 12.84 billion 1990 .790
CommunicationsEli Lilly PCS Health 4.10 billion 1994 .971AT&T NCR 7.53 billion 1991 1.02
aCAGR is the compound annual growth rate in market value divided by industry index, based on acquirer total return three monthsbefore announcement and 36 months thereafter, or longest time period available.
Source: Phillip L. Zweig, Judy Perlman Kline, Stephanie Anderson Forest, and Kevin Gudridge, “Special Report: The Case AgainstMergers,” Business Week (October 30, 1995): 123–30. Reprinted from the October 30 issue of Business Week by special permission.© 1995 by McGraw-Hill Companies.
In the last column of the preceding exhibit, we see the ratio of the compound annual rate ofgrowth in market value divided by that of the firm’s industry growth rate for the period beginningthree months before the announced merger and ending 36 months afterwards. Note that in onlyone case is the ratio greater than 1, thus indicating that the merged firm outperformed its indus-try counterparts. This is a limited sample of transactions but it does raise the important question:Do mergers destroy shareholder wealth? The answer is a simple one: only when you pay too much.Thus, in this chapter, we address two fundamental questions: “What are good (shareholder wealthenhancing) reasons for mergers?” and “How much is a potential acquisition worth?”
W H Y M E R G E R S M I G H T C R E A T E W E A L T H
Clearly, for a merger to create wealth, it would have to provide shareholders with some-thing they could not get by merely holding the individual shares of the merging firms.The anticipated benefits from merging are referred to as synergies. There are manypotential sources of synergy, as we will now discuss.
E C O N O M I E S O F S C A L E
Wealth can be created in a merger through economies of scale. For example, administrativeexpenses including accounting, data processing, or simply top-management costs, may fallas a percentage of total sales as a result of sharing these resources following a merger.
The sharing of resources can also lead to an increase in the firm’s productivity. Forexample, if two firms sharing the same distribution channels merge, distributors carryingone product may now be willing to carry the other, thereby increasing the sales outlets forthe products.
TA X B E N E F I T S
If a merger were to result in a reduction of taxes that is not otherwise possible, thenwealth is created by the merger. This can be the case with a firm that has lost money andthus generated tax credits but does not currently have a level of earnings sufficient to usethose tax credits. Operating losses can be carried back three years and forward a total of15 years. As a result, tax credits that cannot be used and have no value to one firm can takeon value when that firm is acquired by another firm that has earnings sufficient to employ
O b j e c t i v e 1
C H A P T E R 2 3 C O R P O R AT E R E S T R U C T U R I N G : C O M B I N AT I O N S A N D D I V E S T I T U R E S 23-4
the tax credits. In addition, a merger allows for previously depreciated assets to be reval-ued; wealth is created from the tax benefits arising from the increased depreciation asso-ciated with this revaluation of assets.
U N U S E D D E B T P O T E N T I A L
Some firms simply do not exhaust their debt capacity. If a firm with unused debt capacityis acquired, the new management can then increase debt financing, and reap the tax ben-efits associated with the increased leverage.
C O M P L E M E N T A R I T Y I N F I N A N C I A L S L A C K
When cash-rich bidders and cash-poor targets are combined, wealth may be created.This is particularly true where the cash-poor firm is a small business with limited accessto capital markets. In effect, the merger allows positive NPV projects to be accepted thatwould have been rejected if the merger had not occurred.
B A C K T O T H E P R I N C I P L E S
Once again, we see that tax policy influences business decisions. Sometimes this is the intendedconsequence of fiscal policies of the federal government, and at others, it is an unanticipatedreaction. We find that Principle 8: Taxes Bias Business Decisions provides at least some partialexplanation for corporate restructuring activities.
B A C K T O T H E P R I N C I P L E S
Sometimes the only hope for returning a firm to strong financial performance involves changing thefirm’s management. To assure that the new management will act in the best interests of the firm’sowners, these changes in management are frequently accompanied by changes in the means bywhich management is compensated.These changes are aimed at aligning managerial and stockholderinterests such that the managers will find it in their best interest to make managerial choices that leadto a maximization of share value. Thus, changes in a firm’s management and the method of manager-ial compensation are frequently a reflection of an agency problem that forms the basis for Principle 7:The Agency Problem—Managers won’t work for owners unless it’s in their best interest.
R E M O V A L O F I N E F F E C T I V E M A N A G E M E N T
A merger can result in the replacement of inefficient operations, whether in productionor management. If a firm with ineffective management can be acquired, it may be possi-ble to replace the current management with a more efficient management team, andthereby create wealth. This may be the case with firms that have grown from solely pro-duction into production and distribution companies, or R&D firms that have expandedinto production and distribution; the managers simply may not know enough about thenew aspects of the firm to manage it effectively.
I N C R E A S E D M A R K E T P O W E R
The merger of two firms can result in an increase in market or monopoly power.Although this can result in increased wealth, it may also be illegal. The Clayton Act, asamended by the Celler-Kefauver Amendment of 1950, makes any merger illegal that
23-5 PA R T 6 S P E C I A L T O P I C S I N F I N A N C E
results in a monopoly or substantially reduces competition. The Justice Department andthe Federal Trade Commission monitor all mergers to ensure that they do not result in areduction of competition.
R E D U C T I O N I N B A N K R U P T C Y C O S T S
There is no question that diversification can reduce the chance of financial failure andbankruptcy. Furthermore, there is a cost associated with bankruptcy. First, if a firm failsand the firm’s assets are liquidated, the forced sale frequently results in depressedprices. Moreover, the amount of money actually available for distribution to stockhold-ers is further reduced by selling costs and legal fees that must be paid. Finally, theopportunity cost associated with the delays related to the legal process further reducesthe funds available to the shareholder. Therefore, because costs are associated withbankruptcy, reduction of the chance of bankruptcy adds value. See the Focus onHarley-Davidson box.
The risk of bankruptcy also entails indirect costs associated with changes in thefirm’s debt capacity and the cost of debt. As the firm’s cash-flow patterns stabilize, therisk of default will decline, giving the firm an increased debt capacity and possiblyreducing the cost of its debt. Because interest payments are tax deductible, they providevaluable tax savings. Thus, monetary benefits are associated with an increased debtcapacity. These indirect costs of bankruptcy also spread out into other areas of the firm,affecting things like production and the quality and efficiency of management. Firmswith higher probabilities of bankruptcy may have a more difficult time recruiting andretaining quality managers and employees because jobs with that firm are viewed as lesssecure. This in turn may result in less productivity for these firms. In addition, firmswith higher probabilities of bankruptcy may have a more difficult time marketing theirproduct because of customer concern over future availability of the product. In short,there are real costs to bankruptcy. If a merger reduces this possibility of bankruptcy, itcreates wealth.
A F O C U S O N HARLEY-DAVIDSON
R O A D R U L E S
We acquired Holiday Rambler, a recreational vehicle busi-ness, in December of 1986. The acquisition doubled the sizeof our company. In January 1996, some 10 years later, we soldthe business. It was a great firm, and the company did wellafter it was acquired. We decided to sell the company becausewe came to understand that we are a motorcycle company andwe didn’t really understand the RV business. We made a lot ofassumptions and most of them were wrong, but we learnedfrom them. For example, we thought with our great manufac-turing expertise that we could bring some cost efficiencies andbetter quality. We were right on the quality side, but missedthe mark in reducing cost considerably. In contrast, we are ina more value added environment in the motorcycle business.
We also thought we could help with their dealer distri-bution, where we thought we were pretty good. But none
of their dealers were single line dealers, as were most ofour Harley-Davidson dealers. Even their corporate-owned stores were not single line dealers, and that was adifferent environment than we were used to. We learnedthat it was not a natural progression to go from a Harleyto an RV.
Holiday Rambler also had a great management team,but after the sale, their owner retired, then the CFOretired, and the person in charge of manufacturing left.Consequently, we lost most of the top management. Welearned a lot of lessons on that one, primarily, the manage-ment is the key to any operation.
Source: Based on an interview with Jim Ziemer, CFO, Harley-Davidson,October 23, 2000.
HARLEY-DAVIDSON CFO JIM ZIEMER TALKS ABOUT THE ACQUISITION AND SALE OF HOLIDAY RAMBLER

C H A P T E R 2 3 C O R P O R AT E R E S T R U C T U R I N G : C O M B I N AT I O N S A N D D I V E S T I T U R E S 23-6
B U Y I N G B E L O W R E P L A C E M E N T C O S T
Situations sometimes arise where it is cheaper to acquire an entire company than toacquire the assets the company owns. For example, in the 1980s, many corporate raiderswere driven by the fact that it was less expensive to purchase assets through an acquisitionthan it was to obtain those assets in any other way. This was particularly true of both con-glomerates and oil companies. For conglomerates, corporate raiders found that theyoften sold for less than the sum of the market value of their parts. Much of the mergerand acquisition activity associated with oil companies was driven by the fact that it wascheaper to acquire new oil reserves by purchasing a rival oil company than it was throughexploration. If assets are mispriced, as this approach seems to suggest, then identifyingthose assets and revealing this information about the undervalued assets to an investormay result in the creation of wealth.
It should be noted that the free cash-flow theory could explain this creation of wealth aseasily as a mispricing theory. In particular, the oil industry was characterized in the late1970s and early 1980s by high prices that provided high levels of cash flow. These resourceswere used to finance overexploration and drilling activity in the face of falling oil consump-tion. In addition, many oil firms engaged in diversification programs in which they acquiredretail, computer software, and other very diverse firms. Thus, as mergers and restructuringraged through the oil industry, wealth was created through the elimination of wastefulexploration expenditures and the divesture of unrelated businesses.
C O N C E P T C H E C K1. Describe the potential sources of value from the merger of two firms.2. What is the “chop-shop” approach to firm valuation and how is it useful in
thinking about the sources of value from a merger?
D E T E R M I N A T I O N O F A F I R M ’ S V A L U E
One of the first problems in analyzing a potential merger involves placing a value on theacquired firm. This task is not easy. The value of a firm depends not only on its cash-flowgeneration capabilities, but also upon the operating and financial characteristics of theacquiring firm. As a result, no single dollar value exists for a company. Instead, a range ofvalues is determined that would be economically justifiable to the prospective acquirer.The final price is then negotiated by the two managements.
To determine a reasonable price for a corporation, several factors are carefully evalu-ated. We know that the objective of the acquiring firm should be maximization of itsstockholders’ wealth (stock price). However, quantifying the relevant variables for thispurpose is difficult at best. For instance, the primary reason for a merger might be toacquire managerial talent or to complement a strong sales staff with an excellent produc-tion department. These synergistic effects are difficult to measure using the historical dataof the companies involved. We consider four approaches to valuing an acquisition candi-date. These include (1) book value, (2) appraisal value, (3) “chop-shop” or “break-up”value, and (4) “free cash flow” or “going concern” value.
B O O K V A L U E
The book value of a firm’s net worth is simply the owners’ equity account on the balancesheet. That is, the balance sheet amount of the assets less its outstanding liabilities. Forexample, if a firm’s assets measured at their historical cost less accumulated depreciation
O b j e c t i v e 2
Book valueGenerally used in this contextto refer to the book orhistorical cost value of thefirm’s net worth.

23-7 PA R T 6 S P E C I A L T O P I C S I N F I N A N C E
Appraisal valueThe worth of a company asdetermined by an independentappraiser. Appraisers use avariety of methods todetermine the value of a firm;however, replacement value ofthe firm’s assets is often thebasis for the appraisal value.
Chop-shop or break-upvalueFirm value is estimated bydetermining the value of thedifferent business segments ofthe firm. Segment value iscomputed by applying averagevaluation ratios of pure-playcompanies to the variousbusiness segments of the firm.Firm value is then calculated asthe sum of the segment values.
2 The assets of a financial company and a natural resources firm largely consist of securities and natural reserves,respectively. The value of these individual assets has a direct bearing on the firm’s earning capacity. Also, a companyoperating at a loss may only be worth its liquidation value, which would approximate the appraisal value.
are $10 million and the firm’s debt totals $4 million, the aggregate book value of thefirm’s equity is $6 million. Furthermore, if 100,000 shares of common stock are outstand-ing, the book value per share is $60 ($6 million ÷ 100,000 shares).
Book value does not measure the market value of a company’s net worth, because it isbased on the historical cost of the firm’s assets. Seldom do such costs bear a relationshipto the value of the organization or its ability to produce earnings.
Although the book value of an enterprise is clearly not the most important factor, itshould not be overlooked. It can be used as a starting point to be compared with otheranalyses. Also, a study of the firm’s working capital is particularly important to acquisi-tions involving a business consisting primarily of liquid assets like financial institutions.Furthermore, in industries where the ability to generate earnings requires large invest-ments in such items as steel, cement, and petroleum, the book value could be a criticalfactor, especially where plant and equipment are relatively new.
A P P R A I S A L V A L U E
An appraisal value of a company may be acquired from an independent appraisal firm. Thetechniques used by appraisers vary widely; however, this value is often closely tied to thereplacement cost of the firm’s assets. This method of analysis is not adequate by itself, becausethe value of individual assets may have little relation to the firm’s overall ability to generatecash flow, and thus the going-concern value of the firm. However, the appraised value of anenterprise may be beneficial when used in conjunction with other valuation methods. Also,the appraised value may be an important factor in special situations, such as in financial com-panies, natural resource enterprises, or organizations that have been operating at a loss.2
The use of appraisal values does yield several additional advantages. The value accord-ing to independent appraisers may permit the reduction of accounting goodwill by increas-ing the recognized worth of specific assets. Goodwill results when the purchase price of a firmexceeds the book value of the assets. Consider a company having a book value of $60,000that is purchased for $100,000 (the $40,000 difference is goodwill). The $60,000 book valueconsists of $20,000 in working capital and $40,000 in fixed assets. However, an appraisalmight suggest that the current values of these assets are $25,000 and $55,000, respectively.The $15,000 increase ($55,000 − $40,000) in fixed assets permits the acquiring firm torecord a larger depreciation expense than would otherwise be possible, thereby reducingtaxes. A second reason for an appraisal is to provide a test of the reasonableness of resultsobtained through methods based upon the going-concern concept. Third, the appraisermay uncover strengths and weaknesses that otherwise might not be recognized, such as inthe valuation of patents, secret processes, and partially completed R&D expenditures.
“ C H O P - S H O P ” O R B R E A K - U P V A L U E
The “chop-shop” approach to valuation was first proposed by Dean Lebaron and LawrenceSpeidell of Batterymarch Financial Management. Specifically, it attempts to identify multi-industry companies that are undervalued and would be worth more if separated into parts.Very simply, this approach entails attempting to buy assets below their replacement cost.
Any time we confront a technique that suggests that stocks may be inefficientlypriced, we should be skeptical. In the case of a multi-industry firm, inefficiency in pricingmay be brought on by the high cost of obtaining information. Alternatively, these firmsmay be worth more if split up because of agency problems. Shareholders of multi-industry companies may feel they have less control of the firm’s managers, because addi-
C H A P T E R 2 3 C O R P O R AT E R E S T R U C T U R I N G : C O M B I N AT I O N S A N D D I V E S T I T U R E S 23-8
tional layers of management may have developed with multi-industry firms. Theseagency costs may take the form of increased expenditures necessary to monitor the man-agers, costs associated with organizational change, and opportunity costs associated withpoor decisions made as a result of the manager acting in his or her own best interestsrather than the best interest of the shareholders.
The “chop-shop” approach attempts to value companies by their various businesssegments. As it is implemented by Batterymarch, it first attempts to find “pure-play”companies—that is, companies in a single industry from which it computes average “valua-tion ratios.” The ratios frequently used compare total capitalization (debt plus equity) tototal sales, to assets, and to income. In effect, these ratios represent the average value of a dol-lar of sales, a dollar of assets, and a dollar of income for a particular industry based on theaverage of all pure-play companies in that industry. Assuming that these ratios apply to thevarious business segments of a multi-industry firm, the firm can then be valued by its parts.
For the chop-shop valuation technique to be feasible, we must naturally have infor-mation about the various business segments within the firm. This requirement is fulfilled,at least in part, by the reporting rules set forth in Statement 14 of the FinancialAccounting Standards Board (the public accountants’ governing group). This standardrequires that firms provide detailed accounting statements along the various lines of busi-ness or what is called Standard Industrial Codes (SIC). Of course, we know that not allfirms in the same industry are in fact the same—some have more growth potential orearning ability than others. As such, this methodology should be used cautiously.
The “chop-shop” approach involves three steps.
Step 1. Identify the firm’s various business segments and calculate the average capi-talization ratios for firms in those industries.
Step 2. Calculate a “theoretical” market value based upon each of the average capi-talization ratios.
Step 3. Average the “theoretical” market values to determine the “chop-shop” valueof the firm.
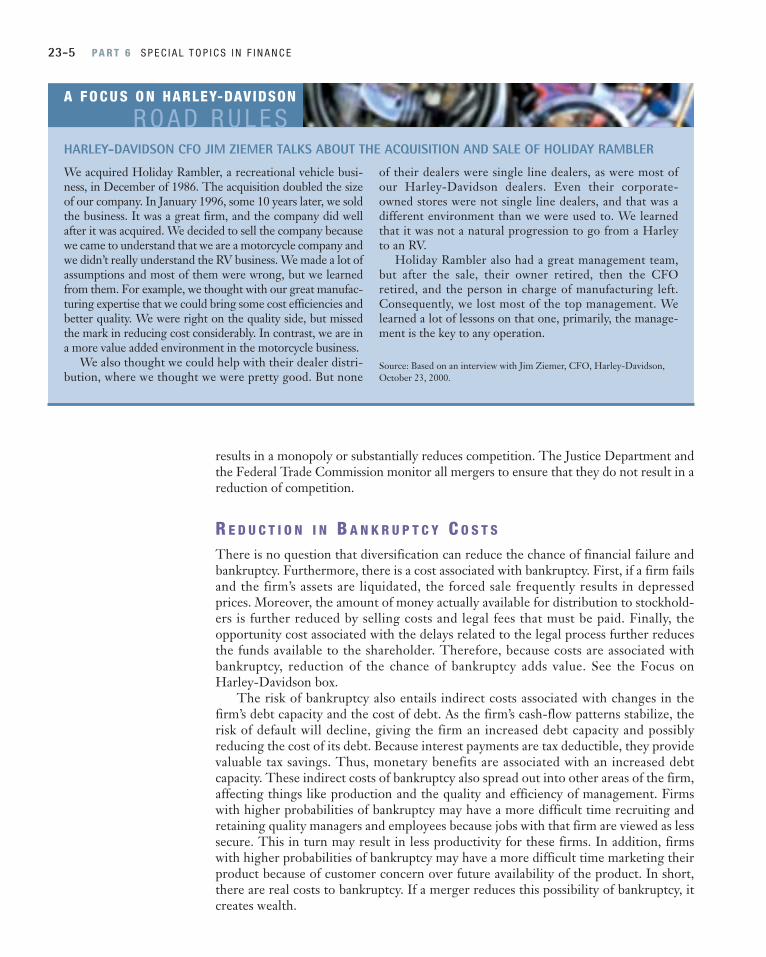
E X A M P L E : B U S I N E S S VA L U A T I O N : “ C H O P S H O P ” M E T H O D
To illustrate the chop-shop approach, consider Cavos, Inc., with common stock cur-rently trading at a total market price of $13 million. For Cavos, the accounting data setforth four business segments: industrial specialties, basic chemicals, consumer special-ties, and basic plastics. Data for these four segments are as follows:
S E G M E N T
B U S I N E S S S A L E S A S S E T S I N C O M E S E G M E N T ( $ 0 0 0 ) ( $ 0 0 0 ) ( $ 0 0 0 )
Industrial specialties $ 2,765 $2,206 $186Basic chemicals 5,237 4,762 165Consumer specialties 2,029 1,645 226Basic plastics 1,506 1,079 60_______ ______ ____Total $11,537 $9,692 $637_______ ______ ___________ ______ ____
The three steps for valuing Cavos would be:
Step 1. We first identify “pure-play” companies, those being firms that operatesolely in one of the above industries; we then calculate the average capital-ization ratios for those firms. This could easily be done using a computer
(continued)

23-9 PA R T 6 S P E C I A L T O P I C S I N F I N A N C E
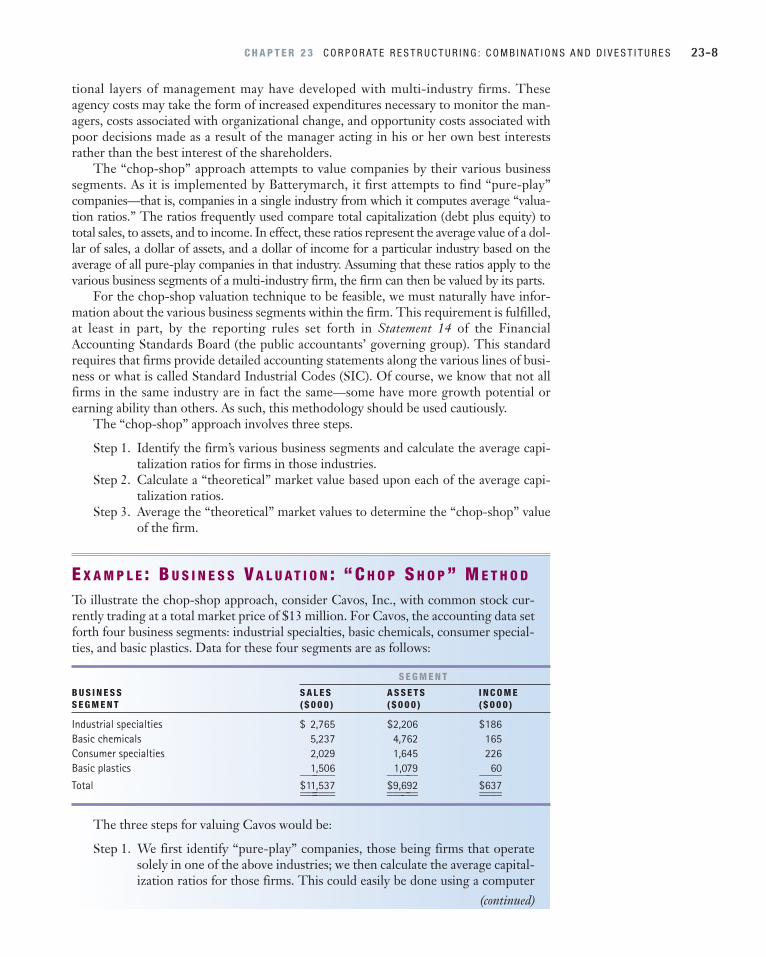
TA B L E 2 3 - 2 Calculation of the “Theoretical Value” for Cavos, Inc., Using MarketCapitalization Ratios
VA L U E B A S E D O N M A R K E T C A P I TA L I Z AT I O N / S A L E S
( A ) ( B ) ( A ) × ( B ) B U S I N E S S M A R K E T S E G M E N T T H E O R E T I C A L S E G M E N T C A P I TA L I Z AT I O N / S A L E S S A L E S M A R K E T VA L U E
Industrial specialties 0.61 $2,765 $ 1,686.7Basic chemicals 2.29 5,237 11,992.7Consumer specialties 3.58 2,029 7,263.8Basic plastics 1.71 1,506 2,575.3________
Total $23,518.5________________
VA L U E B A S E D O N M A R K E T C A P I TA L I Z AT I O N / A S S E T S
( A ) ( B ) ( A ) × ( B ) B U S I N E S S M A R K E T S E G M E N T T H E O R E T I C A L S E G M E N T C A P I TA L I Z AT I O N / A S S E T S A S S E T S M A R K E T VA L U E
Industrial specialties 1.07 $2,206 $ 2,360.4Basic chemicals 2.43 4,762 11,571.7Consumer specialties 2.92 1,645 4,803.4Basic plastics 2.18 1,079 2,352.2________
Total $21,087.7________________
VA L U E B A S E D O N M A R K E T C A P I TA L I Z AT I O N / I N C O M E
( A ) ( B ) ( A ) × ( B ) B U S I N E S S M A R K E T S E G M E N T T H E O R E T I C A L S E G M E N T C A P I TA L I Z AT I O N / I N C O M E I N C O M E M A R K E T VA L U E
Industrial specialties 21.49 $186 $ 3,997.1Basic chemicals 17.45 165 2,879.3Consumer specialties 19.26 226 4,352.8Basic plastics 15.06 60 903.6________
Total $12,132.8________________
database, such as the Computstat tapes, which provide detailed financialinformation on most publicly traded firms. The average capitalizationratios for Cavos’s four business segments have been determined and are asshown in Table 23-1.
Step 2. Once we have calculated the average market capitalization ratios for thevarious market segments, we need only multiply Cavos’s segment values(that is, segment sales, segment assets, and segment income) times thecorresponding capitalization ratios to determine the theoretical marketvalues. This is done in Table 23-2.
TA B L E 2 3 - 1 Average Capitalization Ratios for Industries in Which Cavos, Inc., Is Active
B U S I N E S S C A P I TA L I Z AT I O N / C A P I TA L I Z AT I O N / C A P I TA L I Z AT I O N /S E G M E N T S A L E S A S S E T S O P E R AT I N G I N C O M E
Industrial specialties 0.61 1.07 21.49Basic chemicals 2.29 2.43 17.45Consumer specialties 3.58 2.92 19.26Basic plastics 1.71 2.18 15.06
C H A P T E R 2 3 C O R P O R AT E R E S T R U C T U R I N G : C O M B I N AT I O N S A N D D I V E S T I T U R E S 23-10
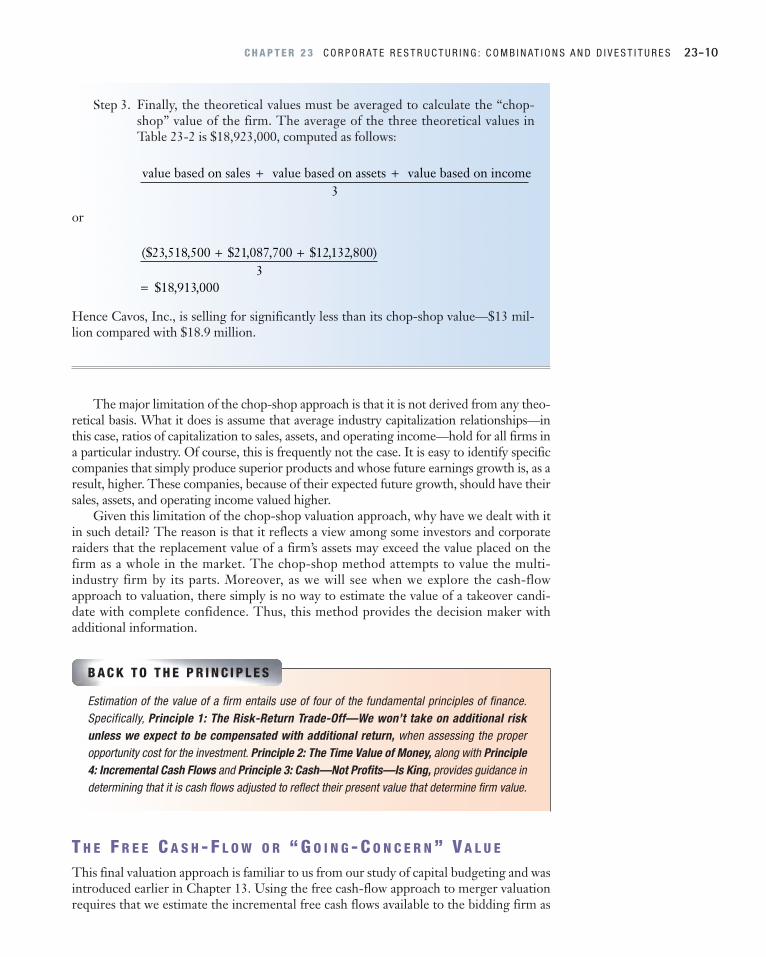
Step 3. Finally, the theoretical values must be averaged to calculate the “chop-shop” value of the firm. The average of the three theoretical values inTable 23-2 is $18,923,000, computed as follows:
or
Hence Cavos, Inc., is selling for significantly less than its chop-shop value—$13 mil-lion compared with $18.9 million.
The major limitation of the chop-shop approach is that it is not derived from any theo-retical basis. What it does is assume that average industry capitalization relationships—inthis case, ratios of capitalization to sales, assets, and operating income—hold for all firms ina particular industry. Of course, this is frequently not the case. It is easy to identify specificcompanies that simply produce superior products and whose future earnings growth is, as aresult, higher. These companies, because of their expected future growth, should have theirsales, assets, and operating income valued higher.
Given this limitation of the chop-shop valuation approach, why have we dealt with itin such detail? The reason is that it reflects a view among some investors and corporateraiders that the replacement value of a firm’s assets may exceed the value placed on thefirm as a whole in the market. The chop-shop method attempts to value the multi-industry firm by its parts. Moreover, as we will see when we explore the cash-flowapproach to valuation, there simply is no way to estimate the value of a takeover candi-date with complete confidence. Thus, this method provides the decision maker withadditional information.
($ , , $ , , $ , , )
$ , ,
23 518 500 21 087 700 12132 8003
18 913 000
+ +
=
value based on sales value based on assets value based on income+ +3
T H E F R E E C A S H - F L O W O R “ G O I N G - C O N C E R N ” V A L U E
This final valuation approach is familiar to us from our study of capital budgeting and wasintroduced earlier in Chapter 13. Using the free cash-flow approach to merger valuationrequires that we estimate the incremental free cash flows available to the bidding firm as
B A C K T O T H E P R I N C I P L E S
Estimation of the value of a firm entails use of four of the fundamental principles of finance.Specifically, Principle 1: The Risk-Return Trade-Off—We won’t take on additional riskunless we expect to be compensated with additional return, when assessing the properopportunity cost for the investment. Principle 2: The Time Value of Money, along with Principle4: Incremental Cash Flows and Principle 3: Cash—Not Profits—Is King, provides guidance indetermining that it is cash flows adjusted to reflect their present value that determine firm value.
23-11 PA R T 6 S P E C I A L T O P I C S I N F I N A N C E
a result of the merger or acquisition. The present value of these cash flows then will bedetermined, and this will be the maximum amount that should be paid for the target firm.The initial outlay then can be subtracted out to calculate the net present value from themerger. Although this is very similar to a capital-budgeting problem, there are differ-ences, particularly in estimating the initial outlay.
Finding the present value of the free cash flows for a merger involves a five-stepprocess:
Step 1. Estimate the incremental after-tax free cash flows available from the targetfirm. This includes all synergistic cash flows (including those to both the bid-ding and target firms) created as a result of the acquisition. It should also benoted that interest expenses are not included in these cash flows, as they areaccounted for in the required rate of return.
Step 2. Estimate the after-tax risk-adjusted discount rate associated with cash flowsfrom the target firm. The target firm’s, not the bidding firm’s, required rate ofreturn is appropriate here. The reason is that we are acquiring the target firm,thus its financial and operating risk characteristics are relevant to its valuation.If there is any anticipated change in financing policy associated with the targetfirm as a result of the acquisition, this change should also be considered.
Step 3. Calculate the present value of the incremental free cash flows from the targetfirm.
Step 4. Estimate the initial outlay associated with the acquisition. The initial outlayis defined here as the market value of all securities and cash paid out plus themarket value of all liabilities assumed.
Step 5. Calculate the net present value of the acquisition by subtracting the initial out-lay from the present value of the incremental cash flows from the target firm.
Estimation of the incremental after-tax cash flows resulting from an acquisition isoften difficult. Thus, a certain lack of precision is inherent in these calculations becauseof the problem of estimating the synergistic gains from combining the two firms. Forexample, it is very difficult to estimate the gains that might be expected from any reduc-tion in bankruptcy costs, increased market power, or reduction in agency costs thatmight occur. Still, it is imperative that we attempt to estimate these gains if we are toplace a proper value on the target firm. Once the required rate of return is determined,the present value of the incremental cash flows from acquiring the target firm can thenbe calculated. The final step then becomes the calculation of the initial outlay associ-ated with the acquisition.
E X A M P L E : B U S I N E S S V A L U A T I O N : “ F R E E C A S H F L O W ” M E T H O D
Let’s look at the valuation of Tabbypaw Pie, Inc., which is being considered as a possi-ble takeover target by ALF, Inc., as an illustration of cash flow or going-concern valu-ation. Currently, Tabbypaw Pie uses 30 percent debt in its capital structure, but ALFplans on increasing the debt ratio to 40 percent (we will assume that only debt andequity are used) once the acquisition is completed. The after-tax cost of debt capitalfor Tabbypaw Pie is estimated to be 7 percent, and we will assume that this rate doesnot change as Tabbypaw’s capital structure changes. The cost of equity after the acqui-sition is expected to be 20.8 percent. The current market value of Tabbypaw’s debtoutstanding is $110 million, all of which will be assumed by ALF. Also, let’s assumethat ALF intends to pay $260 million in cash and common stock for all of Tabbypaw

C H A P T E R 2 3 C O R P O R AT E R E S T R U C T U R I N G : C O M B I N AT I O N S A N D D I V E S T I T U R E S 23-12
TA B L E 2 3 - 3 Estimated Incremental Cash Flows from Tabbypaw Pie, Inc. ($ millions)
2 0 0 8 A N D 2 0 0 4 2 0 0 5 2 0 0 6 2 0 0 7 T H E R E A F T E R
Net sales $496 $536 $606 $670 $731Cost of goods sold 354 385 444 500 551Administrative and
selling expenses 28 30 32 35 38____ ____ ____ ____ ____Earnings before
depreciation and interest 114 121 130 135 142Depreciation 39 40 41 42 43____ ____ ____ ____ ____Earnings before interest
and taxes 75 81 89 93 99Taxes (incremental) 27 30 34 36 39____ ____ ____ ____ ____Net income 48 51 55 57 60+ Depreciation 39 40 41 42 43− Capital expenditures 24 25 26 27 28____ ____ ____ ____ ____Free cash flow
(before interest) $ 63 $ 66 $ 70 $ 72 $ 75____ ____ ____ ____ ________ ____ ____ ____ ____
Pie’s stock in addition to assuming all of Tabbypaw’s debt. Currently, the market priceof Tabbypaw Pie’s common stock is $210 million.
Step 1. Estimate the incremental cash flows from the target firm, including thesynergistic flows, such as any possible flows from tax credits. This estima-tion for Tabbypaw is provided in Table 23-3. Here we are assuming thatany cash flows after 2005 will be constant at $75 million. Also, we subtractany funds that must be reinvested in the firm in the form of capital expen-ditures that are required to support the firm’s increasing profits.
Step 2. Determine an appropriate risk-adjusted discount rate for evaluatingTabbypaw. Here we will use the weighted cost of capital (kwacc) forTabbypaw as our discount rate, where the weighted cost of capital is calcu-lated as
kwacc = wdkd (1 − T ) + wckc
where Wd, Wc = the percentage of funds provided by debt and common,respectively, and Kd, Kc = the cost of debt and common, respectively, and T = the corporate tax rate.
For Tabbypaw,
kwacc = (.40)(.07) + (.60)(.208) = .1528 or 15.28%
Step 3. Next we must calculate the present value of the incremental cash flowsexpected from the target firm, as given in Table 23-3. Assuming that cashflows do not change after 2005, but continue at the 2005 level in perpetu-ity, and discounting these cash flows at the 15.28 percent weighted aver-age cost of capital, we get:
present valueof all cash flows
present valueof 2004 2007
cash flows
present valueof cash flows
after 2007
= −
+
(continued)
23-13 PA R T 6 S P E C I A L T O P I C S I N F I N A N C E
C O N C E P T C H E C K1. What is the relevance of a firm’s book value in valuing the enterprise?2. Appraisal value is associated with the replacement cost of a firm’s assets. Explain.3. Briefly describe the steps involved in carrying out a “chop-shop” valuation.4. Relate the free cash-flow valuation method to our discussions of capital budgeting.5. What is the “chop-shop” approach to firm valuation and how is it useful in
thinking about the sources of value from a merger?
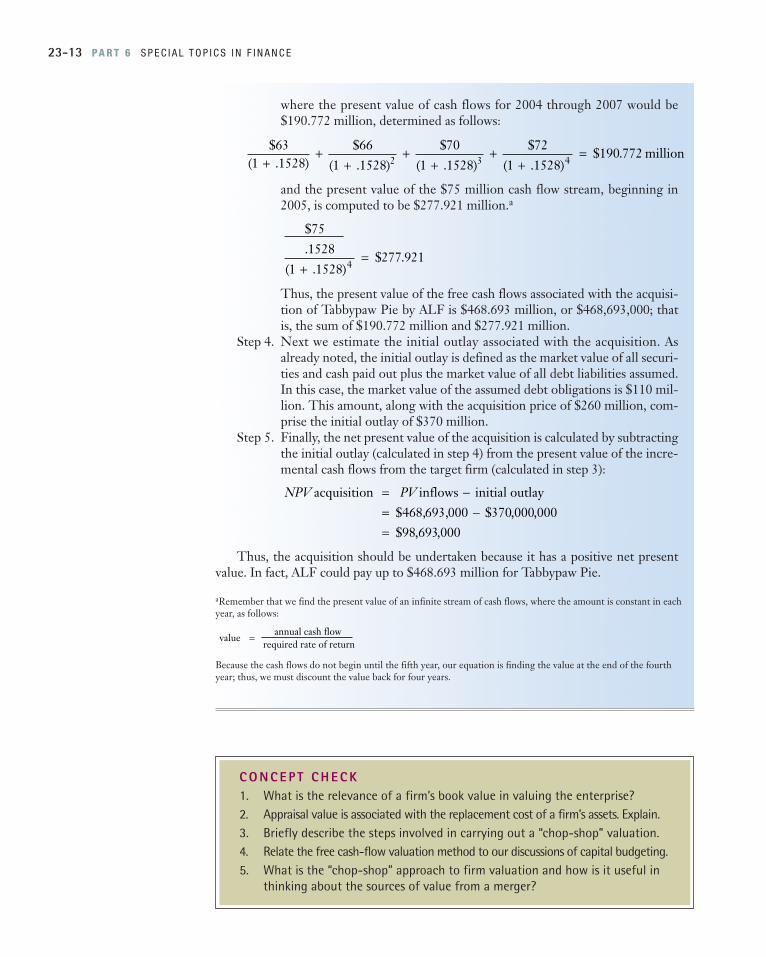
where the present value of cash flows for 2004 through 2007 would be$190.772 million, determined as follows:
and the present value of the $75 million cash flow stream, beginning in2005, is computed to be $277.921 million.a
Thus, the present value of the free cash flows associated with the acquisi-tion of Tabbypaw Pie by ALF is $468.693 million, or $468,693,000; thatis, the sum of $190.772 million and $277.921 million.
Step 4. Next we estimate the initial outlay associated with the acquisition. Asalready noted, the initial outlay is defined as the market value of all securi-ties and cash paid out plus the market value of all debt liabilities assumed.In this case, the market value of the assumed debt obligations is $110 mil-lion. This amount, along with the acquisition price of $260 million, com-prise the initial outlay of $370 million.
Step 5. Finally, the net present value of the acquisition is calculated by subtractingthe initial outlay (calculated in step 4) from the present value of the incre-mental cash flows from the target firm (calculated in step 3):
Thus, the acquisition should be undertaken because it has a positive net presentvalue. In fact, ALF could pay up to $468.693 million for Tabbypaw Pie.
aRemember that we find the present value of an infinite stream of cash flows, where the amount is constant in eachyear, as follows:
Because the cash flows do not begin until the fifth year, our equation is finding the value at the end of the fourth year; thus, we must discount the value back for four years.
value annual cash flow
required rate of return=
NPV PV acquisition inflows initial outlay$468,693,000
= −= −=
$ , ,$ , ,
370 000 00098 693 000
$75 .
( . )$ .
15281 1528
277 9214+
=
$( . )
$( . )
$( . )
$( . )
$ .63
1 152866
1 152870
1 152872
1 1528190 772
2 3 4++
++
++
+= million

C H A P T E R 2 3 C O R P O R AT E R E S T R U C T U R I N G : C O M B I N AT I O N S A N D D I V E S T I T U R E S 23-14
Sell-offThe sale of a subsidary,division, or product line by onefirm to another.
Spin-offThe separation of a subsidaryfrom its parent, with no changein the equity ownership. Themanagement of the parentcompany gives up operatingcontrol over the assets involvedin the spin-off but thestockholders retain ownership,albeit through shares of thenewly created spin-offcompany.
3 See Robert Comment and Gregg A. Jarrell, 1995, “Corporate Focus and Stock Returns,” Journal of FinancialEconomics 37: 67–87; and Kose John and Eli Ofek, 1995, “Asset Sales and Increase in Focus,” Journal of FinancialEconomics 37: 105–26.4 Joel M. Stern and Donald H. Chew, Jr. (eds.), The Revolution in Corporate Finance (New York: Basis Blackwell, 1986): 416.
D I V E S T I T U R E S
Although the merger-and-acquisition phenomenon has been a major influence in restruc-turing the corporate sector, divestitures, or what we might call “reverse mergers,” mayhave become an equally important factor. In fact, preliminary research to date would sug-gest that we may be witnessing a new era in the making—one where the public corpora-tion has become a more efficient vehicle for increasing and maintaining stockholderwealth.3 Whereas corporate management once seemed to behave as if 2 + 2 were equal to5, especially during the conglomerate heyday of the 1960s, the wave of reverse mergersseems based on the counterproposition that 5 − 1 is 5. And the market’s consistently posi-tive response to such deals seems to be providing broad confirmation of the “new math.”4
A successful divestiture allows the firm’s assets to be used more efficiently and there-fore to be assigned a higher value by the market forces. It essentially eliminates a divisionor subsidiary that does not fit strategically with the rest of the company; that is, itremoves an operation that does not contribute to the company’s basic purposes.
The different types of divestitures may be summarized as follows:
1. Sell-off. A sell-off is the sale of a subsidiary, division, or product line by one companyto another. For example, Radio Corporation of America (RCA) sold its finance com-pany and General Electric sold its metallurgical coal business.
2. Spin-off. A spin-off involves the separation of a subsidiary from its parent, with nochange in the equity ownership. The management of the parent company gives upoperating control of the subsidiary, but the shareholders retain the same percentageownership in both firms. New shares representing ownership in the diverted assetsare issued to the original shareholders on a pro-rata basis.
3. Liquidation. A liquidation in this context is not a decision to shut down or abandonan asset. Rather, the assets are sold to another company, and the proceeds are distrib-uted to the stockholders.
4. Going private. A company goes private when its stock that has traded publicly ispurchased by a small group of investors, and the stock is no longer bought and soldon a public exchange. The ownership of the company is transferred from a diversegroup of outside stockholders to a small group of private investors, usually includingthe firm’s management. The leveraged buyout is a special case of going private. In aleveraged buyout, the existing shareholders sell their shares to a small group ofinvestors. The purchasers of the stock use the firm’s unused debt capacity to borrowthe funds to pay for the stock. Thus, the new investors acquire the firm with little, ifany, personal investment. However, the firm’s debt ratio may increase by as much astenfold. Often the objective is to reorganize the company (sometimes selling of unre-lated businesses) and bringing the company back public in a few years. See the BestPractices box, “Corporate Boards of Directors,” and the Finance Matters box, “TheGrowing Importance of Multinational Corporations in the World Economy.”
C O N C E P T C H E C K1. What is a reverse merger?2. How does a sell-off differ from a spin-off?

23-15 PA R T 6 S P E C I A L T O P I C S I N F I N A N C E
B E S T
P R A C T I C E SCORPORATE BOARDS OF DIRECTORS
ment. Both the NYSE and the Council of InstitutionalInvestors provide guidance for assessing independence. Ingeneral, to be an independent director the director cannot(i) be an employee of the firm or any of its subsidiaries, (ii) have any business relationship with the firm, (iii) beinvolved in any cross compensation committee link, and (iv) be a member of the immediate family of a corporateexecutive. Although these basic requirements for indepen-dent status may seem obvious, they have been regularly vio-lated on many boards of public firms.
Independence of director action is ultimately a functionof the power of management versus the directors and this isonly partially determined by economic ties. For example,where the firm’s CEO is also the company founder and hisor her visionary leadership is credited with the firm’s suc-cess, it is very difficult to gather a group of directors who arewilling to exercise their role as independent overseers of thefirm even where they have no personal conflicts of interestin doing so.
Director Expertise To perform their duties and responsibil-ities, directors must possess sufficient general businessknowledge and financial savvy to understand and evaluatethe firm’s performance. Furthermore, directors must alsopossess specific knowledge of the firm’s businesses if they areto provide effective oversight of the implementation of thefirm’s strategic plans.
Size of the Board The size of the board is also thought to bean important determinant of board effectiveness. Currenttrends suggest that a board comprised of seven to ninemembers (but certainly less than 10 to 12) is best. The prob-lem, it is argued, with larger boards is simply the time ittakes for each member to participate actively. Larger boardstend to discourage conversation among board members andmembers find themselves waiting for their turn to speak.However, good board practice would include the possibilityfor adding to the current board new members with particu-lar expertise needed to address the firm’s current and futureenvironment.
Committee Structure Boards are generally broken upinto working committees to carry out their duties. From acorporate governance point of view, the most importantcommittees are the audit, compensation, and governance/nominating committees. Since these committees play acrucial governance role, best practice recommendations
According to the Business Roundtable, the primary duty ofa firm’s board of directors is “to select a chief executiveofficer and to oversee the CEO and other senior manage-ment in the competent and ethical operation of the corpo-ration on a day-to-day basis.”a Other duties of the boardfall into four broad groups of activities: (i) board oversightof the firm’s business operations via the review of theimplementation of its strategic plan; (ii) managerial succes-sion planning; (iii) corporate governance oversight includ-ing compensating and appointing top executives of thecompany; and (iv) oversight of the firm’s corporate report-ing process (including the selection of an external auditorand oversight of company disclosures—financial state-ments and filings with regulatory authorities).
Best practice with regard to a firm’s board of directors isgenerally described in terms of three key attributes of theboard: board composition, director selection, and directorcompensation. The best practice guidelines we presenthere with respect to these key attributes come from a num-ber of sources including: industry groups (the NationalAssociation of Corporate Directors and the Organizationfor Economic Co-operation and Development), the orga-nized stock exchanges (NYSE and NASDAQ), publicaccounting firms (Price Waterhouse), and the Sarbanes-Oxley Act of 2002.
Board CompositionMost experts agree that there are at least four importantaspects of board composition: director independence, direc-tor expertise, board size, and committee structure.However, director independence has gained the most atten-tion for it is here that the potential for conflicts of interestarise and can affect a director’s ability to carry out his or herduties.
Director Independence An independent board is one that isnot beholden to management such that it can perform itsduties as an independent source of oversight for the firm’smanagement.b Independence is generally assessed in termsof whether board members are employed by or otherwisehave any economic dependence on the firm or its manage-
aThe Business Roundtable, Principles of Corporate Governance (May2002), p. iv.bThe National Association of Corporate Directors recommends the follow-ing in regard to board membership: “Boards should be comprised of a sub-stantial majority of ‘independent’ directors.”

C H A P T E R 2 3 C O R P O R AT E R E S T R U C T U R I N G : C O M B I N AT I O N S A N D D I V E S T I T U R E S 23-16
generally state that they be made up exclusively of outside/independent directors.
Audit Committee The audit committee has several key dutiesthat include (but are not limited to) overseeing the following:
• The reliability of the firm’s financial reports.• Effective internal controls over the financial reporting
process.• The process for monitoring compliance with regulatory
matters.• The process for monitoring compliance with the firm’s
code of corporate conduct.
Although audit committee duties can vary from firm to firm,their primary focus is on the firm’s financial reportingprocess. Recognizing the crucial importance of financialreporting to the health of the U.S. financial markets, theSarbanes-Oxley Act (2002) set forth a set of duties for publiccompany audit committees. Specifically, the Securities andExchange Commission is to direct the national securitiesexchanges and national securities associations, through list-ing standards, to require that the audit committee of eachlisted company:
• Be directly responsible for the appointment, compensa-tion, and oversight of auditors;
• Be composed solely of independent auditors;• Have in place procedures for receiving accounting com-
plaints and concerns; and• Have authority and appropriate funding to engage inde-
pendent counsel and other outside advisors.
According to the 1994 Principles of Corporate Governance,the American Law Institute said that audit committeesshould consist of at least three members. Similarly, the NewYork Stock Exchange (NYSE), National Association ofSecurities Directors (NASD), and American StockExchange (AMEX) require audit committees to have at leastthree members, and the Cadbury Committee recommendedthree members for UK firms.
Compensation Committee The compensation committee, asthe name suggests, oversees the firm’s compensation plansand programs. In particular, the compensation committeehas two fundamental and interrelated duties: overseeing thefirm’s compensation programs and setting CEO and seniormanagement compensation.
Governance/Nominating Committee Fewer than 60 percent ofpublic firms had nominating committees at the close of the
20th century and fewer than 25 percent had a corporate gov-ernance committee.c This committee oversees issues regard-ing corporate governance, including the statement of corpo-rate governance principles and the performance evaluationsof the board, its committees, and individual directors. All thesources of corporate best practice that we reviewed recom-mend that this committee be composed entirely of indepen-dent directors as this committee is central to the effectivefunctioning of the board.d
Director SelectionIf a firm’s independent directors are to be free of managerialinfluence then their selection must not be contingent onmanagement’s recommendations. Consequently, the direc-tor nominating process is crucial to the independence of afirm’s board. This logic underlies the importance of having aGovernance/Nominating committee made up entirely ofindependent directors.
Director CompensationTypical director compensation comes in two forms: astipend for each board meeting plus expenses and somecombination of options, stock, and cash. However, recenttrends have been toward cash and stock only. Furthermore,many firms have minimum equity investments for direc-tors and corporate executives. Director pay, like executivepay, often comes as short- and long-term compensationwith the former being comprised of cash and immediatestock and option grants, whereas the latter consist of cashand equity that become vested over time or with corporateperformance.
ResourcesBusiness Roundtable, Principles of Corporate Governance (May 2002).Committee on Governmental Affairs of the United States Senate, “The
Role of the Board of Directors in Enron’s Collapse,” Report preparedby the Permanent Subcommittee on Investigations, 107th Congress,2nd Session, Report 107-70 (May 7, 2002).
Council of Institutional Investors, Corporate Governance Policies (March25, 2002).
Organization for Economic Co-operation and Development, OECDPrinciples of Corporate Governance (1999).
Report of the New York Stock Exchange Corporate Accountability andListing Standards Committee (June 6, 2002).
Recommendations from the National Association of Corporate DirectorsConcerning Reforms in the Aftermath of the Enron Bankruptcy (May3, 2002).
Regulatory Requirements, the NASDAQ Stock Market, 2002.
cStuart L. Gillan, Jay C. Hartzell, and Laura T. Starks, “Industries,Investment Opportunities, and Corporate Governance Structures,”Unpublished paper (April 2003).
dFor example, this included sources as divergent as the New York StockExchange (Section 4 of the proposed amendments to Rule 303A) and theBusiness Roundtable.

23-17 PA R T 6 S P E C I A L T O P I C S I N F I N A N C E
H O W F I N A N C I A L M A N A G E R S U S E T H I S M A T E R I A L
Businesses grow in one of two ways. They acquire assets, or they acquire operatingfirms. This chapter is about the latter method and focuses on the financial conse-quences of acquiring and selling whole firms. The 1990s saw the largest wave of merg-ers and acquisitions ever in recorded economic history. In every transaction, there is abuyer and a seller who must come to agreement on the price at which the transactionwill take place.
Investment bankers as well as internal company analysts spend countless hours try-ing to arrive at what they think is the economic value of the target firm. We discussedfour basic approaches to valuing a business, and each is widely used in financial prac-tice. In fact, because business valuation is very difficult, the analyst will frequently usemultiple methods in an effort to learn more about the economic worth of the enter-prise. Frequently, the final valuation will be compared with market values of similarfirms of similar transactions relative to earnings or cash flow. These market value mul-tiples in conjunction with discounted cash-flow estimates provide the backbone of thevaluation process. See the Finance Matters box, “How Good was Enron’s CorporateGovernance?”
F I N A N C E
M AT T E R S
Multinational corporations are an important force behind theintegration of world markets, and they are growing rapidly. In1998, the most recent year for which the United Nations hasfigures, the rate of growth in investment by these firms wasroughly three times as fast as total investment.
Approximately half of all foreign direct investmentinvolves mergers and acquisitions. This activity allows themultinational firms to quickly achieve a presence in anothermarket and acquire economies of scale in marketing and dis-tribution. However, a disproportionate portion of all inter-
national mergers-and-acquisitions activity takes placeamong developed as opposed to undeveloped countries. As aconsequence, the United States is frequently a leading recip-ient of foreign direct investment as foreign enterprisesacquire U.S.-based companies.
Even multinational firms tend to do most of their busi-ness within their home market. The typical multinationalfirm produces more than two-thirds of its output and hastwo-thirds of its employees in its home country. The fivelargest multinational corporations are described as follows:
THE GROWING IMPORTANCE OF MULTINATIONAL CORPORATIONS IN THE WORLD ECONOMY
F O R E I G N F O R E I G N F O R E I G N A S S E T S A S S A L E S A S E M P L OY M E N T
C O M PA N Y I N D U S T RY % O F T O TA L % O F T O TA L A S % O F T O TA L
General Electric Electronics 36.1 28.6 44.4General Motors Automotive 29.6 32.1 Not availableRoyal Dutch/Shell Group Energy 60.9 53.2 59.8Ford Motor Company Automotive Not available 30.3 49.6Exxon Corporation Energy 71.6 80.3 Not availableAverages 49.6 44.9 51.3
These firms on average invest 50 percent of their assets out-of-country, receive 45 percent of their sales revenues from
abroad, and have 51 percent of their total workforceemployed in a foreign country.
Source: UNCTAD.

C H A P T E R 2 3 C O R P O R AT E R E S T R U C T U R I N G : C O M B I N AT I O N S A N D D I V E S T I T U R E S 23-18
F I N A N C E
M AT T E R S
Financial failures and financial reporting scandals atAdelphia, Enron, Global Crossings, Tyco, and others havemade investors very wary of corporate governance. As aresult, a number of firms including Standard & Poor’s,Moody’s, Institutional Shareholder Services, InvestorResponsibility Research Center, and GovernanceMetricsInternational are now providing corporate governance eval-uations. The idea is to rate firms in accordance with the like-lihood that they are being run by a management that heedsthe interests of stockholders.
Let’s begin our discussion by first defining what we meanby the term corporate governance. At a very rudimentary level,corporate governance deals with the ways in which suppliersof finance to corporations (i.e., outside investors) assurethemselves of getting their money back plus a return ontheir investment. In other words, corporate governance,encompasses all the ways in which stockholders address thefundamental principal-agent problem between stockholdersand managers. This encompasses the various checks and bal-ances that serve to constrain managerial discretion as well asthe compensation programs used to encourage managementto make value-enhancing choices.
Gompers et al. (2003) constructed a governance indexusing the 24 governance rules reported by the InvestorResponsibility Research Center. The 24 rules can be catego-rized into one of five groups: tactics for delaying hostile bid-ders; voting rights; director/officer protection; othertakeover defenses; and state laws. The index is constructedby adding one for each rule that serves to restrict share-holder rights and subtracting one for each rule that pro-motes shareholder rights (only two were considered positivein this regard—cumulative voting and secret ballot). The
index focuses on corporate control issues and as such reflectsthe power of managers over stockholders in the event of acontest for control of the firm. Consequently, this index rep-resents an indicator of the power sharing arrangementbetween the two groups.
To illustrate how the Gompers et al. (2003) index might beused to assess the quality of a firm’s corporate governance,consider the information on Enron and its peers found in theexhibit below.a Note that Enron’s governance index is lowerthan the average for its 2000 peer group firms for 1990–1995but is higher for 1998 and 2000. Since a high index value indi-cates more power for managers vis a vis the shareholders, thissuggests that Enron’s corporate governance actually deterio-rated over the period. In fact, Enron’s governance score is sig-nificantly higher than the peer group mean for the latter twoyears. We can also compare Enron to the sample mean for theentire sample of firms in the Gompers et al. study. In thesecomparisons (found in the last column) Enron exhibits a sig-nificantly lower index value (i.e., better governance) in1990–1995 and a significantly higher score for 1998, suggest-ing worse governance. Note that the Gompers et al. studydoes not analyze the year 2000. These comparisons seem to fitthe pattern observed by others when evaluating the failure ofEnron whereby the firm began engaging in a number of ques-tionable financing and reporting practices beginning in 1997.b
aPaul Gompers, Joy Ishii, and Andrew Metrick, 2003, “CorporateGovernance and Equity Prices,” The Quarterly Journal of Economics(February), 107–55.bStuart Gillan and John Martin, 2002, “Financial Engineering, CorporateGovernance and the Collapse of Enron,” (November)www.papers.ssrn.com/sol3/papers.cfm?abstract_id=354040.
HOW BAD WAS ENRON’S CORPORATE GOVERNANCE?
Governance Index Scores for Enron and Peer Firms—Selected Years 1990–2000
(T-STATISTICS FOR) ENRON COASTAL DOMINION DUKE EL LEVEL 3 OCCIDENTAL PACIFIC WILLIAMS PEER GRP ENRON VERSUSCORP. CORP. RESOURCES POWER PASO COM. PETROLEUM GAS & ELEC. COMPANY AVERAGE PEERS FULL SAMPLE
1990 8 9 11 6 12 NA 13 8 10 9.86 −2.04 −12.70*
1993 8 10 11 7 NA NA 12 8 10 9.67 −2.19 −17.10*
1995 9 11 11 7 9 NA 10 7 9 9.14 −0.23 −5.26*
1998 12 11 11 9 10 NA 9 NA 9 9.83 5.40* 40.78*
2000 12 11 11 11 10 10 9 NA 10 10.29 6.00* NA
Legend:
Governance Index—higher scores indicate greater management power whereas lower scores indicate higher shareholder power. Peer Grp. Average = averageof the governance indexes for all Enron’s peer firms for which data was available. NA—Not available. *Significant at the 1 percent level.
Source: Andrew Metrick’s Web site at Wharton.
23-19 PA R T 6 S P E C I A L T O P I C S I N F I N A N C E
Go To:www.prenhall.com/keownfor downloads and currentevents associated with thischapter
O b j e c t i v e 1
O b j e c t i v e 2
Corporate restructuring involves the combination of two or more businesses to form a new firm(merging) and the separation of a single firm into multiple new firms. The process of corporaterestructuring has been a critically important facet of the U.S. corporate system. It provides ameans for incorporating change into the economic system in ways that facilitate the reallocationof resources toward more productive uses.
Corporate restructuring activities tend to come in waves. During the 1960s, restructuringled to the formation of some of the largest conglomerate firms in U.S. financial history. In the1980s, behemoth corporate enterprises were bought (frequently in hostile takeovers) and thenbroken up as a part of what has come to be known as the bust-up takeover wave. In the nineties,we found ourselves in the midst of what has already proven to be the largest restructuring wavein U.S. history. This wave was marked by mergers resulting from consolidations of certain keyindustries such as banking and financial services, telecommunications, and defense contracting.Throughout all of these periods, the basic question is the same: Does the restructuring createshareholder wealth? So in this chapter, we have focused on two basic issues: “When does it makesense to engage in a merger (or its reverse)?” and “How much should the firm pay for an acqui-sition or demand for a divestiture?”
The assertion that merger activity creates wealth for the shareholder cannot be maintainedwith certainty. Only if the merger provides something that the investor cannot do on his or herown can a merger or acquisition be of financial benefit.
Determining the value of a firm is a difficult task. In addition to projecting the firm’s futureprofitability, which is a cornerstone in valuation, the acquirer must consider the effects of joiningtwo businesses into a single operation. What may represent a good investment may not be agood merger.
Valuing a potential acquisition, like valuing a proposed capital-budgeting expenditure, isboth an art and a science. We are essentially trying to forecast the future consequences of own-ership, which can never be known with precision. Consequently, we discussed four approaches todetermining the value of a company: (1) book value, (2) appraisal value, (3) “chop-shop” orbreak-up value, and (4) free cash-flow or “going-concern” value. Because there is always a mar-gin of error in the application of any valuation method, we suggested that the methods be used inconjunction with one another in an effort to learn more about the possible range of values for thefirm being valued.
K E Y T E R M SK E Y T E R M S
S U M M A R YS U M M A R Y
Appraisal value, 23-7Book value, 23-6
Chop-shop or break-upvalue, 23-7
Sell-off, 23-13Spin-off, 23-13
23-1. Why might merger activities create wealth?23-2. Why is book value alone an imperfect measure of the worth of a company?23-3. What advantages are provided by the use of an appraisal value in valuing a firm?23-4. What is the concept of the chop-shop valuation procedure?
S T U D Y Q U E S T I O N SS T U D Y Q U E S T I O N S
C H A P T E R 2 3 C O R P O R AT E R E S T R U C T U R I N G : C O M B I N AT I O N S A N D D I V E S T I T U R E S 23-20
23-5. Compare the NPV approach used in valuing a merger with the same approach in capitalbudgeting.23-6. Explain the different types of divestitures.
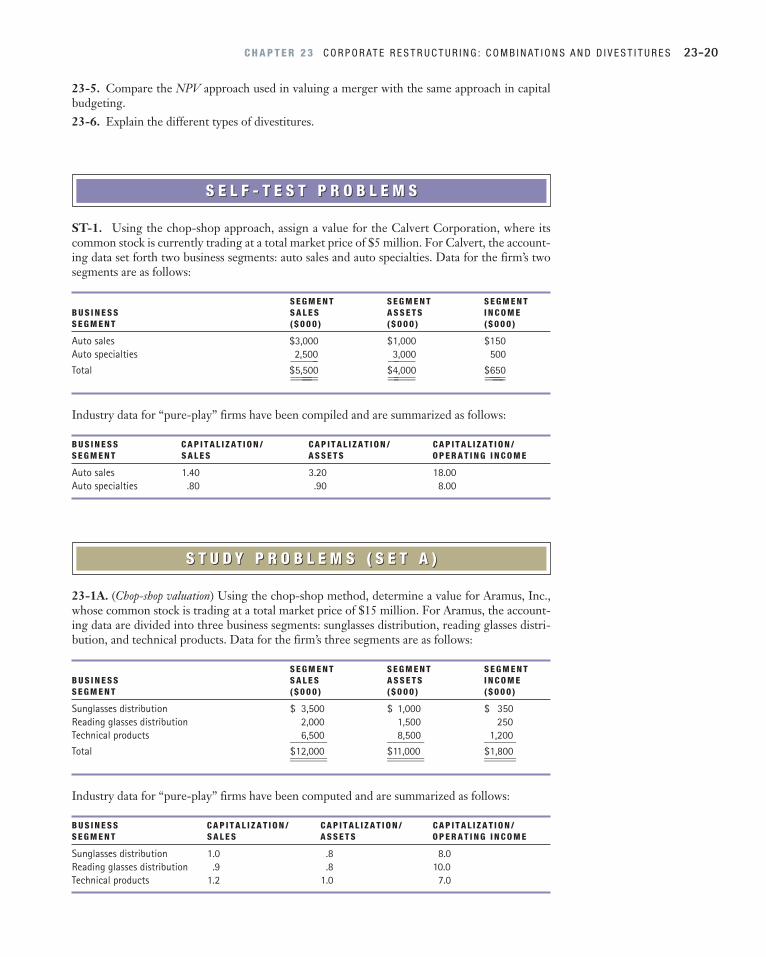
ST-1. Using the chop-shop approach, assign a value for the Calvert Corporation, where itscommon stock is currently trading at a total market price of $5 million. For Calvert, the account-ing data set forth two business segments: auto sales and auto specialties. Data for the firm’s twosegments are as follows:
S E G M E N T S E G M E N T S E G M E N T B U S I N E S S S A L E S A S S E T S I N C O M E S E G M E N T ( $ 0 0 0 ) ( $ 0 0 0 ) ( $ 0 0 0 )
Auto sales $3,000 $1,000 $150Auto specialties 2,500 3,000 500______ ______Total $5,500 $4,000 $650_______ ______ _____________ ______ ______
Industry data for “pure-play” firms have been compiled and are summarized as follows:
B U S I N E S S C A P I T A L I Z A T I O N / C A P I T A L I Z A T I O N / C A P I T A L I Z A T I O N /S E G M E N T S A L E S A S S E T S O P E R A T I N G I N C O M E
Auto sales 1.40 3.20 18.00Auto specialties .80 .90 8.00
23-1A. (Chop-shop valuation) Using the chop-shop method, determine a value for Aramus, Inc.,whose common stock is trading at a total market price of $15 million. For Aramus, the account-ing data are divided into three business segments: sunglasses distribution, reading glasses distri-bution, and technical products. Data for the firm’s three segments are as follows:
S E G M E N T S E G M E N T S E G M E N T B U S I N E S S S A L E S A S S E T S I N C O M E S E G M E N T ( $ 0 0 0 ) ( $ 0 0 0 ) ( $ 0 0 0 )
Sunglasses distribution $ 3,500 $ 1,000 $ 350Reading glasses distribution 2,000 1,500 250Technical products 6,500 8,500 1,200_______ _______ ______Total $12,000 $11,000 $1,800_______ _______ _____________ _______ ______
Industry data for “pure-play” firms have been computed and are summarized as follows:
B U S I N E S S C A P I T A L I Z A T I O N / C A P I T A L I Z A T I O N / C A P I T A L I Z A T I O N /S E G M E N T S A L E S A S S E T S O P E R A T I N G I N C O M E
Sunglasses distribution 1.0 .8 8.0Reading glasses distribution .9 .8 10.0Technical products 1.2 1.0 7.0
S T U D Y P R O B L E M S ( S E T A )S T U D Y P R O B L E M S ( S E T A )
S E L F - T E S T P R O B L E M SS E L F - T E S T P R O B L E M S
23-21 PA R T 6 S P E C I A L T O P I C S I N F I N A N C E
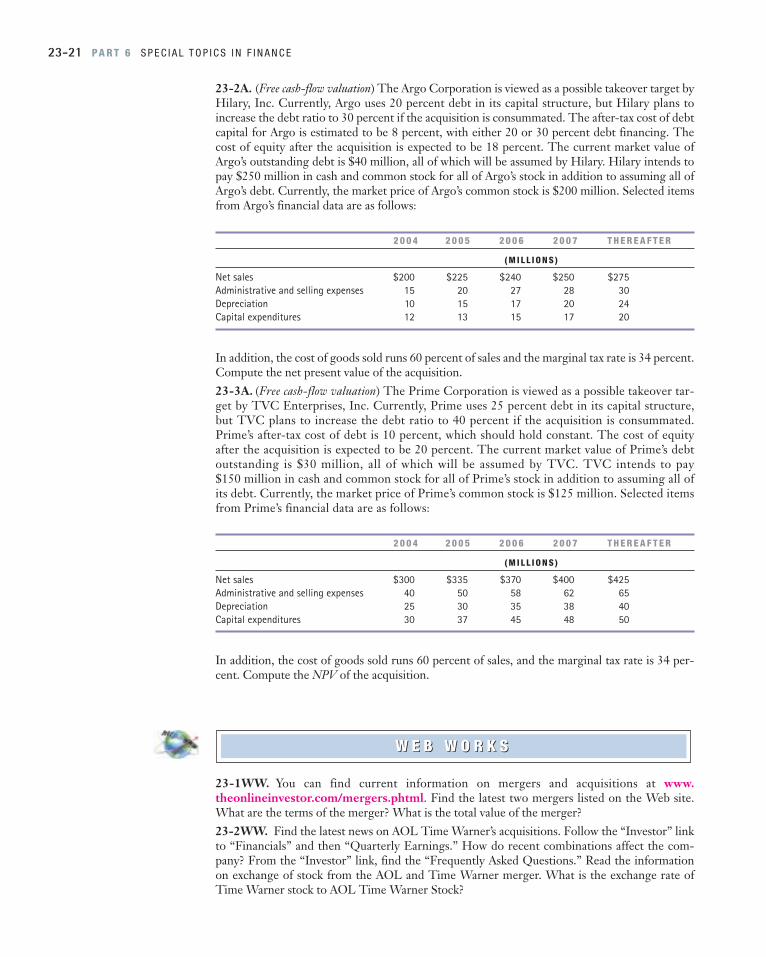
23-2A. (Free cash-flow valuation) The Argo Corporation is viewed as a possible takeover target byHilary, Inc. Currently, Argo uses 20 percent debt in its capital structure, but Hilary plans toincrease the debt ratio to 30 percent if the acquisition is consummated. The after-tax cost of debtcapital for Argo is estimated to be 8 percent, with either 20 or 30 percent debt financing. Thecost of equity after the acquisition is expected to be 18 percent. The current market value ofArgo’s outstanding debt is $40 million, all of which will be assumed by Hilary. Hilary intends topay $250 million in cash and common stock for all of Argo’s stock in addition to assuming all ofArgo’s debt. Currently, the market price of Argo’s common stock is $200 million. Selected itemsfrom Argo’s financial data are as follows:
2 0 0 4 2 0 0 5 2 0 0 6 2 0 0 7 T H E R E A F T E R
( M I L L I O N S )
Net sales $200 $225 $240 $250 $275Administrative and selling expenses 15 20 27 28 30Depreciation 10 15 17 20 24Capital expenditures 12 13 15 17 20
In addition, the cost of goods sold runs 60 percent of sales and the marginal tax rate is 34 percent.Compute the net present value of the acquisition.23-3A. (Free cash-flow valuation) The Prime Corporation is viewed as a possible takeover tar-get by TVC Enterprises, Inc. Currently, Prime uses 25 percent debt in its capital structure,but TVC plans to increase the debt ratio to 40 percent if the acquisition is consummated.Prime’s after-tax cost of debt is 10 percent, which should hold constant. The cost of equityafter the acquisition is expected to be 20 percent. The current market value of Prime’s debtoutstanding is $30 million, all of which will be assumed by TVC. TVC intends to pay $150 million in cash and common stock for all of Prime’s stock in addition to assuming all ofits debt. Currently, the market price of Prime’s common stock is $125 million. Selected itemsfrom Prime’s financial data are as follows:
2 0 0 4 2 0 0 5 2 0 0 6 2 0 0 7 T H E R E A F T E R
( M I L L I O N S )
Net sales $300 $335 $370 $400 $425Administrative and selling expenses 40 50 58 62 65Depreciation 25 30 35 38 40Capital expenditures 30 37 45 48 50
In addition, the cost of goods sold runs 60 percent of sales, and the marginal tax rate is 34 per-cent. Compute the NPV of the acquisition.
23-1WW. You can find current information on mergers and acquisitions at www.theonlineinvestor.com/mergers.phtml. Find the latest two mergers listed on the Web site.What are the terms of the merger? What is the total value of the merger?23-2WW. Find the latest news on AOL Time Warner’s acquisitions. Follow the “Investor” linkto “Financials” and then “Quarterly Earnings.” How do recent combinations affect the com-pany? From the “Investor” link, find the “Frequently Asked Questions.” Read the informationon exchange of stock from the AOL and Time Warner merger. What is the exchange rate ofTime Warner stock to AOL Time Warner Stock?
W E B W O R K SW E B W O R K S

C H A P T E R 2 3 C O R P O R AT E R E S T R U C T U R I N G : C O M B I N AT I O N S A N D D I V E S T I T U R E S 23-22
23-1B. (Chop-shop valuation) Using the chop-shop approach, assign a value for Cornutt, Inc.,whose stock is currently trading at a total market price of $4 million. For Cornutt, the account-ing data set forth three business segments: consumer wholesaling, specialty services, and retire-ment centers. Data for the firm’s three segments are as follows:
S E G M E N T S E G M E N T S E G M E N T B U S I N E S S S A L E S A S S E T S I N C O M E S E G M E N T ( $ 0 0 0 ) ( $ 0 0 0 ) ( $ 0 0 0 )
Consumer wholesaling $1,500 $ 750 $100Specialty services 800 700 150Retirement centers 2,000 3,000 600______ ______ ____Total $4,300 $4,450 $850______ ______ __________ ______ ____
Industry data for “pure-play” firms have been compiled and are summarized as follows:
B U S I N E S S C A P I T A L I Z A T I O N / C A P I T A L I Z A T I O N / C A P I T A L I Z A T I O N /S E G M E N T S A L E S A S S E T S O P E R A T I N G I N C O M E
Consumer wholesaling .75 .60 10.00Specialty services 1.10 .90 7.00Retirement centers 1.00 .60 6.00
23-2B. (Chop-shop valuation) Using the chop-shop method, determine a value for Wrongway,Inc., whose common stock is trading at a total market price of $10 million. For Wrongway, theaccounting data are divided into three business segments: sunglasses distribution, reading glassesdistribution, and technical products. Data for the firm’s three segments are as follows:
S E G M E N T S E G M E N T S E G M E N T B U S I N E S S S A L E S A S S E T S I N C O M E S E G M E N T ( $ 0 0 0 ) ( $ 0 0 0 ) ( $ 0 0 0 )
Sunglasses distribution $2,200 $ 600 $200Reading glasses distribution 1,000 700 150Technical products 3,500 5,000 500_______ _______ _____Total $6,700 $6,300 $850_______ _______ ____________ _______ _____
Industry data for “pure-play” firms have been computed and are summarized as follows:
B U S I N E S S C A P I T A L I Z A T I O N / C A P I T A L I Z A T I O N / C A P I T A L I Z A T I O N /S E G M E N T S A L E S A S S E T S O P E R A T I N G I N C O M E
Sunglasses distribution .8 1.0 8.0Reading glasses distribution 1.2 .9 10.0Technical products 1.2 1.1 12.0
23-3B. (Free cash-flow valuation) The Brown Corporation is viewed as a possible takeover targetby Cicron, Inc. Currently, Brown uses 20 percent debt in its capital structure, but Cicron plansto increase the debt ratio to 25 percent if the acquisition is consummated. The after-tax cost ofdebt capital for Brown is estimated to be 8 percent, which holds constant under either capitalstructure. The cost of equity after the acquisition is expected to be 22 percent. The current mar-ket value of Brown’s outstanding debt is $75 million, all of which will be assumed by Cicron.Cicron intends to pay $225 million in cash and common stock for all of Brown’s stock in addition
S T U D Y P R O B L E M S ( S E T B )S T U D Y P R O B L E M S ( S E T B )

23-23 PA R T 6 S P E C I A L T O P I C S I N F I N A N C E
to assuming all of Brown’s debt. Currently, the market price of Brown’s common stock is $200million. Selected items from Brown’s financial data are as follows:
2 0 0 4 2 0 0 5 2 0 0 6 2 0 0 7 T H E R E A F T E R
( M I L L I O N S )
Net sales $260 $265 $280 $290 $300Administrative and selling expenses 25 25 25 30 30Depreciation 15 17 18 23 30Capital expenditures 22 18 18 20 22
In addition, the cost of goods sold runs 50 percent of sales and the marginal tax rate is 34 percent.Compute the net present value of the acquisition.23-4B. (Free cash-flow valuation) Little Corp. is viewed as a possible takeover target by Big, Inc.Currently, Little uses 20 percent debt in its capital structure, but Big plans to increase the debtratio to 50 percent if the acquisition goes through. The after-tax cost of debt is 15 percent, whichshould hold constant. The cost of equity after the acquisition is expected to be 25 percent. Thecurrent market value of Little’s debt outstanding is $12 million, all of which will be assumed byBig. Big intends to pay $25 million in cash and common stock for all of Little’s stock in additionto assuming all of Little’s debt. Currently, the market price of Little’s common stock is $20 mil-lion. Selected items from Little’s financial data are as follows:
2 0 0 4 2 0 0 5 2 0 0 6 2 0 0 7 T H E R E A F T E R
( M I L L I O N S )
Net sales $200 $220 $245 $275 $300Administrative and selling expenses 30 35 38 40 45Depreciation 18 20 22 25 30Capital expenditures 20 22 25 28 30
In addition, the cost of goods sold is 70 percent of sales, and the marginal tax rate is 34 percent.Compute the NPV of the acquisition.

C H A P T E R 2 3 C O R P O R AT E R E S T R U C T U R I N G : C O M B I N AT I O N S A N D D I V E S T I T U R E S 23-24
ST-1.
C A P I T A L - T O - S A L E S S E G M E N T S A L E S T H E O R E T I C A L V A L U E S
Auto sales 1.40 $3,000 $4,200Auto specialties 0.80 2,500 2,000______
$6,200____________
C A P I T A L - T O - A S S E T S S E G M E N T A S S E T S T H E O R E T I C A L V A L U E S
Auto sales 3.20 $1,000 $3,200Auto specialties 0.90 3,000 2,700______
$5,900____________
C A P I T A L - T O - I N C O M E S E G M E N T I N C O M E T H E O R E T I C A L V A L U E S
Auto sales 18.00 $ 150 $2,700Auto specialties 8.00 500 4,000______
$6,700____________
T H E O R E T I C A L V A L U E B A S E D O N
Sales $6,200Assets 5,900Income 6,700______Average value $6,267____________
S E L F - T E S T S O L U T I O N SS E L F - T E S T S O L U T I O N S