learning from inventory availability information: field...
TRANSCRIPT

Learning from Inventory Availability Information:Field Evidence from Amazon
Ruomeng CuiKelley School of Business, Indiana University, [email protected]
Dennis J. ZhangOlin Business School, Washington University in St. Louis, [email protected]
Achal BassambooKellogg School of Management, Northwestern University, [email protected]
Many online retailers provide real-time inventory availability information. Customers can learn from the
inventory level and update their beliefs about product quality. Thus, consumer purchasing behavior may
be impacted by the availability information. Based on a unique setting from Amazon lightning deals, which
displays the percentage of inventory consumed in real time, we explore whether and how consumers learn
from inventory availability information. Identifying the effect of learning on consumer decisions has been
a notoriously difficult empirical question due to endogeneity concerns. We address this issue by running a
randomized field experiment on Amazon. In our experiment, we create exogenous shocks on the inventory
availability information to a random subset of Amazon lightning deals. In addition, we track the dynamic
purchasing behavior and inventory information for 23,665 lightning deals offered by Amazon in August 2016
and exploit their panel structure to further explore the underlying mechanisms behind learning. We find
evidence of consumer learning from inventory information: a decrease in product availability causally attracts
more sales in the future; in particular, a 10% increase in past sales leads to a 2.08% increase in cart add-ins
in the next hour. Moreover, we show that buyers use observable product characteristics to moderate their
inferences when learning from others, and customers primarily learn about the deal’s value rather than the
product quality from the availability information.
Key words : Learning, inventory availability, field experiment, panel data, fixed effect, consumer behavior,
Amazon, retail operations.
1. Introduction
Flash deal websites, such as Amazon Deals, Groupon or LivingSocial, have emerged as a popular
means of selling products online. Using these platforms, sellers can advertise their products by
offering them at a deep discount. New deals are announced on a daily basis, and they are only
available over a specific period of time, ranging from a few hours to a few days. In the United
States alone, consumers had spent approximately $7 million a day and more than $2.5 billion a
year on flash deals by 2012 (Li and Wu 2014), and this number is estimated to exceed $3.9 billion
1

Cui, Zhang, Bassamboo: Learning from Inventory Availability Information2
a year by 2015 (BIA/Kelsey 2011). Amazon, the largest U.S. online retailer, offers hundreds of
limited-time deals every day, known as lightning deals. On July 15, 2015, Amazon promoted a
24-hour sale event called Prime Day, in which the peak orders of lightning deals surpassed those
of Black Friday 2014.1 The popularity of flash deals has grown in many countries across the world,
as well. In China, Alibaba’s Singles’ Day sales surged 60% to $14.3 billion on Nov 11, 2015.2
Many flash deal websites provide inventory information in real time. It is important to understand
consumer purchasing behavior during flash sales and the impact of this piece of real-time infor-
mation. Inventory information signals previous customers’ preferences and opinions. By observing
past purchasing decisions from inventory information, customers can draw inferences and update
their beliefs about product quality, especially when their prior knowledge about the product is
imperfect. This is called observational learning or herding. In a retail context, when deals advertise
a product’s brisk prior sales or limited availability, observational learning causes an acceleration in
subsequent sales. Consumers not only care about the presence of herding but also moderate their
learning using various deal information, such as observable deal characteristics or the out-of-stock
risk signaled by a product’s low inventory level.
In this paper, we explore whether consumers’ purchasing behavior is impacted by inventory avail-
ability information and which aspect of a sale customers primarily learn about from the inventory
information when purchasing flash-sale products.
By showing a product’s sold inventory as a real-time percentage, Amazon’s lightning deals are an
ideal research context in which to investigate whether consumers react to the inventory availability
information. Lightning deals differ from traditional online sales in two distinctive ways. First,
lightning deal sellers allocate a fixed amount of inventory to a lightning deal sale, and the deal page
prominently displays the percentage of products sold in real time, which reveals product availability.
By allowing customers to observe how much inventory has been consumed, this practice allows
customers to reevaluate their desire for a product and could drive more sales for popular items.
Second, unlike traditional online sales, lightning deals are sold at a discounted price for a limited
time, e.g., 4 hours for most deals, and the remaining time is displayed as a countdown. Having to
make decisions in a limited time under the pressure of missing the deal, customers need to rely on
as much information about the product as possible. These features make inventory availability an
important factor in their assessment; for example, New York Observer noticed that
“The countdown underneath each limited-time item on Amazon.com is both stressful and excit-
ing. Better yet, seeing that 83 percent of the inventory has already been purchased is much
more appealing.”
— New York Observer, as quoted in Grella (2015).
1 http://money.cnn.com/2015/07/15/news/amazon-walmart-prime-day-customers/
2 http://www.businessinsider.com/how-alibaba-made-143-billion-on-singles-day-2015-11

Cui, Zhang, Bassamboo: Learning from Inventory Availability Information3
We collect a proprietary and rich data set from Amazon.com by downloading all available infor-
mation every 30 seconds. Besides the standard product information displayed on Amazon, such
as customer reviews, price and promotional discount, we also collect the dynamic inventory infor-
mation from a status bar under each deal indicating the percentage of that item currently in
customers’ cart or purchased in real time. When a customer clicks the “Add to Cart” button, a
claim is triggered, and the claimed status bar increases the relative percentage over the total prede-
termined inventory. We can, as a result, create a reliable metrics to measure cart-adding behavior
given our fine downloading time resolution. We define the outcome variable as the potential sales,
i.e., the cart add-ins.3 The independent variable is the inventory availability information, i.e., the
percentage of deals claimed.
Our paper aims to estimate the causal relationship between product availability information and
consumers’ purchasing behavior. Identifying the effect of learning on consumer decisions has been
recognized as a notoriously difficult empirical question due to endogeneity concerns (Manski 1993
and Manski 2000). For instance, the observation that well-sold products attract more future sales
may simply be due to the fact that products are heterogeneous and products with a high (low)
quality are sold faster (slower). The main challenge is distinguishing learning from the unobserved
heterogeneity across deals.
To address this issue, we employ a randomized field experiment on Amazon.com. In the experi-
ment, we create an exogenous and instant shock in the inventory availability information to a ran-
dom subset of Amazon lightning deals by adding deals to carts from multiple accounts. We conduct
the field experiment over two weeks in September 2016. We then adopt a difference-in-difference
approach to quantify the incremental cart add-ins across pre-treatment and post-treatment periods
of the treated and controlled deals. Using our randomized treatments, we find the following causal
relationship: a decrease in product availability, i.e., an increase in past sales, attracts more sales in
the future. In particular, a 10% increase in past sales leads to a 2.08% increase in potential sales
in the next hour. This result indicates that consumer learning has a significant and substantial
impact on purchasing behavior.
To study the underlying mechanisms behind customer learning, we exploit the data set collected
from Amazon.com in August 2016, which contains 23,665 lightning deals launched by Amazon in
that month. We take advantage of the panel structure of our data and employ the fixed-effect
model to capture any time-invariant, unobserved heterogeneity among different products. We find
that buyers engage in rational learning: they attribute herding to external efforts rather than
3 We also construct a proxy for sales by taking the difference between the hour-end number of claims and the hour-beginning number of claims. We find our results hold qualitatively across the sales measure. However, this measureis less accurate than cart add-ins and therefore is not included as the main outcome variable.

Cui, Zhang, Bassamboo: Learning from Inventory Availability Information4
solely to intrinsic quality by using observable deal characteristics to moderate their inferences.
Interestingly, we find that customers learn about the deal’s value rather than the deal’s quality
from availability information: a deep discount rate weakens learning momentum because customers
partially attribute herding to a good deal and might ignore the inference drawn from the inventory
information; however, a good customer review does not weaken herding, which indicates that
reviews and availability information signal different information content, and therefore, customers
do not mainly learn about product quality from availability information. Further, we find that
customers’ learning momentum increases when they face lower inventory availability (higher past
sales), i.e., deals with low availability sell faster. This result is consistent with the scarcity effect—
advertising a product’s low inventory level can create an out-of-stock pressure among customers,
and thus prompt a resulting urgency to buy that product immediately.
Our study indicates that, in the online flash sales context, inventory availability is an important
source of information that dictates consumer purchasing behavior. Past literature has documented
how sales ranking or the absolute past sales volume affects future sales (Cai et al. 2009, Chen et al.
2011, and Li and Wu 2014). To the best of our knowledge, we are the first to establish the causal
relationship between inventory information and consumer learning by running a field experiment
in a retail context. Moreover, we complement the literature by shedding light on the underlying
behavioral mechanisms behind consumer learning and pinpointing the specific aspects of a deal
that a customer learns about from inventory information. More broadly, our results contribute to
the literature on consumer learning and their strategic reaction to inventory information, which
we summarize next.
2. Literature Review
Past studies have explored the impact of inventory information on consumer demand. Inventory
information influences consumer purchasing decisions via both observational learning and scarcity.
There is an extant literature focused on these effects.
Our paper is related to the stream of literature on observational learning and herding. The
theoretical work shows that herding behavior—an individual may draw inferences from accumu-
lative decisions by previous decision makers and follow their actions—can arise as an equilibrium
(Banerjee 1992 and Bikhchandani et al. 1992). Stock and Balachander (2005) point out that the
“scarcity strategy” adopted by companies signals a higher product quality and drives profits. Debo
and Van Ryzin (2009) study the consumer herding behavior in a newsvendor context and pro-
pose an asymmetric inventory allocation strategy to increase satisfied demand. Veeraraghavan and
Debo (2011) study a service context and find that herding can arise as a queue-joining equilibrium.
Kremer and Debo (2015) use a lab experiment to show that uninformed customers infer product
quality from wait time.

Cui, Zhang, Bassamboo: Learning from Inventory Availability Information5
Our paper follows the recent interest in empirically quantifying herding in various contexts. In
microloan markets, Herzenstein et al. (2011) and Zhang and Liu (2012) find evidence of herding
among lenders, i.e., well-funded borrower listings tend to attract more funding. Using a natural
experimental setting from an information policy shift at Amazon.com, Chen et al. (2011) focus
on the digital cameras market and find that positive observational learning information increases
sales, but negative observational learning information has no effect. In the context of restaurant
dining, Cai et al. (2009) design a field experiment to distinguish the observational learning effect
from the saliency effect. Using the data of daily deals on Groupon.com, Li and Wu (2014) explore
the relationship between herding and social media word of mouth, and they find that the primary
mechanism behind social media information is increasing product awareness. Our identification
strategies are inspired by the above literature. To our knowledge, however, our paper is the first
to study a causal effect of inventory availability information on consumer behavior by conducting
a field experiment in the retail industry, and we are the first to distinguish which aspects of a deal
customers learn about from inventory information.
Our work is also related to the stream of literature on scarcity. Scarcity can be a deliberate
strategy for making a product more desirable. A low inventory level indicates that the product
may not be available in the future, which can induce a “buying frenzy” behavior among customers
(DeGraba 1995). Gallino et al. (2013) empirically explore the scarcity effect in the automotive
industry. The authors show evidence of the scarcity effect when the added inventory does not
increase the variety in model, but this effect vanishes as the variety increases. Recent research
has proposed various strategies in response to consumers’ strategic reactions to scarcity. Liu and
Van Ryzin (2008) show that sellers can create rationing risk by deliberately understocking products,
and that the resulting threat of shortages induces customers to purchase earlier at higher prices. Cui
and Shin (2016) show that sellers can adopt an aggregate inventory information-sharing strategy
to reduce the shortage penalty cost by creating a stockout “illusion” among customers.
Further, our paper studies how consumers react to product availability information. In this sense,
our study is closely related to the literature that studies consumers’ strategic reaction to product
availability. The literature explores several decision-making mechanisms: (i) customers learn from
the past stockout experience and anticipate a higher probability of a stockout on future orders,
and (ii) the variety in inventory augments consumer choice options, which may confuse customers
or enable a better preference match among heterogeneous customers.
In the face of a stockout, Netessine and Rudi (2003) consider a demand substitution behavior
between competing sellers in a single-period model, and Netessine et al. (2006) analyze a back-
order behavior in a multi-period game. Hall and Porteus (2000) and Gaur and Park (2007) study
the change in retailers’ optimal inventory policy in response to strategic consumer learning when

Cui, Zhang, Bassamboo: Learning from Inventory Availability Information6
customers react to the last stockout or remember the entire service history. Musalem et al. (2010)
develop a structural demand model that estimates the effect of stockouts on consumer demand.
Anderson et al. (2006) conduct a field experiment in a mail-order catalog to show that stockout
adversely impacts both current demand as well as future demand. Craig et al. (2016) use a field
experiment to show that an increased fill rate drives a significant increase in next-year sales. Tomlin
(2009) investigates a retailer’s inventory and sourcing strategy when it learns about changes in the
supplier’s service level. Kabra et al. (2015) study a bike-sharing context and empirically show that
customers trade off bike availability and accessibility. Inventory variety has also been shown to
be an important factor in dictating consumer buying decisions. Ryzin and Mahajan (1999), Gaur
and Honhon (2006) and Cachon and Kok (2007) use consumer choice models to study the optimal
assortment strategies, i.e., selecting a subset of variants to stock. Gallino et al. (2013) provide
empirical evidence that product variety drives more sales for car dealers because customers are
more likely to find an item that matches their preferences. On the other hand, Iyengar and Lepper
(1999) and Iyengar and Lepper (2000) point out that high variety may create confusion in the
decision-making process and thus lead to lower sales.
These papers offer innovative operations strategies in response to consumers’ past negative
encounters or strategic decision making, whereas we focus on the consumer behavior aspect and
provide causal empirical evidence of strategic learning in a retail context. Our paper shows that
customers not only learn from real-time availability information, but also rationally use observable
product attributes to moderate their inferences about the deal’s quality. This finding supports the
literature’s theoretical modeling of rational learners and strategic decision making.
3. Background and Research Hypotheses
In this section, we demonstrate our research setting and theorize the research hypotheses for
observational learning, and the behavioral mechanisms underlying consumer learning.
3.1. Research Background
Online flash sales provide a unique context to study how product availability influences consumers’
purchasing behavior. We choose the Amazon lightning deal platform, one of the largest daily deal
sites, as our research setting.
Amazon launched “lightning deals” in 2009 — a marketing tool to raise awareness for a product
or a brand. Amazon offers hundreds of lightning deals daily. These deals are deeply discounted (an
average of 40%) and limited in time (lasting for 4 to 24 hours). A unique feature of lightning deals
is that a seller allocates a fixed, limited amount of inventory to a lightning deal sale, and the page
provides a real-time status bar indicating the percentage of available units that have already been
claimed by customers, which reveals product availability. A timer appears below each lightning
Cui, Zhang, Bassamboo: Learning from Inventory Availability Information7
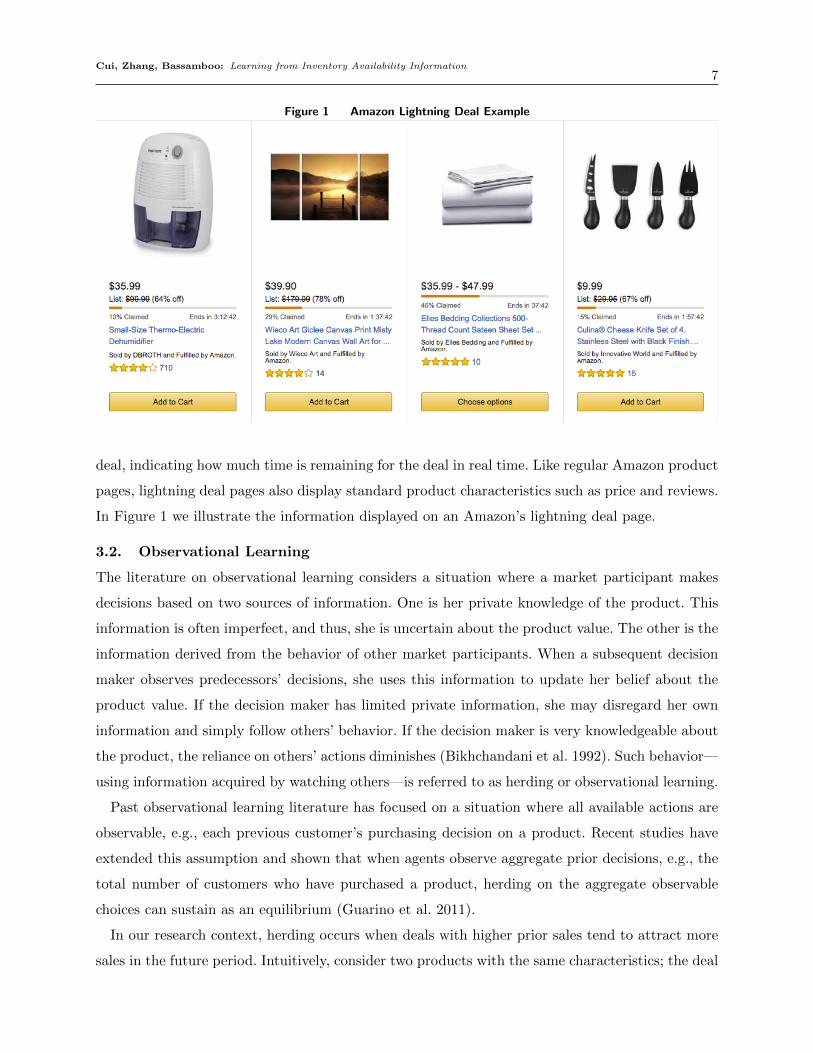
Figure 1 Amazon Lightning Deal Example
deal, indicating how much time is remaining for the deal in real time. Like regular Amazon product
pages, lightning deal pages also display standard product characteristics such as price and reviews.
In Figure 1 we illustrate the information displayed on an Amazon’s lightning deal page.
3.2. Observational Learning
The literature on observational learning considers a situation where a market participant makes
decisions based on two sources of information. One is her private knowledge of the product. This
information is often imperfect, and thus, she is uncertain about the product value. The other is the
information derived from the behavior of other market participants. When a subsequent decision
maker observes predecessors’ decisions, she uses this information to update her belief about the
product value. If the decision maker has limited private information, she may disregard her own
information and simply follow others’ behavior. If the decision maker is very knowledgeable about
the product, the reliance on others’ actions diminishes (Bikhchandani et al. 1992). Such behavior—
using information acquired by watching others—is referred to as herding or observational learning.
Past observational learning literature has focused on a situation where all available actions are
observable, e.g., each previous customer’s purchasing decision on a product. Recent studies have
extended this assumption and shown that when agents observe aggregate prior decisions, e.g., the
total number of customers who have purchased a product, herding on the aggregate observable
choices can sustain as an equilibrium (Guarino et al. 2011).
In our research context, herding occurs when deals with higher prior sales tend to attract more
sales in the future period. Intuitively, consider two products with the same characteristics; the deal

Cui, Zhang, Bassamboo: Learning from Inventory Availability Information8
with higher prior sales sends a strong signal to subsequent customers, and an uninformed customer
can make an inference of the deal quality and would expect the more popular deal to be more
valuable than the alternative.
The two key drivers of herding are the uncertainty in buyers’ own information and their ability
to learn from prior customers’ purchasing decisions. Amazon’s lightning deal platform provides
an ideal research context that facilitates the mechanism of herding. First, more than 80% of deal
buyers are new customers who are likely to be uninformed about the product and thus tend to
herd when prior sales are high (Dholakia 2011). Second, by explicitly highlighting the percentage
of products sold in real time, lightning deals provide a useful signal to customers which allows
them to learn about the deal’s quality. Moreover, lightning deals run for only a limited number
of hours. Having to make the buying decisions in limited time under the pressure of missing the
deal, customers need to rely on as much information about the product as possible. These features
make other customers’ decisions an important resource.
In short, our paper seeks to quantify the momentum of observational learning on the Amazon
flash-sale platform. We expect that observational learning from inventory availability information
significantly affects future sales.4
3.3. Behavioral Mechanisms
The herding literature has shown evidence that observational learners care about not only the
presence of herding, but also the various reasons that give rise to the herd (Zhang and Liu 2012).
In other words, instead of passively replicating others’ purchasing decisions, consumers engage in
rational learning: they attribute herding to external efforts rather than solely to intrinsic quality
by using observable deal characteristics to moderate their inferences. Anderson and Holt (1997)
and Goeree et al. (2007) show that decision makers can recognize a “mistaken” private signal
that indicates the incorrect state, and that rational herding is formed in most periods in a lab
experiment. Simonsohn and Ariely (2008) document the evidence of less rational herding among
inexperienced eBay bidders when they herd into auctions with more existing bids but ignore the
fact that the existing bids result from the no-longer-available lower starting prices rather than from
higher quality. Rational learning has been documented in various practical contexts. For example,
Duan et al. (2009) find that software buyers moderate their herding behavior on less popular
products by factoring in the user rating. Zhang and Liu (2012) study lenders’ funding behavior
in microloan markets and find evidence of rational herding: listing attributes such as credit scores
4 When the product availability information is not shown to customers, there is no observational learning, and salesshould appear constant over time after controlling for other factors. When the availability information is displayed,high prior sales signal the higher deal quality. Thus, the purchasing rate increases over time and the sales shouldappear as a convex, increasing shape over time.

Cui, Zhang, Bassamboo: Learning from Inventory Availability Information9
signal the creditworthiness of a borrower, and rational lenders partially attribute the funding status
to its attributes. Li and Wu (2014) identify social media information as another source of external
effort that can moderate the herding momentum among deal buyers.
In our research context, rational learning occurs when consumer learning depends on the observ-
able deal characteristics. Intuitively, consider two equally well-sold deals with identical observable
characteristics except that deal 1 has a larger discount than deal 2. A rational subsequent buyer
would think that the previous customers must possess positive private information if they chose
deal 2 over deal 1. For example, previous customers might be experienced lightning deal buyers and
know that deal 2 is more valuable because the product is rarely on sale. Therefore, a rational buyer
would partially attribute deal 1’s sales to its deep discount, and draw a more positive incremental
quality inference about the less-discounted deal.
More importantly, we investigate which aspects of a deal consumers learn about. The quality
of a sale consists of two attributes: the product quality (i.e., whether the product rating is good
enough) and the deal value (i.e., whether the discount is good enough). Amazon’s lightning deal
setting allows us to gather empirical evidence on whether consumers mainly infer the deal value,
the product quality or both from the inventory information.
If the deal value dictates a customer’s purchasing decisions, she uses the deal discount depth as
a moderating factor in the inference obtained from availability information. Depending on whether
customers learn about deal value from the availability information, the discount depth impacts
customer learning in two opposing ways. If a customer learns about deal value from inventory
information, then when seeing that a deeply discounted deal has a low inventory availability, she
will partially attribute the good sales to the deal’s value (Zhang and Liu 2012). As a result, a deep
discount weakens a deal’s herding momentum. On the other hand, if customers do not learn about
the deal value from the inventory information, herding and the deal discount are two different
information sources that provide different information content, and they may complement each
other to generate sales (Kirmani and Rao 2000). In this situation, a higher discount amplifies a
deal’s herding momentum.
Similarly, if product quality drives a customer’s purchasing decisions, she uses the product rating
as an information source to moderate her inferences. There are two opposing hypotheses on how
product rating impacts customer learning. By the same logic, one hypothesis suggests that when
a customer learns about product quality from inventory information, she partially attributes large
sales to a high product rating, and hence, a higher customer review weakens a deal’s herding
momentum. The second hypothesis suggests that a higher rating can amplify a deal’s herding
momentum when reviews and herding provide different information signals.

Cui, Zhang, Bassamboo: Learning from Inventory Availability Information10
Consumer learning could also be driven by inventory scarcity. Scarcity affects sales through sev-
eral mechanisms. DeGraba (1995) suggests that scarcity creates a buying frenzy among customers.
Because low inventory availability indicates that the product may not be available in the future,
consumers rush to purchase it under the out-of-stock pressure before they become informed. On
the other hand, Stock and Balachander (2005) suggest that scarcity signals the popularity and
quality of the product. Balachander et al. (2009) find empirical support for the signaling theory
in the automobile market. Brock (1968), Lynn (1991) and Tereyagoglu and Veeraraghavan (2012)
also point out that customers may prefer a product that is more exclusive, and thus, scarcity is
associated with a stronger preference.
In our context, when product availability is relatively high, consumer learning—i.e., higher past
sales drive more future sales—is primarily driven by herding. When product availability is relatively
low, the scarcity effect begins to kick in and consumer learning is driven by both herding and
scarcity. Therefore, in the presence of the scarcity effect, we expect that the average learning
momentum increases as customers respond to an increasing average percentage of claimed products.
In short, we expect customers to rely on observable deal characteristics to moderate infer-
ences, and we further investigate customers’ strategic learning of two important aspects of the
deal quality—deal value and product quality. In addition, we study the impact of a low inventory
level—the scarcity effect—on purchasing behavior.
4. Data
We collected a proprietary data set from Amazon.com by downloading all available information
from Amazon’s lightning deal platform every 30 seconds in August and September of 2016. In
addition, we kept downloading the data while we ran a field experiment in September 2016. Despite
Amazon’s being one of the largest flash sales sites in the world, our paper is (to our knowledge)
the first one to gather and take advantage of this data source. We gather two portions of data from
Amazon lightning deals: (i) real-time information and (ii) static product characteristics.
Real-time inventory information. When a customer clicks the “Add to Cart” button, a claim is
triggered, and the claimed status bar increases the relative percentage over the total predetermined
inventory. If the customer does not complete the purchase within 15 minutes, Amazon will drop
the product from the cart and drop the corresponding percentage of units claimed. Since each
customer is restricted to purchasing only one unit from each lightning deal, the percentage increase
reflects the number of customers who intend to purchase the deal. Figure 2 in the Appendix shows
an example of the dynamic change of the percentage claim information over time for a lightning
deal.
Our granular download-time resolution (i.e., 30 seconds) allows us to capture the minimum
increment (or decrement) of product availability. We use it to calculate the number of customers

Cui, Zhang, Bassamboo: Learning from Inventory Availability Information11
who add the product to their carts within a period of time. We can also use it to impute the
approximate inventory allocated to a deal.5 In addition, we collect the remaining time from the
timer displayed under each lightning deal.
For each deal, we construct the outcome variable Cart add-ins as the total positive increment
in the percentage claimed in a specific time period.6 When a customer adds an item to the cart,
she expresses her interest in the product and creates a chance to make a purchase. Cart add-ins,
as a result, measure potential customers who have expressed interest in purchasing.
Product characteristics data. For each deal, we also gather static product information. Specif-
ically, we collect the final discounted price, the listed original price, the actual original price, the
product rating, the number of reviews and the number of options (in color or size). Lightning deals
display the listed original price and a corresponding discount percentage below each deal. However,
the listed original price is the manufacturer’s suggested retail price, which is often higher than the
non-promotional price on Amazon. Therefore, we also collect the actual original price from Ama-
zon, from which we calculate the actual discount rate. We obtain two measures of the promotional
depth: the actual discount and the listed discount. These allow us to investigate whether customers
are knowledgeable enough to differentiate them and which discount rates dictate decision making.
Descriptive statistics. Table 1 presents the summary statistics for the dynamic variables and the
time-invariant product characteristics in August 2016. Our sample includes 23,665 deals that run
for an average of 5.2 hours. The average cart add-ins per hour are 4.47%.7 The average final deal
price is $24.15 with an actual original price of $31.67 (discount percentage of 22%) and a listed
original price of $43.73 (discount percentage of 39%). On average, a deal has 130.37 reviews and
an average rating of 3.91 out of 5 stars. The sellers allocate more than 35.47 units of inventory to
lightning deal sales (given we underestimate the inventory level beyond 100 units).
5. Identification Strategies
We aim to estimate the causal relationship between product availability and consumers’ future
purchasing behavior. Identifying the effect of social learning on consumer decisions has been rec-
ognized as a notoriously difficult empirical question due to endogeneity concerns (Cai et al. 2009).
The main problem is in distinguishing social learning from unobserved heterogeneity across deals.
A common unobserved heterogeneity is the deal quality. Deals with good quality tend to have high
5 We calculate inventory as 100/(the minimum increment). For example, if the minimum increment is 2%, the inventorylevel is 50 units. Please note that the minimum increment takes only integers. Therefore, we approximate the inventorylevel as 100 for deals with more than 100 units.
6 Given our granular download-time resolution and one-customer-one-deal purchasing restriction, Cart add-ins is anaccurate and good measure of potential customer demand.
7 The max cart add-in is 228%. It indicates that for this product in a specific hour, many customers have showninterest in purchasing but eventually dropped the item.

Cui, Zhang, Bassamboo: Learning from Inventory Availability Information12
Table 1 Summary Statistics for Amazon Lightning Deals in August 2016
Level Variable Mean Std. Dev Min Max N
Deal and hourClaim change 2.40 5.66 0 84.00 123,115Cart add-ins 4.47 9.22 0 228.00 123,115
Deal
Total claim 10.74 18.34 0 99.00 23,665Deal price 24.15 59.14 3.74 4,399.00 23,665List original price 43.73 87.21 4.49 5,501.37 23,665List discount 19.58 41.29 0.05 2,580.00 23,665List percentage 0.39 0.22 0.01 0.97 23,665Actual original price 31.67 78.03 4.49 5,501.37 23,665Actual discount 7.52 24.66 0.44 1,820.05 23,665Actual percentage 0.22 0.10 0.02 0.83 23,665Review rating 3.91 1.31 0.00 5.00 23,665No. of reviews 130.37 369.02 0.00 27,059 23,665Duration 5.20 0.98 3.00 6.00 23,665Inventory 35.47 40.12 1.00 100.00 23,665
past sales and high future sales even without learning, while some other deals are less popular,
and in the most extreme case, may have zero sales across the selling period. In this case, the
ordinary least squares (OLS) regression may attribute high future sales to high past sales when it
could actually be driven by deal quality. Therefore, the OLS estimator may overestimate the social
learning effect and suffer from the omitted variable bias.
Following the past empirical literature, we address this issue by using two identification strate-
gies: (i) randomized field experiment and (ii) panel data analysis. The randomized field experiment
randomly assigns the treatment to products or individuals; Cai et al. (2009) and Chen et al.
(2011) have adopted randomized experiments to estimate the social learning effect in other research
contexts. The advantage of using randomized experiments is that, since the treatment is uncon-
ditionally randomly assigned, the estimator represents an unbiased causal effect. In other words,
the estimators obtained from randomized control experiments have high internal validity (Levitt
and List 2007). However, because field experiments are often conducted under financial and human
resource constraints, the number of observations is often relatively small, which limits the external
validity.
The panel data approach exploits the panel structure of the data and uses individual-level fixed
effects to control for time-invariant unobserved heterogeneity; Sorensen (2006), Duan et al. (2009),
Zhang and Liu (2012) and Li and Wu (2014) have adopted the fixed effect specification. The
advantage of using this approach is that the panel data set is often large and covers various
products or individuals. Thus, the estimators derived from the panel approach have high external
validity. However, because the causal identification obtained by the fixed-effect model requires the
assumption that the unobserved heterogeneity is time-invariant, the fixed-effect specification often
lacks the internal validity and needs various robustness checks to prove this assumption.
Cui, Zhang, Bassamboo: Learning from Inventory Availability Information13
Our paper employs both identification strategies to establish both the internal and external
validity of our findings. In particular, we first conduct a randomized field experiment to quantify
the causal impact of consumer learning on sales among a set of Amazon deals. We then turn to the
panel data set to re-estimate this causal effect over a much larger set of deals. By demonstrating
that these two estimators are similar in directions and magnitudes, we not only provide a crucial
understanding of consumer learning but we also show that our findings are equally descriptive of
the world at large.
Given the average inventory level for lightning deals is relatively high (e.g., the average maximum
fraction claimed is 10.74%), consumers do not face a lot of stockouts, and the primary driver in
consumer learning is herding. The scarcity effect begins to come into play when availability becomes
relatively low.8
Randomized field experiment. We run a field experiment on Amazon. In our experiment, we
generate a shock in the claim information by creating an instance spike in sales—which is our
treatment—to a randomly selected group of Amazon deals. This spike lasts for one hour. We started
our experiment on average two hours before the deal period ended. This allows us to compare the
purchasing behavior across three periods: pre-treatment, treatment and post-treatment periods.
We adopt a difference-in-difference analysis to quantify the incremental cart-adding behavior driven
by our treatment. Because the deals receive a treatment two hours before their ending time, the
average inventory availability is far from stockout and it is unlikely that customers face an out-of-
stock pressure. Therefore, the field experiment identifies the learning momentum mainly driven by
herding.
Panel data approach. Our proprietary data set has a panel structure, where for each deal, the
percentage claimed varies dynamically over time. The panel structure allows us to use a fixed-effect
model to capture any time-invariant unobserved heterogeneity; in this way, we exploit the variation
within each deal to obtain an estimate of learning and its interaction with product attributes. Using
this fixed-effect approach, we show the external validity of our findings in the field experiment
given that the panel data covers a much broader spectrum of products. Further, we interact the
availability information with observable product characteristics to explore possible mechanisms
behind learning. Because the fixed-effect model estimates the average learning momentum across
various inventory availability levels, the learning momentum may include both herding and scarcity
effects.
8 Note that we cannot completely disentangle the herding effect from the scarcity effect as it is not well understoodwhen the scarcity effect begins to kick in (e.g., the availability level below which customers start to care aboutscarcity).

Cui, Zhang, Bassamboo: Learning from Inventory Availability Information14
6. Randomized Field Experiment
In this section, to identify the causal effect of the availability information on purchasing behavior,
we design and conduct a randomized field experiment on Amazon’s lightning deal platform.
6.1. Experiment Design and Data Summary
Recall that an increment in claim is triggered by clicking the “Add to Cart” button. We take
advantage of this mechanism and create an exogenous shock to the availability information. To this
end, we create 10 Amazon accounts and add products to these accounts’ carts in a short period of
time (i.e., within 3 minutes) to spike the claim information. Before the start of the experiment, we
download all the available deals with a duration of at least two hours. There are on average 70 such
deals available per hour. We randomly assigned an average of 40% of the deals to the treatment
group that receives a shock in “past sales” and the rest of the deals to the control group. Figure 3
in the Appendix illustrates our field experiment design.
With the help of four research assistants, we were able to add the treated deals to the cart of
each of the 10 accounts within 3 minutes. Figure 4 in the Appendix illustrates how the availability
information changes when we spike cart add-ins in the experiment. Because Amazon drops products
out of the cart after 15 minutes if the purchase has not been completed, we re-added the treated
deals every 15 minutes. We started the experiment at either 2 p.m. or 3 p.m. in the afternoon
and kept the shocks on each deal for around 60 minutes on one day (the 60 minutes include 45
minutes effective in-cart time and around 15 minutes operating time). We repeated the experiment
six times: on Tuesday, Friday and Saturday of two consecutive weeks.9
There are in total 181 deals in the treatment group and 264 deals in the control group. Table 2
summarizes the deal characteristics, inventory information dynamics across the treatment group
and the control group within a 50-minute window before the experiment, a 60-minute window
within the experiment and a 50-minute window after the experiment. On average, we created an
exogenous average increment of 16.48% in the percentage claimed to the 181 treated deals at the
beginning of the treatment period. Table 2 also demonstrates that the deals in the treatment and
control groups have similar characteristics such as hours to the end, listing discount percentage,
actual discount percentage, review ratings and number of reviews, which proves that the treatment
assignment is randomized. Table 2 provides initial evidence of consumer learning: in the treatment
period, the treated deals receive a higher number of cart add-ins than the control deals.
9 An experiment spanning Tuesday, Friday and Saturday captures the effects on both weekdays and weekends.

Cui, Zhang, Bassamboo: Learning from Inventory Availability Information15
Table 2 Field Experiment Summary Statistics
Treatment (N=181) Control (N=264)Window Variable Mean Std. Dev Mean Std. Dev
Pre-50-min
Start claim 5.18 8.29 5.94 9.81Cart add-ins 7.13 9.40 8.01 12.70Hour to end 3.44 0.50 3.48 0.59List discount pct 0.62 0.20 0.61 0.20Actual discount pct 0.23 0.11 0.22 0.09Review rating 4.08 1.35 3.93 1.44No. of reviews 97.88 255.82 85.87 173.25
Experiment
Start claim (beforeshocks)
9.14 13.04 9.98 15.98
Start claim (aftershocks)
25.62 19.20 10.30 15.48
Cart add-ins 10.49 9.88 8.04 11.20
Post-50-minStart claim 19.42 21.09 12.62 17.34Cart add-ins 5.88 7.85 5.78 7.52
6.2. Experiment Results
We analyze the treatment effect of availability information on consumer cart-adding behavior. We
first employ a pre-post comparison specification. Specifically, for each deal, we compare the total
cart add-ins within the experiment time window with those within 50 minutes before (or after) the
experiment. The validity of this specification relies on the assumption that the potential demand
and consumer purchasing behavior are time-invariant. To control for potential heterogeneity over
time, we then employ a difference-in-difference approach.
6.2.1. Pre-post treatment comparison. Let Treated Deali be a dummy variable to denote
whether deal i was assigned in the treatment group; Treated Deali = 1 represents the deals that
received the treatment on inventory availability. Let Treated Hourp denote the treated hour
dummy, where p∈ {pre-50-min period, experiment period, post-50-min period}; Treated Hourp =
1 represents period p, the experiment hour. We estimate the treatment effect by the following
specification,
si,p = c+αTreated Hourp +Ti +Zi + ei,p, ∀i s.t. Treated Deali = 1 (1)
where si,p denotes the number of times deal i was added to the cart per minute within period p,
i.e., cart-adding rate.10 In addition, Ti control for time characteristics, e.g., the day of the week and
the hour of the day effects, and Zi control for deal characteristics, e.g., review rating, total number
of reviews, and discount depth. Please note that, in the randomized experiment, we do not need to
10 The reason we measure the outcome variable by the cart-adding rate is that we vary the duration of the pre-experiment control period and the post-experiment control period as a robustness test. In order to make an accurateand correct comparison, we adopt the cart add-ins per minute as the dependent variable.

Cui, Zhang, Bassamboo: Learning from Inventory Availability Information16
add any control covariates to obtain an unbiased estimate of the treatment effect because treatment
is unconditionally randomly assigned; the addition of controls, however, can make the estimates
more efficient (Paulsen and Smart 2013). Our main analysis will not include deal characteristics,
but our analysis is qualitatively and quantitatively robust after including the deal characteristics
in Table 6 in the Appendix.
The consumer learning effect can be measured by the incremental potential sales driven by
the treatment, i.e., the coefficient of Treated Hourp. The validity of this specification resides in
the assumption that the incoming potential demand and consumer purchasing behavior do not
systematically change over time (conditional on our control variables),
Assumption 1. Pre-post comparison assumption: E(ei,p |Treated Hourp) = 0.
We let t= {pre-50-min period, experiment period} in specification (1) to compare the treated
period with the pre-50-min window. At the end of our experiment period, the fictional add-ins from
our treatment are dropped from the carts, and as a result, the treatment effect diminishes in the 50-
min period after the experiment. To show the robustness of our treatment effect over the period after
the experiment, we re-run specification (1) where t = {experiment period, post-50-min period}.The estimation results are displayed in Columns I and IV in Table 3. As a placebo test, we repeat
the above pre-post comparison analysis for the deals in the control group, i.e., for i that Treated
Deali = 0, to detect any systematic differentiation of the cart-adding rate over time. Columns II
and V in Table 3 present the estimation results.
Column I shows evidence of consumer learning: a product’s brisk prior sales causally drive an
acceleration in sales in the future period. Column II shows that for deals in the control group,
the cart-adding rate within the 60-minute experiment window is not significantly different than
during the 50-minute window prior to the experiment. In other words, Column II demonstrates that
Assumption 1 is satisfied between pre-experiment and experiment periods, which confirms that the
treatment effect identified in Column I is driven by our treatment rather than other factors. The
main finding holds in Column IV, i.e., the treatment effect is statistically significant on the cart-
adding rate over the post-experiment period. However, this treatment effect may be confounded
by temporal heterogeneity in cart-adding behavior since Column V shows that the post-treatment
period has a systematically greater cart-adding behavior compared to the experiment period, even
for deals in the control group. Therefore, to control for such time heterogeneity, we next employ a
difference-in-difference analysis.
6.2.2. Difference-in-difference (DiD) analysis . The difference-in-difference estimator is
derived from the following specification,
si,p = c+ Treated Deali + Treated Hourp +βTreated Deali×Treated Hourp +Ti +Zi + ei,p, (2)
Cui, Zhang, Bassamboo: Learning from Inventory Availability Information17
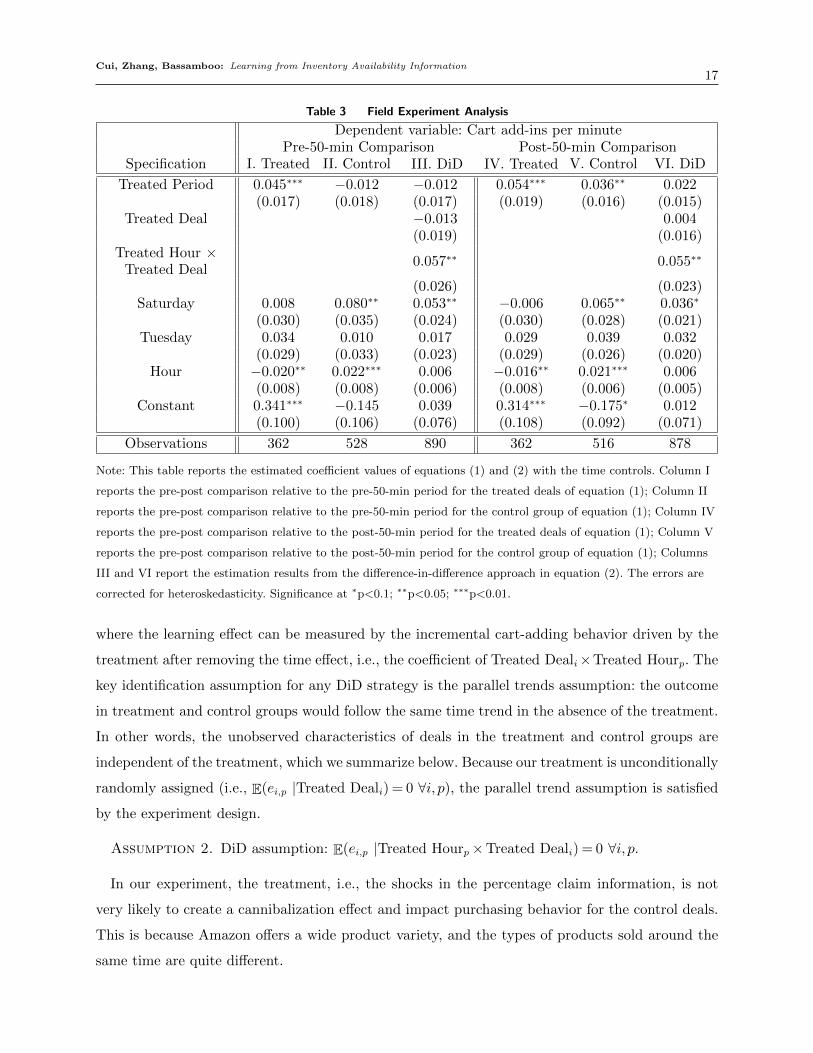
Table 3 Field Experiment Analysis
Dependent variable: Cart add-ins per minutePre-50-min Comparison Post-50-min Comparison
Specification I. Treated II. Control III. DiD IV. Treated V. Control VI. DiD
Treated Period 0.045∗∗∗ −0.012 −0.012 0.054∗∗∗ 0.036∗∗ 0.022(0.017) (0.018) (0.017) (0.019) (0.016) (0.015)
Treated Deal −0.013 0.004(0.019) (0.016)
Treated Hour ×Treated Deal
0.057∗∗ 0.055∗∗
(0.026) (0.023)Saturday 0.008 0.080∗∗ 0.053∗∗ −0.006 0.065∗∗ 0.036∗
(0.030) (0.035) (0.024) (0.030) (0.028) (0.021)Tuesday 0.034 0.010 0.017 0.029 0.039 0.032
(0.029) (0.033) (0.023) (0.029) (0.026) (0.020)Hour −0.020∗∗ 0.022∗∗∗ 0.006 −0.016∗∗ 0.021∗∗∗ 0.006
(0.008) (0.008) (0.006) (0.008) (0.006) (0.005)Constant 0.341∗∗∗ −0.145 0.039 0.314∗∗∗ −0.175∗ 0.012
(0.100) (0.106) (0.076) (0.108) (0.092) (0.071)
Observations 362 528 890 362 516 878
Note: This table reports the estimated coefficient values of equations (1) and (2) with the time controls. Column I
reports the pre-post comparison relative to the pre-50-min period for the treated deals of equation (1); Column II
reports the pre-post comparison relative to the pre-50-min period for the control group of equation (1); Column IV
reports the pre-post comparison relative to the post-50-min period for the treated deals of equation (1); Column V
reports the pre-post comparison relative to the post-50-min period for the control group of equation (1); Columns
III and VI report the estimation results from the difference-in-difference approach in equation (2). The errors are
corrected for heteroskedasticity. Significance at ∗p<0.1; ∗∗p<0.05; ∗∗∗p<0.01.
where the learning effect can be measured by the incremental cart-adding behavior driven by the
treatment after removing the time effect, i.e., the coefficient of Treated Deali×Treated Hourp. The
key identification assumption for any DiD strategy is the parallel trends assumption: the outcome
in treatment and control groups would follow the same time trend in the absence of the treatment.
In other words, the unobserved characteristics of deals in the treatment and control groups are
independent of the treatment, which we summarize below. Because our treatment is unconditionally
randomly assigned (i.e., E(ei,p |Treated Deali) = 0 ∀i, p), the parallel trend assumption is satisfied
by the experiment design.
Assumption 2. DiD assumption: E(ei,p |Treated Hourp×Treated Deali) = 0 ∀i, p.
In our experiment, the treatment, i.e., the shocks in the percentage claim information, is not
very likely to create a cannibalization effect and impact purchasing behavior for the control deals.
This is because Amazon offers a wide product variety, and the types of products sold around the
same time are quite different.
Cui, Zhang, Bassamboo: Learning from Inventory Availability Information18
Columns III and VI estimate the treatment effect using the difference-in-difference specification
in Equation (2) relative to the pre-50-minutes time period and the post-50-minutes time period,
respectively. After removing the potential time heterogeneity, our DiD estimates remain significant,
which suggests that a spike in past sales causally increases future sales. This provides empirical
evidence for the existence of consumer learning.
Recall that we created an exogenous increment of 16.48% in the inventory claim bar. The result
of the difference-in-difference specification in Columns III and VI indicates that such an increment
translates into an increase of 3.42% cart add-ins in an hour (0.057% units per minute × 60 min-
utes). In other words, a 10% increase in the inventory claim bar leads to a 2.08% increase in cart
add-ins. This provides empirical evidence that customers react to and learn from the inventory
information, and the impact is significant and sizable. As a robustness test, we re-run our results
using different time windows, i.e., 5 minutes, 10 minutes, 20 minutes before and after the exper-
iment. The treatment effect is also robust to these time-window specifications. In Section 7, we
will compare this estimate with the estimates obtained from the panel data analysis and examine
whether estimates based on these two approaches are consistent in magnitude.
7. Panel Data Analysis
In this section, we exploit the panel structure of the data to estimate the learning momentum and
the underlying behavioral mechanism during the purchase of flash-sale products.
7.1. Fixed-Effect Specification
In our collected data set, for each deal, the inventory information varies dynamically over time,
but the product characteristics are time-invariant, which provides us with a panel structure of the
data. The panel structure allows us to exploit the fixed-effect specification.
We denote t as the hour from the start of the deal, where t = 1, ..., T ; T is the duration of a
deal. We use Ci,t to denote the total percentage of inventory claimed for deal i at the beginning
of hour t, and we use yi,t to denote the total cart add-ins during hour t, i.e., potential sales. The
total amount of inventory claimed reflects the previous customers’ collective opinions regarding
the worthiness of the deal and the product’s quality. The learning effect can be measured by the
dependency of future sales on current inventory information, i.e., the coefficient of Ci,t on yi,t.
We first conduct a preliminary OLS analysis by looking at the correlation between future cart
add-ins and current inventory information. The analysis tests whether yi,t is positively correlated
with the inventory information Ci,t after controlling for time-varying attributes Xt and time-
invariant attributes Zi,
yi,t = γCi,t +β1Xt +β2Zi + ei,t. (3)
Cui, Zhang, Bassamboo: Learning from Inventory Availability Information19
The time-varying attributes Xt include the hour-of-day and day-of-the-week fixed effects. These
attributes capture the possibility that sales tend to concentrate in certain hours of a deal or on
certain days of the week. Time-invariant deal attributes Zi include the No. of Reviews, the number
of reviews under a deal during the period when the deal is active11; Review Rating, the average
star rating of the reviews; Discount, the actual and listed promotional depth of the deal; Variety, a
dummy variable equal to one if the product has multiple options, e.g., colors or sizes. The coefficient
of Ci,t tests the correlation between Ci,t and yi,t.
The available data may not capture all the heterogeneity across the deals. For example, a deal
with a detailed product description or professional-looking photos is likely to attract more cus-
tomers, but our data does not include these variables. Statistically, there may be unobserved
heterogeneity in the error term, i.e., ei,t = ui + εi,t, where εi,t is orthogonal of all the independent
variables and ui represents the unobserved deal attributes such as the inherent quality of the deal.
Since ui is correlated with other deal-specific features, Ci,t and Zi, without controlling for ui, the
OLS regression in equation (3) suffers from the omitted variable bias (Wooldridge 2010). Fortu-
nately, the panel structure of the data allows us to use a fixed-effect specification to capture any
time-invariant unobserved deal heterogeneity ui,
yi,t = γCi,t +β1Xt +β2Zi +ui + εi,t. (4)
The key identification assumption for the fixed-effect model is that unobservable deal hetero-
geneity is time-invariant, which we summarize below.
Assumption 3. Fixed-effect assumption: E(εi,t | Ci,t, ui) = 0 ∀i, t.
This is plausible in our research context because our study examines the learning effect on sales
over the course of a 4- to 6- hour deal. It is unlikely that the characteristics of the deal would
change during the time period when the deal is active. Therefore, by controlling for the unobserved
heterogeneity ui, we identify consumer learning using within-deal variations in Ci,t, yi,t and Xt.
Moreover, consumers rely on observable deal characteristics to moderate their inferences from
observing the inventory information. To explore the underlying behavioral mechanism of learning,
we examine the cross-sectional variations in the observable listing attributes, which allow us to dis-
tinguish whether consumers primarily learn of the product quality or the deal quality. We augment
equation (4) by including the interaction term between the cumulative inventory information and
the observable deal characteristics like customer reviews and deal discount,
11 We downloaded Amazon’s data every 30 seconds, which allows us to examine the variation of reviews over the 4hours when the deal is active. We found that the review properties do not change much during the lightning dealperiod. Therefore, the number of reviews and product rating are time-invariant variables.

Cui, Zhang, Bassamboo: Learning from Inventory Availability Information20
yi,t = γCi,t +β1Xt +β2Zi +β3Ci,t×Zi +ui + εi,t. (5)
The deal’s value, i.e., the discount level, impacts customer learning in two opposing ways. When
a customer sees that a minimally discounted deal has a low inventory availability, she will argue
that there must be something good about this deal that attracts other customers despite its small
discount, and make a more positive incremental quality inference about these minimally discounted
deals from the inventory information. Therefore, the learning momentum can be accentuated by
a low discount rate, i.e., the coefficient of Ci,t× Deal discount should be negative. In contrast,
the opposite relation would suggest the discount rate and availability information provide different
information content, as they complement each other to attract sales, and thus, it suggests that
customers do not mainly learn about deal value.
Product quality, which is reflected in customer reviews, may also drive consumers’ learning in
two opposing ways. When a customer sees that a low-rated deal has a low inventory availability, she
will justify the herd with some other positive characteristics of the deal, and make a more positive
incremental quality inference about it. Therefore, the learning momentum can be accentuated by
a low product rating, i.e., the coefficient of Ci,t× Review rating should be negative. Similarly, the
opposite sign would suggest flash-sale buyers do not mainly learn about product quality from the
availability information.
7.2. Estimation Results
Table 4 provides the estimated coefficient with potential sales as the dependent variable. Column
I displays the results for the OLS model in equation (3). Column II displays the results for the
fixed-effect model in equation (4). Columns III - VI report the results for the interacted fixed-effect
model in Equation (5) with respect to customer reviews, deal discount rate and the option variety.
The OLS estimator in Column I suggests that the effect of inventory information (Ci,t) is positive
and significant on sales in the next hour. However, the OLS estimates may suffer from the omitted
variable bias and overestimate the learning effect. Below we report the estimates from the fixed-
effect model.
7.2.1. Consumer learning. Column II of Table 4 reports the coefficient of the past inventory
information for the fixed-effect model with time controls. As expected, the OLS specification in
Column I overestimates the effect compared with the fixed-effect specification in Column II. After
controlling for deal-specific heterogeneity, Claim has a significant and positive coefficient, which
shows the existence of consumer learning—i.e., the availability information indeed influences fol-
lowing customers’ choices and a deal with higher past sales attracts more purchases in the future.
More importantly, the magnitude of the causal effect identified by the panel data analysis aligns

Cui, Zhang, Bassamboo: Learning from Inventory Availability Information21
Table 4 Fixed-effect Analysis
Specification I II III IV V VI
Claim 0.452∗∗∗ 0.299∗∗∗ 0.156∗∗∗ 0.220∗∗∗ 0.243∗∗∗ 0.215∗∗∗
(0.002) (0.023) (0.043) (0.044) (0.045) (0.044)
No. of reviews −0.0001∗∗
(0.0001)Review rating 0.252∗∗∗
(0.017)Variety −2.272∗∗∗
(0.060)Actual discount 0.005∗∗∗
(0.001)Claim × No. of reviews 0.00001 0.00001 0.00001 0.00001
(0.00001) (0.00001) (0.00002) (0.00001)
Claim × Review rating 0.032∗∗∗ 0.032∗∗∗ 0.029∗∗∗ 0.032∗∗∗
(0.008) (0.009) (0.009) (0.008)
Claim × Variety −0.111∗∗∗ −0.114∗∗∗ −0.111∗∗∗
(0.013) (0.013) (0.013)
Claim × Actual discount −0.002∗∗∗
(0.0006)
Claim × List discount 0.0003(0.0002)
Time control Yes Yes Yes Yes Yes YesObservations 123,115 123,115 123,115 123,115 123,115 123,115
Note: This table reports the estimated coefficient values of equations (3), (4) and (5) and standard errors clustered
at the deal level with the hour of the deal controls. Column I reports the sequential correlation results of the OLS
regression of equation (3); Column II reports the results of the fixed-effect regression of equation (4); Column III
reports the results of the fixed-effect model interacted with number of reviews and review rate; Column IV reports
the results of the fixed-effect model interacted with actual discount; Column V reports the results of the fixed-effect
model interacted with number of review, review rate and actual discount; finally, Column VI reports the results of
the fixed-effect model interacted with all deal characteristics. The errors are corrected for heteroskedasticity.
Significance at ∗p<0.1; ∗∗p<0.05; ∗∗∗p<0.01.
with the magnitude identified by the randomized field experiment. The panel data analysis suggests
that, all else equal, a 10% increase in the cumulative percentage claimed leads to a 2.99% increase
in the potential sales in the next hour. Recall that the field experiment suggests a 2.08% increase
in the next hour’s cart add-ins. These two estimates are highly consistent in both direction and
magnitude, which helps establish internal validity for the fixed effect approach by strengthening
the causal argument and helps establish external validity for the field experiment by extrapolating
the finding over a larger data set.
7.2.2. Behavioral mechanisms. We find that consumer learning depends on the deal
attributes, suggesting that consumers not only learn from other customers but also moderate their

Cui, Zhang, Bassamboo: Learning from Inventory Availability Information22
inferences using various observable deal characteristics that give rise to the herd. The sign and the
magnitude of the interaction terms are robust across Columns III - VI.
We show that a higher actual discount rate mitigates the learning effect, i.e., the actual discount
has a negative interaction with Claim. In other words, the same herding momentum signals a
better deal value if the deal has a weaker promotional depth. This finding suggests that discount
rate and percentage-claimed information provide similar information content, and thus, customers
learn about the deal value from inventory information.
Interestingly, the listed discount by deal sellers has no significant impact on learning, i.e., the
interaction term of Claim × List discount in Column VI is insignificant. Recall that lightning
deals’ listed discount percentage is almost twice as much as the actual discount percentage. This
finding provides side evidence that customers are rational decision makers—they search for the
actual regular price or the price offered by other sellers before making a purchase and they are
knowledgeable enough to differentiate the actual discount rate from the listed discount rate.
We also show that a higher product rating amplifies the learning effect, i.e., the rating has a
positive interaction with Claim. This suggests that customer rating and the availability information
signal different information content, as these two sources of information complement each other
to attract sales. Thus, customers do not learn about product quality from inventory information.
In addition, the number of reviews has no significant effect on potential sales. This indicates that
compared with the sentiment toward the products, the number of reviews does not have a significant
influence on consumers’ choices.
Finally, the interaction term Claim×V ariety is negative, which suggests that the signal strength
of the availability information diminishes when customers choose from a larger number of options.
Amazon’s lightning deal page displays the average inventory information across multiple options
of deal. Customers have to click the “choose option” button and select the exact option they want.
This costly action may dilute customer attention to the inventory information and thus weaken
the strength of the signal.
Remark. Note that so far we study the potential sales, i.e., cart add-ins, as the dependent variable.
When a customer purchases a lightning deal item that she has added to her cart, the purchase is
counted as an actual sale and the incremental claim percentage that corresponds to her purchase
remains in the inventory status bar. If a customer chooses not to check out the product, the item
will be dropped from her cart and this dropped item will not translate into an actual sale. Thus,
there is a difference between cart add-ins and actual sales. To show the robustness of our finding
in actual sales, we also construct an approximate measure of the hourly sales as the difference
between the hour-end and hour-beginning percentage claims. Please note that this measure is less
accurate because it requires an implausible assumption that the exact same number of items are in

Cui, Zhang, Bassamboo: Learning from Inventory Availability Information23
Table 5 Impact of Inventory Level
Level of ScarcityClaim<
100%Claim<
85%Claim<
70%Claim<
55%Claim>
55%
Claim 0.243∗∗∗ 0.225∗∗∗ 0.172∗∗∗ 0.150∗∗∗ 0.252∗∗∗
(0.045) (0.045) (0.045) (0.045) (0.045)
Time control Yes Yes Yes Yes YesCharacteristic control Yes Yes Yes Yes Yes
Observations 123,115 121,981 120,137 117,439 5,676
Note: This table reports the estimated coefficient values of equation (5) and standard errors clustered at the
deal level with the time and deal characteristic controls over different levels of scarcity. The first four columns
report the estimation based on subsets including deals with the maximum percentage-claim smaller than
100%, 85%, 70% and 55%, respectively. The last column reports the estimation based on a subset including
deals with the maximum percentage-claim larger than 55%. The errors are corrected for heteroskedasticity.
Significance at ∗p<0.1; ∗∗p<0.05; ∗∗∗p<0.01.
the cart at the beginning and at the end of any time period that we study. Given that the average
approximate sales is 2.4 units per hour, this measure becomes very sensitive to an imbalance
between hour-beginning and hour-end in-cart units. Therefore, our main result does not include
this measure. We repeat the fixed effect analysis and the interacted fixed effect analysis using this
approximate measure, and we find that the signs of the parameters completely align with those
for the cart add-ins. Nevertheless, if the conversion rate is constant across deals, our main finding
with respect to the cart add-ins shows the ability of the inventory information to catch customers’
attention and translate more of these add-ins, these potential sales, into actual sales.
7.2.3. The impact of low inventory availability. To understand how consumer learning
is impacted by the level of product availability, which captures the scarcity effect, we re-run the
fixed-effect model across subsets of the panel data with various levels of scarcity. We measure the
level of scarcity of each deal by its final claim. When the final percentage of products claimed is
small, there is plenty of leftover inventory during the selling period and thus customers do not face
a high out-of-stock risk. The dominant driver in customer learning is herding. In contrast, when
the final claimed percentage is large, customers might rush their purchasing decisions because they
might be afraid of stockout. The scarcity effect suggests that the momentum of customer learning
increases as the percentage claimed increases.
Table 5 presents the estimated learning effects across subsets of the data with different scarcity
levels. The results suggests a significantly increasing trend in the learning coefficient: the intensity
of learning increases with the scarcity level. This empirical evidence is consistent with the scarcity
effect. For deals with enough inventory, the learning momentum is likely to remain constant over
time, while, for deals with low inventory, the learning momentum is intensified by the scarcity
effect.

Cui, Zhang, Bassamboo: Learning from Inventory Availability Information24
8. Conclusions
The extant literature in operations management has studied how customers’ strategic reactions to
inventory information may impact firms’ inventory management, assortment, sourcing and infor-
mation sharing decisions. Our paper provides empirical evidence that confirms the necessity to
explore the strategic relations between customers and inventory information. In particular, our
results show that consumers strategically learn from inventory information. There are two learning
mechanisms. First, inventory information reflects the collective peer purchasing decisions, and con-
sumers can learn about the deal quality from such information—creating an observational learning
effect. Second, a low inventory availability creates an out-of-stock pressure among buyers, and thus
prompts a resulting urgency to make an immediate purchase—leading to a scarcity effect. Our
findings show evidence of both drivers.
Identifying the social learning effect has been recognized as a difficult task due to endogeneity
concerns. To tackle this challenging problem, we design and run a randomized field experiment on
Amazon by generating exogenous shocks to inventory information, which establishes the internal
validity of our findings. We also employ a fixed-effect model analysis on our rich observational data
to establish the external validity of our findings and study the underlying mechanisms of consumer
learning. We find that consumers not only learn from the presence of herding, but also rationally
moderate their inferences from the various reasons that give rise to the herd. In particular, our
results show that consumers primarily learn about the deal’s value rather than the product quality
from availability information while making a lightning deal purchase. Moreover, our empirical
evidence suggests that scarcity may also drive purchasing decisions, as the learning momentum
amplifies when availability decreases.
Because a decreasing inventory availability not only sends a favorable signal for product quality
but also may create a stockout pressure among customers, our results have a limitation. First,
we show that more past sales attract more future customers, which confirms that they react to
and learn from inventory information. But we are unable to perfectly disentangle the herding and
scarcity mechanisms. Future research should explore the conditions under which the scarcity effect
begins to influence consumers and try to estimate herding and scarcity separately.
In an era when the advances in information technology have allowed companies to share their
information at a much lower cost, it is important to understand how information impacts consumer
behavior and reshapes demand so that it aligns profitably with supply. Information has been used
as an important operations lever by companies to balance supply and demand. Prior research
has shown that this goal can be achieved, for example, by disclosing obscure pricing or inventory
information to customers (Fay and Xie 2008, Jerath et al. 2010, and Cui and Shin 2016), by
sharing committed product availability to customers (Su and Zhang 2009), or by enhancing trust

Cui, Zhang, Bassamboo: Learning from Inventory Availability Information25
in the shared information (Ozer et al. 2011 and Ozer et al. 2016). Our paper demonstrates that
disclosing firms’ inventory availability information can also lead to customer learning and cause an
acceleration in sales, and we hope that exploring such a relationship may spark future empirical
research in the interaction between strategic customer learning and operations decisions.
Further, we are the first to collect data from a new and rich source: the Amazon lightning
deal platform, which allows us to study consumer behavior in retail operations. We also point
out a plausible and convenient way to run field experiments on Amazon’s flash sales platform. By
showcasing this data source and the experimentation technique, we hope that our paper serves as
a stepping stone for future research to explore new issues in consumer purchasing behavior.
References
Anderson, Eric T, Gavan J Fitzsimons, Duncan Simester. 2006. Measuring and mitigating the costs of
stockouts. Management Science 52(11) 1751–1763.
Anderson, Lisa R, Charles A Holt. 1997. Information cascades in the laboratory. The American economic
review 847–862.
Balachander, Subramanian, Yan Liu, Axel Stock. 2009. An empirical analysis of scarcity strategies in the
automobile industry. Management Science 55(10) 1623–1637.
Banerjee, Abhijit V. 1992. A simple model of herd behavior. The Quarterly Journal of Economics 797–817.
BIA/Kelsey. 2011. Consumer spending on deal-a-day offers likely to reach $3.9b in u.s. by 2015. Press
release, BIA/Kelsey, Chantilly, VA. http: // www. biakelsey. com/ Company/ Press-Releases/
110303-Consumer-Spending-on-Deal-a-Day-Offers-Likely-to-Reach-£3. 9B-in-U. S.
-by-2015. asp .
Bikhchandani, Sushil, David Hirshleifer, Ivo Welch. 1992. A theory of fads, fashion, custom, and cultural
change as informational cascades. Journal of political Economy 992–1026.
Brock, Timothy C. 1968. Implications of commodity theory for value change. Psychological foundations of
attitudes 1 243–275.
Cachon, Gerard P, A Gurhan Kok. 2007. Category management and coordination in retail assortment
planning in the presence of basket shopping consumers. Management Science 53(6) 934–951.
Cai, Hongbin, Yuyu Chen, Hanming Fang. 2009. Observational learning: Evidence from a randomized natural
field experiment. American Economic Review 99(3) 864–82.
Chen, Yubo, Qi Wang, Jinhong Xie. 2011. Online social interactions: A natural experiment on word of mouth
versus observational learning. Journal of marketing research 48(2) 238–254.
Craig, Nathan, Nicole DeHoratius, Ananth Raman. 2016. The impact of supplier inventory service level on
retailer demand. Manufacturing & Service Operations Management .

Cui, Zhang, Bassamboo: Learning from Inventory Availability Information26
Cui, Ruomeng, Hyoduk Shin. 2016. Sharing aggregate inventory information with customers: strategic cross-
selling and shortage reduction. Management Science .
Debo, Laurens, Garrett Van Ryzin. 2009. Creating sales with stock-outs. Available at SSRN 1923706 .
DeGraba, Patrick. 1995. Buying frenzies and seller-induced excess demand. The RAND Journal of Economics
331–342.
Dholakia, Utpal M. 2011. How businesses fare with daily deals: A multi-site analysis of groupon, livingsocial,
opentable, travelzoo, and buywithme promotions. Livingsocial, Opentable, Travelzoo, and BuyWithMe
Promotions (June 13, 2011) .
Duan, Wenjing, Bin Gu, Andrew B Whinston. 2009. Informational cascades and software adoption on the
internet: an empirical investigation. Mis Quarterly 23–48.
Fay, Scott, Jinhong Xie. 2008. Probabilistic goods: A creative way of selling products and services. Marketing
Science 27(4) 674–690.
Gallino, Santiago, Gerard Cachon, Marcelo Olivares. 2013. Does adding inventory increase sales? evidence
of a scarcity effect in us automobile dealerships. Working paper, Dartmouth College, Hanover, NH. .
Gaur, Vishal, Dorothee Honhon. 2006. Assortment planning and inventory decisions under a locational
choice model. Management Science 52(10) 1528–1543.
Gaur, Vishal, Young-Hoon Park. 2007. Asymmetric consumer learning and inventory competition. Manage-
ment Science 53(2) 227–240.
Goeree, Jacob K, Thomas R Palfrey, Brian W Rogers, Richard D McKelvey. 2007. Self-correcting information
cascades. The Review of Economic Studies 74(3) 733–762.
Grella, Stephanie. 2015. Amazons lightning sales: The real deals of cyber
monday. Press release, Observer.com. http: // observer. com/ 2015/ 11/
amazons-lightning-sales-the-real-deals-of-cyber-monday/ .
Guarino, Antonio, Heike Harmgart, Steffen Huck. 2011. Aggregate information cascades. Games and Eco-
nomic Behavior 73(1) 167–185.
Hall, Joseph, Evan Porteus. 2000. Customer service competition in capacitated systems. Manufacturing &
Service Operations Management 2(2) 144–165.
Herzenstein, Michal, Utpal M Dholakia, Rick L Andrews. 2011. Strategic herding behavior in peer-to-peer
loan auctions. Journal of Interactive Marketing 25(1) 27–36.
Iyengar, Sheena S, Mark R Lepper. 1999. Rethinking the value of choice: a cultural perspective on intrinsic
motivation. Journal of personality and social psychology 76(3) 349.
Iyengar, Sheena S, Mark R Lepper. 2000. When choice is demotivating: Can one desire too much of a good
thing? Journal of personality and social psychology 79(6) 995.

Cui, Zhang, Bassamboo: Learning from Inventory Availability Information27
Jerath, Kinshuk, Serguei Netessine, Senthil K Veeraraghavan. 2010. Revenue management with strategic
customers: Last-minute selling and opaque selling. Management Science 56(3) 430–448.
Kabra, Ashish, Elena Belavina, Karan Girotra. 2015. Bike-share systems: Accessibility and availability.
Chicago Booth Research Paper (15-04).
Kirmani, Amna, Akshay R Rao. 2000. No pain, no gain: A critical review of the literature on signaling
unobservable product quality. Journal of marketing 64(2) 66–79.
Kremer, Mirko, Laurens Debo. 2015. Inferring quality from wait time. Management Science .
Levitt, Steven D, John A List. 2007. What do laboratory experiments measuring social preferences reveal
about the real world? The journal of economic perspectives 21(2) 153–174.
Li, Xitong, Lynn Wu. 2014. Herding and social media word-of-mouth: Evidence from groupon. Available at
SSRN 2264411 .
Liu, Qian, Garrett J Van Ryzin. 2008. Strategic capacity rationing to induce early purchases. Management
Science 54(6) 1115–1131.
Lynn, Michael. 1991. Scarcity effects on value: A quantitative review of the commodity theory literature.
Psychology & Marketing 8(1) 43–57.
Manski, Charles F. 1993. Identification of endogenous social effects: The reflection problem. The review of
economic studies 60(3) 531–542.
Manski, Charles F. 2000. Economic analysis of social interactions. The Journal of Economic Perspectives
14(3) 115–136.
Musalem, Andres, Marcelo Olivares, Eric T Bradlow, Christian Terwiesch, Daniel Corsten. 2010. Structural
estimation of the effect of out-of-stocks. Management Science 56(7) 1180–1197.
Netessine, Serguei, Nils Rudi. 2003. Centralized and competitive inventory models with demand substitution.
Operations Research 51(2) 329–335.
Netessine, Serguei, Nils Rudi, Yunzeng Wang. 2006. Inventory competition and incentives to back-order. IIE
Transactions 38(11) 883–902.
Ozer, Ozalp, Upender Subramanian, Yu Wang. 2016. Information sharing, advice provision or delegation:
What leads to higher trust and trustworthiness? Management Science .
Ozer, Ozalp, Yanchong Zheng, Kay-Yut Chen. 2011. Trust in forecast information sharing. Management
Science 57(6) 1111–1137.
Paulsen, Michael B, John C Smart. 2013. Higher education: Handbook of theory and research. Springer.
Ryzin, Garrett van, Siddharth Mahajan. 1999. On the relationship between inventory costs and variety
benefits in retail assortments. Management Science 45(11) 1496–1509.
Simonsohn, Uri, Dan Ariely. 2008. When rational sellers face nonrational buyers: evidence from herding on
ebay. Management science 54(9) 1624–1637.

Cui, Zhang, Bassamboo: Learning from Inventory Availability Information28
Sorensen, Alan T. 2006. Social learning and health plan choice. The Rand journal of economics 37(4)
929–945.
Stock, Axel, Subramanian Balachander. 2005. The making of a hot product: A signaling explanation of
marketers scarcity strategy. Management Science 51(8) 1181–1192.
Su, Xuanming, Fuqiang Zhang. 2009. On the value of commitment and availability guarantees when selling
to strategic consumers. Management Science 55(5) 713–726.
Tereyagoglu, Necati, Senthil Veeraraghavan. 2012. Selling to conspicuous consumers: Pricing, production,
and sourcing decisions. Management Science 58(12) 2168–2189.
Tomlin, Brian. 2009. Impact of supply learning when suppliers are unreliable. Manufacturing & Service
Operations Management 11(2) 192–209.
Veeraraghavan, Senthil K, Laurens G Debo. 2011. Herding in queues with waiting costs: Rationality and
regret. Manufacturing & Service Operations Management 13(3) 329–346.
Wooldridge, Jeffrey M. 2010. Econometric analysis of cross section and panel data. MIT press.
Zhang, Juanjuan, Peng Liu. 2012. Rational herding in microloan markets. Management science 58(5)
892–912.

Cui, Zhang, Bassamboo: Learning from Inventory Availability Information29
Appendices
Figure 2 An Example of Percentage Claim Information over Time
Figure 3 Field Experiment Design Illustration

Cui, Zhang, Bassamboo: Learning from Inventory Availability Information30
Figure 4 Field Experiment Mechanism Illustration
Click the “Add toCart” button one time
from one account;claim increases by 1%
=⇒The deal is added tothe cart and can be
found in the ShoppingCart
⇓
Click the “Add toCart” button from 10
accounts within 2minutes
=⇒

Cui, Zhang, Bassamboo: Learning from Inventory Availability Information31
Table 6 Field Experiment Robustness Analysis
Dependent variable: Cart add-ins per minutePre-50-min Comparison Post-50-min Comparison
Specification I. Treated II. Control III. DiD IV. Treated V. Control VI. DiD
Treated Period 0.045∗∗∗ −0.012 −0.012 0.056∗∗∗ 0.038∗∗ 0.022(0.017) (0.017) (0.017) (0.019) (0.015) (0.015)
Treated Deal −0.017 −0.0005(0.018) (0.016)
Treated Hour ×Treated Deal
0.057∗∗ 0.055∗∗
(0.026) (0.022)Saturday 0.004 0.082∗∗ 0.042∗ −0.007 0.061∗∗ 0.025
(0.030) (0.034) (0.023) (0.031) (0.027) (0.020)Tuesday 0.040 0.040 0.033 0.034 0.065∗∗ 0.047∗∗
(0.033) (0.035) (0.025) (0.033) (0.027) (0.021)Hour −0.019∗∗ 0.026∗∗∗ 0.007 −0.015∗ 0.023∗∗∗ 0.007
(0.008) (0.008) (0.006) (0.008) (0.006) (0.005)No. of Reviews 0.00003 0.0003∗∗∗ 0.0001∗∗∗ 0.00003 0.0002∗∗∗ 0.0001∗∗∗
(0.00003) (0.0001) (0.00003) (0.00003) (0.00004) (0.00003)Review Rating 0.018∗∗ 0.007 0.015∗∗∗ 0.016∗∗ 0.007 0.013∗∗∗
(0.007) (0.007) (0.005) (0.007) (0.006) (0.004)List discount −0.0002 −0.0005 −0.001 −0.001 −0.0004 −0.001∗
(0.001) (0.0004) (0.0003) (0.001) (0.0003) (0.0003)Constant 0.379∗∗∗ −0.362∗∗∗ −0.008 0.345∗∗∗ −0.353∗∗∗ −0.034
(0.113) (0.121) (0.086) (0.120) (0.102) (0.079)
Observations 362 528 890 362 516 878
Note: This table reports the estimated coefficient values of equations (1) and (2) with the time controls and deal
characteristic controls. Column I reports the pre-post comparison relative to the pre-50-min period for the treated
deals of equation (1); Column II reports the pre-post comparison relative to the pre-50-min period for the control
group of equation (1); Column IV reports the pre-post comparison relative to the post-50-min period for the treated
deals of equation (1); Column V reports the pre-post comparison relative to the post-50-min period for the control
group of equation (1); Columns III and VI report the estimation results from the difference-in-difference approach
in equation (2). The errors are corrected for heteroskedasticity. Significance at ∗p<0.1; ∗∗p<0.05; ∗∗∗p<0.01.