learning and individual...
TRANSCRIPT

Learning and Individual Differences 41 (2015) 1–13
Contents lists available at ScienceDirect
Learning and Individual Differences
j ourna l homepage: www.e lsev ie r .com/ locate / l ind i f
Motivation for PhD studies: Scale development and validation☆
David Litalien a,⁎, Frédéric Guay b, Alexandre J.S. Morin a
a Australian Catholic University, Australiab Université Laval, Canada
☆ Authors' note: This research was supported a granHumanities Research Council of canada (SSHRC) and byMotivation andAcademic Success. The third author'sworkwas supported by a research grant from the Australian ReDP140101559) and the first author's work was supporteQuebec Fund for Research, Society and Culture. A substanpared while the first author was completing his Ph.D(Québec, Canada).⁎ Corresponding author at: 25A Barker Road, Locked Ba
Australia.E-mail address: [email protected] (D. Litalien
http://dx.doi.org/10.1016/j.lindif.2015.05.0061041-6080/© 2015 Elsevier Inc. All rights reserved.
a b s t r a c t
a r t i c l e i n f oArticle history:Received 2 July 2014Received in revised form 8 May 2015Accepted 23 May 2015
Keywords:PhD studiesAcademic motivation scaleSelf-determination theory
In Canada and the United States, doctoral attrition rates are estimated to vary from 40% to 60%. Motivation hasbeenproposed as a determinant of doctoral degree completion. The purpose of this studywas to develop and val-idate a scale based on self-determination theory, to assess five types of regulation (intrinsic, integrated, identi-fied, introjected, and external) toward PhD studies. Based on two samples (N = 244, N = 1060), this studyinvolved five steps: (1) item development, (2) factor validation, (3) reliability assessment, (4) convergent anddiscriminant validity assessment, and (5) measurement invariance testing. Findings from both samples weresimilar, supporting a five-factor first-order structure and a two-factor higher-order structure, scale reliability,and convergent and discriminant validity as shown by correlations amongmotivation subscales and correlationsbetween each subscale and various outcomes. Additionally, complete measurement invariance was supportedacross gender, citizenship status, program type, age, and program progression.
© 2015 Elsevier Inc. All rights reserved.
1. Introduction
In OECD (Organization for Economic Cooperation andDevelopment)countries, the number of doctoral degrees awarded grew by 40% in onlyeight years (from 140,000 in 1998 to 200,000 in 2006; Auriol, 2010).Even in Canada and the United States, where a lower increase hadbeen expected, enrollment in doctoral programs rose by 57% and 64%,respectively, between 1998 and 2010 (OECD, 2013). This growinginterest in doctoral studies is partly explained by perceived individualbenefits, such as higher income, wider employment opportunities, bet-ter working conditions, and increased professional and personal mobil-ity (Auriol, 2010; HRSDC, 2006, Statistics Canada and HRSDC, 2009).Moreover, through their research, they produce and disseminateknowledge, develop innovations, and facilitate social and economicdevelopment (AUCC, 2009; Bloom, Hartley, & Rosovsky, 2006;Wendler et al., 2012). However, despite the intensified enrollmentand associated benefits, doctoral attrition rates, which fluctuate widelyacross programs, remain high inNorth America, estimated at 40% to 50%(MERS, 2013; Nettles & Millett, 2006). Even among rigorously selected
t from the Social Sciences andthe Canada Research Chair onin thepreparation of this articlesearch Council (DP130102713;d by a research grant from thetial part of this paper was pre-. studies at Université Laval
g 2002, Strathfield, NSW 2135,
).
students receiving prestigious fellowships, dropout rates can be ashigh as 25% (Wendler et al., 2010).
Although some students may quit school for practical reasons(e.g., attractive job opportunities, family issues), the consequences forothers, as well as universities and society, are unfortunate. Studentswho dropout find fewer employment opportunities, and their self-esteem can be negatively affected (Lovitts, 2001; Statistics Canada andHRSDC, 2003). Moreover, the substantial time and energy they investedin their studies could have been directed to other areas of their personaland professional lives. For universities, doctoral attrition reducesresources while incurring costs for faculty members having investedconsiderable time in research projects that will remain incomplete.For society, non-completion of doctoral studies results in lower produc-tivity and competitiveness compared to other countries (Wendler et al.,2010, 2012).
Regardless of the education level, motivation has become a centralconcept in the understanding of academic persistence and achievement(Pintrich, 2003) and could be particularly important in helping PhDstudents achieve their goals. Compared to other education levels, doc-toral studies are conducted in less structured environments, demandgreater independence, involve heavier workloads (e.g., conducting re-search, publishing results), and encompass more complex tasks. Fur-thermore, PhD students must invest a considerable amount of time intheir studies.
In previous studies,motivation has been proposed as a key constructto explain why some students successfully complete their PhD studieswhile others do not (see Bair & Haworth, 2005 and Reamer, 1990, fora review; Ivankova & Stick, 2007; Lovitts, 2001). Both in surveys andinterviews, students commonly report motivation (or lack thereof) asa reason for leaving or persisting in their program. Most studies

2 D. Litalien et al. / Learning and Individual Differences 41 (2015) 1–13
interested in doctoral students' motivation are qualitative (e.g., Austin,2002; Cardona, 2013; Jablonski, 2001; Kärner, Kukemelk, & Herdlein,2005; O'Meara, Knudsen, & Jones, 2013; see also Bair & Haworth,2005; Reamer, 1990, for a review) and underscore the relevance ofthis construct to persistence and success. Diversemotives have emergedfrom these studies (e.g., intrinsic versus extrinsic reasons, Cardona,2013; Ivankova & Stick, 2007; personal and professional reasons,Hoskins & Goldberg, 2005; unwillingness to experience failure,Clewell, 1987; commitment, O'Meara et al., 2013), suggesting that mo-tivation to pursue PhD studies ismultifaceted. Although insightful, qual-itative studies are based on small samples and on a specific discipline orpopulation (e.g., African–American; King & Chepyator-Thomson, 1996),thereby limiting the generalizability of the findings.
Somequantitative studies have also looked at doctoral students'mo-tivation.Unfortunately,most of these studies have neglected to considerthe multidimensionality of this construct. It has thus been conceptual-ized as a single dimension, assessed with a self-report scale (e.g., self-motivation, Ivankova & Stick, 2007), a single item embedded in a listof potential reasons for noncompleters' departures (Lovitts, 2001), ora single item asking students to evaluate their level of motivationcompared to their peers (Pauley, Cunningham, & Toth, 1999). As an ex-ception, Anderson and Swazey (1998) asked 2,000 students to assessthe importance of various reasons for undertaking doctoral studies.Several reasons were endorsed, such as the desire to gain knowledgein a specific field, conduct research, teach in higher education, and geta well-paying job.
Despite these efforts, the assessment of motivation for PhD studieshas rarely been based on a valid theoretical framework. According toCardona (2013), the development of appropriate conceptual frame-works for understanding motivation at this academic level has beenhindered by the complexity of this multifaceted construct and theassumption that students' experiences at this level are specific to theiracademic discipline. We believe that, in order to gain deeper insightinto students' reasons for pursuing a doctoral degree, further researchneeds to adopt a multidimensional perspective based on a well-established theoretical framework.
One motivation theory that has demonstrated its value and validityin the context of education is self-determination theory (SDT; Ryan &Deci, 2009). A key proposition of SDT is that more internalized regula-tions (i.e., the person fully endorses the behavior) produce morepositive outcomes than less internalized forms of regulations (i.e., thebehavior is performed due to internal pressures or external reasons).This perspective has beenwell supported in primary, secondary and col-lege students (see Guay, Ratelle, & Chanal, 2008), and appears to bewell-suited for understanding motivation and persistence in doctoralstudents as well. Although the distinction between more or less inter-nalized types of regulation has rarely been applied to graduate students,previous studies have found interesting results (see Ahmed& Bruinsma,2006; Losier, 1994), to whichwe devote more attention below. Howev-er, these studies also included weaknesses. The goal of this study wastherefore to develop and validate an SDT-based scale to assess motiva-tion for PhD studies, called the Motivation for PhD Studies scale(MPhD).
1.1. Self-determination theory
SDT proposes that various types of motivation regulate humanbehavior (Deci & Ryan, 1985, 2012). Intrinsic regulation refers toperforming an activity for its own sake, for interest and enjoyment. Incontrast, extrinsic motivation refers to engaging in an activity as ameans to an end that is separate from the activity itself (Deci & Ryan,2012). To better account for the motivational process, Deci and Ryan(1985, 2012) suggested that extrinsic motivation consists of four typesof regulation that reflect various levels of self-determination. Fromlow to high self-determination, these are external regulation,introjected regulation, identified regulation, and integrated regulation
(Deci & Ryan, 1985, 2012). External regulation occurs when an individ-ual adopts a behavior to obtain a reward or to avoid punishment.Introjected regulation occurs when the individual is driven by internalpressure either to pursue self-aggrandizement and contingent self-worth or to avoid guilt and shame. When behaviors are more internal-ized, accepted and valued, as in identified regulation, individualsconsider their behaviors to be important in themselves. Integratedregulation is the most autonomous form of regulation, occurring whenbehaviors are congruent with the personal goals, values and needsthat constitute the self. Whereas identified and integrated regulationsunderlie a greater sense of autonomy, they remain extrinsic, as thedesired outcome remains separable from the activity itself.
According to SDT, these five types of regulation can be situated alongan autonomy continuum encompassing, in order, intrinsic, integrated,identified, introjected and external forms of regulation, where intrinsicregulation is themost autonomous type of motivation and external reg-ulation, the least autonomous (Deci & Ryan, 1985, 2012). Because theseregulations are aligned on a continuum, they are expected to show asimplex correlation pattern, with stronger positive correlationsbetween adjacent forms of regulation than among more distal forms.For example, intrinsic and integrated regulations should be positivelycorrelated, whereas intrinsic regulation should be more weakly (andpotentially negatively) correlated with external regulation.
In linewith this continuum, SDTdistinguishes twobroader categoriesof motivation: autonomous (including intrinsic, integrated and identi-fied regulations) and controlled (including external and introjected reg-ulations). Autonomousmotivation appears to be associatedwith positiveoutcomes, such as intention to persist (Black & Deci, 2000; Vallerand,Fortier, & Guay, 1997), performance in course-related activities(Boiché, Sarrazin, Grouzet, Pelletier, & Chanal, 2008), and subjectivewell-being (Litalien, Lüdtke, Parker, & Trautwein, 2013), whereascontrolled motivation appears to be associated with negative outcomes,such as rote learning (Vansteenkiste, Simons, Lens, Sheldon, & Deci,2004), anxiety (Ryan & Connell, 1989) and lower positive affect (Gillet,Lafrenière, Vallerand, Huart, & Fouquereau, 2014).
1.2. Assessing motivation for PhD studies from an SDT perspective
In the past 30 years, various scales have been developed to assess thedifferent types of regulation proposed by SDT across a wide variety ofcontexts (e.g., sports, education, andwork; Deci & Ryan, 2000). Howev-er, few SDT-based studies have assessed motivation in doctoralstudents. To our knowledge, only Ahmed and Bruinsma (2006) andLosier (1994) have investigated motivation in doctoral and master'sstudents from the SDT perspective. However, they used a slightlyadapted version of the Academic Motivation Scale (AMS; Vallerand,Blais, Brière, & Pelletier, 1989; Vallerand et al., 1992), which was devel-oped mainly for high school and college students. Only minor changeswere made to the wording (e.g., “high school”was replaced by “gradu-ate studies”), andno questionswere added to address students' doctoraldissertations, research skills development, or advisors, all of which areconsidered key components of doctoral programs. Moreover, thesemodified versions were never empirically validated. Changes made tothe AMS and other instruments to measure doctoral motivation couldresult in limited explanatory or predictive value, because the itemsmay have little relevance to doctoral studies and could lead to ambigu-ity about what is being measured (e.g., highly different interpretationsof items).
Furthermore, the AMSwas originally designed for younger students,and does not include items to assess integrated regulation,which occursin a more advanced stage of psychological development when theperson's identity has been formed (Ratelle, Guay, Vallerand, Larose, &Senécal, 2007). This type of regulation could be particularly relevantfor graduate students, who usually have to juggle a number of roles(e.g., worker, spouse, and parent) that might interfere with their stud-ies. Students who fully integrate their behaviors might be more likely

3D. Litalien et al. / Learning and Individual Differences 41 (2015) 1–13
to overcome obstacles to academic success (see McLachlan, Spray, &Hagger, 2011, for an example in the field of physical activity).
Although not directly related to PhD studies, Deemer, Martens, andBuboltz (2010) developed a scale inspired by SDT and achievementmotivation theory (Elliot, 1997) to measure research motivation ingraduate students. However, this scale assesses only the classic intrinsicand extrinsic motivation dichotomy, without considering the morecomplex types of extrinsic regulations (i.e., integrated, identified, andintrojected). For all these reasons, a new scale to assess types of regula-tion toward PhD studies appears to be needed.
1.3. The present study
The goal of this study was to develop and validate an SDT-basedscale to assess motivation for PhD studies. This study relied on twoindependent samples and involved five steps: (1) item development,(2) factor validation, (3) reliability assessment, (4) convergent and dis-criminant validity assessment, and (5)measurement invariance testing.We expected our scale to successfully evaluate the five types of motiva-tion and the two broader categories of motivation (autonomous andcontrolled) to emerge as higher-order factors within a second-orderstructure.
Convergent and discriminant validity were first assessed by examin-ing the correlations among subscales, with the expectation that thecorrelations among regulation types would corroborate the simplexcorrelation pattern theorized by SDT. Second, theywere assessed by ex-amining the correlations between the subscales and a variety of positiveand negative outcomes. Here, our expectation was that more autono-mous forms of regulation (intrinsic, integrated, and identified) wouldbe positively related to positive outcomes (e.g., positive affect, satisfac-tion, and intention to pursue postdoctoral research) and negatively as-sociated with less desirable outcomes (e.g., dropout intention), whilemore controlled forms of regulation (introjected and external) wouldshow the opposite pattern. Additionally, intrinsic regulation shouldhave resulted in more positive outcomes compared to integrated regu-lation, which in turn should have resulted in more positive conse-quences compared to identified regulation. External regulation shouldalso have been more strongly associated with negative consequencescompared to introjected regulation.
The outcome variables were selected for their relevance to SDT, PhDstudies, or both. According to SDT, a central consequence of being au-tonomously motivated is well-being (Ryan & Deci, 2000). Diener, Suh,Lucas, and Smith (1999) conceptualized subjectivewell-being as amul-tidimensional construct that contains pleasant affect, the relative ab-sence of unpleasant affect, overall life satisfaction, and satisfactionwith certain life domains (e.g., studies). Litalien et al. (2013) showedthat autonomous motivation positively predicted these various indica-tors of well-being among young adults. Test anxiety is also a commonproblem among university students that has been negatively associatedwith performance and success (Hembree, 1988). Doctoral students facevarious assessments (e.g., courses and candidacy examination) thatcould generate stress and anxiety. Among adult learners, test anxietyhas been positively associatedwith controlledmotivation and negative-ly associated with autonomous motivation (Vansteenkiste, Zhou, Lens,& Soenens, 2005). Additionally, lower levels of autonomous motivationhave been associated with dropout intention in high school (Vallerandet al., 1997). Postdoctoral intention, thesis difficulties and perceivedacademic performance were also assessed as relevant indicators ofPhD study experiences.
To verify the generalizability of the results of theMPhD scale and thesuitability of this scale for students of diverse backgrounds, we alsotested the measurement invariance of the five-factor structure and thehigher-order structure across both samples and across various relevantsubgroups of PhD students. These subgroups were formed on the basisof gender, citizenship status, program type, age, and study progression.
2. Method
2.1. Participants and procedures
2.1.1. Sample 1In March 2011, an email invitation was sent to every doctorate
student at a large French-language university in Canada using a generalemail list (listserve; N=2319, including a small proportion of non-PhDstudents). Although all students on this list were contacted, only PhDstudents were asked to complete a 154-item online questionnaire(using CallWeb), which took about 35 min to fill out. A total of 339PhD students participated voluntarily, with no financial incentive. Par-ticipation in the study was confidential. Ninety-five participants didnot complete any of the MPhD items. We ran analyses on the sampleof 244 individuals who completed at least part of the scale (approxi-mately 11% of the eligible sample). This subsample was nearly free ofmissing data; only three participants omitted to answer three items orfewer. Mean age was 30.7 years (SD=6.2) and 63.9%were female. Par-ticipants differed in their program progression and had completed anaverage of 6.7 trimesters (SD = 4.7; a normal study year includesthree trimesters). More than half (54.7%) were in natural sciences pro-grams (45.3% in human sciences). With respect to citizenship, 70%were Canadian, 7% were permanent residents, and 23% held temporaryvisas.
2.1.2. Sample 2Several steps were taken to ensure that Sample 2 was sufficiently
large. First, in October 2011, an email was sent to all PhD students en-rolled in a French-speaking Canadian university (N = 2266) to invitethem to participate in a study on determinants of doctoral persistence.We asked them to complete an online questionnaire lasting about40 min. We subsequently used various strategies to remind studentsthat their participation was important: an email to faculty membersasking for their help in recruiting, two personalized emails, phonecalls and, finally, a letter. Students who agreed to complete the ques-tionnaire were eligible for a draw of two iPads. A total of 1,060 PhD stu-dents participated in the study (48% of the eligible sample). Their meanagewas 31.9 years (SD=8.1), and 52.1%were female. The participants,who had completed an average of 7.1 trimesters (SD = 5.5), were en-rolled in 71 programs and 17 faculties. Half the participants were in nat-ural sciences programs (50.7%) and the other half, in human sciences(49.3%). With respect to citizenship, 67.4% were Canadian, 9.1% werepermanent residents, and 23.5% held temporary visas.
2.2. Developing the motivation for PhD studies scale (MPhD)
The MPhD scale was developed to assess each type of regulation to-ward PhD studies proposed within the SDT framework. A group of ex-perts on SDT (i.e., two professors, each with over 10 publicationsbased on SDT, and two PhD students who did their empirical masterthesis using SDT and who were currently focusing on this theoreticalframework in their PhD thesis) first developed a pool of items to assesspossible reasons to persist in doctoral studies according to the five SDTregulation types. Seventeen PhD students were then invited to test thescale. To ensure that the items captured the main reasons for academicpersistence, students were first asked to write down 10 reasons forpersisting in their doctoral studies. To assess the face validity of theitems generated by the expert committee, they were then asked torate the items on their relevance to motivation for PhD studies and onthe clarity of the wording (using five-point scales). Six items that thestudents considered unclear or irrelevant were reworded or replaced.In addition, reasons that were frequently cited by the students but notcomprised in the initial item pool were included, resulting in a 25-item scale. This new pool of items was then reexamined by the expertgroup. Their taskwas to ensure that every retained item had a sufficientlevel of face and content validity. Various studies have used these

4 D. Litalien et al. / Learning and Individual Differences 41 (2015) 1–13
strategies, especially in the health domain (e.g., Broder, McGrath, &Cisneros, 2007; Redsell, Lennon, Hastings, & Fraser, 2004). Retaineditems had to comply with three face-validity criteria: (1) relevance forassessing PhD students' motivation; (2) applicability to most PhD stu-dents, regardless of their programor progression; and (3) wording clar-ity and concision. Regarding content validity, the items had tomeet twocriteria: (1) relevance to the assessment of the intended regulationtypes proposed by SDT; and (2) absence of conceptual redundancywith other items. Based on these five criteria, the group decided todelete 10 items. The shortened scale, which is presented in theAppendix A, includes 15 items (three per regulation type). On thisscale, a general question first asks participants to rate the extent towhich each item corresponds to their reasons for persisting in their doc-toral studies on a five-point Likert scale (1= does not correspond at all,5 = corresponds exactly).
2.3. Measures
In addition to the MPhD scale, participants were asked to completemeasures related to their dropout intentions (both samples), intentionsto pursue postdoctoral research (both samples), satisfaction with theirstudies (both samples) and with their universities and programs morespecifically (Sample 2 only), their levels of test anxiety and positive–negative affect (Sample 1 only), and their levels of academic perfor-mance and problems encountered in relation to their thesis (Sample 2only).
2.3.1. Dropout intention (both samples)Based on Schmitz et al. (2010), two items were used to assess
students' dropout intention in both samples. We asked the followingquestion: “What is the likelihood that you will give up your studies?”Participants answered on a five-point Likert scale (1 = not at all likely,5 = very likely) for two possibilities; 1) “in the next few months” and2) “prior to graduation.” Cronbach's alpha for this scale was .77 in Sam-ple 1 and .91 in Sample 2. As the scale includes only two items, theSpearman–Brown formula was used to obtain a corrected estimate ofreliability. The adjusted scale score reliability coefficient for this scale es-timated for eight equivalent items was .93 in Sample 1 and .98 in Sam-ple 2. A distinction was made between these two possibilities, asdoctoral students who quit their program do so after completing an av-erage of nearly three years (MERS, 2013). The decision to quit appearsto be a long process, and it is plausible that a student stays in a programfor another year despite believing that he or she will not complete it(e.g., enjoying a prestigious scholarship while waiting for an interestingjob opportunity).
2.3.2. Postdoctoral intention (both samples)One dichotomous (“yes” or “no”) item was used to assess postdoc-
toral intention (“After your doctorate, do you plan to pursue postdoctor-al research?”) in both samples. Nearly half the participants (46% inSample 1, 45% in Sample 2) answered positively.
2.3.3. Satisfaction with studies (general satisfaction; both samples)An adaptation of the French version of the Satisfactionwith Life Scale
(Échelle de satisfaction de vie; Blais, Vallerand, Pelletier, & Brière, 1989)was used to assess students' satisfaction with their studies in both sam-ples. This instrument contains four items (e.g., “I am satisfied with mystudies”) rated on a seven-point Likert scale (1 = strongly disagree,7 = strongly agree). Cronbach's alpha for this scale was .86 in Sample1 and .83 in Sample 2.
2.3.4. Satisfaction with the university (university satisfaction; Sample 2)Four itemswere used, in Sample 2 only, to assess satisfactionwith the
university and the field of study (e.g., “If you had to start your PhDstudies over, would you choose the same university?,” “Would you rec-ommend this university to someone interested in another field of
study?”). Responseswere rated on afive-point Likert scale (1= certainlynot, 5 = without a doubt). Cronbach's alpha was .74.
2.3.5. Satisfaction with the program (program satisfaction; Sample 2)A total of 16 items were used, in Sample 2 only, to assess partici-
pants' satisfaction with their program. These items were inspired bythe Canadian Graduate and Professional Student Survey, a national sur-vey conducted by the Canadian Association of Graduate Studies (2010).Each item represents an aspect of the program, and participants wereasked to rate them on a five-point Likert scale (1= poor, 5 = excellent).Examples of items are, “Professors' competence level,” “Availability offaculty members outside class hours,” and “Relation between programcontent and my research objectives.” Cronbach's alpha was .90.
2.3.6. Test anxiety (Sample 1)We used an adaptation of the Test Anxiety Scale (Échelle d'anxiété
envers l'évaluation; Beaudoin & Desrichard, 2009) to assess test anxiety,in Sample 1 only. This instrument contains six items (e.g., “When I thinkabout my future assessment, I feel anxious”). Participants rated eachitem on a seven-point Likert scale (1 = does not correspond at all, 5 =corresponds exactly). Cronbach's alpha was .87.
2.3.7. Positive and negative affect (Sample 1)We administrated the Positive and Negative Affect Schedule
(PANAS; Watson, Clark, & Tellegen, 1988) to assess participants' affec-tivity, in Sample 1 only. This scale contains 20 emotion adjectives, ofwhich 10 assess dispositional positive affect and 10 measure disposi-tional negative affect. Participants rated the extent to which they feltthese emotions on a five-point scale (1 = not at all, 5 = completely).Cronbach's alpha was .89 for positive affect and .84 for negative affect.
2.3.8. Academic performance (performance; Sample 2)In Sample 2 only, participants were asked to rate their performance
in their PhD studies in terms of grades, thesis project and research pro-ductivity on a five-point Likert scale (1 = poor, 5 = excellent).Cronbach's alpha was .73.
2.3.9. Thesis problems (Sample 2)In Sample 2 only, four questions were used to assess the problems
that individuals encountered in completing their thesis. Examples ofitems are, “Choosing a thesis topic is or was a difficult task,” and “Ihave or had problems developing my thesis project.” Participantsrated each item on a seven-point Likert scale (1 = completely disagree,7 = completely agree). Cronbach's alpha was .65.
3. Statistical analyses
3.1. Exploratory structural equation modeling (ESEM)
To test the factor structure of theMPhD scale, we conducted explor-atory structural equation modeling (ESEM) using Mplus 7.3 (Muthén &Muthén, 2012). This recent statistical technique incorporates features ofboth confirmatory factor analysis (CFA) and exploratory factor analysis(EFA). Like CFA, ESEM tests whether the scale comprises five distinctfactors and providesfit indices, standard errors, and tests of significance.However, it is less restrictive than CFA, relaxing the restrictive assump-tion that items should load only on their respective factors (i.e., mainloading) without any cross-loading (Marsh, Morin, Parker, & Kaur1,2014, Marsh et al., 2009;Morin,Marsh, & Nagengast, 2013). Ameasure-ment instrument may have many cross-loadings (albeit much weakerthan their main loadings) that are consistent with the underlying theo-ry, as is the case for SDT. For instance, because all the regulation typesreflectmotivation, somepositive cross-loadings are expected, especiallyamong conceptually adjacent factors (Guay, Morin, Litalien, Valois, andVallerand, 2014). Moreover, when true cross-loadings (i.e. present inthe population model) are forced to be zero in CFA, latent factor

5D. Litalien et al. / Learning and Individual Differences 41 (2015) 1–13
correlations tend to be overestimated, as the only way for the cross-loadings to be expressed is through the inflation of these correlations(e.g., Asparouhov & Muthén, 2009; Marsh et al., 2009; Morin, Arens, &Marsh, in press; Morin et al., 2013).
By incorporating cross-loadings in a model, an ESEM approachovercomes these limitations. It also provides some control overthe fact that items are imperfect indicators of a construct, and thuspresents some degree of irrelevant association with other constructs(i.e., systematic measurement error; see Morin et al., in press). ESEMthus appeared particularly relevant for investigating the psychometricproperties of the MPhD scale and for estimating purer correlationsamong the latent variables in order to better assess the simplex patternsuggested by SDT.
To test the higher-order structure with ESEM, we used the ESEM-within-CFA (EWC) approach described by Morin et al. (2013, in press)(it is currently not possible to apply ESEM methodology to analyzehigher-order factor structure given that higher-order rotational proce-dures have yet to be developed). In this method, parameter estimatesfrom the final first-order ESEM solution are used as start values in theEWC model estimation. The same number of constraints as the ESEMmodel is added for identification purposes. An EWC solution typicallyhas the same parameter estimates, goodness-of-fit, and degrees-of-freedom as the corresponding ESEM solution, but allows higher-orderfactors to be estimated.
Despite choosing ESEM analysis, we first ran CFA to test the five-factor structure, as recommended by Marsh et al. (2009). If the analysisreveals adequate and similar fit indices for both ESEM and CFA models,there is less advantage to pursuing an ESEM analysis because the ESEMmodel is less parsimonious than the CFA model. Nevertheless, an ESEMmodel can still provide a more exact representation of the factor corre-lations when cross-loadings are present in the population model (for areview, see Morin et al., 2013).
3.2. Estimator, missing data, and goodness-of-fit indices
All analyses were performed using the Mplus 7.3 (Muthén &Muthén, 2012) robust weighted least square (WLSMV) estimator forordered-categorical variables. The models were estimated based onthe full information that was available using algorithms implementedin Mplus in conjunction with the WLSMV estimator (Asparouhov &Muthén, 2010).WLSMVwas chosen because this estimator ismore suit-ed to the ordered-categorical nature of Likert scales than traditionalmaximum likelihood estimation (Beauducel & Herzberg, 2006; Finney& DiStefano, 2006; Lubke & Muthén, 2004), resulting in more accurateestimates of key model-parameters. To assess model fit, we used thecomparative fit index (CFI), the Tucker–Lewis index (TLI), the rootmean square error of approximation (RMSEA), and the chi-square teststatistic. It should be noted that previous research has shown that tradi-tional fit indices (CFI, TLI, and RMSEA) perform quite well when theWLSMV estimator is used (Beauducel & Herzberg, 2006; Yu, 2002). Fol-lowing recommendations fromMarsh et al. (2009, 2010) (also see Guayet al., 2014; Morin et al., 2013), we used an oblique Geomin rotationwith an epsilon value of 0.5.
1 Cronbach's alphas (α) were also computed and led to similar results (.73 for intrinsicregulation, .81 for integrated regulation, .65 for identified regulation, .61 for introjectedregulation, and .76 for external regulation).
3.3. Scale score reliability
Scale score reliability estimates were computed from the standard-ized parameter estimates of the models, using McDonald's (1970)omega, ω = (Σ|λi|)2/([Σ|λi|]2 + Σδii), where λi are the standardizedfactor loadings and δii, the standardized item uniquenesses. Comparedwith traditional scale score reliability estimates (e.g., alpha; seeSijtsma, 2009), ω has the advantage of taking into account the strengthof association between items and constructs (λi) aswell as item-specificmeasurement errors (δii).
3.4. Multigroup analyses
Invariance of the measurement model across both samples andmeaningful subgroups of PhD students (i.e., gender, citizenship status,program type, age, and study progression) was tested based on the se-quence described in Guay et al. (2014) for ordered-categorical items.For each subgroup comparison, we successively assessed: (1) configuralinvariance, (2) weak (loadings) invariance, (3) strong (loadings, thresh-olds) invariance, (4) strict (loadings, thresholds, uniquenesses) invari-ance, (5) invariance of the variance/covariance matrix (loadings,thresholds, uniquenesses, latent variances and covariances), and (6) la-tent mean invariance (loadings, thresholds, uniquenesses, latent vari-ances and covariances, latent means). Both chi-square difference testsconducted using the Mplus DIFFTEST function (MDΔχ2; Asparouhov &Muthén, 2006) and fluctuations in fit indices were used to comparenested models. The invariance hypothesis should not be rejected forthe nested model when the CFI decrease is .01 or less or when theRMSEA increase is .015 or less (Chen, 2007; Cheung & Rensvold, 2002).
4. Results
4.1. Sample 1
4.1.1. Preliminary verificationsDescriptive statistics for motivation items are presented in Table 1.
Items were normally distributed, presenting skewness and kurtosis in-dices within the limits suggested by West, Finch, and Curran (1995).Variable means and standard deviations are provided at the bottom ofTable 2. Means for intrinsic, integrated, identified and external regula-tions, test anxiety, satisfaction with studies, and positive affect werehigher than the scale midpoint. However, means were lower than thescale midpoint for introjected regulation, negative affect, and dropoutintention.
4.1.2. Factor validityThe ESEM analysis used to test the a priori five-factor structure of the
MPhD scale showed excellentfit to the data (χ2 [40]=53.385, CFI= .99,TLI= .99, and RMSEA= .04) and fit indices that were systematically su-perior to those obtained with the comparative CFA model (χ2 [80] =218.656, CFI = .94, TLI = .93, and RMSEA = .08). All items loadedstrongly on their respective factors (ranging from .33 to .98, M = .69,SD = .19), and cross-loadings were systematically weaker than themain loadings (− .20 to .37, |M| = .08; SD= .08; see Table 1). Two ex-ceptions to this general pattern were observed: (1) the third item of in-trinsic regulation [i.e., For the pleasure I feel in accomplishing my studyproject (e.g., thesis)] loaded almost equally on its a priori construct(.33) and on the identified regulation factor (.37); and (2) althoughitem 1 of external regulation (i.e., For the prestige associated with aPhD) loaded more strongly on its a priori construct (.42) than on otherfactors, it also showed significant cross-loadings with all regulationtypes (and one negative cross-loading with identified regulation).
The higher-order EWC model showed excellent fit to the data(χ2 [44] = 56.179, CFI = .99, TLI = .99, and RMSEA= .03), with indi-ces similar to those obtained in the first-order ESEMmodel. As expect-ed, intrinsic, integrated, and identified regulations loaded significantlyon autonomous motivation while introjected and external regulationsloaded significantly on controlled motivation (see Table 1).
4.1.3. Scale score reliabilityScale score reliability estimates (ω) for the subscales were .79 for in-
trinsic regulation, .85 for integrated regulation, .69 for identified regula-tion, .73 for introjected regulation, and .85 for external regulation.1

Table 1Sample 1: Descriptive statistics and factor loadings from ESEM and EWC solutions.
Descriptive statistics Factor loadings
Indicators M SD Skewness Kurtosis 1 2 3 4 5
Firstorder (ESEM)
Intrinsic
Item 1 3.86 1.03 –0.72 –0.07 .980** .053 –.028 –.004 .027
Item 2 3.90 0.94 –0.80 0.55 .630** .073 .196** –.037 –.069
Item 3 3.88 1.03 –0.77 0.12 .328** .081 .367** –.196** –.108
Integrated
Item 1 3.99 0.96 –0.81 0.18 .145** .791** –.072 –.045 .021
Item 2 3.43 1.21 –0.35 –0.79 .046 .803** .090* .012 –.010
Item 3 3.86 1.08 –0.86 0.16 .080 .698** .186** –.027 –.002
Identified
Item 1 4.14 0.84 –1.11 1.89 .050 .123* .559** –.164** .114*
Item 2 3.80 1.02 –0.63 –0.10 .043 .064 .746** –.029 .004
Item 3 3.44 1.12 –0.36 –0.63 .191** .045 .536** .073 –.060
Introjected
Item 1 1.55 0.87 1.54 1.61 –.040 –.064 .060 .737** .008
Item 2 2.24 1.22 0.78 –0.34 –.101 –.079 .136 .480** –.145*
Item 3 1.82 1.07 1.25 0.69 –.025 .009 –.156** .792** .054
External
Item 1 2.62 1.30 0.44 –0.86 .201** .191** –.200** .368** .417**
Item 2 3.20 1.23 –0.30 –0.87 –.022 –.040 .031 –.046 .914**
Item 3 2.96 1.29 0.10 –1.10 –.013 .014 .012 .044 .897**
Higher–order (EWC)
Autonomous motivation
Intrinsic regulation 3.88 0.81 –0.77 0.49 .652** – – – –
Integrated regulation 3.76 0.93 –0.58 –0.20 .524** – – – –
Identified regulation 3.79 0.77 –0.57 0.06 .394** – – – –
Controlled motivation
Introjected regulation 1.87 0.80 1.10 0.95 – .973** – – –
Controlled regulation 2.93 1.05 0.13 –0.76 – .274* – – –
Note. Grayscale indicates loadings of the items on their target a priori factor; ** = p b .01. * = p b .05.
6 D. Litalien et al. / Learning and Individual Differences 41 (2015) 1–13
4.1.4. Convergent and discriminant validityFirst, correlations among the regulation subscales were assessed
from the ESEMmodel (see Table 2, under the diagonal). Theywere gen-erally lower than those estimatedwith CFA (see Table 2, above the diag-onal). As expected, correlations (especially ESEM ones) were mostly in
Table 2Sample 1: correlations, means, and standard deviations for all variables.
Factor F1 F2 F3 F4 F5
Five-factor structure (ESEM)F1. Intrinsic regulation – .59** .70** − .36** −0.07F2. Integrated regulation .37** – .49** − .21** 0.09F3. Identified regulation .30** .22** – − .36** −0.10F4. Introjected regulation − .11* −0.07 − .22** – .23**F5. External regulation 0.01 0.08 − .11* .11* –
Higher-order structure (EWC)F6. Autonomous motivation – – – – –F7. Controlled motivation – – – – –
OutcomesF8. Test anxiety − .13* − .14* − .17* .26** .13*F9. General satisfaction .41** .39** .41** − .31** − .21**F10. Positive affect .54** .47** .55** − .39** − .03F11. Negative affect − .13* − .16* − .17* .42** .11F12. Dropout intention − .25** − .25** − .15 .24** − .02F13. Postdoctoral intention .12 .17* .31** − .18 − .11
Descriptive statisticsMean (M) 3.88 3.76 3.79 1.87 2.93Standard deviation (SD) .81 .93 .77 .80 1.05
Note. Correlations below the diagonal were obtained from ESEM and EWC solutions. Correlaobtained using SPSS. Postdoctoral intention was assessed by one dichotomous item (no = 0; y
line with the simplex pattern postulated by SDT: adjacent regulationtypes on the continuum were positively associated, and distant regula-tion types were less strongly associated. Intrinsic regulation waspositively associatedwith integrated (r= .37) and identified regulation(r= .30), negatively associated with introjected regulation (r=− .11),
F6 F7 F8 F9 F10 F11 F12 F13
–− .02 –
− .25** .31** –.70** − .39** − .22** –.53** −29** − .42** .61** –− .28** .79** .63** − .37** − .43** –− .39** 0.18 .26* − .41** − .45** .23** –.33* −0.23 − .05 .19* .23* − .20* − .16 –
3.81 2.4 3.67 5.05 3.64 2.10 1.52 .460.67 0.7 .96 1.22 .71 .71 .62 .50
tions above the diagonal were obtained from a CFA solution. Descriptive statistics werees = 1). ** = p b .01. * = p b .05.

2 Cronbach's alphas (α) were of a similarmagnitude (.69 for intrinsic regulation, .71 forintegrated regulation, .60 for identified regulation, .68 for introjected regulation, and .71for external regulation).
7D. Litalien et al. / Learning and Individual Differences 41 (2015) 1–13
and not associated with external regulation. Integrated regulation wasalso positively associated with identified regulation (r = .22) and notassociated with introjected and external regulations. Identified regula-tion was negatively associated with both introjected (r = − .22; unex-pected result) and external (r = − .11) regulations, while introjectedregulation was positively associated (r= .11) with external regulation.
Second, the correlation between the higher-order factors was esti-mated with the EWC model. The results showed that autonomous andcontrolled motivations were not associated (i.e., orthogonal;r = − .02). Third, correlations among the regulation types and thevarious outcomes considered here were obtained by adding covariates,defined as CFA factors, to the final retained models. Relationshipsbetween the covariates and the first-order regulation subscales weretested using the first-order ESEM model. Then, relationships betweenthe covariates and the broader motivation categories (i.e., the higher-order factors) were assessed using the higher-order model (EWC).Both of these models provided adequate fit to the data (CFI andTLI ≥ .90, RMSEA ≥ 0.06) and correlation estimates mostly in line withthe hypotheses (see Table 2).
Third, correlations among the regulation types and the various out-comes considered here were obtained by adding covariates, defined asCFA factors, to the final retained models. Relationships between the co-variates and the first-order regulation subscales were tested using thefirst-order ESEM model. Then, relationships between the covariatesand the broader motivation categories (i.e., the higher-order factors)were assessed using the higher-order model (EWC). Both of thesemodels provided adequate fit to the data (CFI and TLI ≥ .90,RMSEA ≥ 0.06) and correlation estimates mostly in line with thehypotheses (see Table 2).
At the first-order level, autonomous types of regulation (intrinsic, in-tegrated, identified) were positively associated with satisfaction withstudies and positive affect, andwere negatively associatedwith test anx-iety and negative affect. In addition, intrinsic and integrated regulationswere negatively associated with dropout intention, whereas integratedand identified regulations were positively associated with postdoctoralintention. Correlations were not stronger for intrinsic regulation thanfor integrated or identified regulations. Concerning controlled types ofregulation, introjected regulation was negatively associated with satis-faction with studies and positive affect, and positively associated withtest anxiety, negative affect, and dropout intention. External regulationwas negatively associated with satisfaction with studies and positivelyassociated with test anxiety, but no association was found with otheroutcomes.
At the higher-order level, autonomousmotivationwas positively as-sociated with satisfaction with studies, positive affect, and postdoctoralintention, but negatively associated with text anxiety, negative affect,and dropout intention. Controlled motivation showed an oppositepattern for text anxiety, satisfaction with studies, positive and negativeaffect, but was unrelated to dropout or postdoctoral intentions.
4.2. Sample 2
4.2.1. Preliminary verificationsDescriptive statistics for the motivation scale items are reported in
Table 3. Items were normally distributed, presenting skewness and kur-tosis indices within the limits suggested by West et al. (1995). Percent-ages of missing data on variables ranged from 0% to 15% (see Table 4).Factor means and standard deviations are also presented at the bottomof Table 4. Means for intrinsic, integrated, identified and external regula-tions, test anxiety, satisfaction with studies, and positive affect werehigher than the scale midpoint. Means were lower than the scale mid-point for introjected regulation, negative affect, and intention to dropout.
4.2.2. Factor validityOnce again, the a priori ESEM representation showed excellent fit to
the data: (χ2 [40] = 123.427, CFI = .99, TLI = .98, and RMSEA = .04),
and fit indices that were superior to those obtained with CFA(χ2 [80] = 952.568, CFI = .91, TLI = .88, and RMSEA = .10). Mostitems loaded strongly on their a priori factors (ranging from .23 to .93,M = .63, SD = .19) and cross-loadings were systematically weakerthan the main loadings (− .32 to .53, |M| = .09; SD = .10; seeTable 3). Two exceptions to this general pattern were observed, and in-volved the same items as in Sample 1: (1) the third item of intrinsic reg-ulation loaded at .34 on its construct and at .53 on identified regulation,and (2) the first item of external regulation loaded at .23 on its con-struct, but also slightly higher on intrinsic (.28), integrated (.30), andintrojected (.24) regulations. Overall, these results confirm a five-factor structure and suggest that two items should be targeted for re-assessment and perhaps reformulation or replacement.
The higher-order EWC model showed excellent fit to the data(χ2 [44] = 111.483, CFI = .99, TLI = .99, and RMSEA = .03), with in-dices similar to those obtained in the first-order ESEM model. As inSample 1, intrinsic, integrated, and identified regulations loaded signif-icantly on autonomousmotivation, and introjected and external regula-tions loaded significantly on controlled motivation (see Table 3).
4.2.3. Scale score reliabilityScale score reliability estimates (ω) for the subscales were .73 for in-
trinsic regulation, .73 for integrated regulation, .60 for identified regula-tion, .78 for introjected regulation, and .81 for external regulation.2
4.2.4. Convergent and discriminant validityCorrelations among the regulation subscales partly corroborated the
expected simplex pattern (see ESEM analysis results, Table 4, under thediagonal), but not as clearly as in Sample 1. Intrinsic regulationwas pos-itively associatedwith all other regulation types, and the strength of thecorrelations followed the expected SDT continuum (integrated, r= .45;identified, r = .27; introjected, r = .15; external, r = .12). Integratedregulation was also associated with identified (r = .28) and external(r = .20) regulations following a similar pattern. Identified regulationshowed anunexpected pattern of correlations, as itwas negatively asso-ciated with introjected regulation (r = − .10) but positively associatedwith external regulation (r = .06). Introjected and external regulationwere positively associated (r= .20). Unexpectedly, external regulationwas positively, albeit weakly, associated with all autonomous types ofregulation. It was also associatedmore stronglywith intrinsic regulation(r = .12) than with identified regulation (r = .06). In the higher-ordermodel, autonomous and controlled motivations were positivelyassociated (r = .31).
As in Sample 1, correlations among the regulation types and the var-ious outcomes considered here were obtained by adding covariates tothe final models (first-order ESEM and higher-order EWC; seeTable 4). Once again, both of these models provided adequate fit tothe data (CFI and TLI ≥ .90, RMSEA ≤ 0.06) and correlation estimatesmostly in line with the hypotheses.
At the first-order level, autonomous types of regulations (intrinsic,integrated, identified) were positively associated with general satisfac-tion, university satisfaction, program satisfaction, performance, andpostdoctoral intention, and negatively associated with thesis problems.Integrated and identified regulations were also negatively associatedwith dropout intention. Introjected regulation was negatively associat-ed with general satisfaction, university satisfaction, and performance,but positively associated with dropout intention and thesis problems.Finally, external regulationwas negatively associatedwith performanceand positively associated with thesis problems.
At the higher-order level, autonomousmotivationwas positively as-sociatedwith general satisfaction, university satisfaction, program satis-faction, performance, and postdoctoral intention, and negatively

Table 3Sample 2: Descriptive statistics and factor loadings from ESEM and EWC solutions.
Descriptive statistics Factor loadings
Item M SD Skewness Kurtosis 1 2 3 4 5
First–order (ESEM)
Intrinsic
Item 1 3.67 1.16 –0.71 –0.26 .755** .145** –.070** –.017 .038*
Item 2 3.72 1.13 –0.80 –0.11 .711** –.001 .198** .051* –.002
Item 3 3.89 1.08 –0.90 0.23 .341** .053 .527** –.048 –.087**
Integrated
Item 1 4.24 0.91 –1.28 1.52 .213** .553** .023 –.057 –.011
Item 2 3.22 1.28 –0.26 –0.98 .145** .659** .055* .097** –.028
Item 3 3.77 1.15 –0.79 –0.15 .028 .667** .194** –.053* .120**
Identified
Item 1 4.17 0.96 –1.18 1.02 .069 .193** .532** –.076* .231**
Item 2 3.91 1.06 –0.86 0.20 .031 .234** .604** –.019 –.012
Item 3 3.25 1.30 –0.39 –0.94 .157** .024 .432** .173** .104**
Introjected
Item 1 1.61 0.96 1.61 1.83 –.017 .012 –.002 .784** .014
Item 2 2.37 1.33 0.53 –0.95 .024 –.068* .091 .662** .058*
Item 3 1.94 1.21 1.07 –0.01 .067 .053 –.126** .719** .081**
External
Item 1 2.54 1.26 0.36 –0.94 .280** .300** –.326** .244** .228**
Item 2 3.23 1.31 –0.35 –1.00 .006 .036 –.013 –.017 .928**
Item 3 2.99 1.29 –0.11 –1.09 .014 –.014 .039* .089** .847**
Higher–order (EWC)
Autonomous Motivation
Intrinsic regulation 3.76 0.89 –0.73 0.15 .685** – – – –
Integrated regulation 3.74 0.90 –0.62 –0.12 .572** – – – –
Identified regulation 3.77 0.83 –0.73 0.40 .308** – – – –
Controlled motivation
Introjected regulation 1.97 0.92 0.91 0.31 – .293** – – –
Controlled regulation 2.92 1.03 –0.07 –0.75 – .664** – – –
Note. Grayscale indicates loadings of the items on their target a priori factor; ** = p b .01. * = p b .05.
8 D. Litalien et al. / Learning and Individual Differences 41 (2015) 1–13
associated with dropout intention and thesis problems. Controlledmotivation was negatively associated with general satisfaction andperformance, positively associated with dropout intention and thesisproblems, and unrelated to university and program satisfaction andpostdoctoral intention.
Table 4Sample 2: Correlations, Means, standard deviations, and percentage of missing values for all va
Factor F1 F2 F3 F4 F5 F6
Five-factor structure (ESEM)F1. Intrinsic regulation – .72** .74** .13** .23**F2. Integrated regulation .45** – .70** .09* .34**F3. Identified regulation .27** .28** – 0.03 .29**F4. Introjected regulation 15** .05 − .10** – .40**F5. External regulation .12** .20** .06** .20** –
Higher-order structure (EWC)F6. Autonomous motivation – – – – – –F7. Controlled motivation – – – – – .31**
OutcomesF8. General satisfaction .27** .36** .54** − .16** .01 .72**F9. University satisfaction .12** .16** .37** − .10* − .01 .41**F10. Program satisfaction .15** .17** .33** − .05 − .06 .40**F11. Performance .24** .22** .33** − .21** − .08* .47**F12. Dropout intention − .04 − .25** − .24** .23** − .06 − .34F13. Thesis problems − .25** − .20** − .57** .31** .12** − .63F14. Postdoctoral intention .11* .34** .33** .00 .05 .47**
Descriptive statisticsMean (M) 3.76 3.74 3.77 1.97 2.92 3.76Standard deviation (SD) 0.89 0.90 0.83 0.92 1.03 0.7Missing values (%) 0 0 0 0 0 0
Note. Correlations below the diagonal were obtained from ESEM and EWC solutions. Correlatiotained using SPSS. Postdoctoral intention was assessed by one dichotomous item (no = 0; yes
4.3. Combined sample
4.3.1. Measurement invariance across samples 1 and 2To verify the extent to which the final retained ESEM model was
replicated across samples (and whether observed differences were
riables.
F7 F8 F9 F10 F11 F12 F13 F14
–
−15* –−12 .63** –−0.08 .58** .66** –− .27** .57** .29** .35** –
** .23** − .47** − .32** − .27** − .43** –** .43** − .70** − .49** − .41** − .69** .50** –
0.07 .14** .01 .03 .15** − .23** − .16* –
2.45 5.09 3.95 3.48 3.67 1.57 2.86 0.460.79 1.13 0.75 0.61 0.69 0.72 0.97 0.500 0 4.1 4.1 4.9 10.8 15.1 15.2
ns above the diagonal were obtained from a CFA solution. Descriptive statistics were ob-= 1). Descriptive statistics were obtained using SPSS. ** = p b .01. * = p b .05.
9D. Litalien et al. / Learning and Individual Differences 41 (2015) 1–13
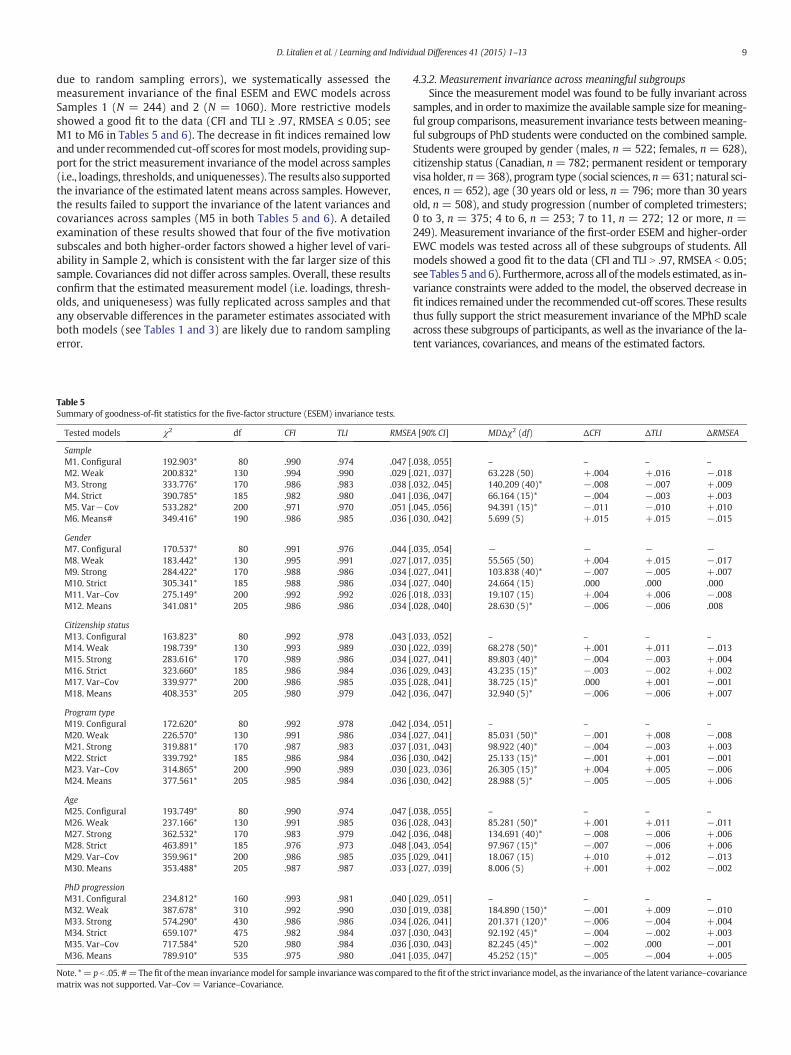
due to random sampling errors), we systematically assessed themeasurement invariance of the final ESEM and EWC models acrossSamples 1 (N = 244) and 2 (N = 1060). More restrictive modelsshowed a good fit to the data (CFI and TLI ≥ .97, RMSEA ≤ 0.05; seeM1 to M6 in Tables 5 and 6). The decrease in fit indices remained lowand under recommended cut-off scores formostmodels, providing sup-port for the strict measurement invariance of themodel across samples(i.e., loadings, thresholds, and uniquenesses). The results also supportedthe invariance of the estimated latent means across samples. However,the results failed to support the invariance of the latent variances andcovariances across samples (M5 in both Tables 5 and 6). A detailedexamination of these results showed that four of the five motivationsubscales and both higher-order factors showed a higher level of vari-ability in Sample 2, which is consistent with the far larger size of thissample. Covariances did not differ across samples. Overall, these resultsconfirm that the estimated measurement model (i.e. loadings, thresh-olds, and uniquenesess) was fully replicated across samples and thatany observable differences in the parameter estimates associated withboth models (see Tables 1 and 3) are likely due to random samplingerror.
Table 5Summary of goodness-of-fit statistics for the five-factor structure (ESEM) invariance tests.
Tested models χ2 df CFI TLI RMSE
SampleM1. Configural 192.903* 80 .990 .974 .047 [M2. Weak 200.832* 130 .994 .990 .029 [M3. Strong 333.776* 170 .986 .983 .038 [M4. Strict 390.785* 185 .982 .980 .041 [M5. Var−Cov 533.282* 200 .971 .970 .051 [M6. Means# 349.416* 190 .986 .985 .036 [
GenderM7. Configural 170.537* 80 .991 .976 .044 [M8. Weak 183.442* 130 .995 .991 .027 [M9. Strong 284.422* 170 .988 .986 .034 [M10. Strict 305.341* 185 .988 .986 .034 [M11. Var–Cov 275.149* 200 .992 .992 .026 [M12. Means 341.081* 205 .986 .986 .034 [
Citizenship statusM13. Configural 163.823* 80 .992 .978 .043 [M14. Weak 198.739* 130 .993 .989 .030 [M15. Strong 283.616* 170 .989 .986 .034 [M16. Strict 323.660* 185 .986 .984 .036 [M17. Var–Cov 339.977* 200 .986 .985 .035 [M18. Means 408.353* 205 .980 .979 .042 [
Program typeM19. Configural 172.620* 80 .992 .978 .042 [M20. Weak 226.570* 130 .991 .986 .034 [M21. Strong 319.881* 170 .987 .983 .037 [M22. Strict 339.792* 185 .986 .984 .036 [M23. Var–Cov 314.865* 200 .990 .989 .030 [M24. Means 377.561* 205 .985 .984 .036 [
AgeM25. Configural 193.749* 80 .990 .974 .047 [M26. Weak 237.166* 130 .991 .985 036 [M27. Strong 362.532* 170 .983 .979 .042 [M28. Strict 463.891* 185 .976 .973 .048 [M29. Var–Cov 359.961* 200 .986 .985 .035 [M30. Means 353.488* 205 .987 .987 .033 [
PhD progressionM31. Configural 234.812* 160 .993 .981 .040 [M32. Weak 387.678* 310 .992 .990 .030 [M33. Strong 574.290* 430 .986 .986 .034 [M34. Strict 659.107* 475 .982 .984 .037 [M35. Var–Cov 717.584* 520 .980 .984 .036 [M36. Means 789.910* 535 .975 .980 .041 [
Note. *= p b .05. #=Thefit of themean invariancemodel for sample invariancewas comparedmatrix was not supported. Var–Cov = Variance–Covariance.
4.3.2. Measurement invariance across meaningful subgroupsSince the measurement model was found to be fully invariant across
samples, and in order tomaximize the available sample size formeaning-ful group comparisons, measurement invariance tests betweenmeaning-ful subgroups of PhD students were conducted on the combined sample.Students were grouped by gender (males, n = 522; females, n = 628),citizenship status (Canadian, n=782; permanent resident or temporaryvisa holder, n=368), program type (social sciences, n=631; natural sci-ences, n = 652), age (30 years old or less, n = 796; more than 30 yearsold, n = 508), and study progression (number of completed trimesters;0 to 3, n = 375; 4 to 6, n = 253; 7 to 11, n = 272; 12 or more, n =249). Measurement invariance of the first-order ESEM and higher-orderEWC models was tested across all of these subgroups of students. Allmodels showed a good fit to the data (CFI and TLI N .97, RMSEA b 0.05;see Tables 5 and6). Furthermore, across all of themodels estimated, as in-variance constraints were added to the model, the observed decrease infit indices remained under the recommended cut-off scores. These resultsthus fully support the strict measurement invariance of the MPhD scaleacross these subgroups of participants, as well as the invariance of the la-tent variances, covariances, and means of the estimated factors.
A [90% CI] MDΔχ2 (df) ΔCFI ΔTLI ΔRMSEA
.038, .055] – – – –
.021, .037] 63.228 (50) +.004 +.016 − .018
.032, .045] 140.209 (40)* − .008 − .007 +.009
.036, .047] 66.164 (15)* − .004 − .003 +.003
.045, .056] 94.391 (15)* − .011 − .010 +.010
.030, .042] 5.699 (5) +.015 +.015 − .015
.035, .054] − − − −
.017, .035] 55.565 (50) +.004 +.015 − .017
.027, .041] 103.838 (40)* − .007 − .005 +.007
.027, .040] 24.664 (15) .000 .000 .000
.018, .033] 19.107 (15) +.004 +.006 − .008
.028, .040] 28.630 (5)* − .006 − .006 .008
.033, .052] – – – –
.022, .039] 68.278 (50)* +.001 +.011 − .013
.027, .041] 89.803 (40)* − .004 − .003 +.004
.029, .043] 43.235 (15)* − .003 − .002 +.002
.028, .041] 38.725 (15)* .000 +.001 − .001
.036, .047] 32.940 (5)* − .006 − .006 +.007
.034, .051] – – – –
.027, .041] 85.031 (50)* − .001 +.008 − .008
.031, .043] 98.922 (40)* − .004 − .003 +.003
.030, .042] 25.133 (15)* − .001 +.001 − .001
.023, .036] 26.305 (15)* +.004 +.005 − .006
.030, .042] 28.988 (5)* − .005 − .005 +.006
.038, .055] – – – –
.028, .043] 85.281 (50)* +.001 +.011 − .011
.036, .048] 134.691 (40)* − .008 − .006 +.006
.043, .054] 97.967 (15)* − .007 − .006 +.006
.029, .041] 18.067 (15) +.010 +.012 − .013
.027, .039] 8.006 (5) +.001 +.002 − .002
.029, .051] – – – –
.019, .038] 184.890 (150)* − .001 +.009 − .010
.026, .041] 201.371 (120)* − .006 − .004 +.004
.030, .043] 92.192 (45)* − .004 − .002 +.003
.030, .043] 82.245 (45)* − .002 .000 − .001
.035, .047] 45.252 (15)* − .005 − .004 +.005
to the fit of the strict invariancemodel, as the invariance of the latent variance–covariance

Table 6Summary of goodness-of-fit statistics for the higher-order structure (EWC) invariance tests.
Tested models χ2 df CFI TLI RMSEA [90% CI] MDΔχ2 (df) ΔCFI ΔTLI ΔRMSEA
SampleM1. Configural 433.820* 193 .979 .977 .044 [.038, .049] – – – –M2. Weak 429.801* 196 .980 .978 .043 [.037, .048] 6.526 (3) +.001 +.001 − .001M3. Strong 418.783* 199 .981 .980 .041 [.036, .047] 2.486 (3) +.001 +.002 − .002M4. Strict 412.361* 204 .982 .982 .040 [.034, .045] 10.860 (5) +.001 +.002 − .001M5. Var–Cov 543.555* 207 .971 .971 .050 [.045, .055] 43.832 (3)* − .011 − .011 +.010M6. Means# 387.284* 206 .984 .984 .037 [.031, .042] 1.914 (2) +.013 +.013 − .013
GenderM7. Configural 319.482* 193 .987 .986 .034 [.027, .040] – – – –M8. Weak 313.174* 196 .988 .987 .032 [.025, .039] 3.428 (3) +.001 +.001 − .002M9. Strong 311.157* 199 .989 .988 .031 [.024, .038] 3.262 (3) +.001 +.001 − .001M10. Strict 313.527* 204 .989 .989 . 031 [.024, .037] 8.284 (5) .000 +.001 .000M11. Var–Cov 296.050* 207 .991 .991 .027 [.020, .037] 5.598 (3) +.002 +.002 − .004M12. Means 352.856* 209 .985 .985 .035 [.028, .041] 21.993 (5)* − .006 − .006 +.008
Citizenship statusM13. Configural 439.383* 193 .975 .973 .047 [.041, .053] – – – –M14. Weak 415.034* 196 .978 .977 .044 [.038, .050] 0.978 (3) +.003 +.004 − .003M15. Strong 443.408* 199 .976 .974 .046 [.040, .052] 21.854 (3)* − .002 − .003 +.002M16. Strict 443.659* 204 .976 .975 .045 [.039, .051] 17.104 (5)* .000 +.001 − .001M17. Var-Cov 383.964* 207 .982 .982 .039 [.033, .045] 2.021 (3) +.006 +.007 − .006M18. Means 417.622* 209 .979 .979 .042 [.036, .047] 14.961 (2)* − .003 − .003 +.003
Program typeM19. Configural 354.937* 193 .986 .984 .036 [.030, .042] – – – –M20. Weak 354.193* 196 .986 .985 .035 [.029, .041] 7.517 (3) .000 +.001 − .001M21. Strong 366.962* 199 .985 .984 .036 [.030, .042] 9.115 (3)* − .001 − .001 +.001M22. Strict 428.888* 204 .980 .979 .041 [.036, .047] 35.668 (5)* − .005 − .005 +.005M23. Var–Cov 381.936* 207 .984 .984 .036 [.031, .042] 5.424 (3) +.004 +.005 − .005M24. Means 389.167* 209 .984 .984 .037 [.031, .042] 7.719 (2)* .000 .000 .001
AgeM25. Configural 464.722* 193 .977 .974 .046 [.041, .052] – – – –M26. Weak 435.761* 196 .979 .978 .043 [.038, .049] 3.722 (3) +.002 +.004 − .003M27. Strong 442.635* 199 .979 .978 .043 [.038, .049] 10.600 (3)* .000 .000 .000M28. Strict 414.760* 204 .982 .981 .040 [.034, .045] 3.093 (5) +.003 +.003 − .003M29. Var–Cov 372.886* 207 .986 .985 .035 [.029, .041] 2.918 (3) +.004 +.004 − .005M30. Means 359.140* 209 .987 .987 .033 [.027, .039] 2.032 (2) +.001 +.002 − .002
PhD progressionM31. Configural 680.347* 491 .981 .984 .037 [.030, .043] – – – –M32. Weak 701.502* 500 .980 .983 .037 [.031, .044] 19.957 (9)* − .001 − .001 .000M33. Strong 736.355* 509 .977 .981 .039 [.033, .046] 25.746 (9)* − .003 − .002 +.002M34. Strict 772.614* 524 .975 .980 .041 [.034, .047] 37.487 (15)* − .002 − .001 +.002M35. Var–Cov 749.039* 533 .979 .983 .038 [.031, .044] 14.727 (9) +.004 +.003 − .003M36. Means 795.861* 539 .975 .980 .041 [.035, .047] 23.141 (6)* − .004 − .003 +.003
Note. *= p b .05. #=Thefit of themean invariancemodel for sample invariancewas compared to the fit of the strict invariancemodel, as the invariance of the latent variance–covariancematrix was not supported. Var–Cov = Variance–Covariance.
10 D. Litalien et al. / Learning and Individual Differences 41 (2015) 1–13
5. Discussion
The goal of this study was to develop and validate an SDT-basedscale to assess motivation for PhD studies. Overall, the results providegood support for the psychometric properties of the MPhD scale andare consistent across samples. In line with SDT, both a five-factor first-order structure (intrinsic, integrated, identified, introjected, and exter-nal regulations) and a two-factor higher-order structure (autonomousand controlled motivations) were supported. Concerning the five-factor structure, ESEM analyses showed excellent fit to the data andloadings in line with theoretical expectations.
Only two items presented an unexpected loading and cross-loadingpattern, which was similar across both samples. First, item 3 of the in-trinsic regulation subscale [For the pleasure I feel in accomplishing mystudy project (e.g., thesis)] presented a high cross-loading on the iden-tified regulation factor in addition to its own factor. Second, item1of theexternal regulation subscale (For the prestige associated with a PhD)presented high cross-loadings on most of the other factors and alower main loading in Sample 2. Looking back at item 3 from the intrin-sic regulation subscale, this pattern of results may be explained by thefact that it taps not only into “pleasure,”which defines intrinsic regula-tion, but also into “accomplishment,” which is related to identified
regulation. Thus, although this cross-loading can be explain, it also sug-gests that this item should be targeted for re-assessment, and possiblereplacement (e.g., “For the pleasure of doing research,” “Because I reallyenjoymy field of study”) in future research. The second item, character-ized by a weakmain loading andmultiple cross-loadings, appears moreproblematic. This could be related to the incorporation of “prestige” inthis item. Indeed, whereas prestige represents some form of reward, itis located mainly within the student's self-image, over and above exter-nal contingencies. Therefore, this item should also be targeted for re-assessment and replacement. Possible replacement items could includeother forms of external contingencies not currently covered in theMPhD scale (e.g., “Because I am afraid of my advisor's reaction if Iquit,” “Because I will lose some privileges (salary, fellowship, etc.)”).
The results further showed that the scale score reliability estimatesfor the various subscales were generally satisfactory (ω = .69 to .85),with only the reliability of the identified regulation subscale fallingbelow .70 in Samples 1 (ω = .69) and 2 (ω = .60). This estimate waslower than expected, especially in Sample 2, suggesting that this sub-scale should be examined more thoroughly in future research andused with caution in the context of research relying on fully latent var-iable models (e.g., Bollen, 1989) that provide control for measurementerror. However, it should be kept in mind that this estimate is based

11D. Litalien et al. / Learning and Individual Differences 41 (2015) 1–13
on a three-item scale, and that scale score reliability is affected notablyby the number of items present in a scale (Sijtsma, 2009; Streiner, 2003)so that it is often useful to provide adjustment of reliability estimates. Inthis study, scale score reliability estimates adjusted for eight equivalentitems using the Spearman–Brown prophecy formula varied between0.80 and 0.94 across studies and subscales. Moreover, the values obtain-ed for identified regulation prior to this adjustment are similar to thoseobserved with other well-established and well-validated motivationscales, such as the AMS (Vallerand et al., 1989, 1992, 1993, 1997) andthe Self-Regulation Questionnaire (SRQ; Ryan & Connell, 1989).
Convergent and discriminant validity were assessed in two ways.First, correlations between the regulation subscales were mainly inline with the simplex pattern proposed by SDT. Some exceptions de-serve our attention. Identified regulation was negatively associatedwith introjected regulation, whereas SDT posits that this correlationshould be positive, although not very high. Other studies also supportthis hypothesis, showing a positive and significant association betweenthese regulation types (Gagné et al., 2010; Ryan & Connell, 1989;Vallerand et al., 1989, 1992). However, the negative correlation ob-served is not very surprising. As mentioned earlier, SDT distinguishesbetween autonomous motivation, which leads to positive outcomes,and controlled motivation, which is associated with negative outcomes.Thus, on the self-determination continuum, the delimitation betweenthese two broader types of regulation appeared between identifiedand introjected regulation. This “breakdown” of the continuum can belogically expressed as a negative correlation between identified andintrojected regulation. Additionally, in Sample 2 only, external regula-tion was positively associated with all autonomous types of regulation,whereas SDT posits that these variables should be negatively associated.These associations are also reflected at the higher-order level, as apositive correlation is observed between autonomous and controlledmotivations (Sample 2). These results might be related to the highcross-loadings observed with item 1 of external regulation and thussuggested that further studies should pay attention to the external reg-ulation subscale.
Second, convergent and discriminant validity was assessed throughcorrelations between each regulation type and various outcomes. Thefindings are particularly interesting, as they support the notion that dif-ferent forms of motivation yield different consequences (Deci & Ryan,2000). Results from both samples showed that intrinsic, integrated,and identified regulations were all beneficial, as 36 of 39 correlationswere significant and in the expected direction. Indeed, they were posi-tively associated with the positive outcomes (general satisfaction withstudies, satisfaction with the university and with the program, positiveaffect, performance, and postdoctoral intention) and negatively associat-ed with the negative outcomes (test anxiety, negative affect, dropout in-tention, and thesis problems). Conversely, introjected regulation seemedmore detrimental, showing a reversed correlation pattern with the out-comes (10 of 13 correlations were significant). Specifically, introjectedregulation was positively associated with all negative outcomes, andnegatively associated with most positive outcomes (satisfaction withgeneral studies and university, positive affect, and performance).
Although introjected regulation could be considered deleterious,this was less obvious for external regulation, as only 4 of 13 correlationswere significant and in the expected direction. In Sample 1, externalregulationwas positively related to test anxiety and negatively associat-ed with satisfaction with studies, whereas in Sample 2, it was positivelyassociated with thesis problems and negatively associated with perfor-mance. Nevertheless, external regulation was unrelated to the otheroutcomes like positive and negative affect, university and program sat-isfaction, dropout intention, and postdoctoral intention.
For doctoral students, introjected regulation appeared to be morecounterproductive than drive to attain prestige,money, and goodwork-ing conditions. This milder effect of external regulation was also obtain-ed by Gagné et al. (2010; Motivation at Work Scale) in a population ofworkers. It is also plausible that a wider selection of assessed outcomes
or items could have captured the negative effect of external regulationmore clearly. For instance, depth of learning and creativity are relevantcomponents at the PhD level and have been negatively associated withexternal motives in previous studies with other populations (Amabile,1985; Vansteenkiste et al., 2004).
In both samples, the goodness-of-fit of the higher-order solutionwas also excellent and did not differ significantly from that of thefirst-order solution. The relations between the five types of regulationcould also be explained by the two broader categories of motivation,which is consistent with SDT. Moreover, correlations between the out-comes and autonomous motivation were all significant and in the ex-pected direction, while 8 of 13 correlations were similarly significant(and also in the expected direction) for controlledmotivation. These re-sults suggest that the MPhD scale could be used to assess either richer(five-factor structure) or more parsimonious (higher-order structure)regulation types. To make an informed choice, we suggest always test-ing the five-factor structure before using the more parsimonious one.For instance, in the present study, the three autonomous types of regu-lation clearly showed similar patterns of association with the variousoutcomes, whereas the patterns of association of the two controlledmotivation types were more distinct. Introjected regulation was moredeleterious than the other regulation types, and external regulationdid not appear as harmful as initially expected.
The population of PhD students is heterogeneous and the PhD expe-rience may differ greatly depending on their gender, citizenship status,program type, age, and progression. Interestingly, measurement invari-ance for the MPhD scale was supported across both samples and acrosssubgroups formed from those variables. These results support the gen-eralizability of the five-factor structure and the higher-order structureand suggest that the scale can be used with PhD students from variousbackgrounds.
Overall, our findings underscore the fact that different types of regu-lation should be assessed separately (either as a five-factor structure ora higher-order structure), as they are linked to distinct consequences.Although studies on doctoral students' persistence often conceptualizemotivation from a quantitative perspective (presence or absence), ourresults suggested instead that special attention should be paid to thequality of motivation.
5.1. Limitations and future studies
Although this study generally supported the psychometric propertiesof our scale, some limitationswarrant attention. First, themeasureswereself-reported, which increases common method variance (Podsakoff,MacKenzie, Lee, & Podsakoff, 2003). It is important to note, however,that self-reports also offer a number of advantages, and may be themethod of choice for exploring intrapsychic factors, such as motivation(Crockett, Schulenberg, & Petersen, 1987; Howard, 1994). Nonetheless,the reliability of the scale should be further validated through testingover time and other methods, such as reports from significant others(e.g., an advisor) or diaries. Second, because participation in our studywas voluntary, it is plausible that the participants were the most moti-vated of the PhD students who were approached. Third, the MPhDscale was validated only among French–Canadian students. Thus, thepsychometric properties of this instrument should be cross-validatedwith students from various academic, cultural and linguistic back-grounds. Fourth, although convergent and discriminant validity wereassessed, no criterion measures were collected at a later time. Furtherstudies should test the predictive validity of the scale to explain persis-tence, progression, dropout, publication, and even publication impactusing longer-term longitudinal follow-up studies of student cohorts.
5.2. Scientific significance of the study
Despite these limitations, our findings have methodological,theoretical and practical implications. Methodologically, we have
(
12 D. Litalien et al. / Learning and Individual Differences 41 (2015) 1–13
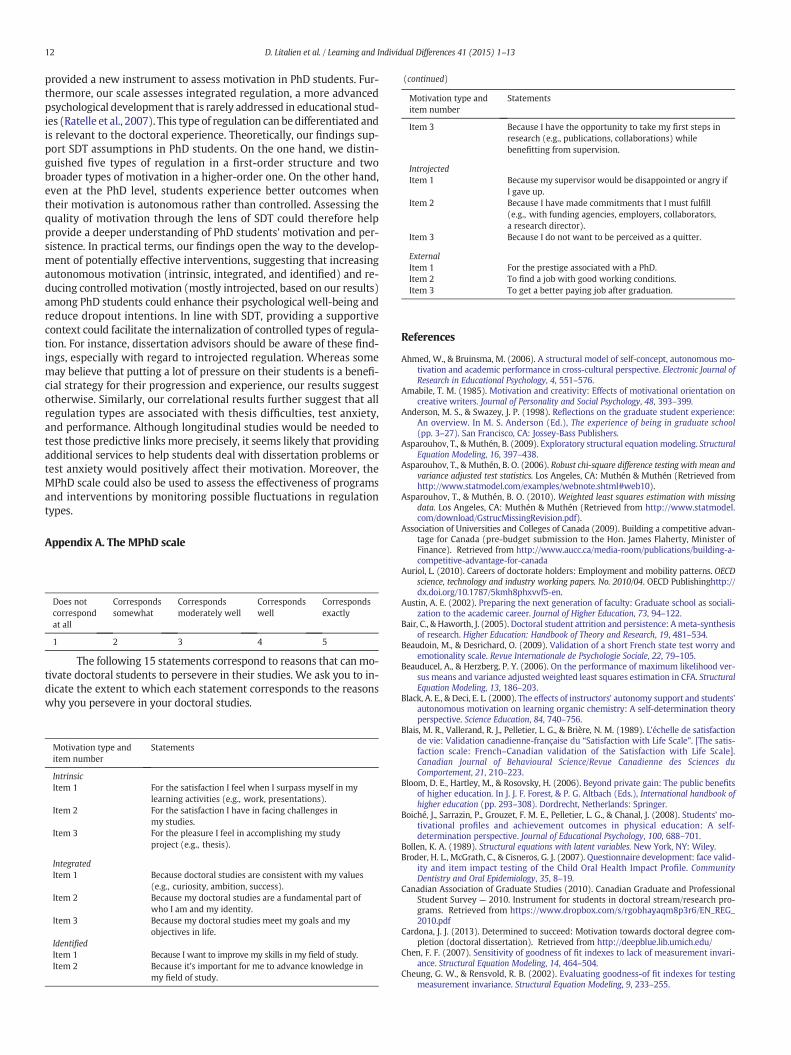
provided a new instrument to assess motivation in PhD students. Fur-thermore, our scale assesses integrated regulation, a more advancedpsychological development that is rarely addressed in educational stud-ies (Ratelle et al., 2007). This type of regulation can bedifferentiated andis relevant to the doctoral experience. Theoretically, our findings sup-port SDT assumptions in PhD students. On the one hand, we distin-guished five types of regulation in a first-order structure and twobroader types of motivation in a higher-order one. On the other hand,even at the PhD level, students experience better outcomes whentheir motivation is autonomous rather than controlled. Assessing thequality of motivation through the lens of SDT could therefore helpprovide a deeper understanding of PhD students' motivation and per-sistence. In practical terms, our findings open the way to the develop-ment of potentially effective interventions, suggesting that increasingautonomous motivation (intrinsic, integrated, and identified) and re-ducing controlledmotivation (mostly introjected, based on our results)among PhD students could enhance their psychological well-being andreduce dropout intentions. In line with SDT, providing a supportivecontext could facilitate the internalization of controlled types of regula-tion. For instance, dissertation advisors should be aware of these find-ings, especially with regard to introjected regulation. Whereas somemay believe that putting a lot of pressure on their students is a benefi-cial strategy for their progression and experience, our results suggestotherwise. Similarly, our correlational results further suggest that allregulation types are associated with thesis difficulties, test anxiety,and performance. Although longitudinal studies would be needed totest those predictive links more precisely, it seems likely that providingadditional services to help students deal with dissertation problems ortest anxiety would positively affect their motivation. Moreover, theMPhD scale could also be used to assess the effectiveness of programsand interventions by monitoring possible fluctuations in regulationtypes.
Appendix A. The MPhD scale
Does notcorrespondat all
Correspondssomewhat
Correspondsmoderately well
Correspondswell
Correspondsexactly
1
2 3 4 5The following 15 statements correspond to reasons that can mo-tivate doctoral students to persevere in their studies. We ask you to in-dicate the extent to which each statement corresponds to the reasonswhy you persevere in your doctoral studies.
Motivation type anditem number
Statements
Intrinsic
Item 1 For the satisfaction I feel when I surpass myself in mylearning activities (e.g., work, presentations).
Item 2 For the satisfaction I have in facing challenges inmy studies.
Item 3 For the pleasure I feel in accomplishing my studyproject (e.g., thesis).
Integrated
Item 1 Because doctoral studies are consistent with my values(e.g., curiosity, ambition, success).
Item 2 Because my doctoral studies are a fundamental part ofwho I am and my identity.
Item 3 Because my doctoral studies meet my goals and myobjectives in life.
Identified Item 1 Because I want to improve my skills in my field of study. Item 2 Because it's important for me to advance knowledge inmy field of study.
continued)
Motivation type anditem number
Statements
Item 3
Because I have the opportunity to take my first steps inresearch (e.g., publications, collaborations) whilebenefitting from supervision.Introjected
Item 1 Because my supervisor would be disappointed or angry ifI gave up.
Item 2 Because I have made commitments that I must fulfill(e.g., with funding agencies, employers, collaborators,a research director).
Item 3
Because I do not want to be perceived as a quitter.External
Item 1 For the prestige associated with a PhD. Item 2 To find a job with good working conditions. Item 3 To get a better paying job after graduation.References
Ahmed, W., & Bruinsma, M. (2006). A structural model of self-concept, autonomous mo-tivation and academic performance in cross-cultural perspective. Electronic Journal ofResearch in Educational Psychology, 4, 551–576.
Amabile, T. M. (1985). Motivation and creativity: Effects of motivational orientation oncreative writers. Journal of Personality and Social Psychology, 48, 393–399.
Anderson, M. S., & Swazey, J. P. (1998). Reflections on the graduate student experience:An overview. In M. S. Anderson (Ed.), The experience of being in graduate school(pp. 3–27). San Francisco, CA: Jossey-Bass Publishers.
Asparouhov, T., & Muthén, B. (2009). Exploratory structural equation modeling. StructuralEquation Modeling, 16, 397–438.
Asparouhov, T., & Muthén, B. O. (2006). Robust chi-square difference testing with mean andvariance adjusted test statistics. Los Angeles, CA: Muthén & Muthén (Retrieved fromhttp://www.statmodel.com/examples/webnote.shtml#web10).
Asparouhov, T., & Muthén, B. O. (2010). Weighted least squares estimation with missingdata. Los Angeles, CA: Muthén & Muthén (Retrieved from http://www.statmodel.com/download/GstrucMissingRevision.pdf).
Association of Universities and Colleges of Canada (2009). Building a competitive advan-tage for Canada (pre-budget submission to the Hon. James Flaherty, Minister ofFinance). Retrieved from http://www.aucc.ca/media-room/publications/building-a-competitive-advantage-for-canada
Auriol, L. (2010). Careers of doctorate holders: Employment and mobility patterns. OECDscience, technology and industry working papers. No. 2010/04. OECD Publishinghttp://dx.doi.org/10.1787/5kmh8phxvvf5-en.
Austin, A. E. (2002). Preparing the next generation of faculty: Graduate school as sociali-zation to the academic career. Journal of Higher Education, 73, 94–122.
Bair, C., & Haworth, J. (2005). Doctoral student attrition and persistence: Ameta-synthesisof research. Higher Education: Handbook of Theory and Research, 19, 481–534.
Beaudoin, M., & Desrichard, O. (2009). Validation of a short French state test worry andemotionality scale. Revue Internationale de Psychologie Sociale, 22, 79–105.
Beauducel, A., & Herzberg, P. Y. (2006). On the performance of maximum likelihood ver-sus means and variance adjusted weighted least squares estimation in CFA. StructuralEquation Modeling, 13, 186–203.
Black, A. E., & Deci, E. L. (2000). The effects of instructors' autonomy support and students'autonomous motivation on learning organic chemistry: A self-determination theoryperspective. Science Education, 84, 740–756.
Blais, M. R., Vallerand, R. J., Pelletier, L. G., & Brière, N. M. (1989). L'échelle de satisfactionde vie: Validation canadienne-française du “Satisfaction with Life Scale”. [The satis-faction scale: French–Canadian validation of the Satisfaction with Life Scale].Canadian Journal of Behavioural Science/Revue Canadienne des Sciences duComportement, 21, 210–223.
Bloom, D. E., Hartley, M., & Rosovsky, H. (2006). Beyond private gain: The public benefitsof higher education. In J. J. F. Forest, & P. G. Altbach (Eds.), International handbook ofhigher education (pp. 293–308). Dordrecht, Netherlands: Springer.
Boiché, J., Sarrazin, P., Grouzet, F. M. E., Pelletier, L. G., & Chanal, J. (2008). Students' mo-tivational profiles and achievement outcomes in physical education: A self-determination perspective. Journal of Educational Psychology, 100, 688–701.
Bollen, K. A. (1989). Structural equations with latent variables. New York, NY: Wiley.Broder, H. L., McGrath, C., & Cisneros, G. J. (2007). Questionnaire development: face valid-
ity and item impact testing of the Child Oral Health Impact Profile. CommunityDentistry and Oral Epidemiology, 35, 8–19.
Canadian Association of Graduate Studies (2010). Canadian Graduate and ProfessionalStudent Survey — 2010. Instrument for students in doctoral stream/research pro-grams. Retrieved from https://www.dropbox.com/s/rgobhayaqm8p3r6/EN_REG_2010.pdf
Cardona, J. J. (2013). Determined to succeed: Motivation towards doctoral degree com-pletion (doctoral dissertation). Retrieved from http://deepblue.lib.umich.edu/
Chen, F. F. (2007). Sensitivity of goodness of fit indexes to lack of measurement invari-ance. Structural Equation Modeling, 14, 464–504.
Cheung, G. W., & Rensvold, R. B. (2002). Evaluating goodness-of fit indexes for testingmeasurement invariance. Structural Equation Modeling, 9, 233–255.

13D. Litalien et al. / Learning and Individual Differences 41 (2015) 1–13
Clewell, B. C. (1987). Retention of Black and Hispanic doctoral students (ETS research re-port no. 87-10). Retrieved from ETS website http://www.ets.org/Media/Research/pdf/RR-87-10-Clewell.pdf
Crockett, L., Schulenberg, J., & Petersen, A. (1987). Congruence between objective andself-report data in a sample of adolescents. Journal of Adolescent Research, 2, 383–392.
Deci, E. L., & Ryan, R. M. (1985). Intrinsic motivation and self-determination in human be-havior. New York, NY: Plenum Press.
Deci, E. L., & Ryan, R. M. (2000). The ‘what’ and ‘why’ of goal pursuits: Human needs andthe self-determination of behavior. Psychological Inquiry, 11, 227–268.
Deci, E. L., & Ryan, R. M. (2012). Motivation, personality, and development within embeddedsocial contexts: An overview of self-determination theory. In R. M. Ryan (Ed.), The oxfordhandbook of human motivation (pp. 85–107). New York, NY: Oxford University Press.
Deemer, E. D., Martens, M. P., & Buboltz, W. C. (2010). Toward a tripartite model of re-search motivation: Development and initial validation of the Research MotivationScale. Journal of Career Assessment, 18, 292–309.
Diener, E., Suh, E. M., Lucas, R. E., & Smith, H. L. (1999). Subjective well-being: Three de-cades of progress. Psychological Bulletin, 125, 276–302.
Elliot, A. J. (1997). Integrating the “classic” and “contemporary” approaches to achieve-ment motivation: A hierarchical model of approach and avoidance achievement mo-tivation. In M. L. Maehr, & P. R. Pintrich (Eds.), Advances in motivation andachievement, Vol. 10. (pp. 143–179). Greenwich, CT: JAI Press.
Finney, S. J., & DiStefano, C. (2006). Non-normal and categorical data in structural equa-tion modeling. In G. R. Hancock, & R. O. Mueller (Eds.), Structural equation modeling:A second course (pp. 269–314). Greenwich, CT: Information Age.
Gagné, M., Forest, J., Gilbert, M. -H., Aubé, C., Morin, E., & Malorni, A. (2010). The Motiva-tion at Work Scale: Validation evidence in two languages. Educational andPsychological Measurement, 70, 628–646.
Gillet, N., Lafrenière, M. -A. K., Vallerand, R. J., Huart, I., & Fouquereau, E. (2014). The ef-fects of autonomous and controlled regulation of performance-approach goals onwell-being: A process model. British Journal of Social Psychology, 53, 154–174.
Guay, F., Morin, A. J. S., Litalien, D., Valois, P., & Vallerand, R. J. (2014). Application of ex-ploratory structural equation modeling to evaluate the Academic Motivation Scale.The Journal of Experimental Education, 83, 51–82.
Guay, F., Ratelle, C. F., & Chanal, J. (2008). Optimal learning in optimal contexts: The role of self-determination in education. Canadian Psychology/Psychologie Canadienne, 49, 233–240.
Hembree, R. (1988). Correlates, causes, effects, and treatment of test anxiety. Review ofEducational Research, 58, 47–77.
Hoskins, C.M., & Goldberg, A. D. (2005). Doctoral student persistence in counselor educationprograms: Student-programmatch. Counselor Education and Supervision, 44, 175–188.
Howard, G. (1994). Why do people say nasty things about self-reports? Journal ofOrganizational Behavior, 15, 399–404.
Human Resources and Skills Development Canada (2006). Looking ahead: A ten-year out-look for the Canadian labour market, (2006–2015) (catalogue no. HS28-23/2006E).Retrieved from http://www.hrsdc.gc.ca/eng/publications_resources/research/categories/labour_market_e/sp_615_10_06/page00.shtml
Ivankova, N., & Stick, S. (2007). Students' persistence in a distributed doctoral program ineducational leadership in higher education: A mixed methods study. Research inHigher Education, 48, 93–135.
Jablonski, A. M. (2001). Doctoral studies as professional development of educators in theUnited States. European Journal of Teacher Education, 24, 215–221.
Kärner, A., Kukemelk, H., & Herdlein, R. J. (2005). Motivation for obtaining the doctor ofphilosophy degree in the post-soviet era: The case of Estonia. InternationalEducation, 35, 24–34.
King, S. E., & Chepyator-Thomson, J. R. (1996). Factors affecting the enrollment and per-sistence of African–American doctoral students. Physical Educator, 53, 170–180.
Litalien, D., Lüdtke, O., Parker, P., & Trautwein, U. (2013). Different pathways, same ef-fects: Autonomous goal regulation is associated with subjective well-being duringthe post-school transition. Motivation and Emotion, 37, 444–456.
Losier, G. F. (1994). Une analyse motivationnelle de la persévérance aux études avancées[A motivational analysis of graduate student persistence] (Unpublished doctoral dis-sertation). Université du Québec à Montréal, Montréal.
Lovitts, B. E. (2001). Leaving the ivory tower: The causes and consequences of departure fromdoctoral study. New York, NY: Rowman & Littlefield.
Lubke, G. H., & Muthén, B. O. (2004). Applying multigroup confirmatory factor models forcontinuous outcomes to Likert scale data complicatesmeaningful group comparisons.Structural Equation Modeling, 11, 514–534.
Marsh, H. W., Morin, A. J. S., Parker, P. D., & Kaur1, G. (2014). Exploratory structural equa-tion modeling: An integration of the best features of exploratory and confirmatoryfactor analysis. Annual Review of Clinical Psychology, 10, 85–110.
Marsh, H. W., Lüdtke, O., Muthén, B. O., Asparouhov, T., Morin, A. J. S., & Trautwein, U.(2010). A new look at the big five factor structure through exploratory structuralequation modeling. Psychological Assessment, 22, 471–491.
Marsh, H. W., Muthén, B., Asparouhov, T., Lüdtke, O., Robitzsch, A., Morin, A. J. S., et al. (2009).Exploratory structural equation modeling, integrating CFA and EFA: Application to stu-dents' evaluations of university teaching. Structural Equation Modeling, 16, 439–476.
McDonald, R. P. (1970). Theoretical foundations of principal factor analysis and alpha fac-tor analysis. British Journal of Mathematical and Statistical Psychology, 23, 1–21.
McLachlan, S., Spray, C., & Hagger, M. S. (2011). The development of a scale measuring in-tegrated regulation in exercise. British Journal of Health Psychology, 16, 722–743.
Minister of Education, Recreation and Sports (2013). Indicateurs de l'éducation — Éd.2012 [Education Indicators — 2012 Ed.]. Retrieved from http://www.mels.gouv.qc.ca/fileadmin/site_web/documents/PSG/statistiques_info_decisionnelle/Indicateurs_educ_2012_webP.pdf
Morin, A. J. S., Arens, A. K., & Marsh, H. W. (2015). A bifactor exploratory structural equationmodeling framework for the identification of distinct sources of construct-relevant psy-chometric multidimensionality. Structural Equation Modeling (in press).
Morin, A. J. S., Marsh, H. W., & Nagengast, B. (2013). Exploratory structural equationmodeling. In G. R. Hancock, & R. O. Mueller (Eds.), Structural equation modeling: A sec-ond course (pp. 395–436) (2nd ed.). Charlotte, NC: Information Age.
Muthén, L. K., & Muthén, B. O. (2012). Mplus user's guide (7th ed.). Los Angeles, CA:Muthén & Muthén.
Nettles, M. T., & Millett, C. M. (2006). Three magic letters: Getting to Ph.D. Baltimore, MD:Johns Hopkins University Press.
O'Meara, K., Knudsen, K., & Jones, J. (2013). The role of emotional competencies in faculty-doctoral student relationships. The Review of Higher Education, 36, 315–347.
Organization for Economic Co-operation and Development (2013). Students enrolled bytype of institution [statistic tables]. Retrieved from http://stats.oecd.org
Pauley, R., Cunningham, M., & Toth, P. (1999). Doctoral student attrition and retention: Astudy of a non-traditional Ed.D. program. Journal of College Student Retention, 1,225–238.
Pintrich, P. R. (2003). Amotivational science perspective on the role of studentmotivationin learning and teaching contexts. Journal of Educational Psychology, 95, 667–686.
Podsakoff, P. M., MacKenzie, S. B., Lee, J. Y., & Podsakoff, N. P. (2003). Common methodbiases in behavioural research: A critical review of the literature and recommendedremedies. Journal of Applied Psychology, 88, 879–903.
Ratelle, C. F., Guay, F., Vallerand, R. J., Larose, S., & Senécal, C. (2007). Autonomous,controlled, and amotivated types of academic motivation: A person-orientedanalysis. Journal of Educational Psychology, 99, 734–746.
Reamer, S. B. (1990). Persistence of adult learners in an external doctoral degree program.(Doctoral dissertation) Available from ProQuest dissertations and theses database(UMI No. 9023972).
Redsell, S. A., Lennon, M., Hastings, A. M., & Fraser, R. C. (2004). Devising and establishingthe face and content validity of explicit criteria of consultation competence for UKsecondary care nurses. Nurse Education Today, 24, 180–187.
Ryan, R. M., & Connell, J. P. (1989). Perceived locus of causality and internalization:Examining reasons for acting in two domains. Journal of Personality and SocialPsychology, 57, 749–761.
Ryan, R. M., & Deci, E. L. (2000). Self-determination theory and the facilitation ofintrinsic motivation, social development, and well-being. American Psychologist,55, 68–78.
Ryan, R. M., & Deci, E. L. (2009). Promoting self-determined school engagement: Motiva-tion, learning, and well-being. In K. R. Wentzel, & A.Wigfield (Eds.), Handbook onmo-tivation at school (pp. 171–196). New York, NY: Routledge.
Schmitz, J., Frenay, M., Neuville, S., Boudrenghien, G., Wertz, V., Noël, B., et al. (2010).Étude de trois facteurs clés pour comprendre la persévérance à l'université. RevueFrançaise de Pédagogie, 172, 43–61.
Sijtsma, K. (2009). On the use, misuse, and the very limited usefulness of Cronbach'salpha [introduction to a special issue]. Psychometrika, 74, 107–120.
Statistics Canada and Human Resources and Skills Development Canada (2003).Access, persistence and financing: First results from the postsecondaryeducation participation survey (catalogue no. 81-595M2003007). Retrievedfrom http://www.statcan.gc.ca/pub/81-595-m/81-595-m2003007-eng.pdf
Statistics Canada and Human Resources and Skills Development Canada (2009). Graduat-ing in Canada: Profile, labour market outcomes and student debt of the class of 2005(catalogue no. 81-595-M2009074). Retrieved from http://www.statcan.gc.ca/pub/81-595-m/81-595-m2009074-eng.pdf
Streiner, D. L. (2003). Starting at the beginning: An introduction to coefficient alpha andinternal consistency. Journal of Personality Assessment, 80, 99–103.
Vallerand, R. J., Blais, M. R., Brière, N. M., & Pelletier, L. G. (1989). Construction et val-idation de l'échelle de motivation en éducation (EME). [Construction and valida-tion of the Motivation toward Education Scale]. Canadian Journal of BehaviouralScience/Revue Canadienne des Sciences du Comportement, 21, 323–349.
Vallerand, R. J., Fortier, M. S., & Guay, F. (1997). Self-determination and persistence in areal-life setting: Toward a motivational model of high school dropout. Journal ofPersonality and Social Psychology, 72, 1161–1176.
Vallerand, R. J., Pelletier, L. G., Blais, M. R., Briere, N. M., Sénécal, C., & Vallieres, E. F. (1992).The Academic Motivation Scale: A measure of intrinsic, extrinsic, and amotivation ineducation. Educational & Psychological Measurement, 52, 1003–1017.
Vallerand, R. J., Pelletier, L. G., Blais, M. R., Briere, N. M., Sénécal, C., & Vallieres, E. F. (1993).On the assessment of intrinsic, extrinsic, and amotivation in education: Evidence onthe concurrent and construct validity of the Academic Motivation Scale. Educationaland Psychological Measurement, 53, 159–172.
Vansteenkiste, M., Simons, J., Lens, W., Sheldon, K. M., & Deci, E. L. (2004). Motivatinglearning, performance, and persistence: The synergistic effects of intrinsic goal con-tents and autonomy-supportive contexts. Journal of Personality and SocialPsychology, 87, 246–260.
Vansteenkiste, M., Zhou, M., Lens, W., & Soenens, B. (2005). Experiences of autonomy andcontrol among Chinese learners: Vitalizing or immobilizing? Journal of EducationalPsychology, 97, 468–483.
Watson, D., Clark, L. A., & Tellegen, A. (1988). Development and validation of brief mea-sures of positive and negative affect: The PANAS scales. Journal of Personality andSocial Psychology, 54, 1063–1070.
Wendler, C., Bridgeman, B., Cline, F., Millett, C., Rock, J., Bell, N., & McAllister, P.(2010). The path forward: The future of graduate education in the United States.Princeton, NJ: Educational Testing Service.
Wendler, C., Bridgeman, B.,Markle, R., Cline, F., Bell, N.,McAllister, P., & Kent, J. (2012). Pathwaysthrough graduate school and into careers. Princeton, NJ: Educational Testing Service.
West, S., Finch, J., & Curran, P. (1995). Structural equation models with nonnormalvariables: Problems and remedies. In R. H. Hoyle (Ed.), Structural equation modeling:Concepts, issues, and applications (pp. 56–75). Thousand Oaks, CA: Sage.
Yu, C. Y. (2002). Evaluating cutoff criteria of model fit indices for latent variable models withbinary and continuous outcomes. Los Angeles, CA: University of California.