leading fiber innovation · pdf file · 2014-09-26greater use of cheap polyester...
TRANSCRIPT
Leading Fiber Innovation
LENZING INVESTOR PRESENTATION – HALF YEAR RESULTS 2014August 21, 2014
2
The information contained in this document has not been independently verified andno representation or warranty expressed or implied is made as to, and no relianceshould be placed on, the fairness, accuracy, completeness or correctness of thisinformation or opinions contained herein.
Certain statements contained in this document may be statements of futureexpectations and other forward looking statements that are based on management‘scurrent view and assumptions and involve known and unknown risks anduncertainties that could cause actual results, performance or events to differmaterially from those expressed or implied in such statements.
None of Lenzing AG or any of its affiliates, advisors or representatives shall have anyliability whatsoever (for negligence or otherwise) for any loss howsoever arising fromany use of this document or its content or otherwise arising in connection with thisdocument.
Certain figures in this presentation have been rounded in accordance with commercialprincipals and practice. Such figures that have been rounded in various tables maynot necessarily add up to the exact total given in the respective table.
Disclaimer
3
H1/2014: Executive summaryVolumes on track, continued tough pricing, successful excelLENZ program
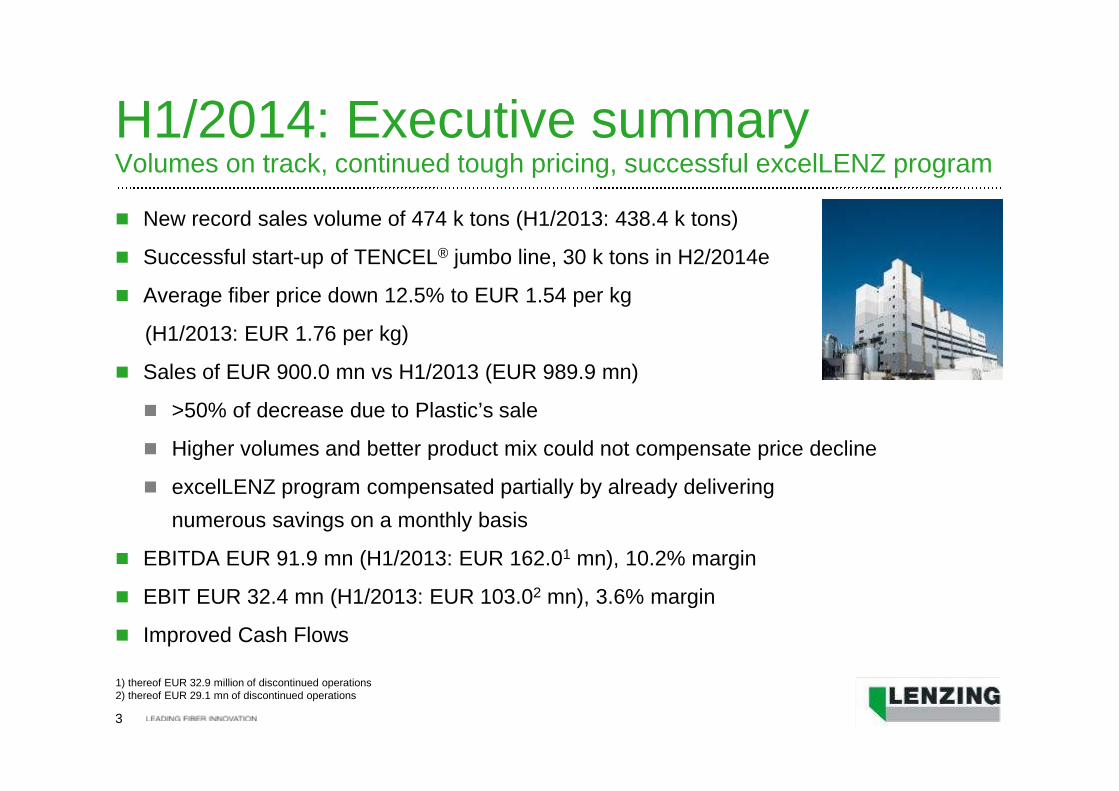
New record sales volume of 474 k tons (H1/2013: 438.4 k tons)
Successful start-up of TENCEL® jumbo line, 30 k tons in H2/2014e
Average fiber price down 12.5% to EUR 1.54 per kg
(H1/2013: EUR 1.76 per kg)
Sales of EUR 900.0 mn vs H1/2013 (EUR 989.9 mn)
>50% of decrease due to Plastic’s sale
Higher volumes and better product mix could not compensate price decline
excelLENZ program compensated partially by already delivering
numerous savings on a monthly basis
EBITDA EUR 91.9 mn (H1/2013: EUR 162.01 mn), 10.2% margin
EBIT EUR 32.4 mn (H1/2013: EUR 103.02 mn), 3.6% margin
Improved Cash Flows
1) thereof EUR 32.9 million of discontinued operations2) thereof EUR 29.1 mn of discontinued operations
4
Q2/2014: Executive summaryAs expected
New record sales volume of +7.7% to 239 k tons
(Q2/2013: 222 k tons)
Continuous decrease of average fiber price to EUR 1.52 per kg
(Q2/2013: EUR 1.75 per kg)
Sales of EUR 448.3 mn (Q2/2013: EUR 493.31 mn)
EBITDA EUR 45.6 mn (Q2/2013: 95.72 mn), 10.2% margin
EBIT EUR 15.7 mn (Q2/2013: 67.9 mn), 3.5% margin
Tough measures started
excelLENZ program up to EUR 90 mn in 2014 (1/3 more than estimated)
Strategic review of all sites and products
Increased TENCEL® marketing projects
1) thereof EUR 25.6 million of discontinued operations2) thereof EUR 28.2 million of discontinued operations
5
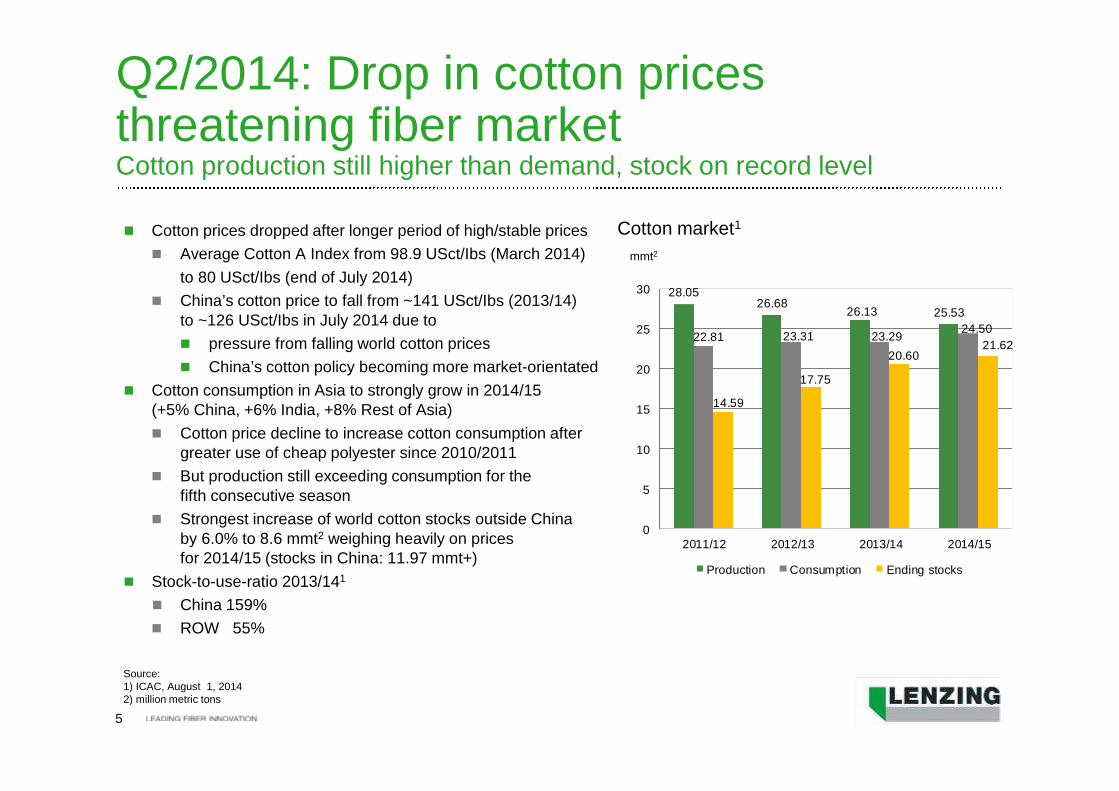
Q2/2014: Drop in cotton pricesthreatening fiber marketCotton production still higher than demand, stock on record level
Cotton prices dropped after longer period of high/stable prices
Average Cotton A Index from 98.9 USct/Ibs (March 2014)
to 80 USct/Ibs (end of July 2014)
China’s cotton price to fall from ~141 USct/Ibs (2013/14)to ~126 USct/Ibs in July 2014 due to
pressure from falling world cotton prices
China’s cotton policy becoming more market-orientated
Cotton consumption in Asia to strongly grow in 2014/15(+5% China, +6% India, +8% Rest of Asia)
Cotton price decline to increase cotton consumption aftergreater use of cheap polyester since 2010/2011
But production still exceeding consumption for thefifth consecutive season
Strongest increase of world cotton stocks outside Chinaby 6.0% to 8.6 mmt2 weighing heavily on pricesfor 2014/15 (stocks in China: 11.97 mmt+)
Stock-to-use-ratio 2013/141
China 159%
ROW 55%
Cotton market1
mmt2
Source:1) ICAC, August 1, 20142) million metric tons
28.0526.68
26.13 25.53
22.81 23.31 23.2924.50
14.59
17.75
20.6021.62
0
5
10
15
20
25
30
2011/12 2012/13 2013/14 2014/15
Production Consumption Ending stocks
6
Q2/2014: Competitive viscose environmentNo improvement in the second quarter
Viscose currently with a ~35% price discount to cotton although viscoseprocessing with 10% higher productivity gain for spinning industry
Tough pricing to continue
Chinese operate at higher capacity to earn out enough cash
Start-ups delayed, new projects postponed
Still no impact of Chinese DWP1 anti-dumping regulation
Soft DWP-pricing (price at ~US$ 840 in Q2)
1) dissolving wood pulp
7
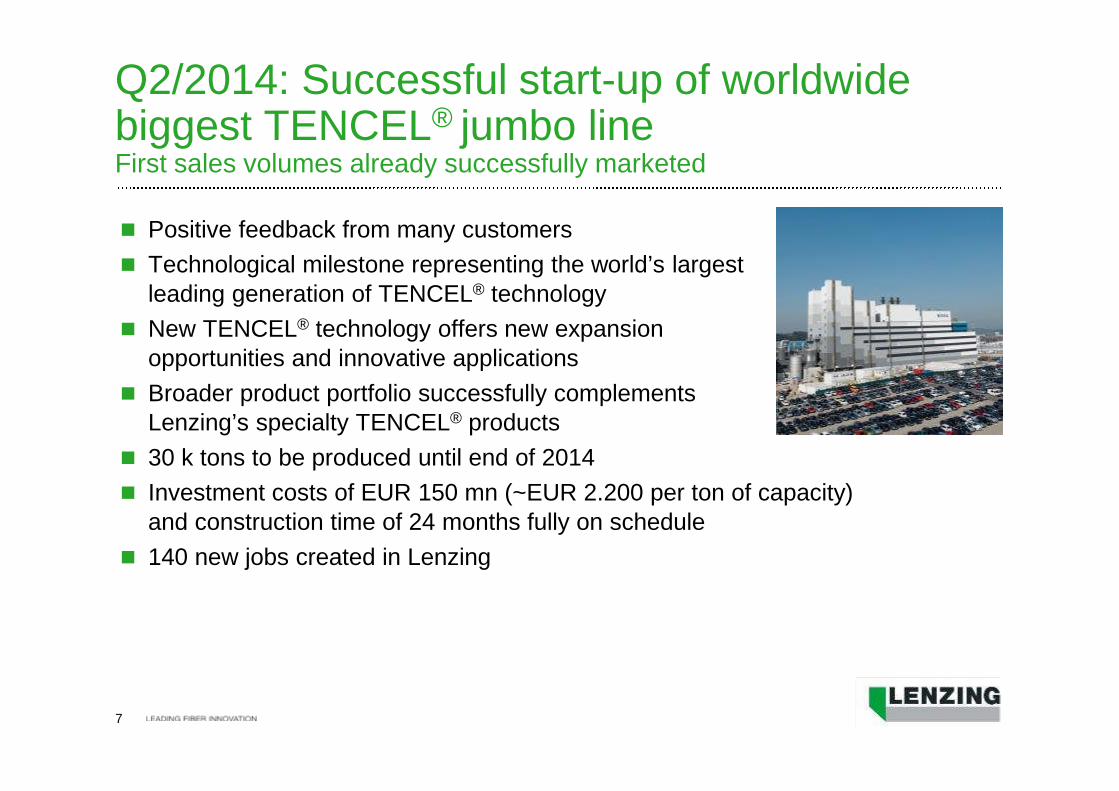
Q2/2014: Successful start-up of worldwidebiggest TENCEL® jumbo lineFirst sales volumes already successfully marketed
Positive feedback from many customers
Technological milestone representing the world’s largestleading generation of TENCEL® technology
New TENCEL® technology offers new expansionopportunities and innovative applications
Broader product portfolio successfully complementsLenzing’s specialty TENCEL® products
30 k tons to be produced until end of 2014
Investment costs of EUR 150 mn (~EUR 2.200 per ton of capacity)and construction time of 24 months fully on schedule
140 new jobs created in Lenzing
8
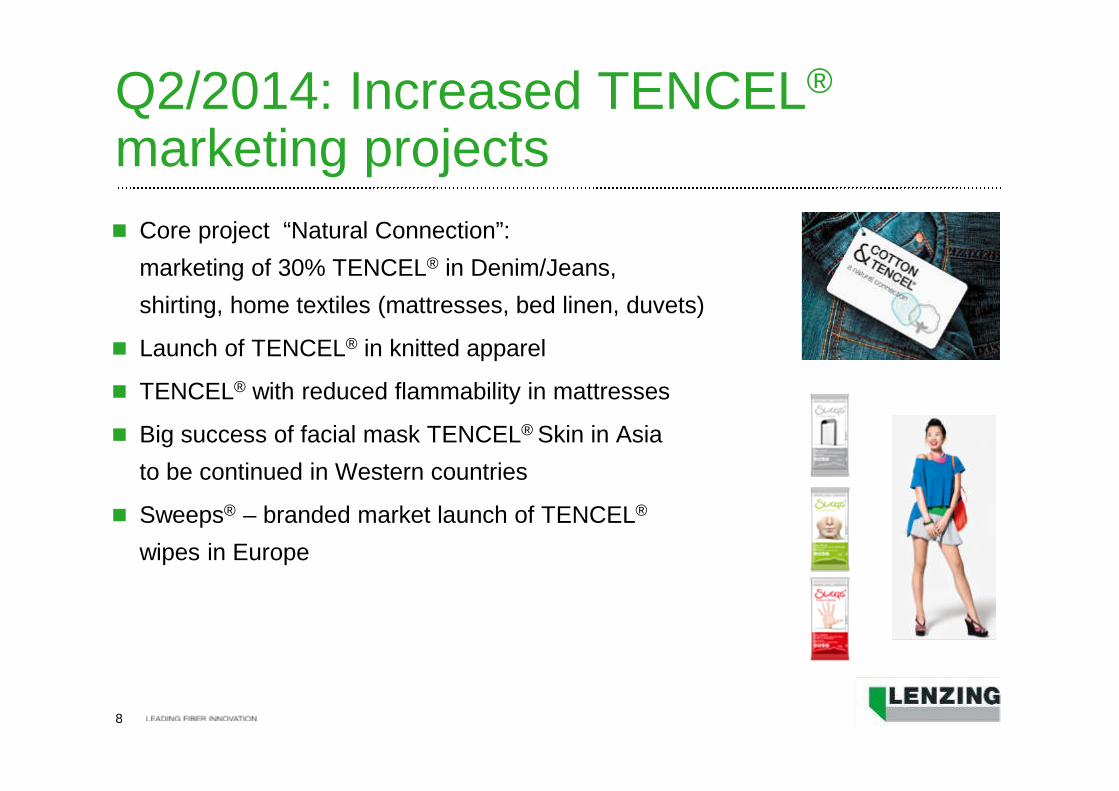
Q2/2014: Increased TENCEL®
marketing projects
Core project “Natural Connection”:
marketing of 30% TENCEL® in Denim/Jeans,
shirting, home textiles (mattresses, bed linen, duvets)
Launch of TENCEL® in knitted apparel
TENCEL® with reduced flammability in mattresses
Big success of facial mask TENCEL® Skin in Asia
to be continued in Western countries
Sweeps® – branded market launch of TENCEL®
wipes in Europe
9
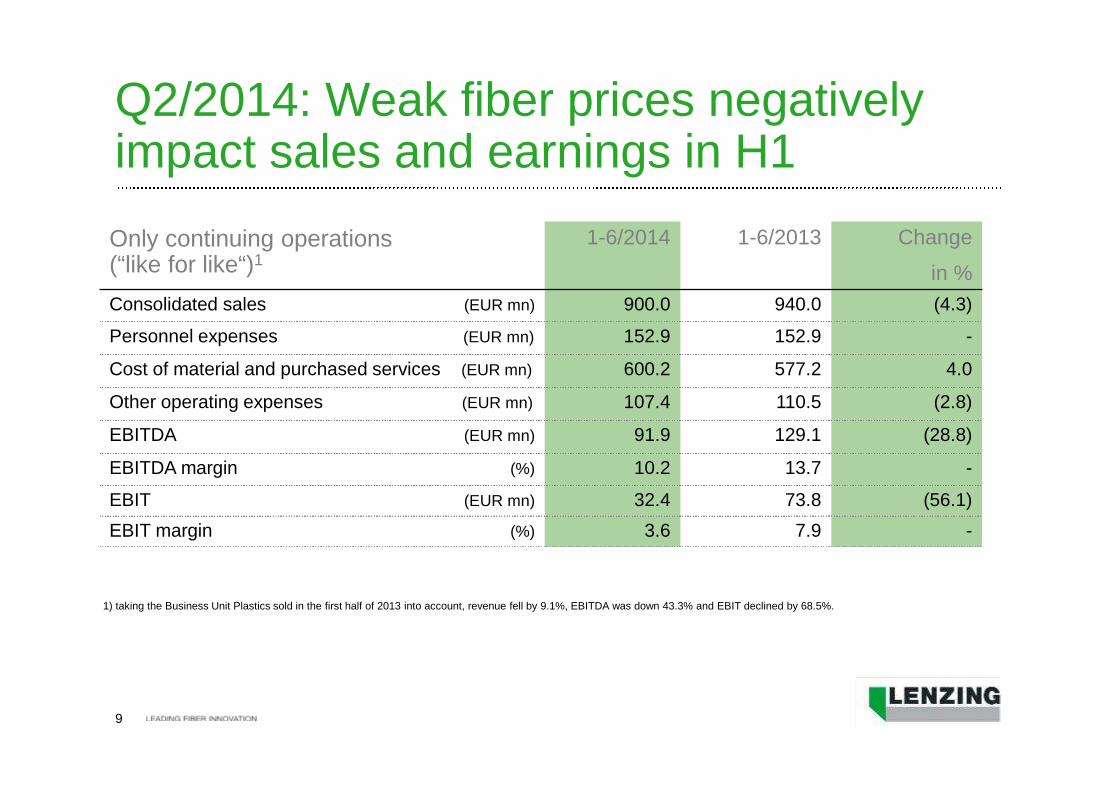
Q2/2014: Weak fiber prices negativelyimpact sales and earnings in H1
1) taking the Business Unit Plastics sold in the first half of 2013 into account, revenue fell by 9.1%, EBITDA was down 43.3% and EBIT declined by 68.5%.
Only continuing operations(“like for like“)1
1-6/2014 1-6/2013 Change
in %
Consolidated sales (EUR mn) 900.0 940.0 (4.3)
Personnel expenses (EUR mn) 152.9 152.9 -
Cost of material and purchased services (EUR mn) 600.2 577.2 4.0
Other operating expenses (EUR mn) 107.4 110.5 (2.8)
EBITDA (EUR mn) 91.9 129.1 (28.8)
EBITDA margin (%) 10.2 13.7 -
EBIT (EUR mn) 32.4 73.8 (56.1)
EBIT margin (%) 3.6 7.9 -
10
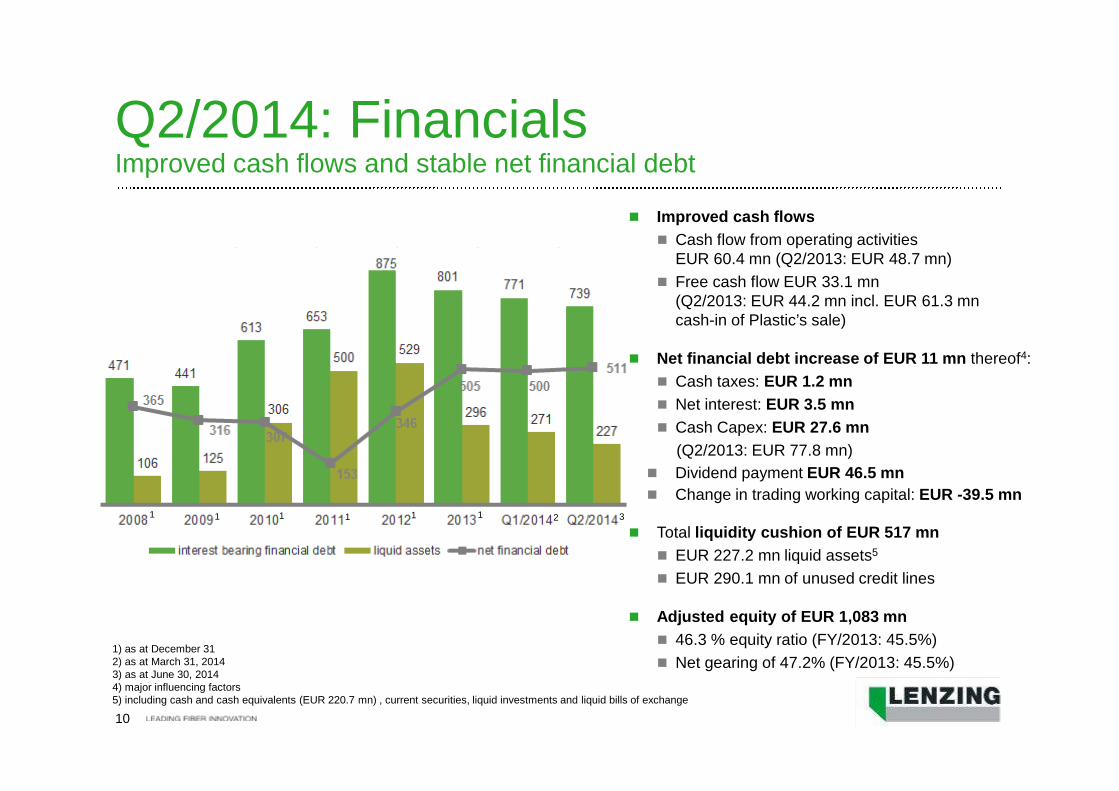
Q2/2014: FinancialsImproved cash flows and stable net financial debt
1) as at December 312) as at March 31, 20143) as at June 30, 20144) major influencing factors5) including cash and cash equivalents (EUR 220.7 mn) , current securities, liquid investments and liquid bills of exchange
Improved cash flows
Cash flow from operating activitiesEUR 60.4 mn (Q2/2013: EUR 48.7 mn)
Free cash flow EUR 33.1 mn(Q2/2013: EUR 44.2 mn incl. EUR 61.3 mncash-in of Plastic’s sale)
Net financial debt increase of EUR 11 mn thereof4:
Cash taxes: EUR 1.2 mn
Net interest: EUR 3.5 mn
Cash Capex: EUR 27.6 mn
(Q2/2013: EUR 77.8 mn)
Dividend payment EUR 46.5 mn
Change in trading working capital: EUR -39.5 mn
Total liquidity cushion of EUR 517 mn
EUR 227.2 mn liquid assets5
EUR 290.1 mn of unused credit lines
Adjusted equity of EUR 1,083 mn
46.3 % equity ratio (FY/2013: 45.5%)
Net gearing of 47.2% (FY/2013: 45.5%)
1 1 1 1 11 2 3
11
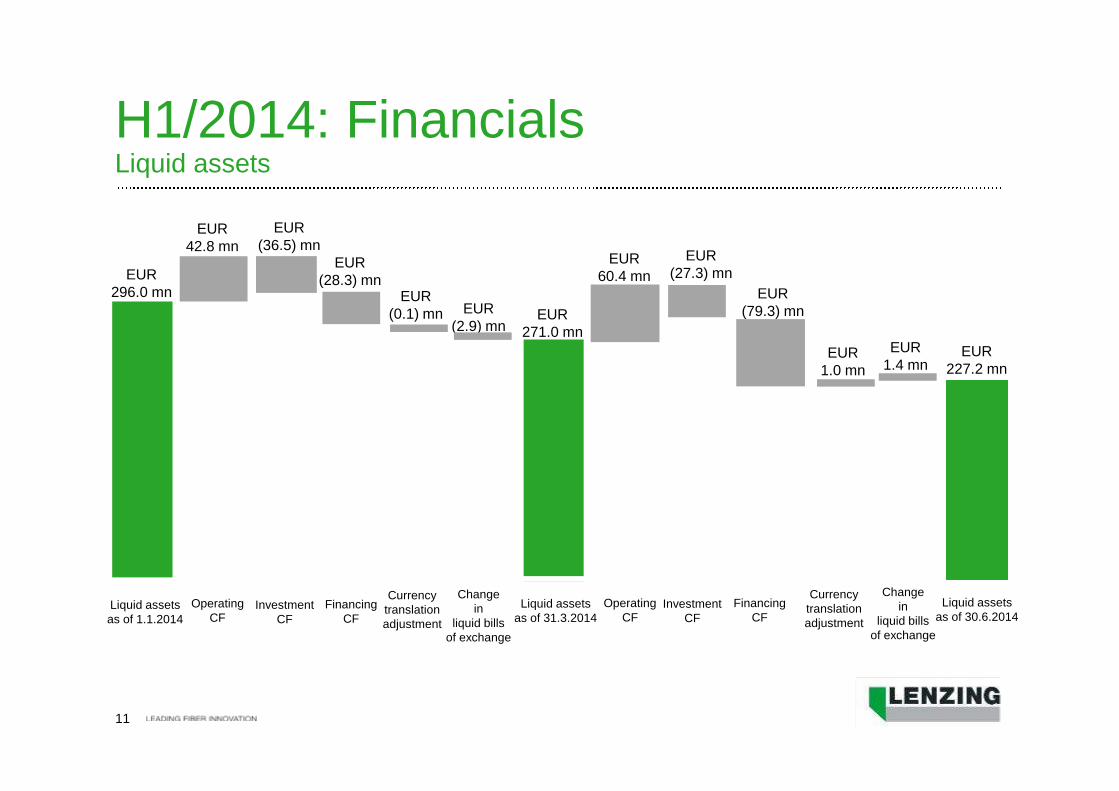
H1/2014: FinancialsLiquid assets
Liquid assetsas of 1.1.2014
Changein
liquid billsof exchange
FinancingCF
OperatingCF
InvestmentCF
OperatingCF
Liquid assetsas of 30.6.2014
Liquid assetsas of 31.3.2014
InvestmentCF
FinancingCF
Changein
liquid billsof exchange
Currencytranslationadjustment
Currencytranslationadjustment
EUR296.0 mn
EUR42.8 mn
EUR(79.3) mn
EUR(28.3) mn
EUR(0.1) mn EUR
(2.9) mnEUR
271.0 mn
EUR60.4 mn
EUR(27.3) mn
EUR(36.5) mn
EUR1.0 mn
EUR1.4 mn
EUR227.2 mn
12
Increased excelLENZ program1/3 more cost savings than estimated (up to EUR 90 mn in 2014e)
Additional cost savings necessary because of decreasing viscose prices
~EUR 60 mn not enough to secure a profitable productionespecially in Europe
Up to EUR 90 mn planned cost savings in 2014
Thereof ~25% personnel cost savings (~ 500 FTE)
Thereof ~75% operational excellence (~50%) and material costs (~50%)
>EUR 160 mn until 2016
Quicker cost savings including more “one-offs”
Structural cost savings as planned
Slightly increased provisions for personnel measures
13
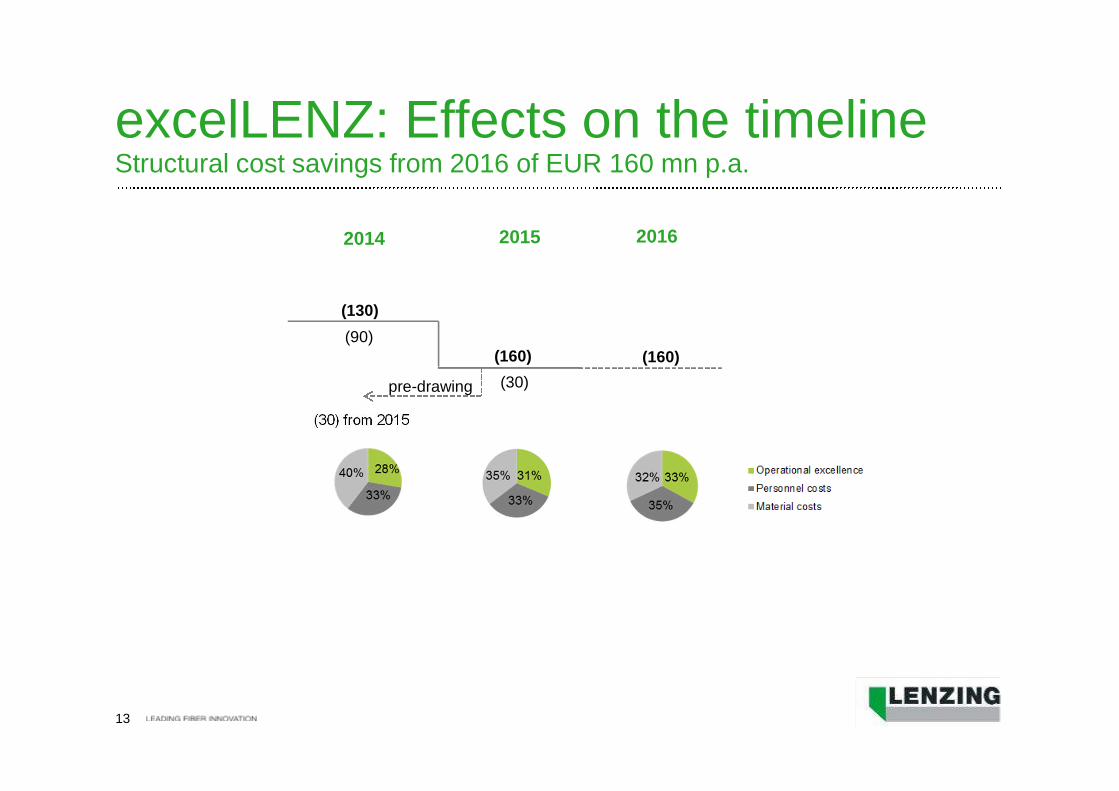
excelLENZ: Effects on the timelineStructural cost savings from 2016 of EUR 160 mn p.a.
2014 2015 2016
(130)
(90)
(160)(160)
(30)
(30) from 2015
pre-drawing
14
Outlook: Full Year 2014Focus on cost savings and specialties marketing
No short-term improvement of global fiber market
Good volume demand but tough pricing to continue
Higher Chinese capacity utilization
Cotton production surplus to increase pressure on all fiber prices
Increased focus on specialties
TENCEL® jumbo line with 30 k tons production in H2/2014
Several marketing campaigns for TENCEL® and Modal®
Strategic review for cost competitiveness and product portfolio review
Financials
Successful excelLENZ program with cost savings of up to EUR 90 mn
Net debt at approx. EUR 500 mn
Active cash flow management
Q2/2014 –Financial information
16
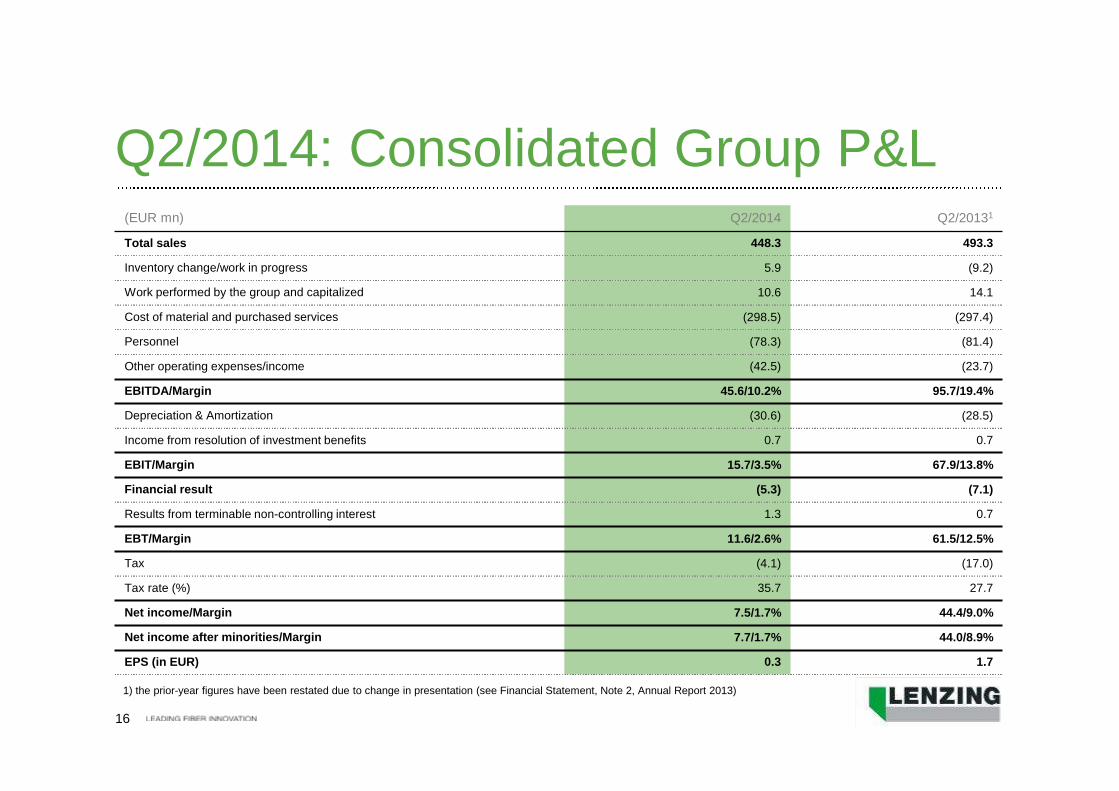
(EUR mn) Q2/2014 Q2/20131
Total sales 448.3 493.3
Inventory change/work in progress 5.9 (9.2)
Work performed by the group and capitalized 10.6 14.1
Cost of material and purchased services (298.5) (297.4)
Personnel (78.3) (81.4)
Other operating expenses/income (42.5) (23.7)
EBITDA/Margin 45.6/10.2% 95.7/19.4%
Depreciation & Amortization (30.6) (28.5)
Income from resolution of investment benefits 0.7 0.7
EBIT/Margin 15.7/3.5% 67.9/13.8%
Financial result (5.3) (7.1)
Results from terminable non-controlling interest 1.3 0.7
EBT/Margin 11.6/2.6% 61.5/12.5%
Tax (4.1) (17.0)
Tax rate (%) 35.7 27.7
Net income/Margin 7.5/1.7% 44.4/9.0%
Net income after minorities/Margin 7.7/1.7% 44.0/8.9%
EPS (in EUR) 0.3 1.7
Q2/2014: Consolidated Group P&L
1) the prior-year figures have been restated due to change in presentation (see Financial Statement, Note 2, Annual Report 2013)
17
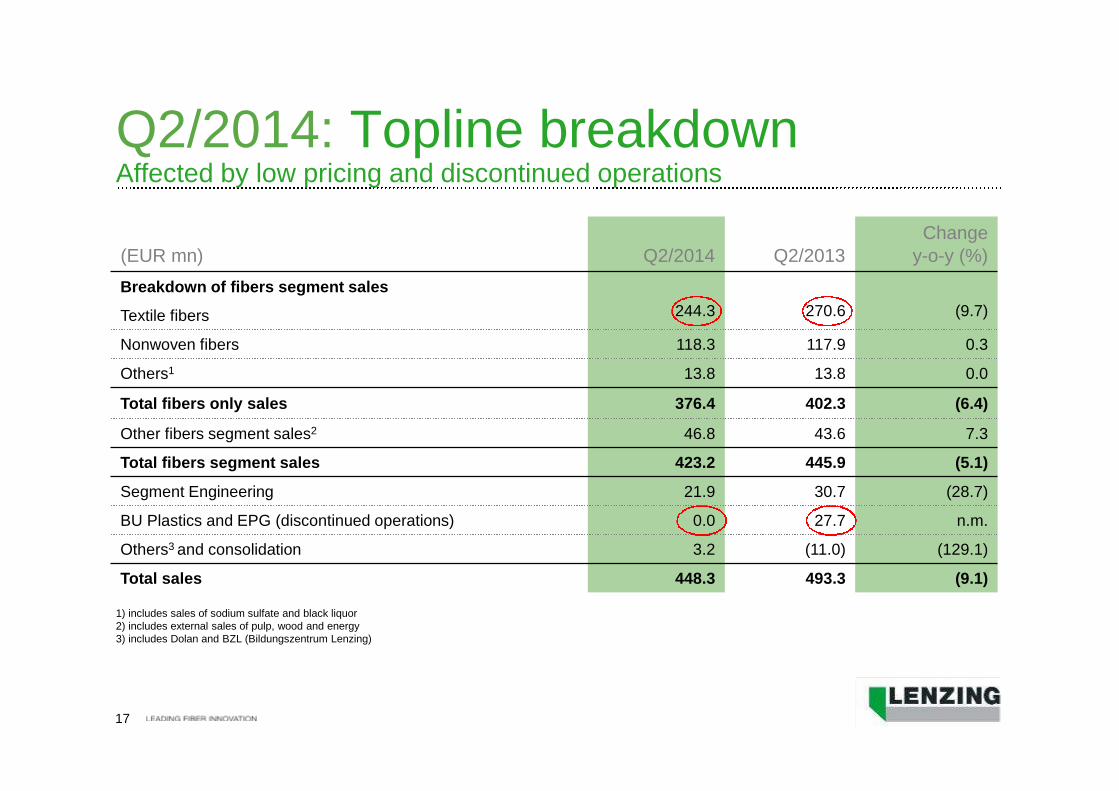
Q2/2014: Topline breakdownAffected by low pricing and discontinued operations
(EUR mn) Q2/2014 Q2/2013Change
y-o-y (%)
Breakdown of fibers segment sales
Textile fibers 244.3 270.6 (9.7)
Nonwoven fibers 118.3 117.9 0.3
Others1 13.8 13.8 0.0
Total fibers only sales 376.4 402.3 (6.4)
Other fibers segment sales2 46.8 43.6 7.3
Total fibers segment sales 423.2 445.9 (5.1)
Segment Engineering 21.9 30.7 (28.7)
BU Plastics and EPG (discontinued operations) 0.0 27.7 n.m.
Others3 and consolidation 3.2 (11.0) (129.1)
Total sales 448.3 493.3 (9.1)
1) includes sales of sodium sulfate and black liquor2) includes external sales of pulp, wood and energy3) includes Dolan and BZL (Bildungszentrum Lenzing)

18
Q2/2014: Total Opex
19
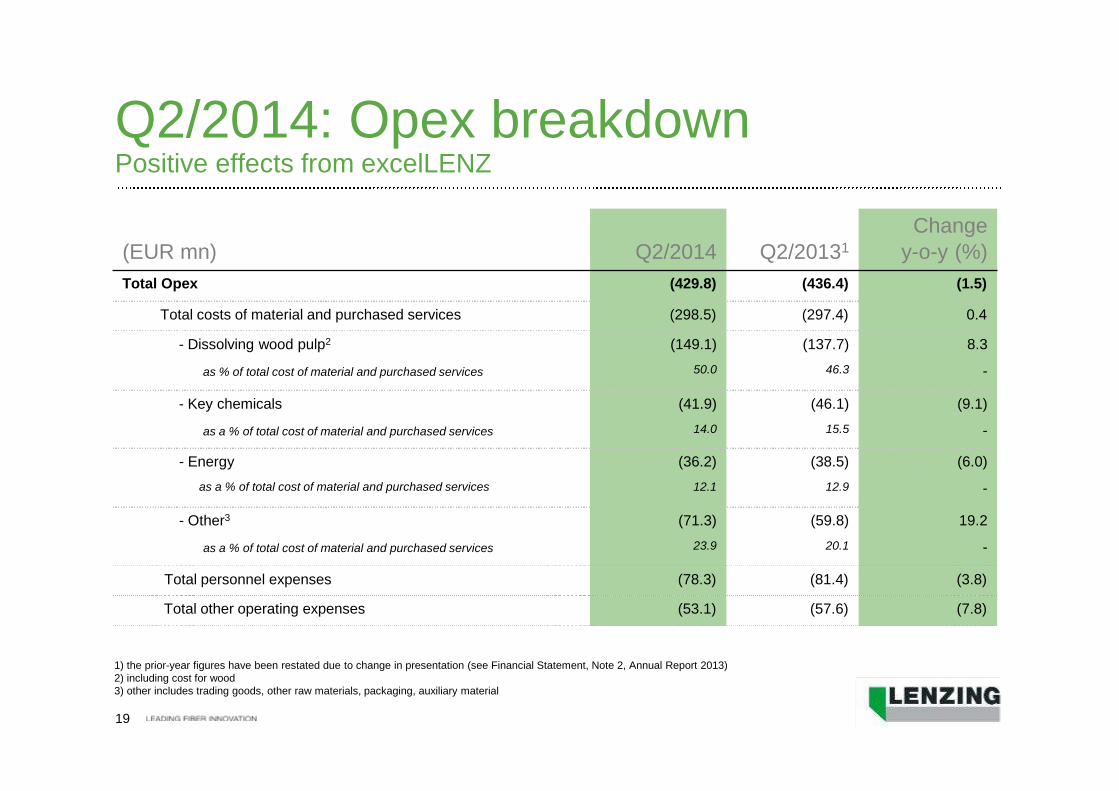
Q2/2014: Opex breakdownPositive effects from excelLENZ
(EUR mn) Q2/2014 Q2/20131
Changey-o-y (%)
Total Opex (429.8) (436.4) (1.5)
Total costs of material and purchased services (298.5) (297.4) 0.4
- Dissolving wood pulp2
as % of total cost of material and purchased services
(149.1)
50.0
(137.7)
46.3
8.3
-
- Key chemicals
as a % of total cost of material and purchased services
(41.9)
14.0
(46.1)
15.5
(9.1)
-
- Energy
as a % of total cost of material and purchased services
(36.2)
12.1
(38.5)
12.9
(6.0)
-
- Other3
as a % of total cost of material and purchased services
(71.3)
23.9
(59.8)
20.1
19.2
-
Total personnel expenses (78.3) (81.4) (3.8)
Total other operating expenses (53.1) (57.6) (7.8)
1) the prior-year figures have been restated due to change in presentation (see Financial Statement, Note 2, Annual Report 2013)2) including cost for wood3) other includes trading goods, other raw materials, packaging, auxiliary material

20
Q2/2014: Opex as of total sales
(EUR mn) Q2/2014 Q2/20131
Changey-o-y (%)
Total sales 448.3 493.3 (9.1)
Total Opex2 (429.8) (436.4) (1.5)
Total cost of material and purchased services
as % of total sales
(298.5)
66.6
(297.4)
60.3
0.4
-
Total personnel expenses
as % of total sales
(78.3)
17.5
(81.4)
16.5
(3.8)
-
Total other operating expenses (53.1) (57.6) (7.8)
as % of total sales 11.8 11.7 -
1) the prior-year figures have been restated due to change in presentation (see Financial Statement, Note 2, Annual Report 2013)2) includes cost of material and purchased services, personnel expenses and other operating expenses
21
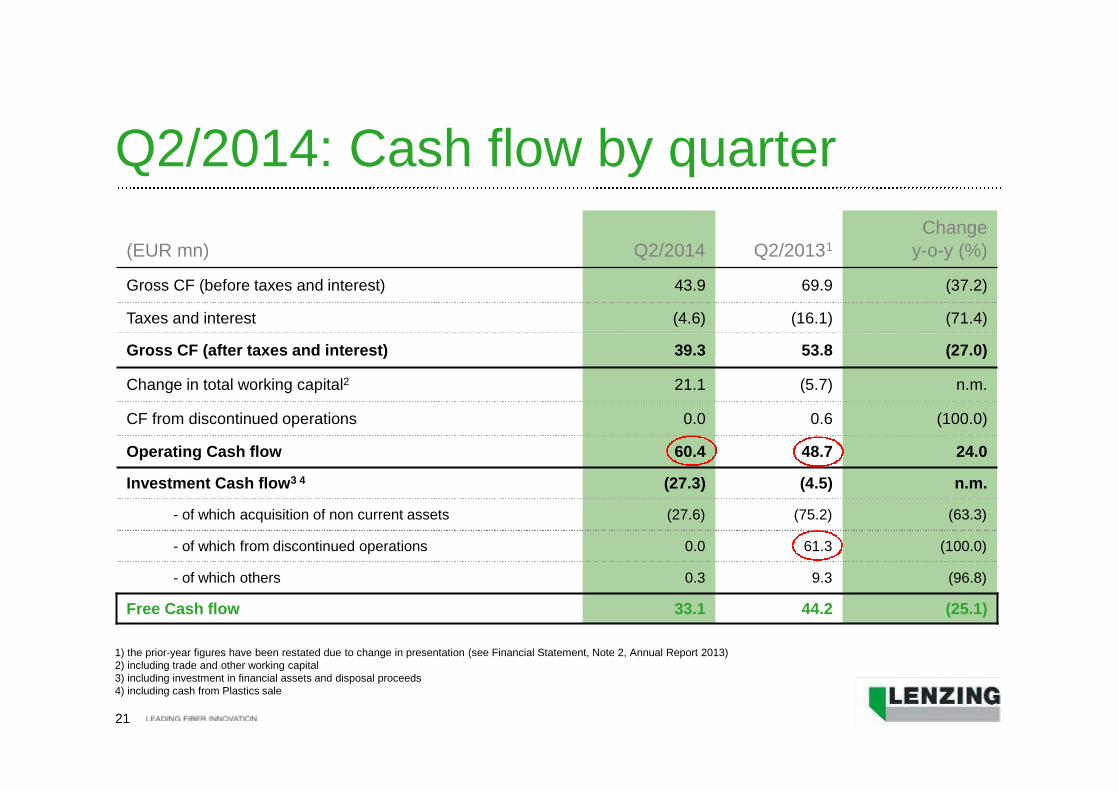
(EUR mn) Q2/2014 Q2/20131
Changey-o-y (%)
Gross CF (before taxes and interest) 43.9 69.9 (37.2)
Taxes and interest (4.6) (16.1) (71.4)
Gross CF (after taxes and interest) 39.3 53.8 (27.0)
Change in total working capital2 21.1 (5.7) n.m.
CF from discontinued operations 0.0 0.6 (100.0)
Operating Cash flow 60.4 48.7 24.0
Investment Cash flow3 4 (27.3) (4.5) n.m.
- of which acquisition of non current assets (27.6) (75.2) (63.3)
- of which from discontinued operations 0.0 61.3 (100.0)
- of which others 0.3 9.3 (96.8)
Free Cash flow 33.1 44.2 (25.1)
Q2/2014: Cash flow by quarter
1) the prior-year figures have been restated due to change in presentation (see Financial Statement, Note 2, Annual Report 2013)2) including trade and other working capital3) including investment in financial assets and disposal proceeds4) including cash from Plastics sale

H1/2014 –Financial information
23
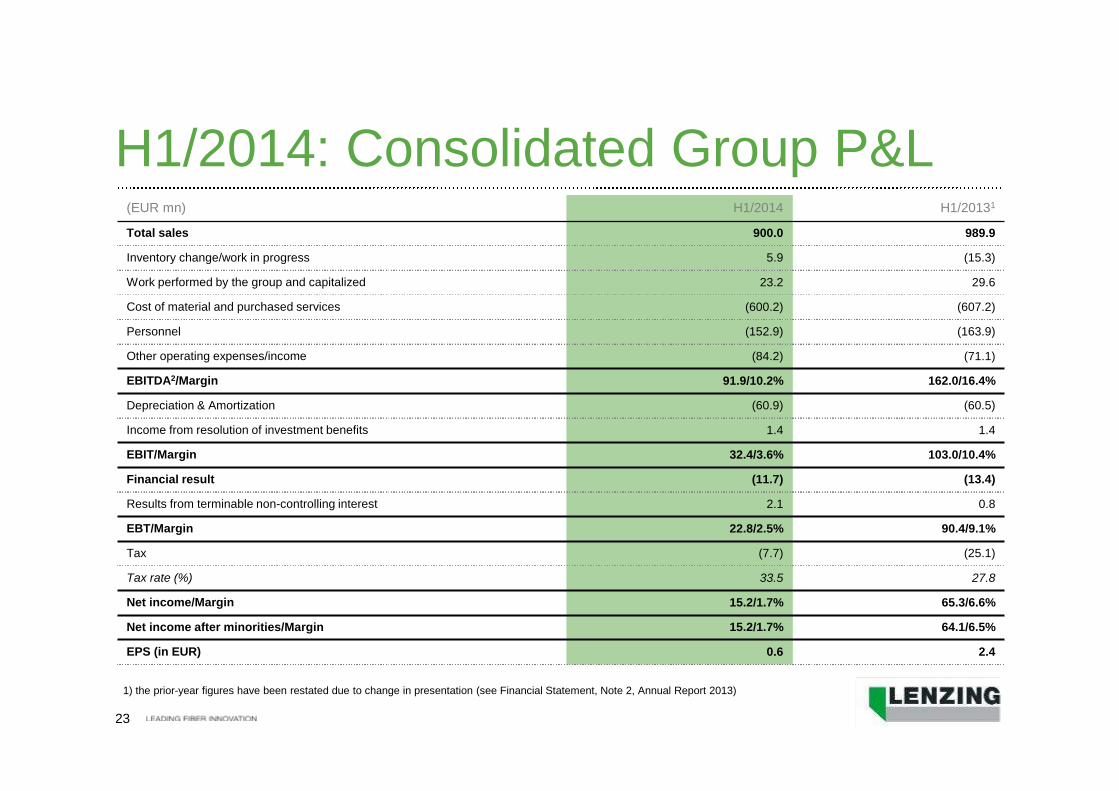
H1/2014: Consolidated Group P&L
1) the prior-year figures have been restated due to change in presentation (see Financial Statement, Note 2, Annual Report 2013)
(EUR mn) H1/2014 H1/20131
Total sales 900.0 989.9
Inventory change/work in progress 5.9 (15.3)
Work performed by the group and capitalized 23.2 29.6
Cost of material and purchased services (600.2) (607.2)
Personnel (152.9) (163.9)
Other operating expenses/income (84.2) (71.1)
EBITDA2/Margin 91.9/10.2% 162.0/16.4%
Depreciation & Amortization (60.9) (60.5)
Income from resolution of investment benefits 1.4 1.4
EBIT/Margin 32.4/3.6% 103.0/10.4%
Financial result (11.7) (13.4)
Results from terminable non-controlling interest 2.1 0.8
EBT/Margin 22.8/2.5% 90.4/9.1%
Tax (7.7) (25.1)
Tax rate (%) 33.5 27.8
Net income/Margin 15.2/1.7% 65.3/6.6%
Net income after minorities/Margin 15.2/1.7% 64.1/6.5%
EPS (in EUR) 0.6 2.4
24
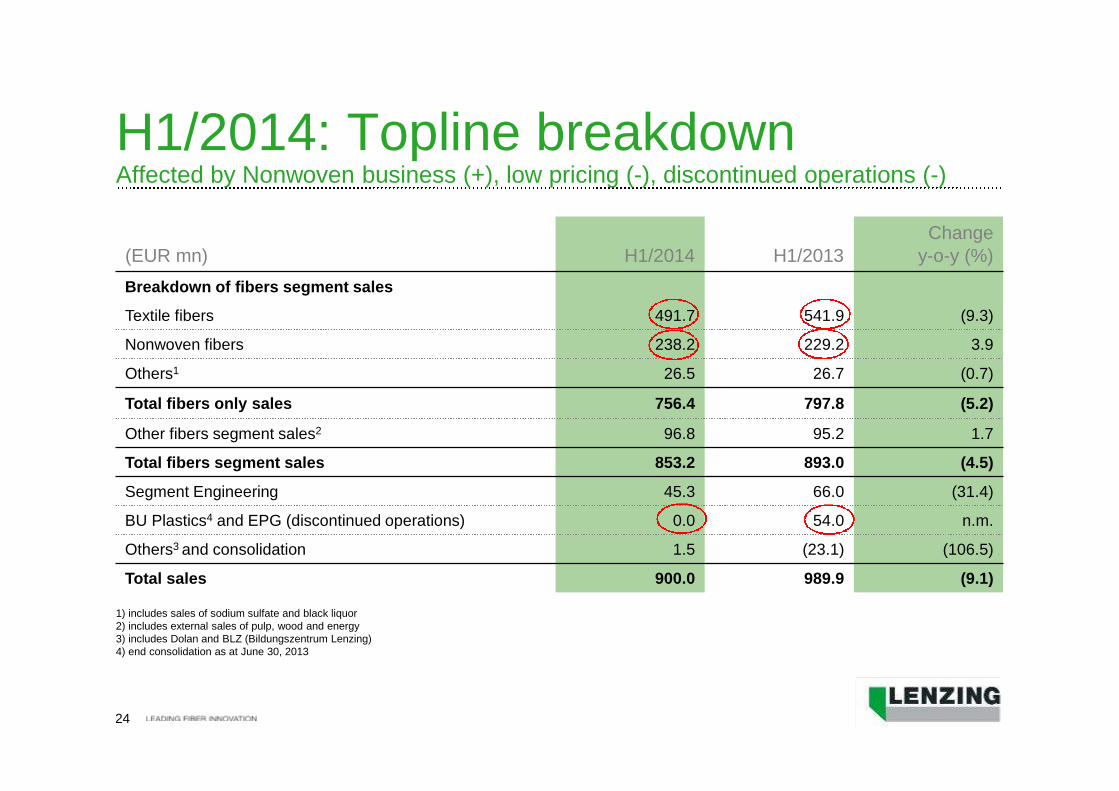
H1/2014: Topline breakdownAffected by Nonwoven business (+), low pricing (-), discontinued operations (-)
(EUR mn) H1/2014 H1/2013Change
y-o-y (%)
Breakdown of fibers segment sales
Textile fibers 491.7 541.9 (9.3)
Nonwoven fibers 238.2 229.2 3.9
Others1 26.5 26.7 (0.7)
Total fibers only sales 756.4 797.8 (5.2)
Other fibers segment sales2 96.8 95.2 1.7
Total fibers segment sales 853.2 893.0 (4.5)
Segment Engineering 45.3 66.0 (31.4)
BU Plastics4 and EPG (discontinued operations) 0.0 54.0 n.m.
Others3 and consolidation 1.5 (23.1) (106.5)
Total sales 900.0 989.9 (9.1)
1) includes sales of sodium sulfate and black liquor2) includes external sales of pulp, wood and energy3) includes Dolan and BLZ (Bildungszentrum Lenzing)4) end consolidation as at June 30, 2013
25
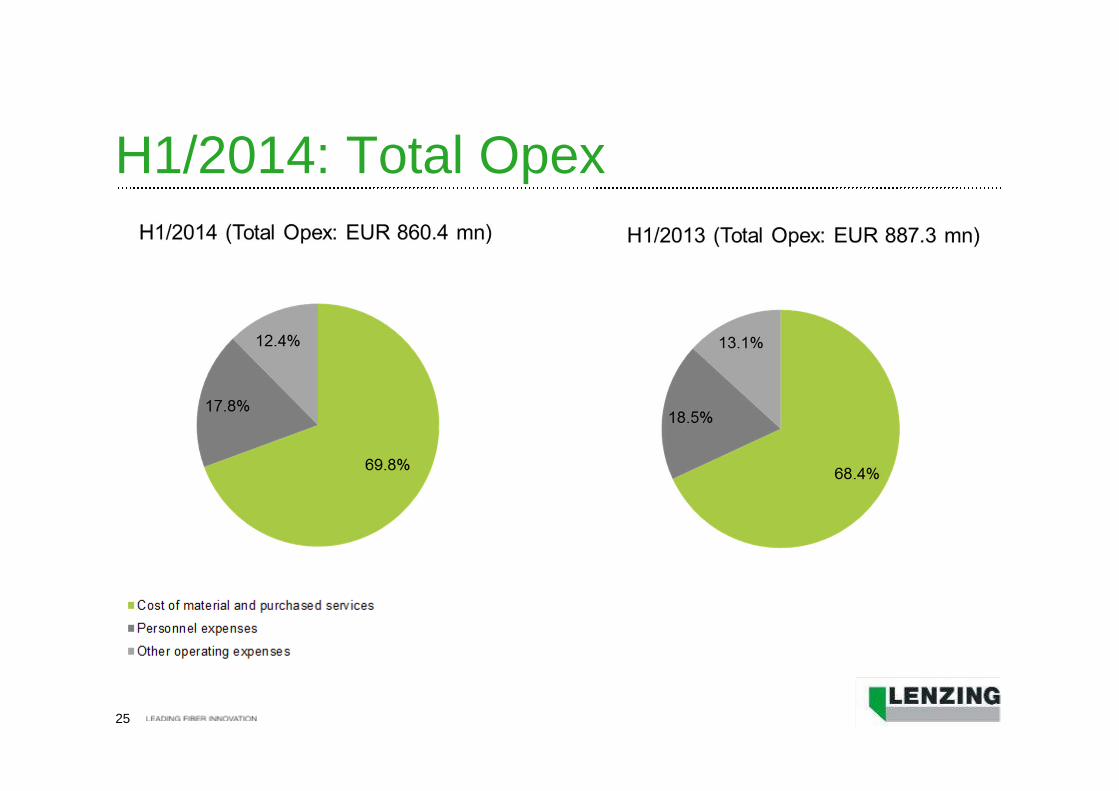
H1/2014: Total Opex
26
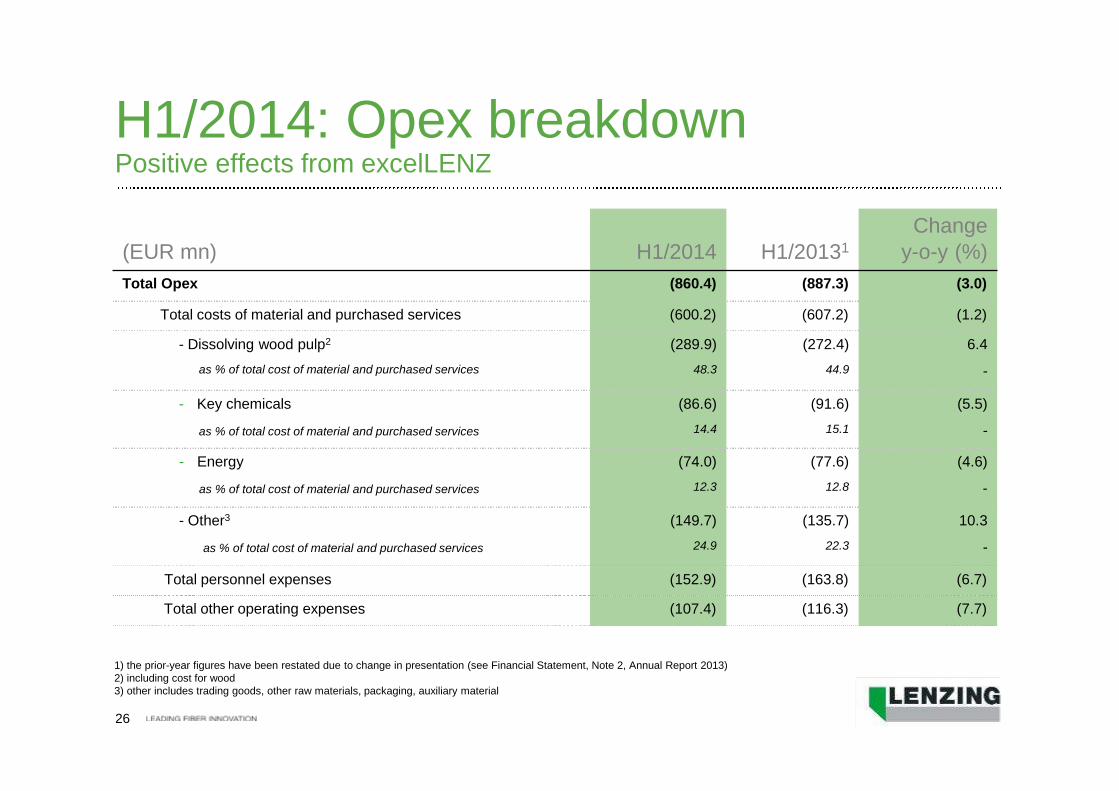
H1/2014: Opex breakdownPositive effects from excelLENZ
(EUR mn) H1/2014 H1/20131
Changey-o-y (%)
Total Opex (860.4) (887.3) (3.0)
Total costs of material and purchased services (600.2) (607.2) (1.2)
- Dissolving wood pulp2
as % of total cost of material and purchased services
(289.9)
48.3
(272.4)
44.9
6.4
-
- Key chemicals
as % of total cost of material and purchased services
(86.6)
14.4
(91.6)
15.1
(5.5)
-
- Energy
as % of total cost of material and purchased services
(74.0)
12.3
(77.6)
12.8
(4.6)
-
- Other3
as % of total cost of material and purchased services
(149.7)
24.9
(135.7)
22.3
10.3
-
Total personnel expenses (152.9) (163.8) (6.7)
Total other operating expenses (107.4) (116.3) (7.7)
1) the prior-year figures have been restated due to change in presentation (see Financial Statement, Note 2, Annual Report 2013)2) including cost for wood3) other includes trading goods, other raw materials, packaging, auxiliary material
27
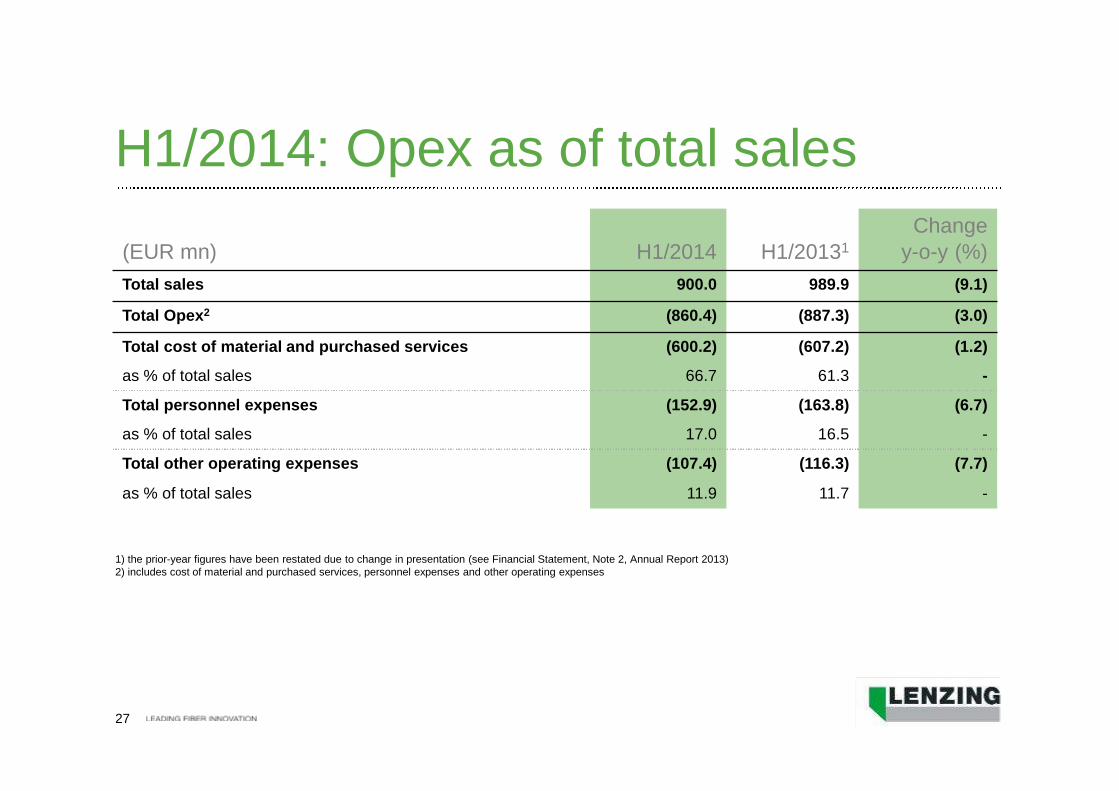
H1/2014: Opex as of total sales
(EUR mn) H1/2014 H1/20131
Changey-o-y (%)
Total sales 900.0 989.9 (9.1)
Total Opex2 (860.4) (887.3) (3.0)
Total cost of material and purchased services
as % of total sales
(600.2)
66.7
(607.2)
61.3
(1.2)
-
Total personnel expenses
as % of total sales
(152.9)
17.0
(163.8)
16.5
(6.7)
-
Total other operating expenses (107.4) (116.3) (7.7)
as % of total sales 11.9 11.7 -
1) the prior-year figures have been restated due to change in presentation (see Financial Statement, Note 2, Annual Report 2013)2) includes cost of material and purchased services, personnel expenses and other operating expenses
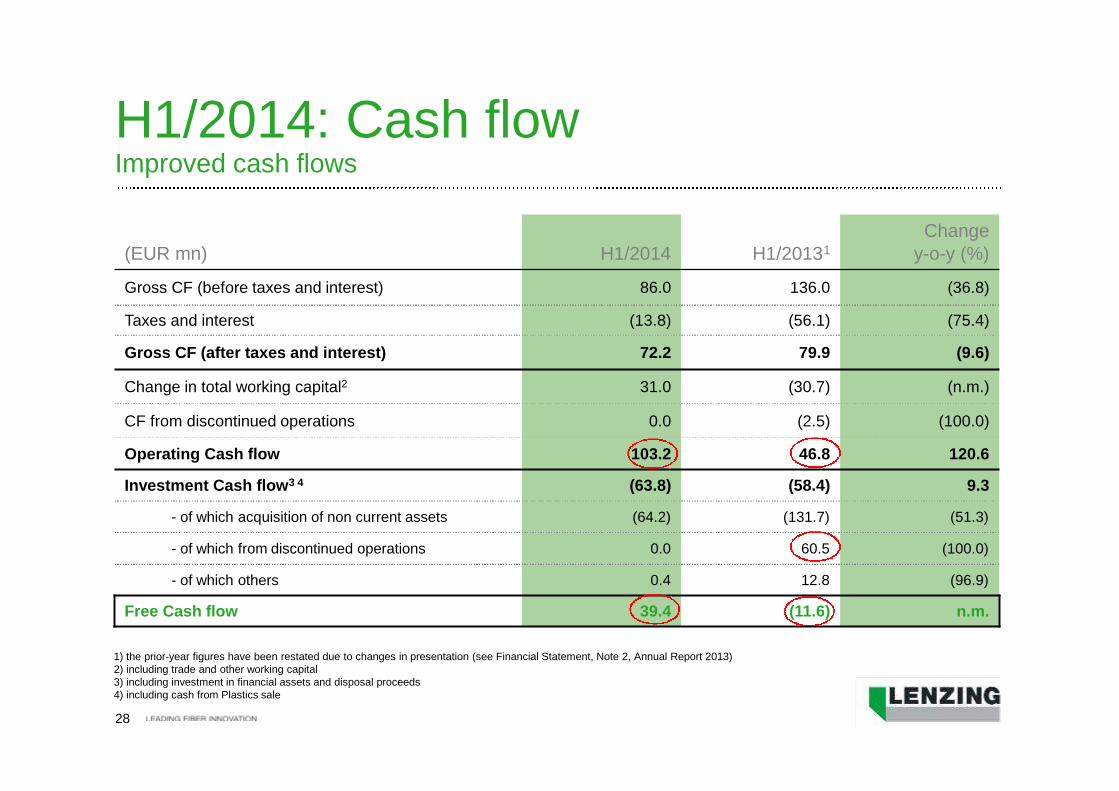
28
(EUR mn) H1/2014 H1/20131
Changey-o-y (%)
Gross CF (before taxes and interest) 86.0 136.0 (36.8)
Taxes and interest (13.8) (56.1) (75.4)
Gross CF (after taxes and interest) 72.2 79.9 (9.6)
Change in total working capital2 31.0 (30.7) (n.m.)
CF from discontinued operations 0.0 (2.5) (100.0)
Operating Cash flow 103.2 46.8 120.6
Investment Cash flow3 4 (63.8) (58.4) 9.3
- of which acquisition of non current assets (64.2) (131.7) (51.3)
- of which from discontinued operations 0.0 60.5 (100.0)
- of which others 0.4 12.8 (96.9)
Free Cash flow 39.4 (11.6) n.m.
H1/2014: Cash flowImproved cash flows
1) the prior-year figures have been restated due to changes in presentation (see Financial Statement, Note 2, Annual Report 2013)2) including trade and other working capital3) including investment in financial assets and disposal proceeds4) including cash from Plastics sale
Appendix –Equity story
30
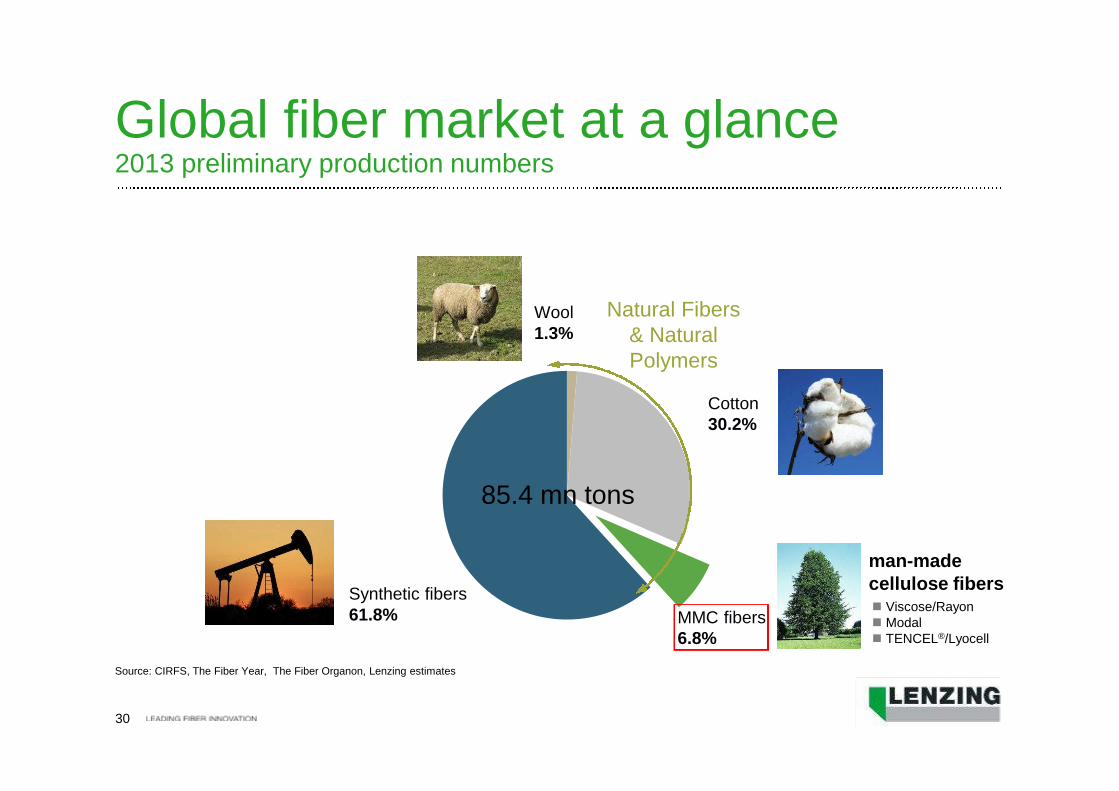
Global fiber market at a glance2013 preliminary production numbers
Natural Fibers& NaturalPolymers
Cotton30.2%
MMC fibers6.8%
Synthetic fibers61.8%
Wool1.3%
85.4 mn tons
man-madecellulose fibers Viscose/Rayon Modal TENCEL®/Lyocell
Source: CIRFS, The Fiber Year, The Fiber Organon, Lenzing estimates
31
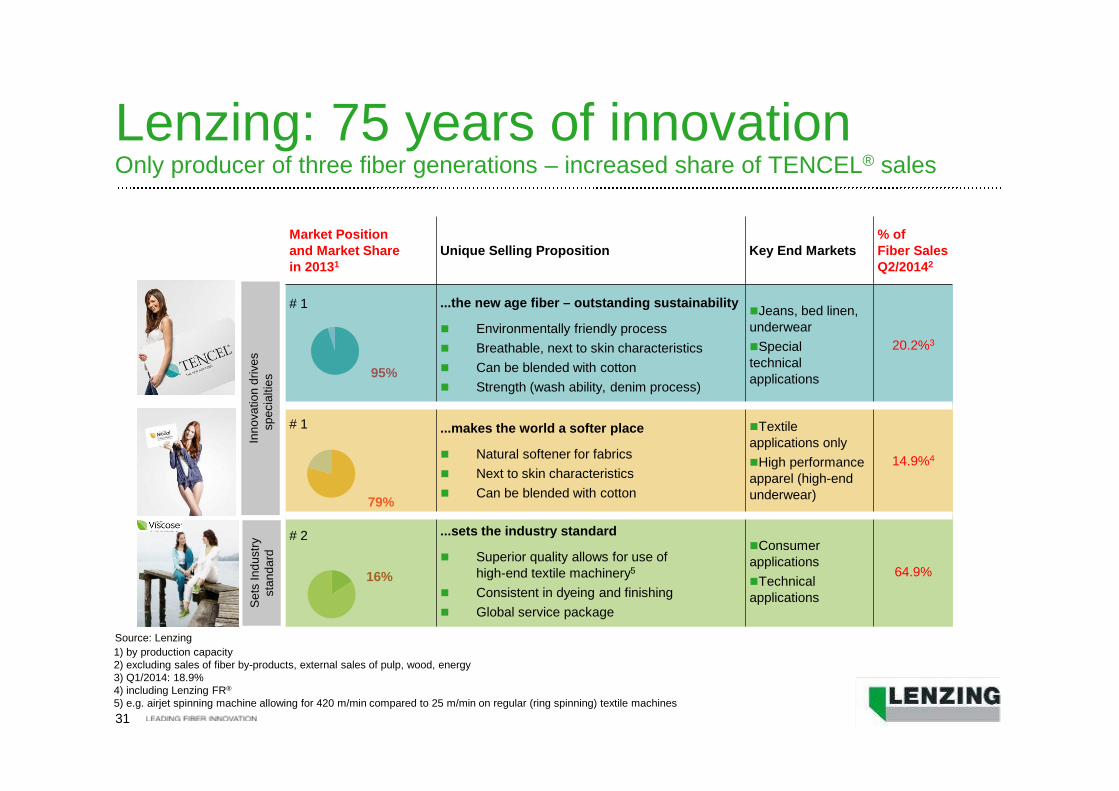
Lenzing: 75 years of innovationOnly producer of three fiber generations – increased share of TENCEL® sales
79%
16%
Inn
ova
tio
nd
rive
ssp
ecia
ltie
sS
ets
Ind
ustr
ysta
nd
ard
Source: Lenzing
1) by production capacity2) excluding sales of fiber by-products, external sales of pulp, wood, energy3) Q1/2014: 18.9%4) including Lenzing FR®
5) e.g. airjet spinning machine allowing for 420 m/min compared to 25 m/min on regular (ring spinning) textile machines
95%
Market Positionand Market Sharein 20131
Unique Selling Proposition Key End Markets% ofFiber SalesQ2/20142
# 1 ...the new age fiber – outstanding sustainability
Environmentally friendly process
Breathable, next to skin characteristics
Can be blended with cotton
Strength (wash ability, denim process)
Jeans, bed linen,underwear
Specialtechnicalapplications
20.2%3
# 1 ...makes the world a softer place
Natural softener for fabrics
Next to skin characteristics
Can be blended with cotton
Textileapplications only
High performanceapparel (high-endunderwear)
14.9%4
# 2 ...sets the industry standard
Superior quality allows for use ofhigh-end textile machinery5
Consistent in dyeing and finishing
Global service package
Consumerapplications
Technicalapplications
64.9%
32
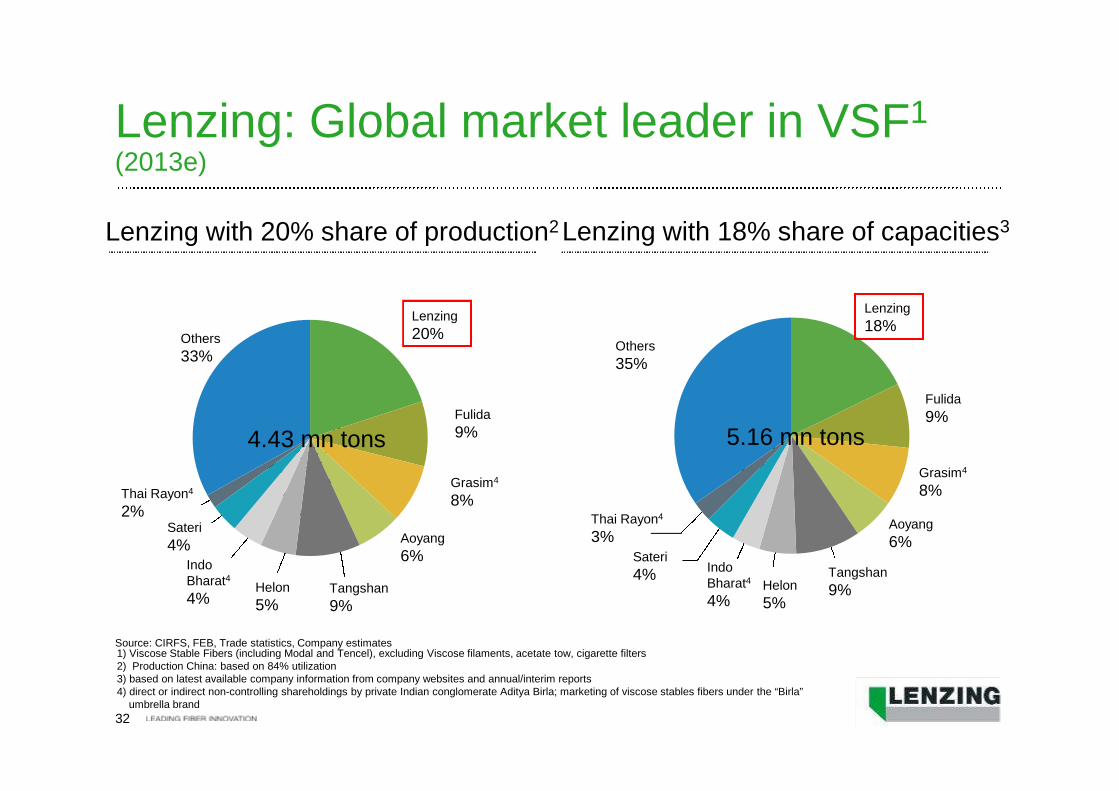
Lenzing: Global market leader in VSF1
(2013e)
Lenzing
20%
Grasim4
8%
Fulida
9%
Aoyang
6%
Helon
5%
IndoBharat4
4%Tangshan
9%
Thai Rayon4
2%
Others
33%
Sateri
4%
Lenzing with 20% share of production2
Source: CIRFS, FEB, Trade statistics, Company estimates
Lenzing
18%
Fulida
9%
Grasim4
8%
Aoyang
6%
Tangshan
9%Helon
5%
IndoBharat4
4%
Sateri
4%
Thai Rayon4
3%
Others
35%
Lenzing with 18% share of capacities3
1) Viscose Stable Fibers (including Modal and Tencel), excluding Viscose filaments, acetate tow, cigarette filters2) Production China: based on 84% utilization3) based on latest available company information from company websites and annual/interim reports4) direct or indirect non-controlling shareholdings by private Indian conglomerate Aditya Birla; marketing of viscose stables fibers under the “Birla”
umbrella brand
5.16 mn tons4.43 mn tons
33
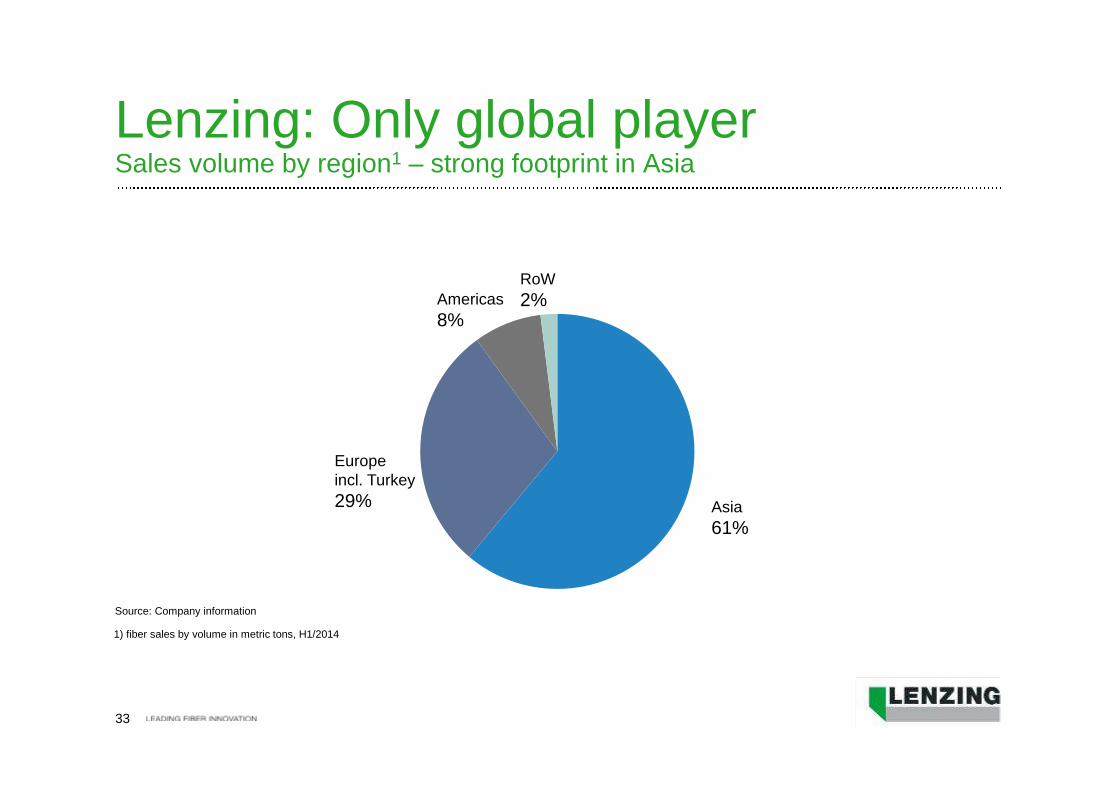
Lenzing: Only global playerSales volume by region1 – strong footprint in Asia
Asia
61%
Europeincl. Turkey
29%
Americas
8%
RoW
2%
1) fiber sales by volume in metric tons, H1/2014
Source: Company information
34
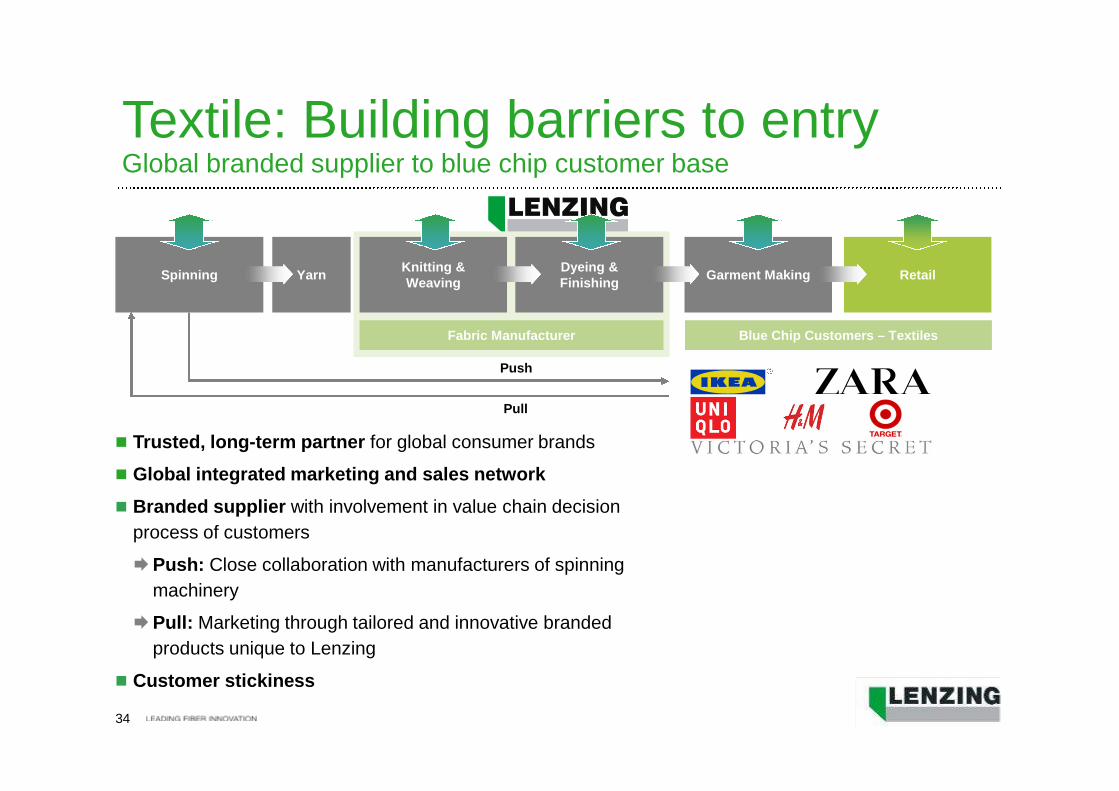
Fabric Manufacturer
Spinning
Push
Pull
YarnDyeing &Finishing
Knitting &Weaving
Garment Making Retail
Textile: Building barriers to entryGlobal branded supplier to blue chip customer base
Trusted, long-term partner for global consumer brands
Global integrated marketing and sales network
Branded supplier with involvement in value chain decision
process of customers
Push: Close collaboration with manufacturers of spinning
machinery
Pull: Marketing through tailored and innovative branded
products unique to Lenzing
Customer stickiness
Blue Chip Customers – Textiles
35
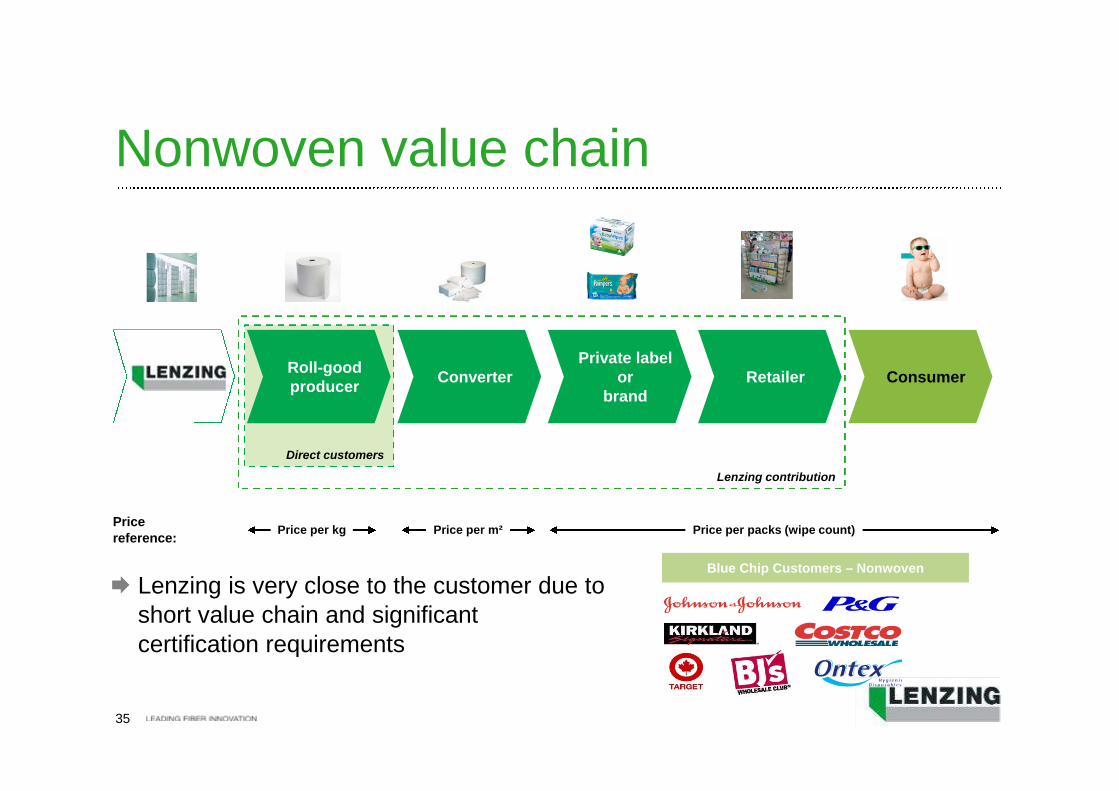
Lenzing
Pricereference:
Lenzing contribution
Direct customers
Roll-goodproducer
ConverterPrivate label
orbrand
Retailer Consumer
Price per kg Price per m² Price per packs (wipe count)
Nonwoven value chain
Lenzing is very close to the customer due toshort value chain and significantcertification requirements
Blue Chip Customers – Nonwoven
36
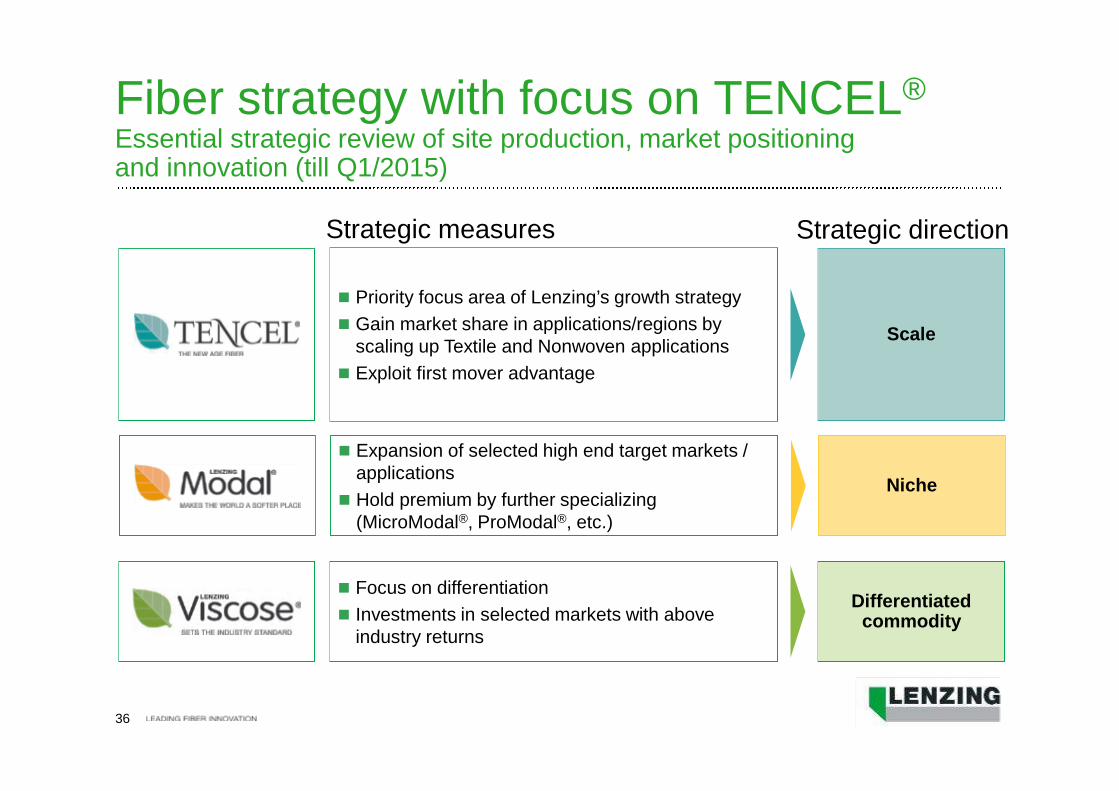
Focus on differentiation
Investments in selected markets with aboveindustry returns
VSFDifferentiated
commodity
Expansion of selected high end target markets /applications
Hold premium by further specializing(MicroModal®, ProModal®, etc.)
Modal Niche
Priority focus area of Lenzing’s growth strategy
Gain market share in applications/regions byscaling up Textile and Nonwoven applications
Exploit first mover advantage
Tencel Scale
Strategic directionStrategic measures
Fiber strategy with focus on TENCEL®
Essential strategic review of site production, market positioningand innovation (till Q1/2015)
37
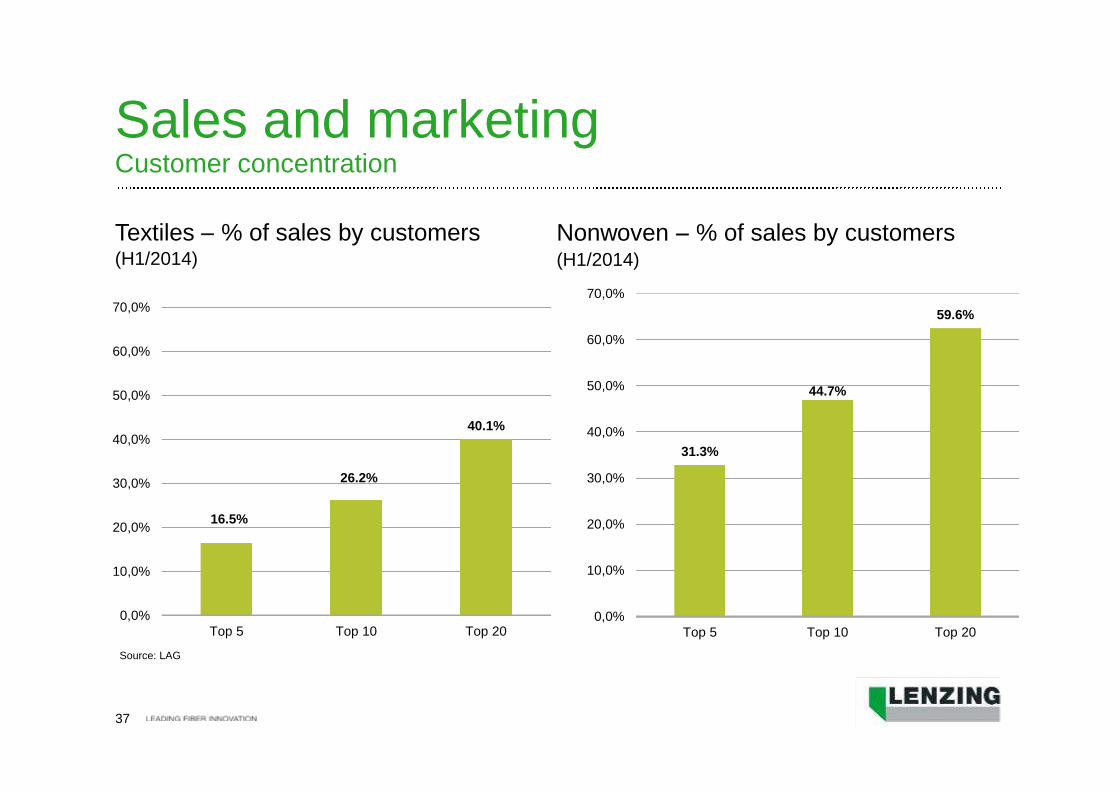
Sales and marketingCustomer concentration
Textiles % of sales by customers(H1/2014)
Source: LAG
Nonwoven % of sales by customers(H1/2014)
16.5%
26.2%
40.1%
0,0%
10,0%
20,0%
30,0%
40,0%
50,0%
60,0%
70,0%
Top 5 Top 10 Top 20
31.3%
44.7%
59.6%
0,0%
10,0%
20,0%
30,0%
40,0%
50,0%
60,0%
70,0%
Top 5 Top 10 Top 20
38
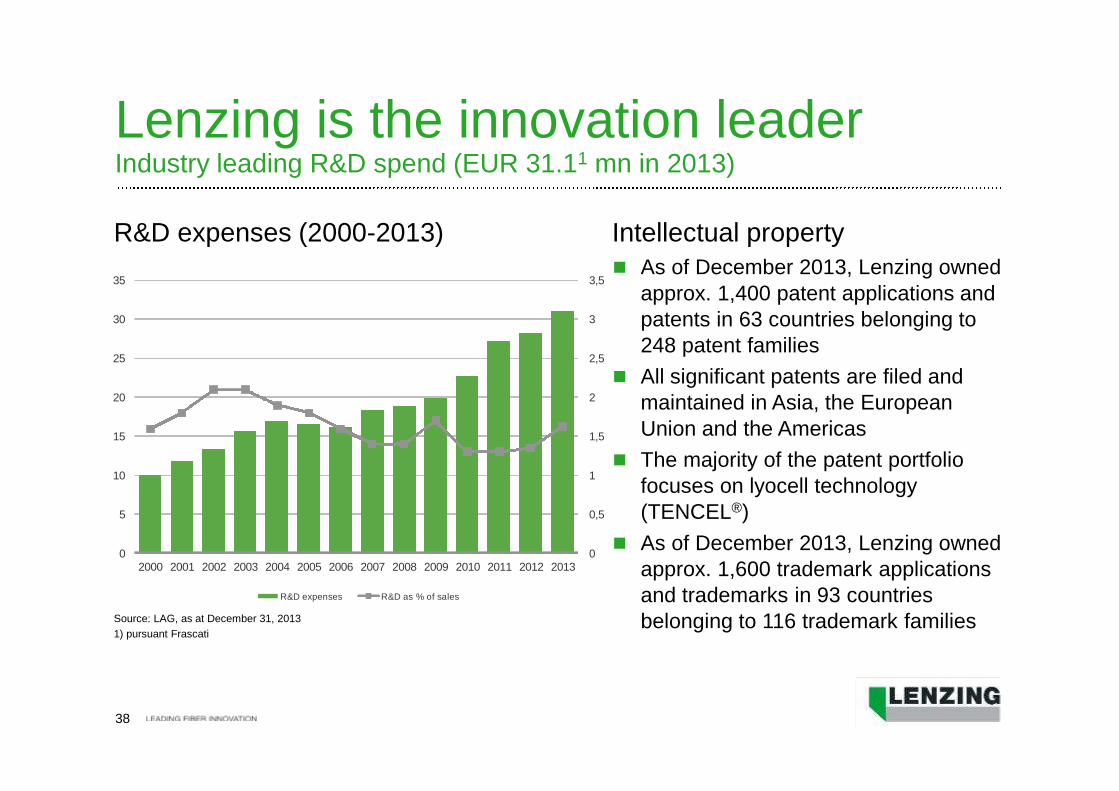
Lenzing is the innovation leaderIndustry leading R&D spend (EUR 31.11 mn in 2013)
As of December 2013, Lenzing ownedapprox. 1,400 patent applications andpatents in 63 countries belonging to248 patent families
All significant patents are filed andmaintained in Asia, the EuropeanUnion and the Americas
The majority of the patent portfoliofocuses on lyocell technology(TENCEL®)
As of December 2013, Lenzing ownedapprox. 1,600 trademark applicationsand trademarks in 93 countriesbelonging to 116 trademark familiesSource: LAG, as at December 31, 2013
1) pursuant Frascati
R&D expenses (2000-2013) Intellectual property
0
0,5
1
1,5
2
2,5
3
3,5
0
5
10
15
20
25
30
35
2000 2001 2002 2003 2004 2005 2006 2007 2008 2009 2010 2011 2012 2013
R&D expenses R&D as % of sales
39
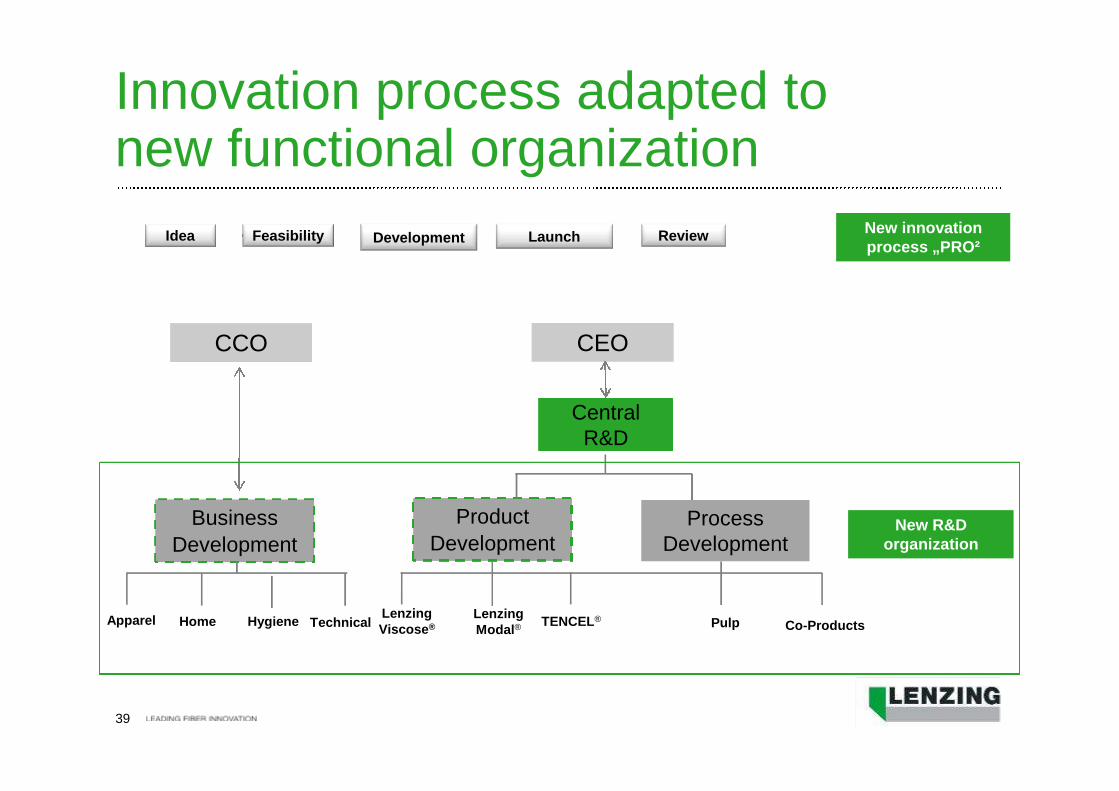
Innovation process adapted tonew functional organization
CEO
Product
Development
LenzingViscose® TENCEL®Lenzing
Modal®
Idea Feasibility Development Launch ReviewNew innovationprocess „PRO²
New R&Dorganization
ProcessDevelopment
Business
Development
Co-ProductsPulpApparel Hygiene
CentralR&D
CCO
Home Technical
40
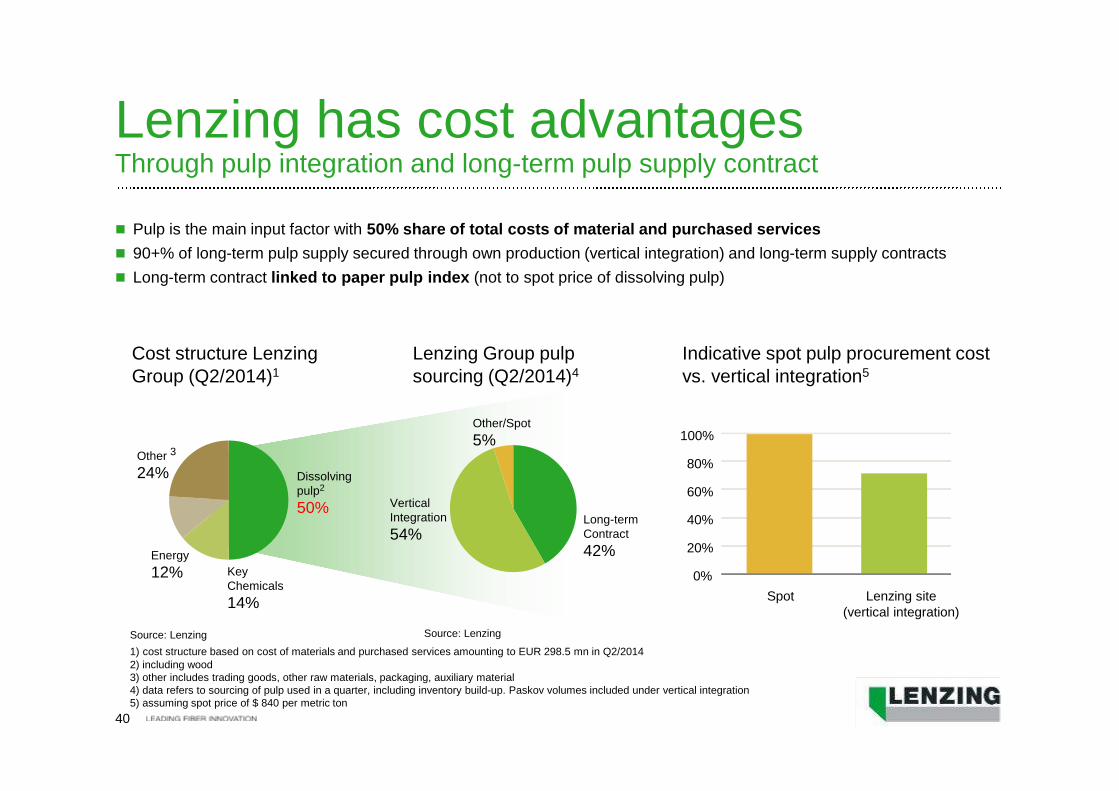
Lenzing has cost advantagesThrough pulp integration and long-term pulp supply contract
Long-termContract
42%
VerticalIntegration
54%
Pulp is the main input factor with 50% share of total costs of material and purchased services
90+% of long-term pulp supply secured through own production (vertical integration) and long-term supply contracts
Long-term contract linked to paper pulp index (not to spot price of dissolving pulp)
Source: Lenzing
Indicative spot pulp procurement costvs. vertical integration5
1) cost structure based on cost of materials and purchased services amounting to EUR 298.5 mn in Q2/20142) including wood3) other includes trading goods, other raw materials, packaging, auxiliary material4) data refers to sourcing of pulp used in a quarter, including inventory build-up. Paskov volumes included under vertical integration5) assuming spot price of $ 840 per metric ton
Source: Lenzing
Cost structure LenzingGroup (Q2/2014)1
Lenzing Group pulpsourcing (Q2/2014)4
Dissolvingpulp2
50%
KeyChemicals
14%
Energy
12%
Other 3
24%
0%
20%
40%
60%
80%
100%
Spot Lenzing site(vertical integration)
Other/Spot
5%
41
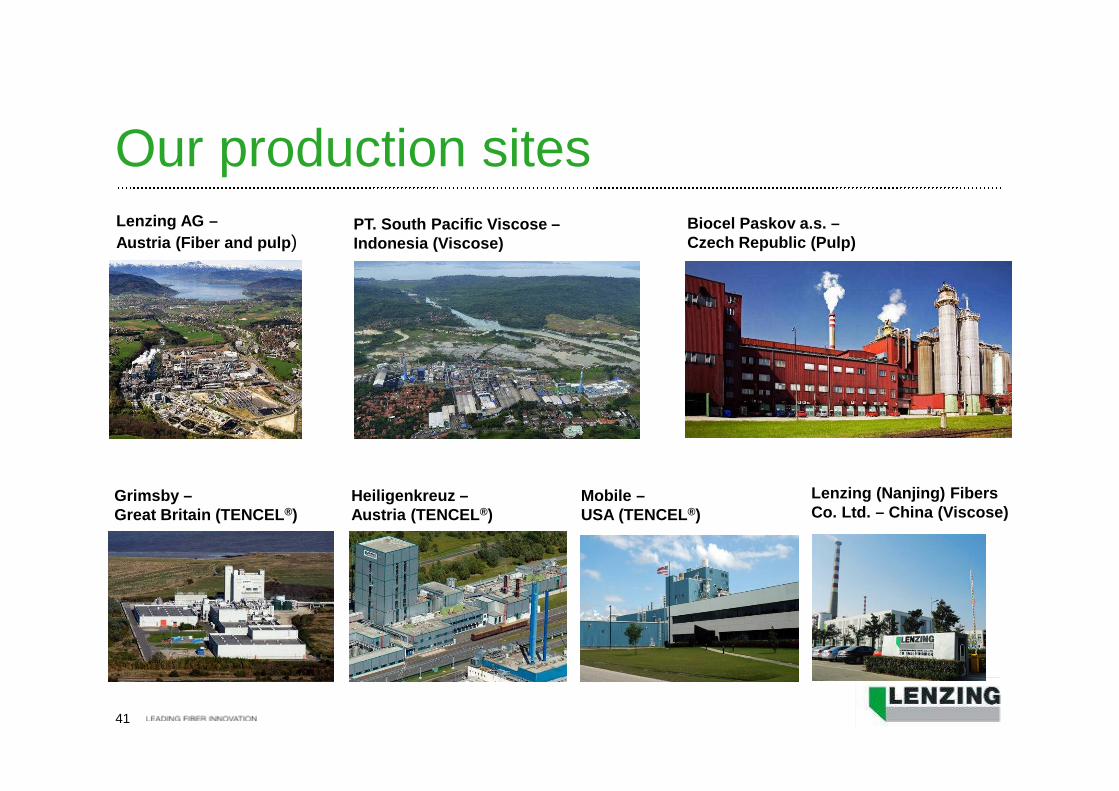
Our production sitesLenzing AG –
Austria (Fiber and pulp)PT. South Pacific Viscose –Indonesia (Viscose)
Lenzing (Nanjing) FibersCo. Ltd. – China (Viscose)
Heiligenkreuz –Austria (TENCEL®)
Mobile –USA (TENCEL®)
Grimsby –Great Britain (TENCEL®)
Biocel Paskov a.s. –Czech Republic (Pulp)
42
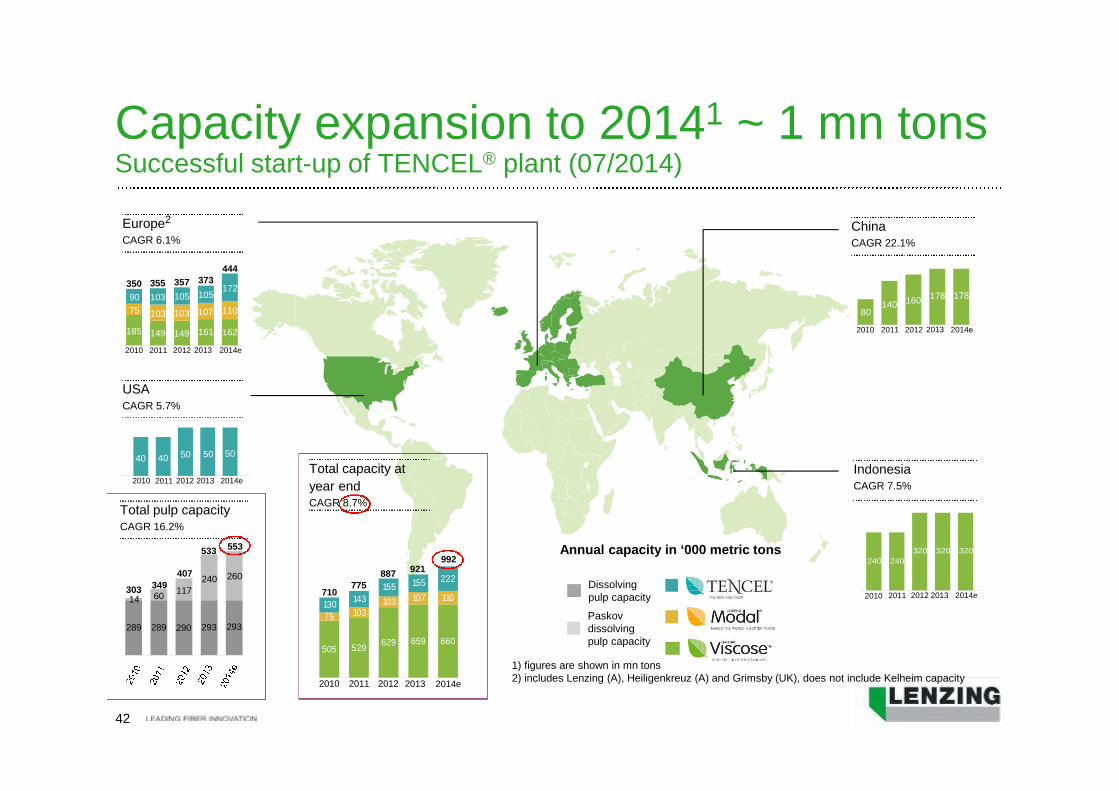
Capacity expansion to 20141 ~ 1 mn tonsSuccessful start-up of TENCEL® plant (07/2014)
Total pulp capacityCAGR 16.2%
ChinaCAGR 22.1%
USACAGR 5.7%
IndonesiaCAGR 7.5%
Europe2
CAGR 6.1%
Total capacity at
year endCAGR 8.7%
Annual capacity in ‘000 metric tons
Dissolvingpulp capacity
Paskovdissolvingpulp capacity
149 162
103 110
103172
355
444
2011 2014e
505 529629 659 660
75 103103 107 110
130143
155 155 222
100
215
775
992
2011 2013 2014e
140178
2011 2014e
240 240
320 320 320
2011 2014e
289 293
60
260349
553
2012 2013
2012 2013
2012 2013
2012
103
161
105 105
107
149
357 373
2011 2014e2012 201350
290
117
407 887 921
178160
40 50 5050
1) figures are shown in mn tons2) includes Lenzing (A), Heiligenkreuz (A) and Grimsby (UK), does not include Kelheim capacity
293
240
533
2010
40
2010
90
75
185
350
2010
80
2010
2010
710
289
14303
43
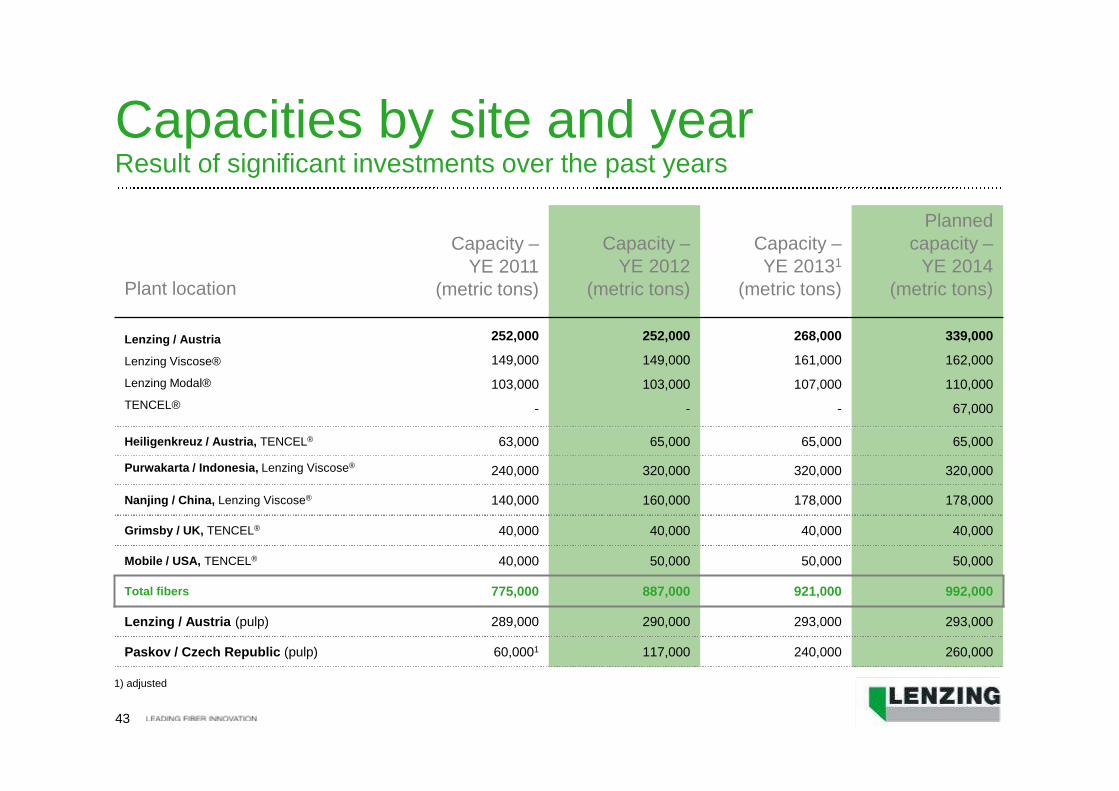
Capacities by site and yearResult of significant investments over the past years
Plant location
Capacity –YE 2011
(metric tons)
Capacity –YE 2012
(metric tons)
Capacity –YE 20131
(metric tons)
Plannedcapacity –
YE 2014(metric tons)
Lenzing / Austria
Lenzing Viscose®
Lenzing Modal®
TENCEL®
252,000
149,000
103,000
-
252,000
149,000
103,000
-
268,000
161,000
107,000
-
339,000
162,000
110,000
67,000
Heiligenkreuz / Austria, TENCEL® 63,000 65,000 65,000 65,000
Purwakarta / Indonesia, Lenzing Viscose®240,000 320,000 320,000 320,000
Nanjing / China, Lenzing Viscose® 140,000 160,000 178,000 178,000
Grimsby / UK, TENCEL® 40,000 40,000 40,000 40,000
Mobile / USA, TENCEL® 40,000 50,000 50,000 50,000
Total fibers 775,000 887,000 921,000 992,000
Lenzing / Austria (pulp) 289,000 290,000 293,000 293,000
Paskov / Czech Republic (pulp) 60,0001 117,000 240,000 260,000
1) adjusted
44
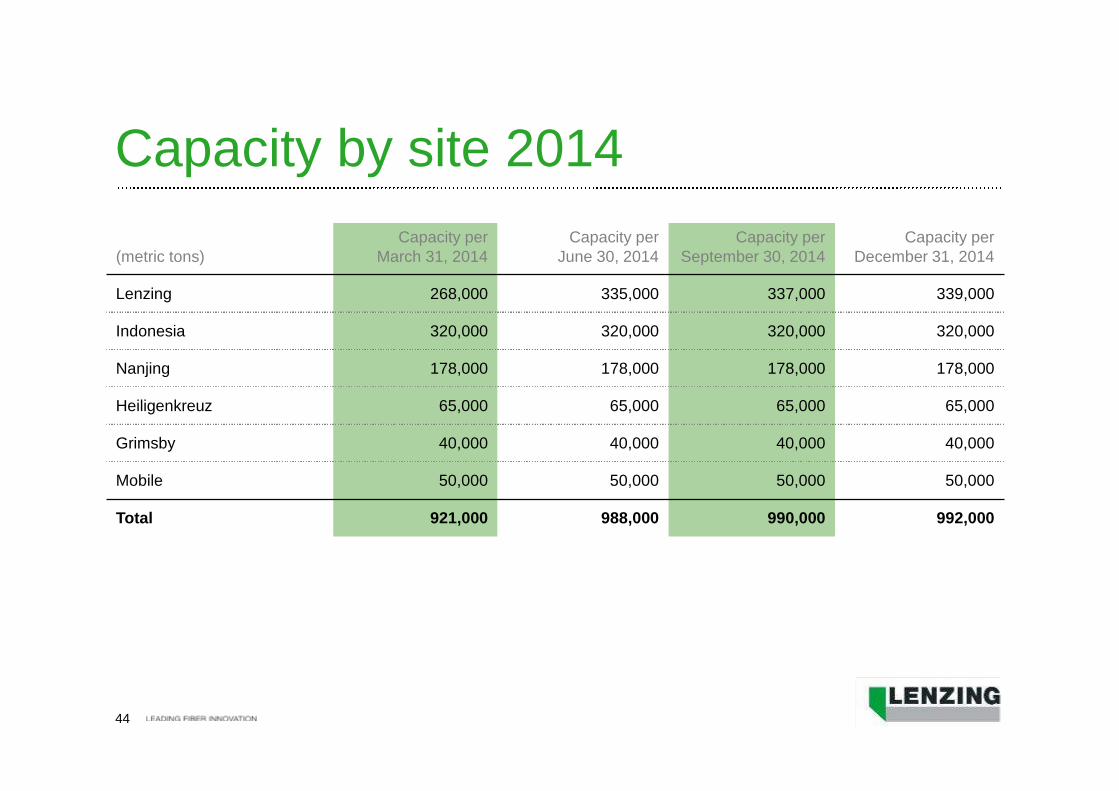
Capacity by site 2014
(metric tons)Capacity per
March 31, 2014Capacity per
June 30, 2014Capacity per
September 30, 2014Capacity per
December 31, 2014
Lenzing 268,000 335,000 337,000 339,000
Indonesia 320,000 320,000 320,000 320,000
Nanjing 178,000 178,000 178,000 178,000
Heiligenkreuz 65,000 65,000 65,000 65,000
Grimsby 40,000 40,000 40,000 40,000
Mobile 50,000 50,000 50,000 50,000
Total 921,000 988,000 990,000 992,000
45
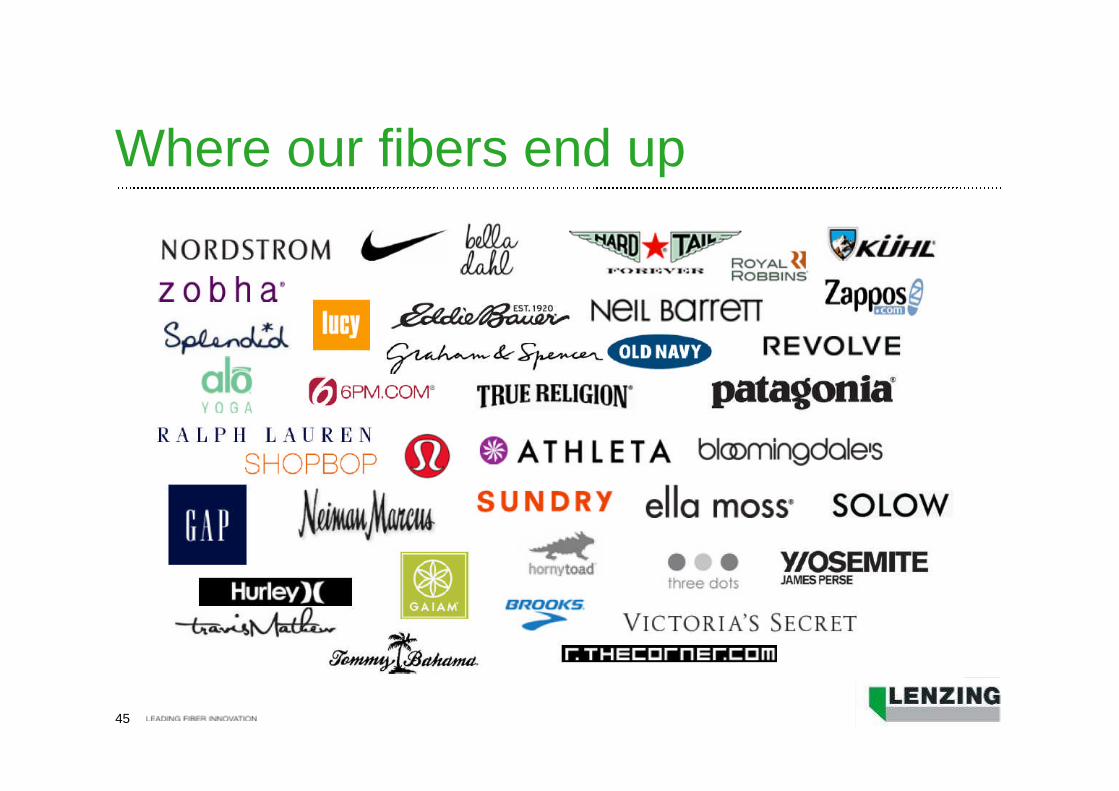
Where our fibers end up
46
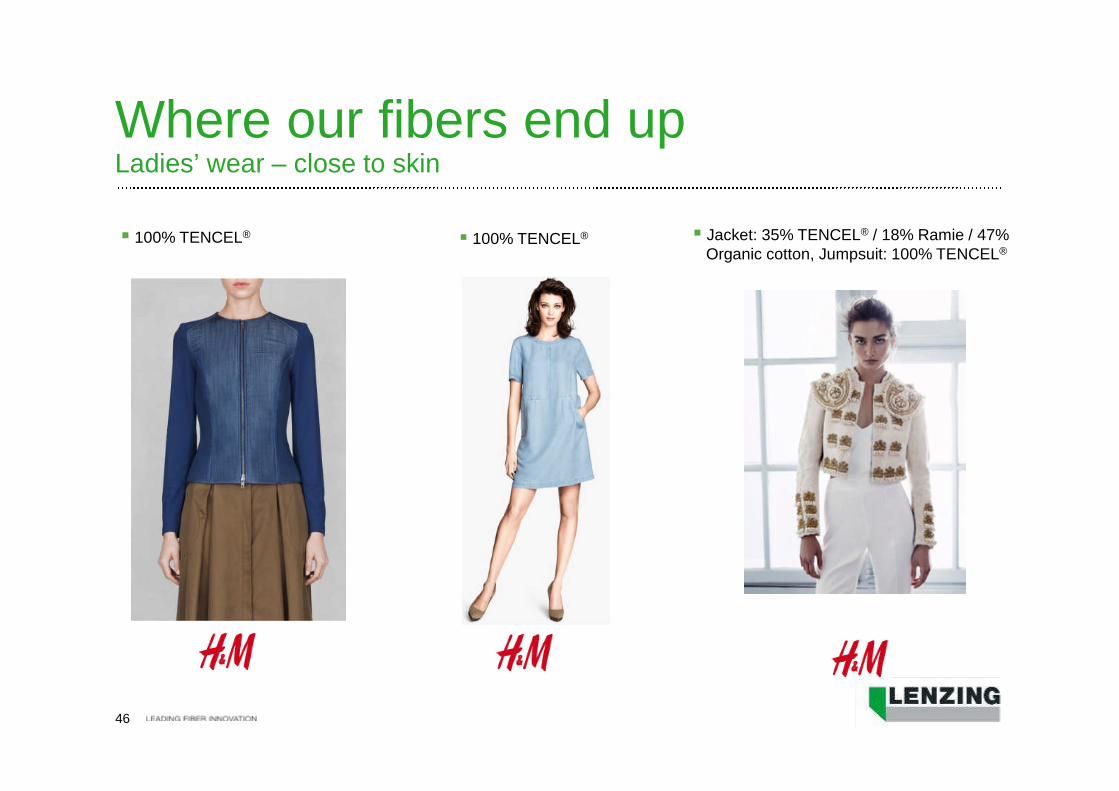
Where our fibers end upLadies’ wear – close to skin
100% TENCEL® Jacket: 35% TENCEL® / 18% Ramie / 47%Organic cotton, Jumpsuit: 100% TENCEL®
100% TENCEL®
47
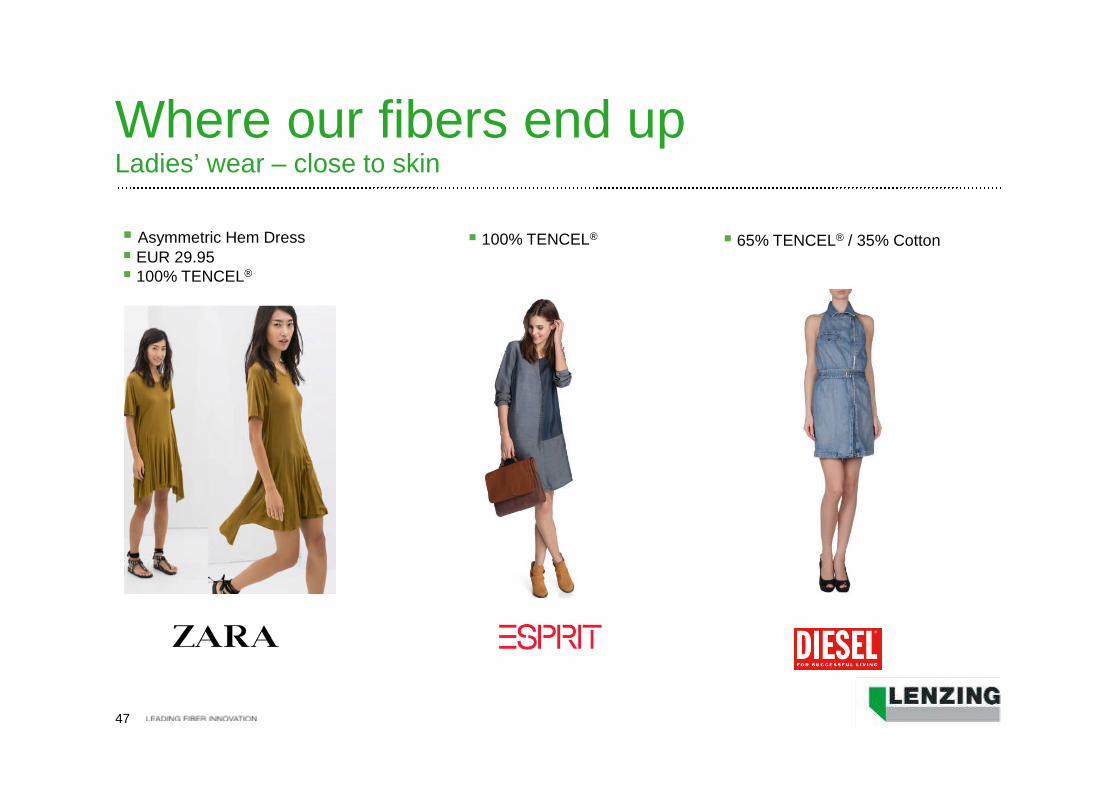
Where our fibers end upLadies’ wear – close to skin
Asymmetric Hem Dress EUR 29.95 100% TENCEL®
100% TENCEL® 65% TENCEL® / 35% Cotton
48
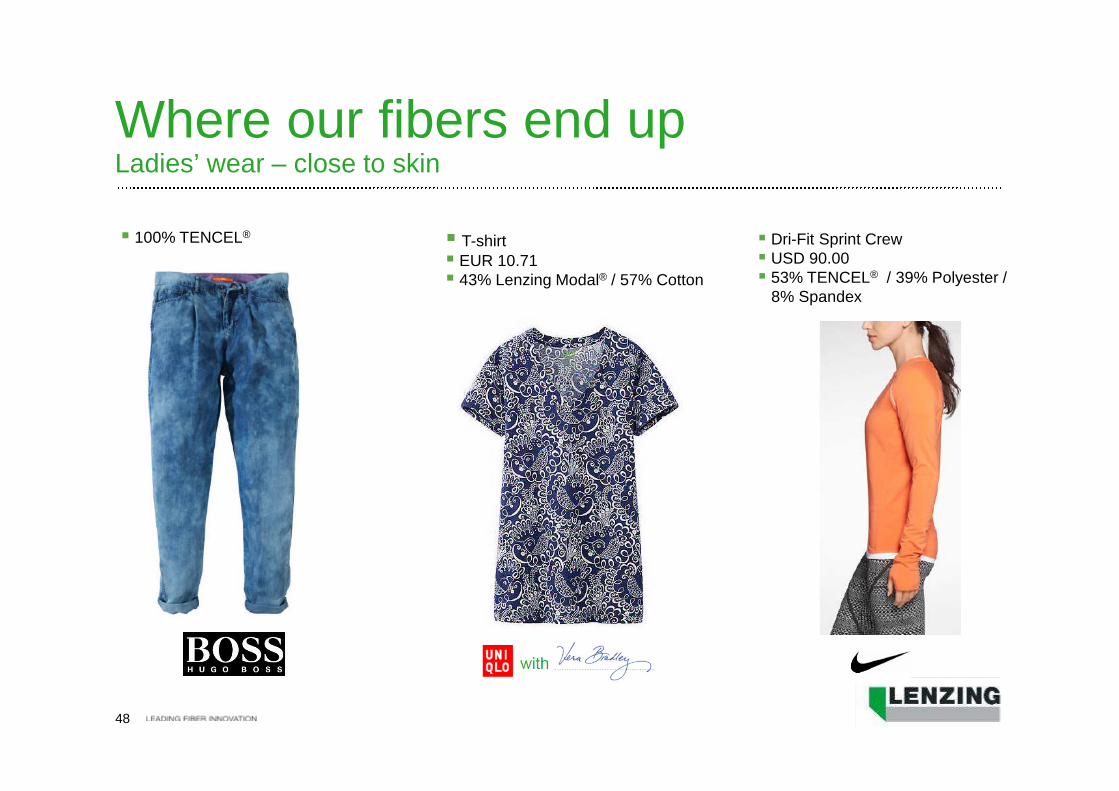
Where our fibers end upLadies’ wear – close to skin
Dri-Fit Sprint Crew USD 90.00 53% TENCEL® / 39% Polyester /
8% Spandex
T-shirt EUR 10.71 43% Lenzing Modal® / 57% Cotton
100% TENCEL®
49
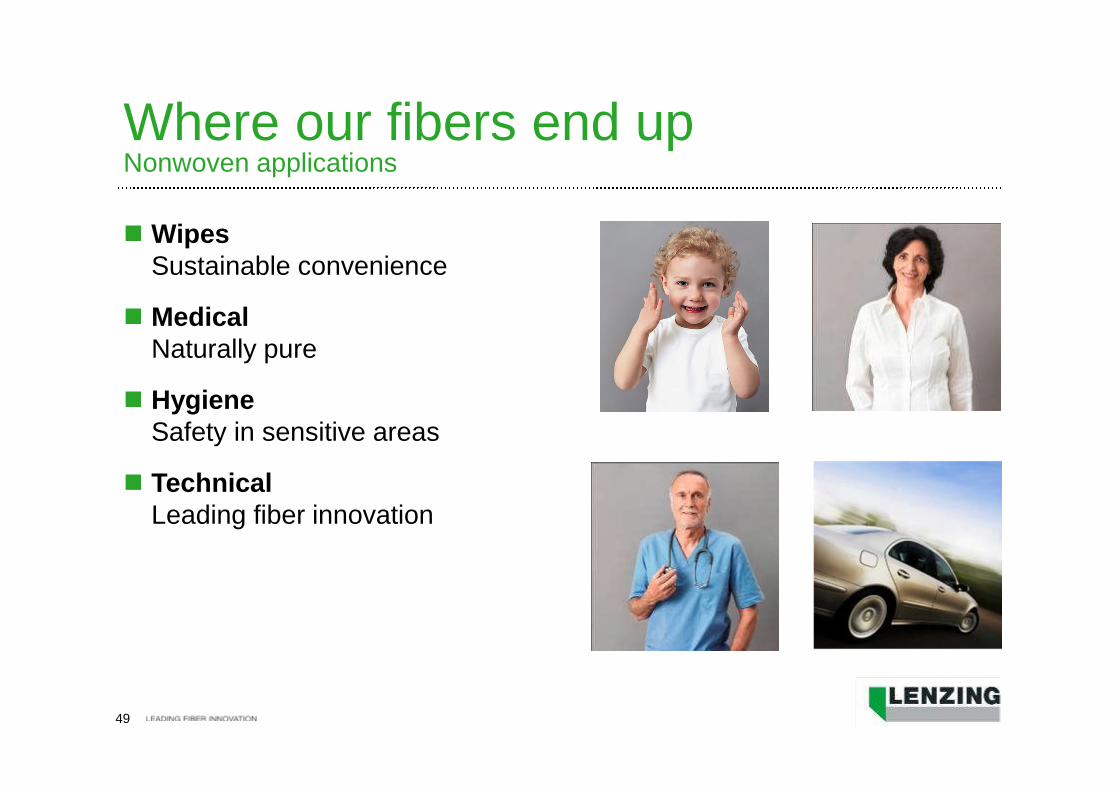
Where our fibers end upNonwoven applications
WipesSustainable convenience
MedicalNaturally pure
HygieneSafety in sensitive areas
TechnicalLeading fiber innovation
50
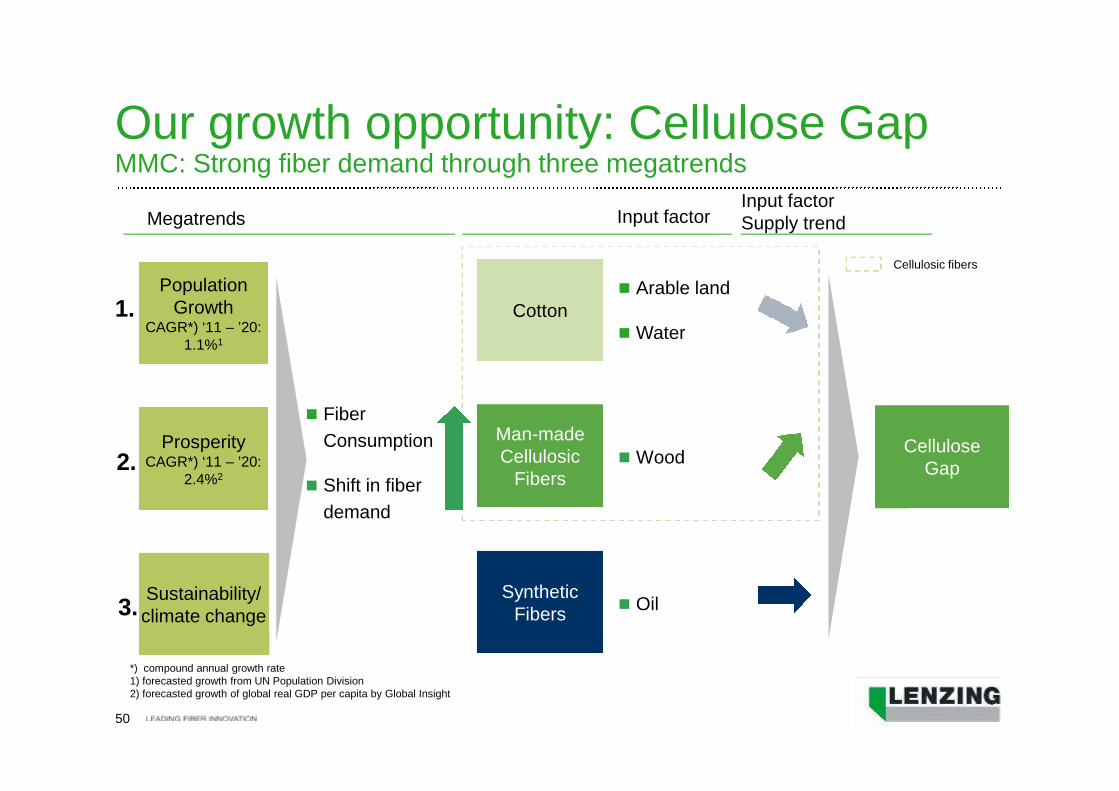
Our growth opportunity: Cellulose GapMMC: Strong fiber demand through three megatrends
PopulationGrowth
CAGR*) ‘11 – ’20:1.1%1
ProsperityCAGR*) ‘11 – ’20:
2.4%2
Sustainability/climate change
Cotton
Man-madeCellulosic
Fibers
SyntheticFibers
CelluloseGap
Fiber
Consumption
Shift in fiber
demand
Megatrends Input factorInput factorSupply trend
Arable land
Water
Wood
Oil
Cellulosic fibers
*) compound annual growth rate1) forecasted growth from UN Population Division2) forecasted growth of global real GDP per capita by Global Insight
1.
2.
3.
51
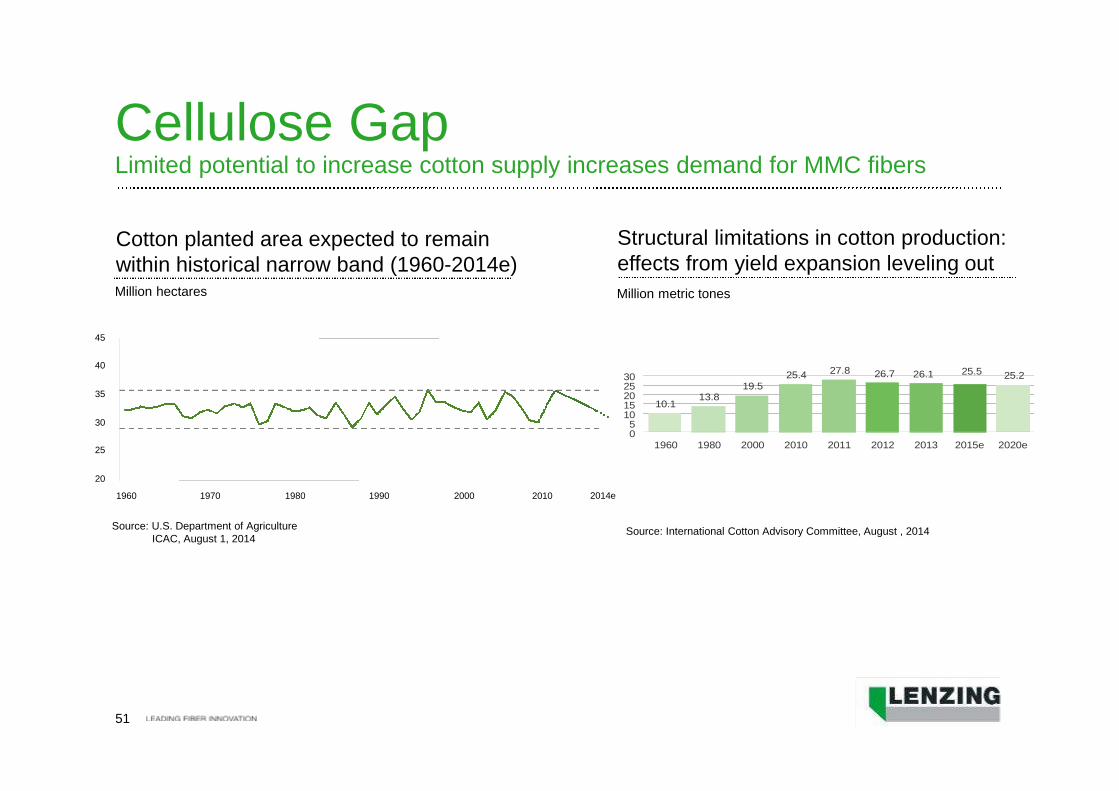
Source: International Cotton Advisory Committee, August , 2014
Million metric tones
Structural limitations in cotton production:effects from yield expansion leveling out
Cellulose GapLimited potential to increase cotton supply increases demand for MMC fibers
Cotton planted area expected to remainwithin historical narrow band (1960-2014e)Million hectares
Source: U.S. Department of AgricultureICAC, August 1, 2014
20
25
30
35
40
45
1960 1970 1980 1990 2000 2014e2010
10.113.8
19.525.4 27.8 26.7 26.1 25.5 25.2
05
1015202530
1960 1980 2000 2010 2011 2012 2013 2015e 2020e
52
0
20
40
60
80
100
120
1960 1980 2000 2005 2010 2015e 2020e
Million metric tons
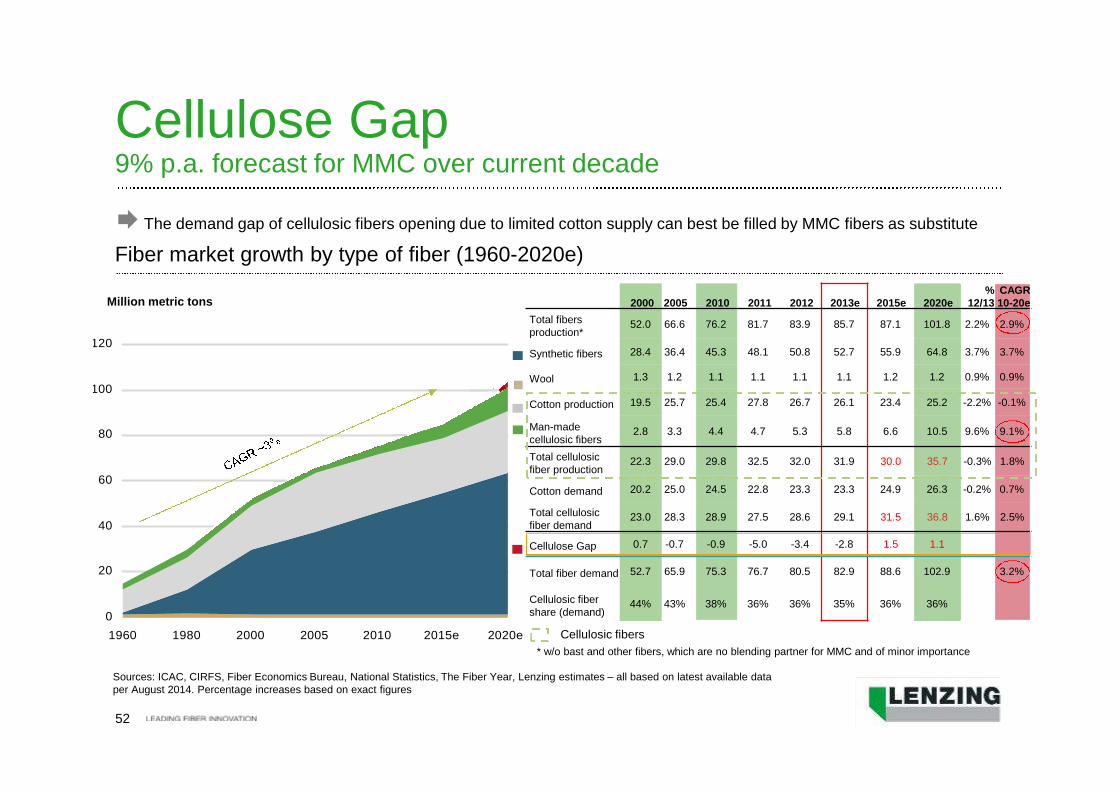
Cellulose Gap9% p.a. forecast for MMC over current decade
The demand gap of cellulosic fibers opening due to limited cotton supply can best be filled by MMC fibers as substitute
Fiber market growth by type of fiber (1960-2020e)
Cellulosic fibers
2000 2005 2010 2011 2012 2013e 2015e 2020e%
12/13CAGR10-20e
Total fibersproduction*
52.0 66.6 76.2 81.7 83.9 85.7 87.1 101.8 2.2% 2.9%
Synthetic fibers 28.4 36.4 45.3 48.1 50.8 52.7 55.9 64.8 3.7% 3.7%
Wool 1.3 1.2 1.1 1.1 1.1 1.1 1.2 1.2 0.9% 0.9%
Cotton production 19.5 25.7 25.4 27.8 26.7 26.1 23.4 25.2 -2.2% -0.1%
Man-madecellulosic fibers
2.8 3.3 4.4 4.7 5.3 5.8 6.6 10.5 9.6% 9.1%
Total cellulosicfiber production
22.3 29.0 29.8 32.5 32.0 31.9 30.0 35.7 -0.3% 1.8%
Cotton demand 20.2 25.0 24.5 22.8 23.3 23.3 24.9 26.3 -0.2% 0.7%
Total cellulosicfiber demand
23.0 28.3 28.9 27.5 28.6 29.1 31.5 36.8 1.6% 2.5%
Cellulose Gap 0.7 -0.7 -0.9 -5.0 -3.4 -2.8 1.5 1.1
Total fiber demand 52.7 65.9 75.3 76.7 80.5 82.9 88.6 102.9 3.2%
Cellulosic fibershare (demand)
44% 43% 38% 36% 36% 35% 36% 36%
Sources: ICAC, CIRFS, Fiber Economics Bureau, National Statistics, The Fiber Year, Lenzing estimates – all based on latest available dataper August 2014. Percentage increases based on exact figures
* w/o bast and other fibers, which are no blending partner for MMC and of minor importance
53
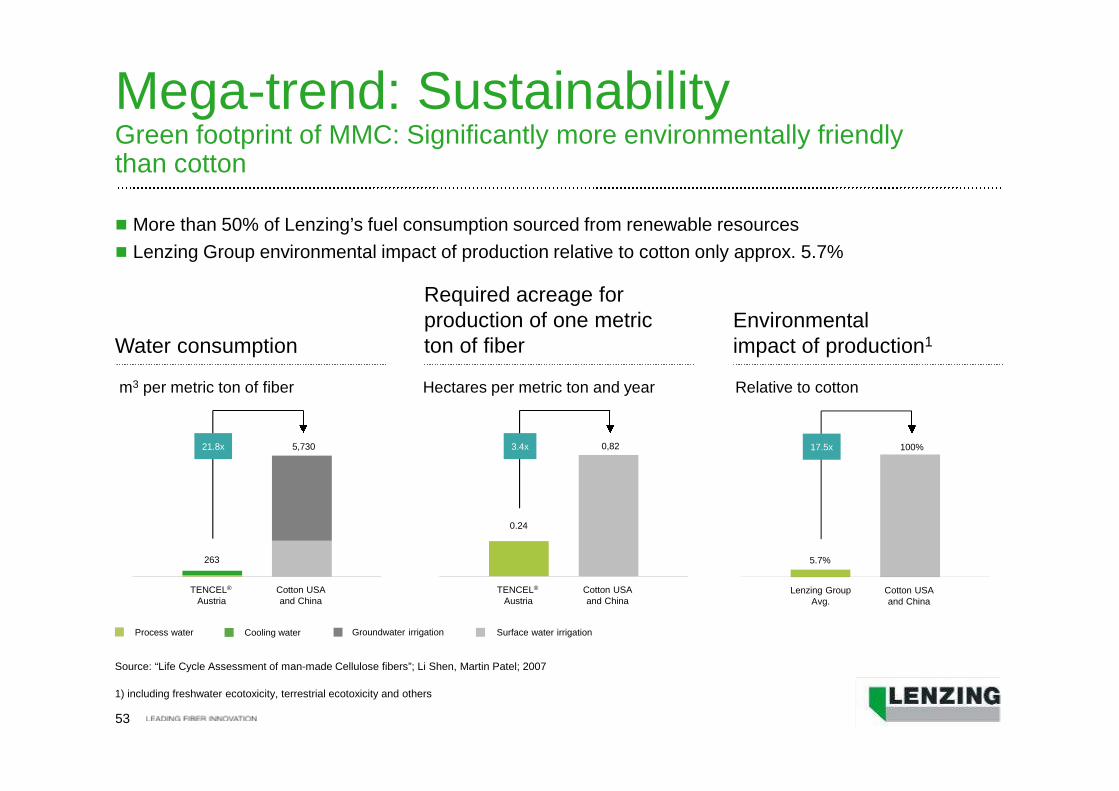
Mega-trend: SustainabilityGreen footprint of MMC: Significantly more environmentally friendlythan cotton
Process water Cooling water Surface water irrigationGroundwater irrigation
TENCEL®
AustriaCotton USAand China
263
21.8x 5,730
Water consumption
Required acreage forproduction of one metricton of fiber
Environmentalimpact of production1
m3 per metric ton of fiber Hectares per metric ton and year Relative to cotton
TENCEL®
AustriaCotton USAand China
0.24
3.4x 0,82
Lenzing GroupAvg.
Cotton USAand China
5.7%
17.5x 100%
Source: “Life Cycle Assessment of man-made Cellulose fibers”; Li Shen, Martin Patel; 2007
1) including freshwater ecotoxicity, terrestrial ecotoxicity and others
More than 50% of Lenzing’s fuel consumption sourced from renewable resources
Lenzing Group environmental impact of production relative to cotton only approx. 5.7%
54
Oberbank AG
5.0%
Free float
27.4%
B&C
Privatstiftung
67.6%
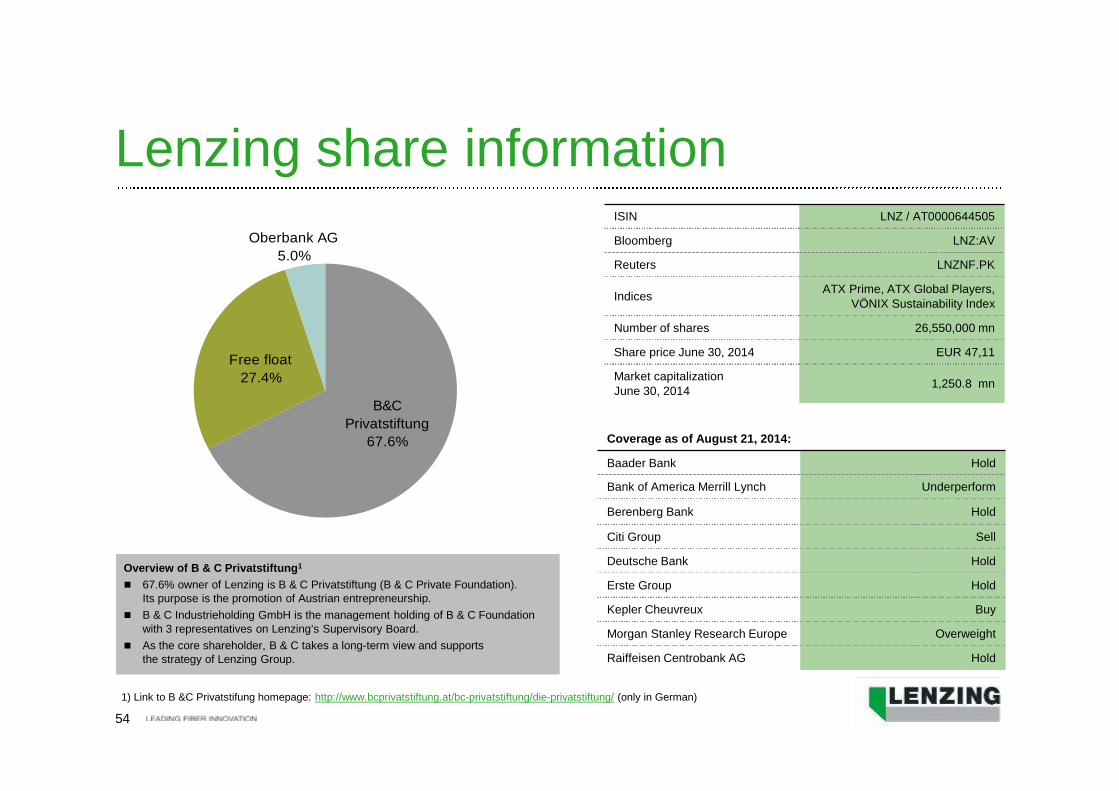
Lenzing share information
Overview of B & C Privatstiftung1
67.6% owner of Lenzing is B & C Privatstiftung (B & C Private Foundation).Its purpose is the promotion of Austrian entrepreneurship.
B & C Industrieholding GmbH is the management holding of B & C Foundationwith 3 representatives on Lenzing’s Supervisory Board.
As the core shareholder, B & C takes a long-term view and supportsthe strategy of Lenzing Group.
1) Link to B &C Privatstifung homepage: http://www.bcprivatstiftung.at/bc-privatstiftung/die-privatstiftung/ (only in German)
ISIN LNZ / AT0000644505
Bloomberg LNZ:AV
Reuters LNZNF.PK
IndicesATX Prime, ATX Global Players,
VÖNIX Sustainability Index
Number of shares 26,550,000 mn
Share price June 30, 2014 EUR 47,11
Market capitalizationJune 30, 2014
1,250.8 mn
Coverage as of August 21, 2014:
Baader Bank Hold
Bank of America Merrill Lynch Underperform
Berenberg Bank Hold
Citi Group Sell
Deutsche Bank Hold
Erste Group Hold
Kepler Cheuvreux Buy
Morgan Stanley Research Europe Overweight
Raiffeisen Centrobank AG Hold
Back-up
56
0
20
40
60
80
100
120
140
160
180
0
10
20
30
40
50
60
70
80
90
100
196
6/1
967
196
7/1
968
196
8/1
969
196
9/1
970
197
0/1
971
197
1/1
972
197
2/1
973
197
3/1
974
197
4/1
975
197
5/1
976
197
6/1
977
197
7/1
978
197
8/1
979
197
9/1
980
198
0/1
981
198
1/1
982
198
2/1
983
198
3/1
984
198
4/1
985
198
5/1
986
198
6/1
987
198
7/1
988
198
8/1
989
198
9/1
990
199
0/1
991
199
1/1
992
199
2/1
993
199
3/1
994
199
4/1
995
199
5/1
996
199
6/1
997
199
7/1
998
199
8/1
999
199
9/2
000
200
0/2
001
200
1/2
002
200
2/2
003
200
3/2
004
200
4/2
005
200
5/2
006
200
6/2
007
200
7/2
008
200
8/2
009
200
9/2
010
201
0/2
011
201
1/2
012
201
2/2
013
201
3/2
014
201
4/2
015
Stock-to-use ratio (%) Cotlook A-Index
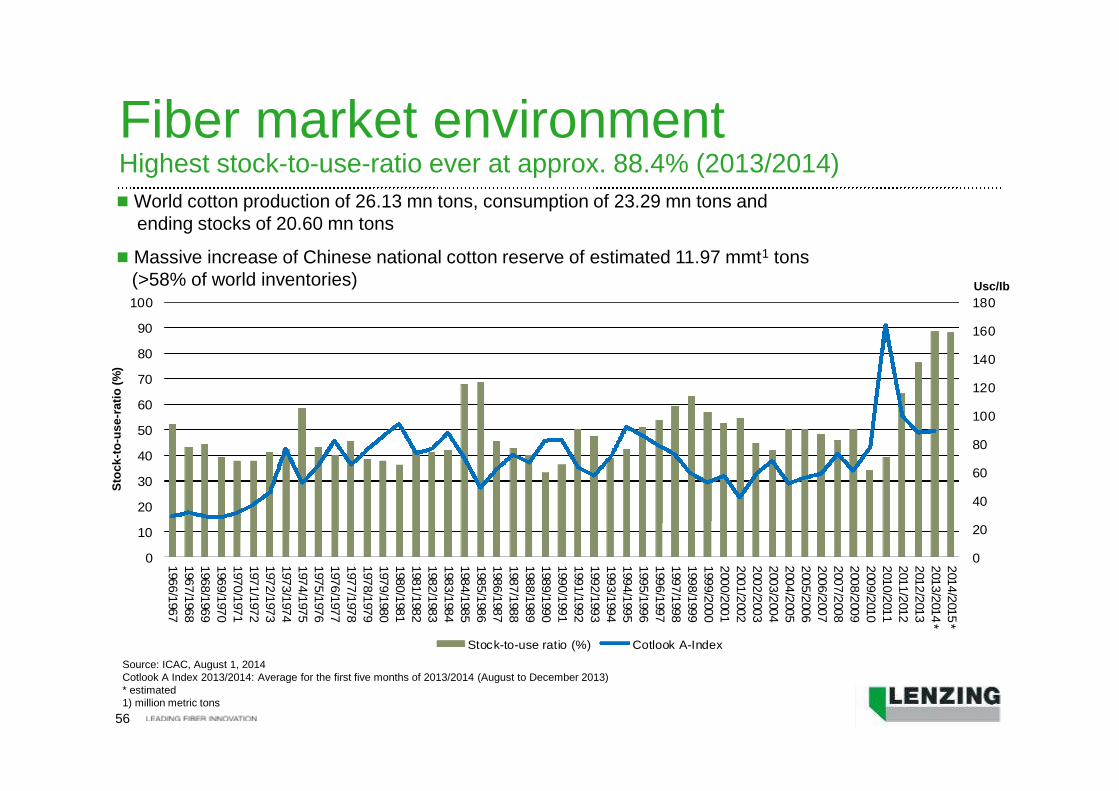
World cotton production of 26.13 mn tons, consumption of 23.29 mn tons andending stocks of 20.60 mn tons
Massive increase of Chinese national cotton reserve of estimated 11.97 mmt1 tons(>58% of world inventories)
Source: ICAC, August 1, 2014Cotlook A Index 2013/2014: Average for the first five months of 2013/2014 (August to December 2013)* estimated1) million metric tons
Usc/Ib
Sto
ck
-to
-us
e-r
ati
o(%
)
**
Fiber market environmentHighest stock-to-use-ratio ever at approx. 88.4% (2013/2014)
57
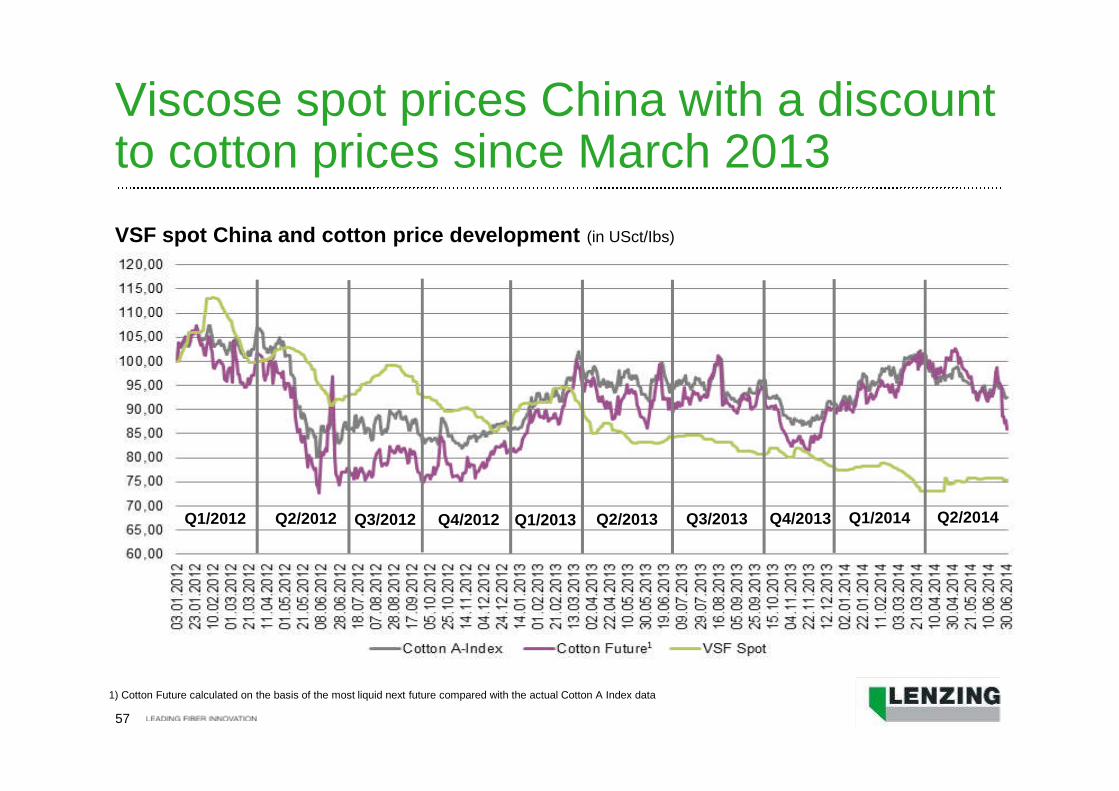
VSF spot China and cotton price development (in USct/Ibs)
Viscose spot prices China with a discountto cotton prices since March 2013
1) Cotton Future calculated on the basis of the most liquid next future compared with the actual Cotton A Index data
Q2/2012Q1/2012 Q3/2012 Q4/2012 Q1/2013 Q3/2013
1
Q2/2013 Q4/2013 Q1/2014 Q2/2014
58
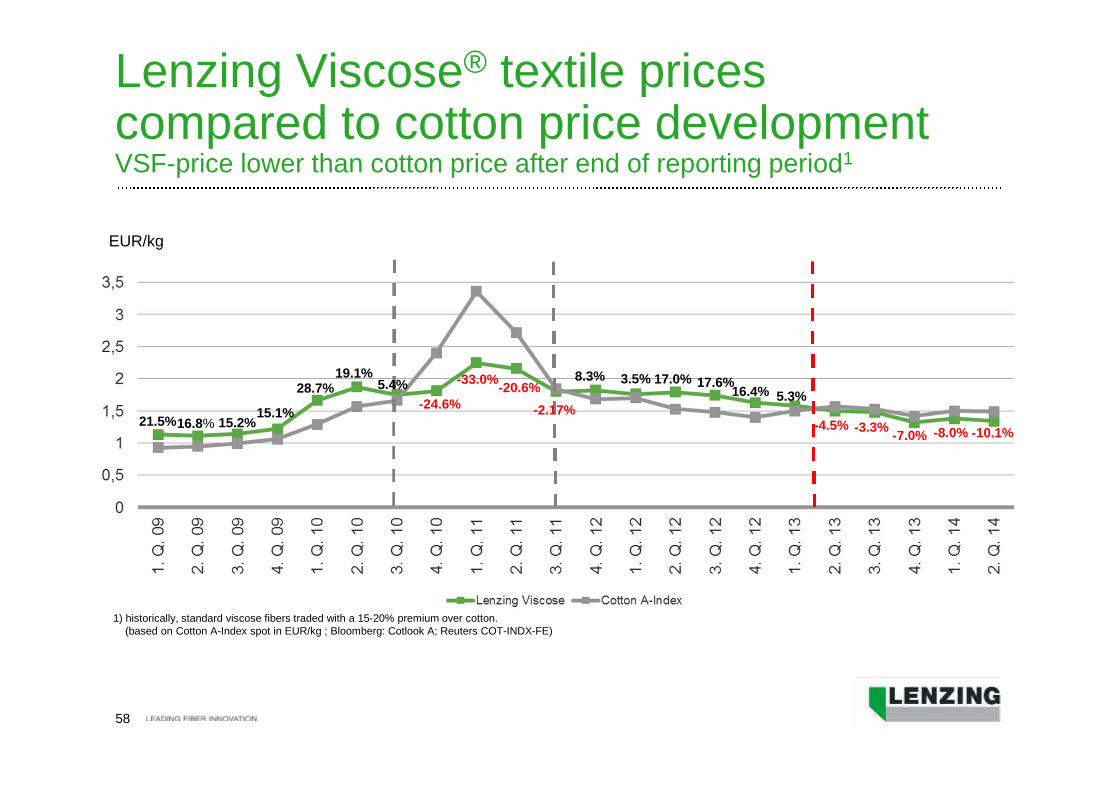
Lenzing Viscose® textile pricescompared to cotton price developmentVSF-price lower than cotton price after end of reporting period1
1) historically, standard viscose fibers traded with a 15-20% premium over cotton.(based on Cotton A-Index spot in EUR/kg ; Bloomberg: Cotlook A; Reuters COT-INDX-FE)
-24.6%
-33.0%-20.6%
21.5%16.8% 15.2%15.1%
28.7%19.1% 8.3% 3.5% 17.0%
EUR/kg
17.6%16.4% 5.3%
-4.5% -3.3%
-2.17%
5.4%
-7.0% -8.0% -10.1%

59
Contacts and financial calendar
Investor Relations contact
Stephanie KniepHead of Investor Relations
Phone: +43 7672 701 4032
Fax: +43 7672 918 4032
E-Mail: [email protected]
Visit our IR website:
http://www.lenzing.com/en/concern/investor-center.html
Visit our sustainability site:http://www.lenzing.com/en/concern/lenzing-group/sustainability.html
Financial calendar 2014
Full year results March 21, 2014
70th Annual General Meeting April 28, 2014
Results 1st quarter May 15, 2014
Half year results August 21, 2014
Results 3rd quarter November 13, 2014
Financial calendar