leading age spring conference may 15, 2014 casper, wy by: tammy martin
TRANSCRIPT

LEADING AGE SPRING CONFERENCE
MAY 15, 2014CASPER, WYBY: TAMMY MARTIN

Tammy Martin, Member
Myers and Stauffer LC
800.336.7721
CONTACT INFORMATION

DISCUSSIONS FOR TODAY
1. SEA 82 Goals & Workgroup Process
2. Current rate structure
3. Alternative rate options
4. Group decision!
5. General modeling assumptions
6. Cost categories
7. Cost data sources & periods used
8. Case Mix Indexes
9. Provider tips
10. Models

1. SEA 82 (2013 SESSION) – GOALS & WORKGROUP PROCESS

SENATE FILE 60 GOALS FOR NF RATES
Section 1(a)(ii)
• Redesign of nursing facility reimbursement to reflect:
1. Patient acuity – Done through case mix
2. % of Medicaid occupancy – Needs consideration
3. Regional economic factors – Discussions about equalizing rates between rural hospital-based & freestanding NFs

WORK GROUP MAKEUP
• State Medicaid
• House of Representatives
• Small, med & large provider organizations
• Hospital-based and freestanding NF providers
• NF Associations (LeadingAge & WHCA)
• Clinical & financial people
• Myers and Stauffer

WORK GROUP MEMBERS
Name Organization Name OrganizationBaillie Dockter Castle Rock Hospital District Lauri McClain Sublette CenterJoe Rude Douglas Care Center James Bush WDHChris Szymanski Green House Living for Sheridan Jesse Springer WDHCassidy Higgins Ivinson Memorial Hospital Lee Grossman WDHChris Hansen Kindred Health Care Lindsay Schilling WDHSteve Bahmer Leading Age Wyoming Renee Propps WDHPaul Landry Life Care Center of Casper Teri Green WDHShinichi Katsumoto Myers and Stauffer Pat McConnell West Park HospitalTammy Martin Myers and Stauffer Joann Farnsworth Weston CountyNancy Bunot Rocky Mountain Care Dee Cozzens Worland HC & RehabTed Sleight Rocky Mountain Care Carolyn Paseneaux WHCAEric Boley South Lincoln Medical Center Rep. Lloyd Larsen Wyoming LegislatureAmy Johnson Star Valley Medical Center

WORK GROUP PROCESSES• 1 – 2 conference calls / month – Oct to current
• Defined pros and cons of different reimbursement methods
• Selected cost center classifications for each cost category on a cost report
• Decided which cost centers should be acuity or case mix adjusted
• 3/18/14 – Met in person for an all day session of rate modeling

2. CURRENT RATE STRUCTURE

CURRENT NF RATE STRUCTURE
• Rates frozen at rates in effect on 10/01/09.
• Upper payment limit (UPL) program to supplement reimbursement losses.

• 10/1/09 rates
• Based on 2008 audited cost report
• Cost categorized into 3 pools:
Property
Operating
Healthcare
CURRENT RATE STRUCTURE – CONT.

PROPERTY – CURRENT SYSTEM
Reimbursement
• Lesser of audited cost or property cap
• Cap – published rate per licensed bed
Provider challenge (workgroup opportunity)
• Cost is limited to historical cost (federal & state rule)
Original owner cost + cost of improvements made by new owner(s)
• 10/1/12 Proforma rates (25% limited to cap)

OPERATING – CURRENT SYSTEM
Reimbursement
• Lesser of audited cost or cap
• Cap = 105% of median facility rate
Provider challenge (workgroup opportunity)
• 10/1/12 Proforma Rate Analysis
• 58% Limited to the cap

HEALTHCARE COST – CURRENT SYSTEM
Reimbursement
• Lesser of audited cost or cap
• Cap = 125% of median facility rate
Provider challenge (workgroup opportunity)
• 10/1/12 Proforma Rate Analysis
• 31% Limited to the cap

MIN / MAX & PRIVATE PAY LIMITATIONS1. Sum of allowed property, operating, and
healthcare (after subjecting to each cap)
2. Compared to: Min / Max (rate in effect at last base period (7/1/06) inflated to current rate year.
3. Allowed = Lesser of 1 or 2 is allowed
4. Lesser of Step 3 result or private pay rate
= ALLOWED RATE
Min / Max -Eliminated in modeling

3. ALTERNATIVE RATE OPTIONS

BIG PICTURE IDEAS
Cost based
Price based –selected
Acuity based (case mix) – selected
Corridor Approach

COST BASED SYSTEM
•Uses annual cost report as starting point for ratesConcept
•Rate paid to each facility is tied to their actual cost•More equitable to each provider
Pros
•Difficult for state to control spending but can be controlled with a budgetCons

PRICE BASED SYSTEM
•Fixed price set by state budget•Same price paid to ALL providers, regardless of cost
Concept
•Provider incentive to keep costs low•State control over spendingPros
•No relationship of cost to payment•Some overpaid / some underpaid (possibly by large margins)
Cons

ACUITY BASED (CASE MIX)
1. Pays based on acuity level of residents, rather than straight cost divided by days.
2. Acuity is measured using the Minimum Data Set (MDS) providers are already required to submit to CMS
3. Rate is adjusted up or down to match acuity level of Medicaid residents as measured at a point in time.

ACUITY BASED – CONT.
7. Rate change timing:
monthly
quarterly – Selected by group
semi-annually
annually
etc.
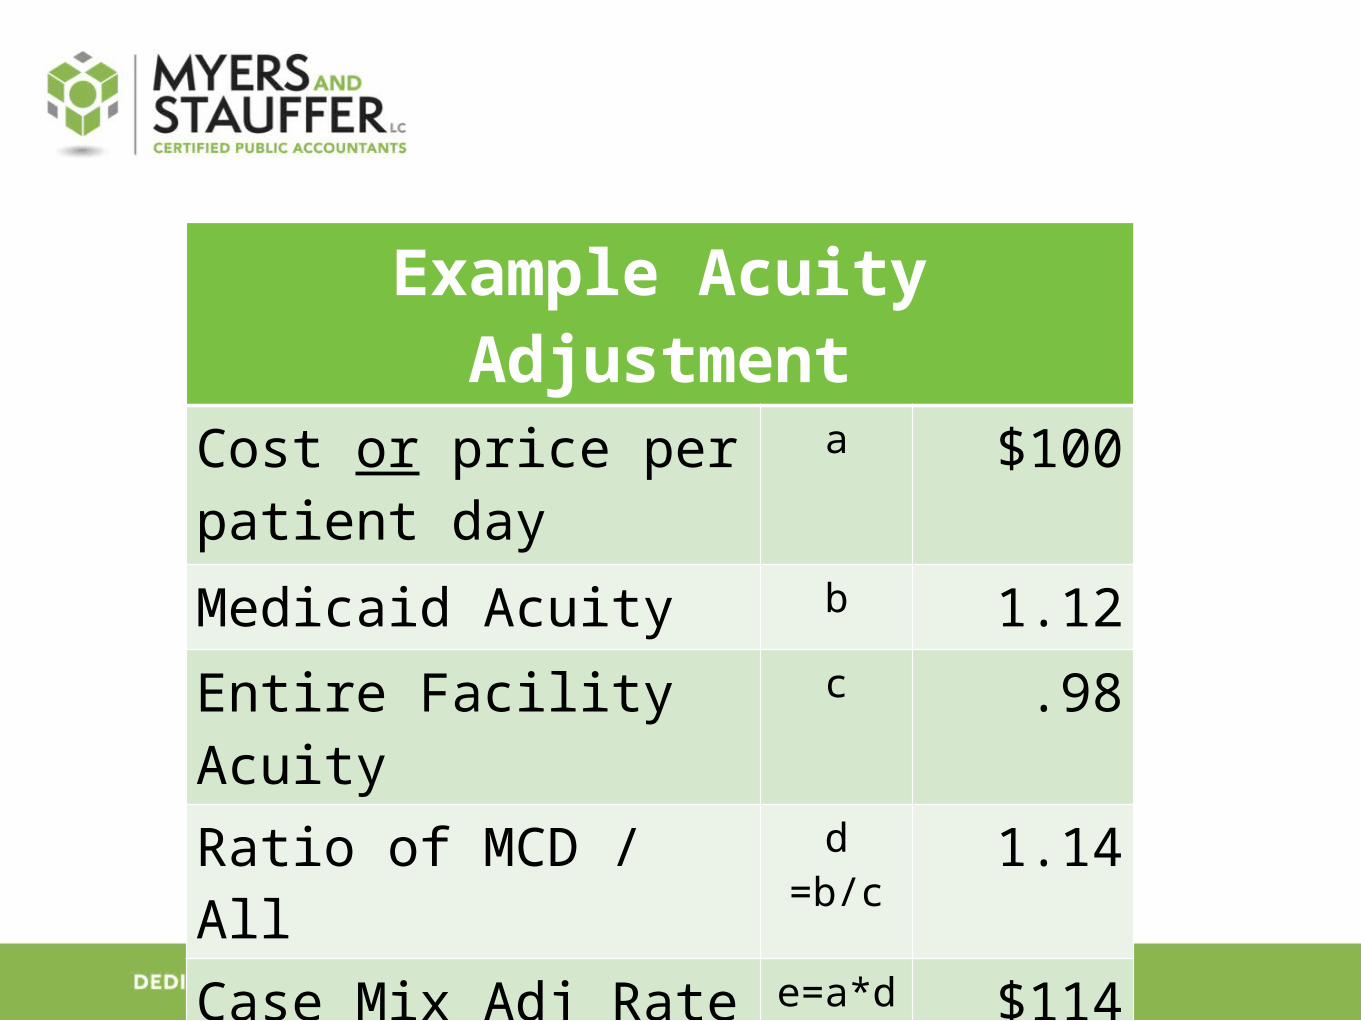
Example Acuity Adjustment
Cost or price per patient day
a $100
Medicaid Acuity b 1.12
Entire Facility Acuity c .98
Ratio of MCD / All d =b/c 1.14
Case Mix Adj Rate e=a*d $114

ACUITY SYSTEMS – CONT.
Pros •Pays based on resources used for Medicaid population (acuity), not just cost•Providers with heavy care patients (i.e.: vents) paid a higher rate and vice versa•Could potentially eliminate extraordinary care rates
Cons •Can cause large rate swings for providers if material census changes•Difficult for state to control spending (can be controlled with beginning budgets)•Obesity and “behaviors” not reflected in acuity scores

CORRIDOR APPROACH
• Includes both cost and price based features
Cost Center Example
Capital Price
Operating Price
Healthcare Cost with acuity adjustment

PROPERTY OPTIONS
Method Description Pro Con
Cost Pays provider actual audited cost
Medicaid only pays for building once
Limited to orig owner cost + improvements
Building Age –Selected by group
Pay a fixed “price” based on age of the building. Younger age = higher rate
-Predictable-No limit to orig cost-Pays more current market rates-Remodels may re-age the building to make younger and pay more
-State paying for building into perpetuity-Current lease market rates may be higher than rate.
Appraisal Hire appraiser and pay based on value
Pays market value Expensive for state to implementTimely to get started

4. GROUP DECISION
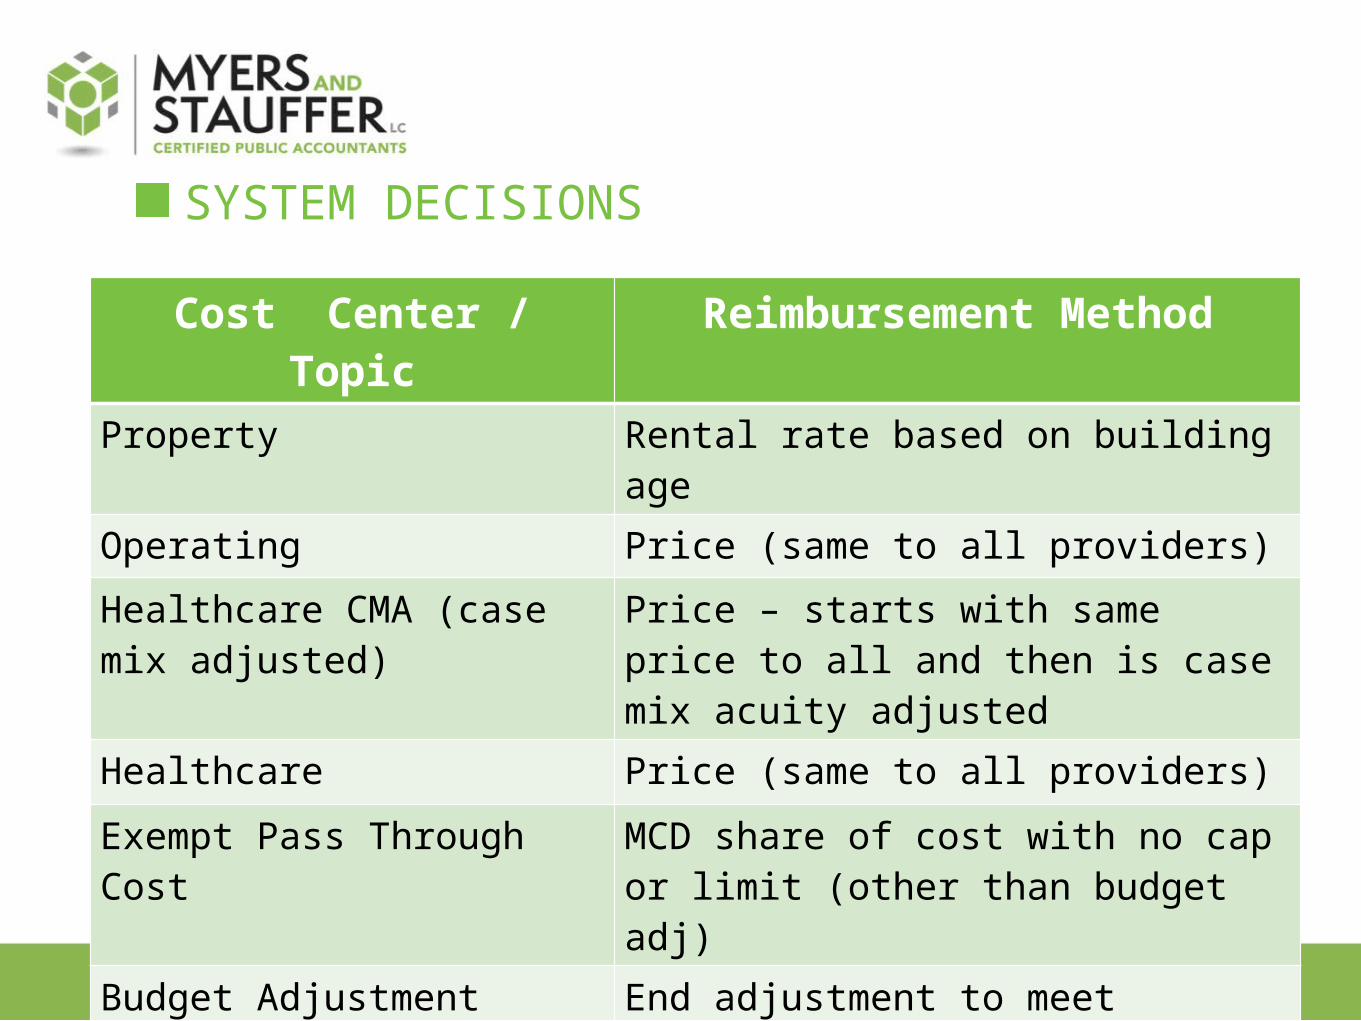
SYSTEM DECISIONS
Cost Center / Topic Reimbursement Method
Property Rental rate based on building age
Operating Price (same to all providers)
Healthcare CMA (case mix adjusted)
Price – starts with same price to all and then is case mix acuity adjusted
Healthcare Price (same to all providers)
Exempt Pass Through Cost MCD share of cost with no cap or limit (other than budget adj)
Budget Adjustment End adjustment to meet legislative funding
Frequency of Rate Adj Quarterly

5. GENERAL MODELING ASSUMPTIONS

LIMITS & PRICES
• All limits, caps, prices, were entirely developed by M&S.
• State provided no guidance or thresholds.
• Many times they were literally a “guess”.
• Considered as a “starting point” for modeling and not the “law of the land.”
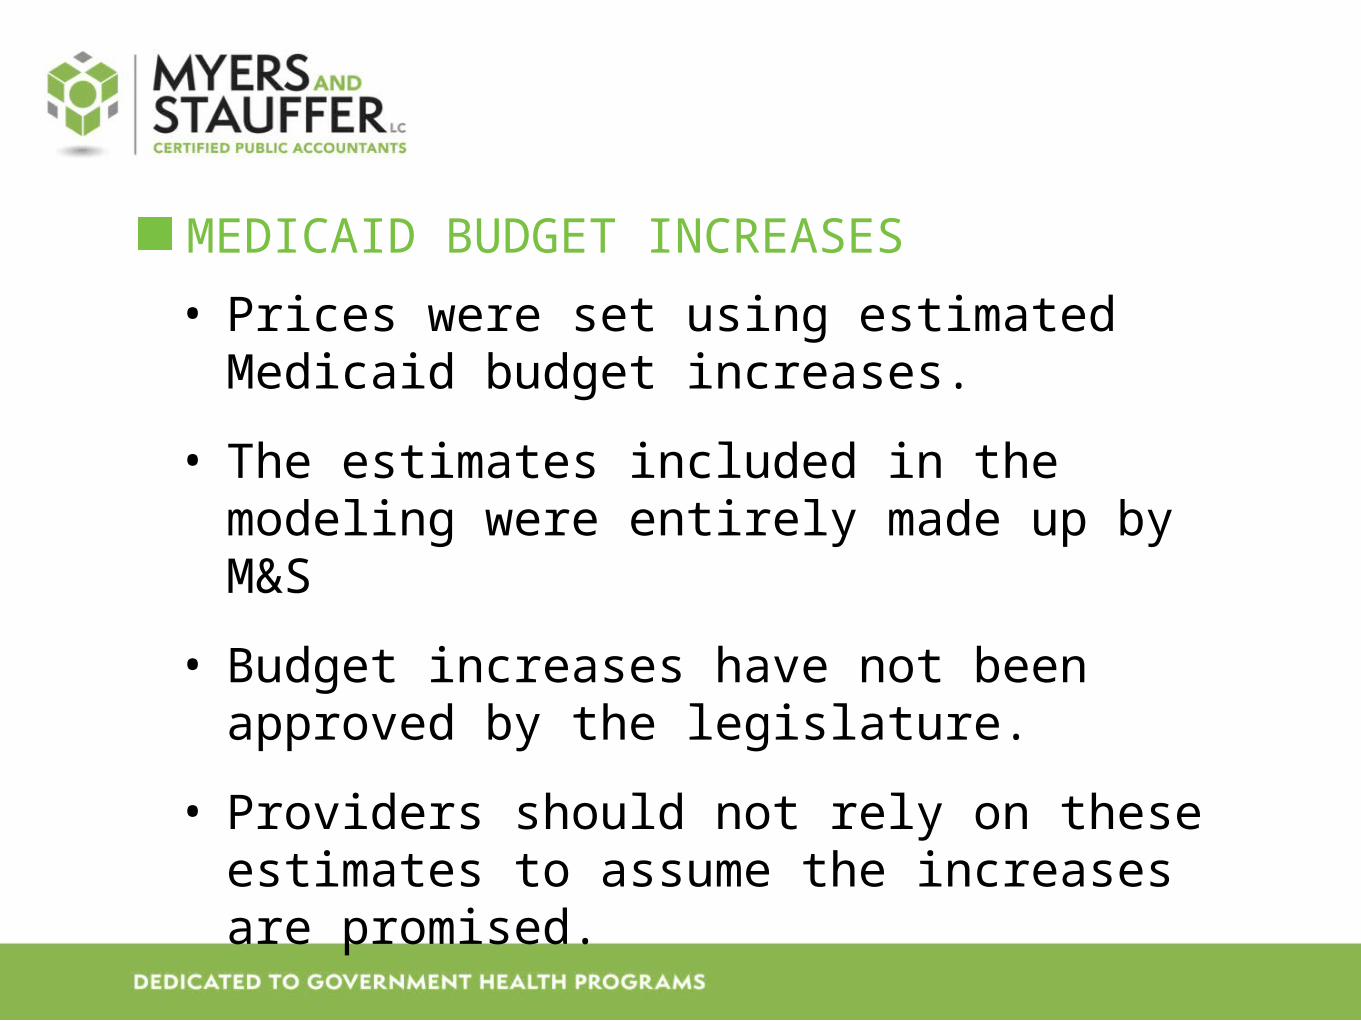
MEDICAID BUDGET INCREASES
• Prices were set using estimated Medicaid budget increases.
• The estimates included in the modeling were entirely made up by M&S
• Budget increases have not been approved by the legislature.
• Providers should not rely on these estimates to assume the increases are promised.

6. COST CATEGORIES

PROPERTY
Fixed capital (Line A01 of Medicare cost report)
+ Major moveable equipment (Line A02 c/r)
1. Asset depreciation
2. Asset interest
3. Lease expense

OPERATING
• A&G
• Plant operations
• Laundry
• Housekeeping
• Cafeteria
• Employee benefits assoc with operating wages

HEALTHCARE – CASE MIX ADJUSTED
• Medical records
• Social services
• SNF/NF Nursing wages
• SNF/NF Contracted nursing wages
• Employee benefits associated with HC wages

HEALTHCARE – NO CASE MIX ADJ
• Medical director
• Dietary
• Nursing admin
• Central services
• Pharmacy consultant
• Non legend drugs (OTC)
• Activities
• Routine supplies
• Employee benefits associated with HC wages

EXEMPT PASS THROUGH COSTSCost Center Draft Definition
Property insurance Property insurance on assets used in providing patient care. Malpractice, workmen’s compensation, and other employee-related insurances will not be considered property insurance.
Property taxes Property taxes on assets used in providing patient care. Tax penalties and income tax are not allowable.
Utilities Heat, electricity, water, sewer, and garbage.
Nurse aid training 1. Costs for testing, books, fees, and classes2. Wages & benefits of employees while being
trained are NOT considered a pass through.3. In house trainer wages & bens are NOT
considered a pass through.

7. DATA SOURCES FOR MODELING

COST DATA SOURCES – COST REPORT
A. 2012 Audited Medicaid Cost Reports
B. 2012 Medicare Cost Report
C. Entered adjustments from MCD cost report to MCR cost report to have Medicare reporting consistent with Medicaid reporting.

COST CATEGORIES
A. Each provider’s trial balance used to prepare the Medicare cost report was reviewed for cost categories.
B. Trial balance detail used to group costs by cost category using categories finalized in group’s 1/14/14 meeting.

COST CATEGORY ASSUMPTIONS
Data was not re-audited for modeling
Split cost into cost categories using account title detail from trial balances.
Relied on the account name descriptions for modeling.
I.e.: If a provider had no “activity” accounts, we did not contact them to split this out from another cost center.

8. CASE MIX INDICES

CASE MIX INDEX DETAILS
• MDS 3.0
• RUG IV Groups
• 48 Grouper (most commonly used for Medicaid)

CASE MIX PERIODS
• Collected MDS for the following quarters:
• 1/1/11 – 10/1/13
• This captures the scores to cover the following periods:
• Each provider’s cost report year
• Any future rate quarter through 10/31/13

RATE PERIOD
• Normal rate year is 10/1 – 9/30
• For modeling purposes only we wanted to use the 4 most current quarters of data available.
• We assumed a rate year of 1/1/13 – 12/31/13 to use the most current rate data.

PICTURE DATE
• We try to set quarterly rates using the most current MDS data available to match the quarter for the rate being set.
• It’s impossible to get totally timely information.
• We use a “picture date” for each quarter.
• The quarter preceding the rate quarter.
• Rate quarter 4/1 would use 1/1 MDS
9. PROVIDER TAKEAWAYS / TIPS

PRIVATE PAY RATE
• Start Now! I really mean now!
• Evaluate your private room rate.
• Ensure it’s higher than a potential MCD rate increase
• If the legislature funds this change, your rate may increase.
• If you are limited to your private room rate, you WON’T get your total increased rate.
• Ancillary charges are included in priv room rate calc.

PRIVATE PAY RATE - ANCILLARY CHARGE TRACKING
• Critical that providers track ancillary charge utilization by payer source and between the NF and the hospital.
a. 18 of 36 providers tracked in 2012
• If you don’t track ancillary charges, it won’t be included in your private pay rate.
TRACK EXEMPT COSTS IN GENERAL LEDGER!• Start NOW! I really mean now – you want to be
prepared to report this if the legislature funds program.
• Property taxes & property insurance
• Utilities
• Nurse aid training
Only 3 providers in 2012 reported nurse aid training on the Nurse Aid Training of your 2012 cost report – oops!

10. PROPERTY MODEL

PROPERTY• Fixed rental rate price based on age of building
• Younger the building, the higher your rate
• I.e.: All buildings age 30 paid $12.02 (model rate not guaranteed) regardless of their cost
• Building age determination:
Property surveys
Original construction date
Age reduced for remodels

PROPERTY – RATE DETERMINATION• Calculated cost per day of each building
• Arrayed cost per day into 7 groups of building age ranges
• 5 providers in each range
• Current capital reimb $3.7M
• Modeled capital reimb $6.0M
• Adjusted rate per building age to meet $6M budget

PROPERTY RENTAL RATE FEATURES
1. Building age freezes at 40 years (benefits provider)
2. If you remodel, building age may be reduced (benefits provider)
Re-age adjustment will be made from lower of frozen age (40) or actual age.
A fixed formula will be used for building re-age calculation
3. Building rate inflated each year using Marshall Swift property index

10. PRICE MODEL – NON PROPERTY

NON PROPERTY MODEL
• Includes:
• Exempt pass through (E)
• Healthcare (HC)
• Healthcare case mix adjusted (HC-CMA)
• Operating (O)

PRICE SETTING METHOD
• Current MCD expenditures
• 10% increase

PRICE FEATURES
Cost Center Price
Exempt Each provider’s MCD share of costHealthcare Fixed price to all = $38.17Healthcare CMI Starts with fixed price to all = $86.88
Then case mix adjusted up or down for your MCD acuity
Healthcare Ancillary
Fixed price to all = $3.15
Operating Fixed price to all = $40.50

11. LEFT TO DO

REMAINING THINGS TO ADDRESS1. SF 60 - % of Medicaid occupancy – Needs consideration
2. SF 60 - Regional economic factors –
Revising model to equalize rates between rural hospital-based & freestanding NFs so cost coverage is similar.
Future discussion on adjustments by county
3. Extraordinary care program
4. Model UPL program impact – increase in MCD rates decreases UPL payments

REMAINING ITEMS TO ADDRESS
5. Compare total modeled rate to current private room rates
6. Equitable “normalization” factor to adjust all calculated rates either up or down to meet legislative budget (if changes approved)