leaders in pipeline survey systems
TRANSCRIPT

Leaders in Pipeline Survey Systems
OPERATOR’S MANUAL
1
Issue 4-04 – US 1207
Imperial Version
Leaders in Pipeline Survey Systems
Equipment Serial Number: Dynalog Job/Contract Number:
OPERATING INSTRUCTIONS
Part 1 – OPERATION
1. INTRODUCTION
This folder includes full instructions and data for unpacking, setting-up, commissioning, and operating the above referenced C-Scan Model 2010 Survey & Monitoring System for buried pipelines. Part 1 of the Manual – OPERATION – is divided into Sections as shown on the Contents List on the next page. Part 2 is the Survey procedure manual supplied as a separate document. Before any setting-up and survey work is undertaken, these instructions must be read and fully understood by the Operators who will carry out the survey work using this equipment.
United Kingdom Health & Safety at Work Act 1974
Section 6 (a) of this Act requires manufacturers to advise their customers
on the safety and handling precautions to be observed when installing, operating, maintaining and servicing their products.
The user’s attention is therefore drawn to the following:
1. The appropriate sections of this manual must be read carefully before using the equipment.
2. Operation and maintenance must only be carried out by suitably trained personnel. 3. Normal safety precautions must be taken and appropriate procedures observed to avoid accidents
Refer to the equipment suppliers — name and address below — for any technical advice or product
information
Issue 4-04 – US 1207 Dynalog Electronics Limited PO Box 1073 Bristol BS99 1HF United Kingdom e-mail: [email protected] Website: www.dynalog.co.uk
OPERATOR’S MANUAL
2 Issue 4-04 – US 1207

Leaders in Pipeline Survey Systems
2. OVERVIEW
2.1. Introduction
This section described the C-Scan Pipeline Survey System model 2010: what the system comprises, how to unpack it, set it up and get it started. A detailed contents list for this section appears below.
Contents 1. INTRODUCTION.................................................................................................. 2 2. OVERVIEW .......................................................................................................... 3 2.1. Introduction ....................................................................................................... 3 2.2. Unpacking and activating the C-Scan 2010 Detector Unit (DU)........................ 4
2.2.1. Unpacking ..................................................................................................... 4 2.2.2. Charging the Signal Generator (SG) ............................................................. 4 2.2.3. Charging the Detector Unit (DU) ................................................................... 5
2.3. Getting Started................................................................................................ 11 2.3.1 The display screen and keypad................................................................... 11 2.3.2. Quick Start................................................................................................... 14 2.3.3. Search......................................................................................................... 16 2.3.4. Calculate ..................................................................................................... 18 2.3.5. Store Data ................................................................................................... 18 2.3.6. Entering Distance ........................................................................................ 19 2.3.7. Graphs......................................................................................................... 21
3. SUMMARY SPECIFICATION............................................................................. 22 3.1. Detector Unit (DU) .......................................................................................... 22 3.2. Signal Generator (SG) .................................................................................... 23 4. OPERATION ...................................................................................................... 24 4.1. Introduction ..................................................................................................... 24
4.1.1. Principles of Operation ................................................................................ 24 4.2. Demo Mode .................................................................................................... 25
4.2.1 Starting DEMO MODE ................................................................................ 26 4.3. Creating a new survey .................................................................................... 27 4.4. Notes on entering distances............................................................................ 28 4.5. Chainage......................................................................................................... 29 4.6. Direction change within a survey .................................................................... 31 4.7. Notes on Graphs............................................................................................. 32 4.8. Close Interval Survey...................................................................................... 34 4.9. Notes on GPS................................................................................................. 36 4.10. Battery Life/Power modes............................................................................... 37 4.11. PRINTING OUT A SURVEY ........................................................................... 39 4.12. Clearing Memory............................................................................................. 41
OPERATOR’S MANUAL
3 Issue 4-04 – US 1207

Leaders in Pipeline Survey Systems
The C-SCAN 2010 is the next generation design in the 2000 series Pipeline Survey System. The system increases the speed and accuracy over previous models, with more statistical features for noise reduction. Improvements over the previous model include the following features:
• Built in GPS unit for accurate position indication. • Attenuations can be calculated using GPS position information • Full graphic interface allows the display of data without the use of a laptop or PC.
2.2. Unpacking and activating the C-Scan 2010 Detector Unit (DU)
2.2.1. Unpacking For shipping safety the Detector Unit is shipped with its batteries packed separately. Unpack the entire system from its yellow transportation case and make sure all the items, including those stored in the lid of the Signal Generator, are present in accordance with the packing list. NOTES:
1. A spare copy of the packing list can be found in the plastic zip envelope containing the manuals and other documents. Report any obvious damage or any missing items, immediately.
2. To open the lid of the Signal Generator (SG) it may be necessary to push the red button on the front face of the SG case to release internal vacuum.
3. Do NOT try to activate damaged equipment.
If everything appears to be present and undamaged proceed to 2.2.2 below.
2.2.2. Charging the Signal Generator (SG) NOTES:
There are two battery chargers supplied with the equipment. They are identical and can be used interchangeably to charge either the SG or the Detector Unit (DU). The SG is powered by completely sealed lead-acid batteries. These batteries are permanently installed and may be replaced only by a trained technician. External back- up power can be supplied to the SG through its external port – for more information see part 2 – Survey Procedure manual supplied as separate document.
OPERATOR’S MANUAL
4 Issue 4-04 – US 1207

Leaders in Pipeline Survey Systems
Use one of the battery chargers and its power cord to charge the SG as follows: • Remove the black charging port cover on the SG (located on the front face of the casing).
Unscrew (anti-clockwise) and plug-in the matching charger lead connector. • Plug in the mains (Power) lead into a mains supply socket outlet (the charger is a 100-240VAC
universal model with a 110VAC 3-pin US Plug provided). Make sure the mains outlet is ‘live’. Note that the mains lead may need to be replaced – or the plug changed – to suit other mains voltage supplied / outlet sockets.
• Press the SG ON button (located on the SG control panel). A series of messages will appear in the SG’s LCD display which will stop at the message BATTERY A IS BEING CHARGED. The computer-controlled charging program will cycle the batteries, charging each in turn until they are close to being fully charged. At this point the message will terminate and switch the unit off automatically.
NOTE; the batteries are shipped in a very low state of charge and it may thus take up to 60 hours of continuous charging to reach a fully charged state. The unit should be left on charge until it turns itself off. IMPORTANT: interrupting the initial charging cycle may seriously affect the ability of the batteries ever to reach full capacity.
2.2.3. Charging the Detector Unit (DU) The DU can be powered by C cells or D cells depending on the model. The picture below shows the two types.
D Cells 4.5Ahr NiCd On/Off Switch
C Cells 4.5Ah NiMH On/Off Switch
The DU can be powered either by re-chargeable NiCad, NiMH batteries OR by alkaline batteries. Only the NiCad / NiMH batteries can be charged using the following procedure. Using the charger with alkaline batteries installed in the DU will result in damage to the unit.
OPERATOR’S MANUAL
5 Issue 4-04 – US 1207
Leaders in Pipeline Survey Systems
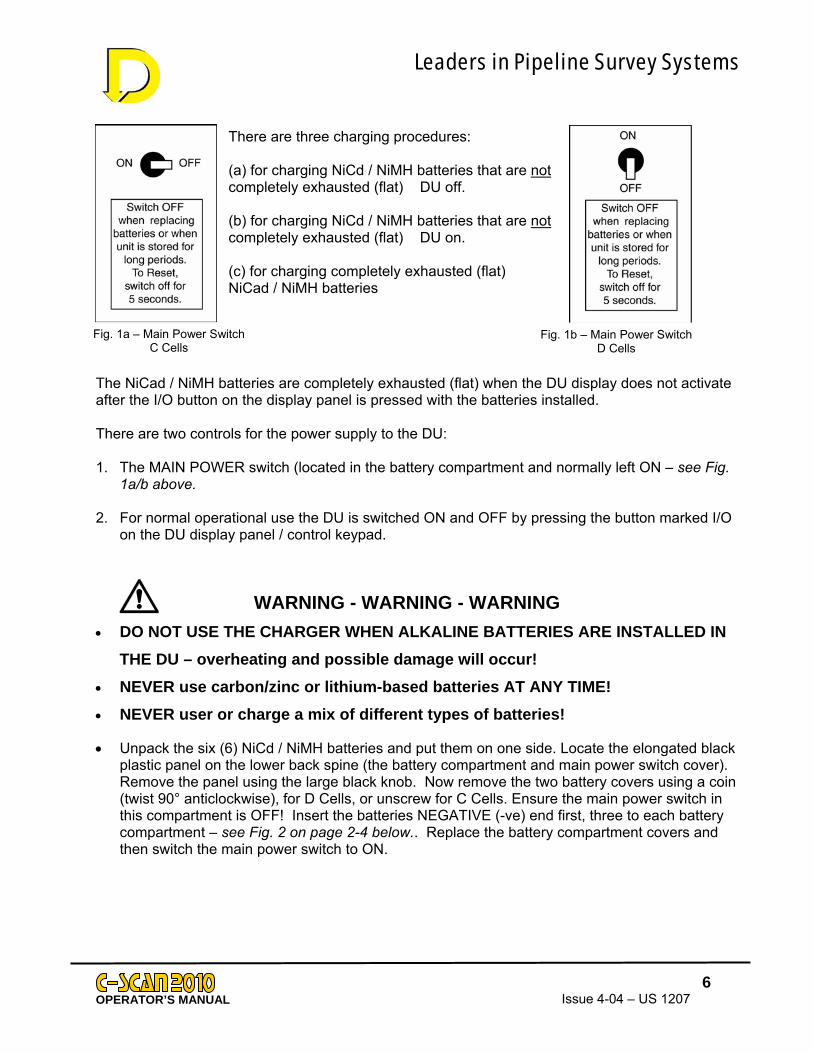
There are three charging procedures: (a) for charging NiCd / NiMH batteries that are not completely exhausted (flat) DU off. (b) for charging NiCd / NiMH batteries that are not completely exhausted (flat) DU on. (c) for charging completely exhausted (flat) NiCad / NiMH batteries
Fig. 1a – Main Power Switch C Cells
Fig. 1b – Main Power Switch D Cells
The NiCad / NiMH batteries are completely exhausted (flat) when the DU display does not activate after the I/O button on the display panel is pressed with the batteries installed. There are two controls for the power supply to the DU: 1. The MAIN POWER switch (located in the battery compartment and normally left ON – see Fig.
1a/b above. 2. For normal operational use the DU is switched ON and OFF by pressing the button marked I/O
on the DU display panel / control keypad.
WARNING - WARNING - WARNING • DO NOT USE THE CHARGER WHEN ALKALINE BATTERIES ARE INSTALLED IN
THE DU – overheating and possible damage will occur! • NEVER use carbon/zinc or lithium-based batteries AT ANY TIME! • NEVER user or charge a mix of different types of batteries!
• Unpack the six (6) NiCd / NiMH batteries and put them on one side. Locate the elongated black
plastic panel on the lower back spine (the battery compartment and main power switch cover). Remove the panel using the large black knob. Now remove the two battery covers using a coin (twist 90° anticlockwise), for D Cells, or unscrew for C Cells. Ensure the main power switch in this compartment is OFF! Insert the batteries NEGATIVE (-ve) end first, three to each battery compartment – see Fig. 2 on page 2-4 below.. Replace the battery compartment covers and then switch the main power switch to ON.
OPERATOR’S MANUAL
6 Issue 4-04 – US 1207

Leaders in Pipeline Survey Systems
s
• The LCD will now display the clock and date setting panels – see Figs 3a & 3b bel
is sufficient residual charge left in the batteries. The 1st charging procedure detailethru 3 below may now be followed.
Fig. 3a – Time Display screen Fig. 3b – Date Display screen
NOTE: If the display does not activate, re-open the battery compartment and turn the MOFF again, wait for 5 seconds, then switch it back to ON. If the display then activates, prsteps 1 thru 3 below. NOTE: Subsequent removal/ replacement of the batteries will necessitate this same date/time procedure because these batteries power the clock. Hence the clock settings are lost every timare removed or replaced or the Main Power Switch in the battery compartment is turned to ‘OFVersion 2 software that holds the clock with no batteries. If the display still does not activate this indicates the NiCad / NiMH batteries are exhausted andcharging procedure detailed in Step 4 below must be followed. Proceed to 2nd charging proced Note also that up to this point no buttons have been pushed on the DU display panel. The onlyhas been activated is the Main Power Switch in the battery compartment.
OPERATOR’S MANUAL Issue 4-04 – U
+
-Fig. 2 – Inserting the batterie
ow - if there d in Steps 1
ain Switch to oceed with
setting e the batteries F’. Except
the 3rd ure below.
switch that
7S 1207

Leaders in Pipeline Survey Systems
WARNING! In all below procedures the mains switch must be on before the charger is attached.. • 1st charging procedure (for partially discharged NiCad / NiMH batteries and DU switched
off) Locate the battery charger port to (the black connector below the battery compartment cover). Unscrew the port cover and attach the battery charger to this port. Connect the charger power cord to a mains outlet socket. Make sure the mains outlet is ‘live’. Switch on DU by I/O key. Charge should commence at charge screen (Fig.5b below) • 2nd charging procedure (for partially discharged NiCad / NiMH batteries and DU already
switched on) Step 1 Locate the battery charger port (by the black connector below the battery compartment cover). Unscrew the port cover and attach the battery charger to this port. Connect the charger power cord to a mains outlet socket. Make sure the mains outlet is ‘live’.
Fig 4 – the Start screen Step 2 To begin the automatic charging cycle Press MENU on the Start screen – see Fig. 4 above. The display will now show the Menu screen – see Fig. 5a below. Press CHARGE (lower RH corner) and after a few seconds the Charge screen will appear – see Fig. 5b below. This indicates a timer that counts backwards, the time displayed being the maximum time allowed to charge the batteries. If the batteries are charged before that time has expired (counted down to zero) charging will be terminated and the unit switched off automatically.
Fig. 5b – the Charge screen Fig. 5a – the Menu screen
If it is necessary to terminate the charging cycle before the batteries are fully charged and the unit has turned itself off, the charging cycle may be ended by pressing the X key.
OPERATOR’S MANUAL
8 Issue 4-04 – US 1207

Leaders in Pipeline Survey Systems
Step 3 The charging process is a rapid cycle program and is automatic. It will terminate when the batteries are fully charged. Once it is activated the automatic timer provides adequate time for exhausted batteries to be fully charged. Hence it should not be necessary to re-run the charging program once it has completed the process automatically. NOTE: attaching the charger whilst the unit is turned off at the I/O switch (but the Main Power Switch must be ON) will automatically trickle-charge the batteries. IMPORTANT: if the unit is switched on at the I/O button whilst the charger is attached, the unit will go into charge mode automatically (1st charging procedure). • 3rd charging procedure (for completely exhausted NiCad / NiMH batteries DU will not
switch on) Step 4 Make sure the Main Power Switch in the battery compartment is ON position. Connect the charger power cord to the mains supply outlet socket. Make sure the socket is ‘live’. Leave the charger attached for a 30 minutes – applies to units D/1669 or later. The charger will now charge the batteries. When the batteries have been charged sufficiently the unit will automatically turn on and continue the charge cycle. If unit fails to switch on, disconnect the charger, switch off (at switch) for 5 seconds, then on again – then proceed to 2nd charging procedure, step 1 above. WARNING! In all above procedures the main switch must be ON before the charger is attached.. NOTE: Attaching charger without batteries will start the detector in charge mode. Since there are no batteries, they will not be charged. System will switch off in 4 hours or can be aborted by pressing the X key. If this has been done, disconnect the charger, switch the switch to OFF, insert batteries, switch to ON. Then proceed to 2nd charging procedure, step 1 above.
Note:
To maintain worldwide compatibility, Attenuation, Conductance and Resistivity,
will be displayed in metric Per metre or per metre2
OPERATOR’S MANUAL
9 Issue 4-04 – US 1207

Leaders in Pipeline Survey Systems
General Guidance Notes on the batteries used in the C-SCAN System. GGN 1 C-Scan Signal Generator (SG) The power supply for the SG can be augmented by connecting an external 12 volt vehicle type battery via the connecting cables (black and red leads with fuses and ‘crocodile’ clips) supplied and stored in the lid of the SG casing. The lead is plugged into the dual purpose charging/external power supply port on the front of the SG casing and the red and black clips attached to the appropriate polarity post connectors of the vehicle battery. When it is turned on, the SG will ‘recognise’ that external power is available and will utilize this source until the battery loses its charge. If the external power source is exhausted, the SG will automatically switch over to its internal batteries thus ensuring that no break occurs in the survey process. The batteries in the SG are of the completely sealed, non-spillable, lead-acid type. They must be kept charged to ensure a long life. If the SG is to be inactive for any length of time – e.g in excess of one month - it will be necessary to place the unit on a booster charge to maintain its power level. To do this, attach the battery charger and press the I/O button to begin the charging process. The unit will turn itself off when a full charge is accomplished. The unit does not trickle-charge. It will be necessary to repeat the booster charging process more than once if the unit is inactive for longer periods: every 30 days will be sufficient. GGN 2 C-Scan Detector Unit (DU) The Detector unit uses six (6) D-cell batteries. They can be rechargeable NiCd / NiMH or Alkaline batteries. NEVER mix battery types. If the installed NiCad batteries run low in the field during a survey, they can be changed in the field without affecting data already stored. The replacement batteries can be of either type but all in the group of 6 must be of the SAME type. Never attempt to re-charge Alkaline batteries in the DU or damage will result. The DU draws a small amount of current from the batteries when it is switched off at the Control/Display Panel I/O switch, but with the main power switch left ON. If left for a long period in this state the power in the batteries will eventually be reduced to zero. If the unit is to be inactive for a period of time, either remove the batteries completely OR switch the Main Power Switch to Off. If the unit is to be shipped or stored it is recommended that the batteries be removed for safety reasons. Leaving Alkaline batteries in a stored DU - even with the Main Power Switch Off - may result in battery corruption and leakage, causing internal damage to the DU. IMPORTANT FEATURE: Survey Data Storage is NOT affected by the removal of the batteries. However, be sure to use reasonably fresh batteries when downloading data from the DU.
OPERATOR’S MANUAL
10 Issue 4-04 – US 1207

Leaders in Pipeline Survey Systems
2.3. Getting Started
2.3.1 The display screen and keypad
The C-SCAN 2010 is the next generation design in the 2000 series Pipeline Survey System. The system increases the speed and accuracy and includes more statistical features for noise reduction, including:
• Built in Global Positioning System (GPS) unit for precision position indication. • Attenuations can be calculated using GPS position information • Full graphic interface allows the displaying of data without the use of a laptop or PC. The
Search facility displays: • Pipeline position • GPS position • Approximate Depth/Cover • Pipeline diameter • Survey and location number • Facility for recording pipeline
diameter and wall thickness. • Display of approximate coating
conductance in µS/m2. • Display of approximate coating
resistance in Wm2 • Symbol inclusion for landscape
features • Graphs include:
Attenuation – by chainage or increment
Depth – cover or to centre line Current – including close interval plots
GPS position – show the plan of tpipeline
he
• Software upgradeable via PC • To maintain worldwide compatibility, Attenuation, Conductance and Resistivity, will be
displayed in metric Per metre or per metre2 For more details of the display mode screen and the keypad layout see Figs. 6 and 7 below.
OPERATOR’S MANUAL
11 Issue 4-04 – US 1207

Leaders in Pipeline Survey Systems
Where possible, all displays are language independent, with graphic icons representing features or functions:
Overhead Locator Bar
Pipeline Position indicator
GPS position
Signal strength indicator
Depth to Centre
Depth to top (cover)
Current
Attenuation
Chainage
Distance Symbols relating to landscape features such as trees, walls, fences, roads, rivers, pylons, etc
Symbol for GPS
Pipeline Diameter
Approx. Depth to centre or cover
Distance to Pipeline (decimal feet)
Approx. Current
OPERATOR’S MANUAL
12 Issue 4-04 – US 1207

Leaders in Pipeline Survey Systems
Fig. 6 – The Search Screen Mode Display Screen
Fig. 7 – Keypad layout
YES key ( )
NO key ( )
LCD contrast key
Download key
Enter key
Back key
Help key
GPS Indicator
14 Function keys
ON / OFF key
OPERATOR’S MANUAL
13 Issue 4-04 – US 1207

Leaders in Pipeline Survey Systems
2.3.2. Quick Start 2.3.2.1 Start-up Screen (GPS Off) Fig. 8 (right) shows the Start-up screen. Note the GPS sub-system is turned Off at this stage. To switch the GPS ON press the key adjacent to the GPS symbol After a few seconds the screen will change to GPS ON: note this does not mean the GPS has acquired the signal, only that it is searching. The pipe symbol (bottom row first from left) indicates that the pipeline diameter has not been entered for this survey:
Fig. 8 – the Start-up screen
Note that calculated conductance, resistance and cover data cannot be displayed unless the pipeline diameter is entered. The symbol will flash as a reminder of this. To enter the pipeline diameter, press the key adjacent to the flashing pipe symbol. The Pipeline Specification screen is now displayed: 2.3.2.2 Pipeline Specification screen Fig. 9 (right) shows the Pipeline Specification Screen. Using the keys adjacent to the appropriate OD box (OD Up or OD Down), scroll to the outside diameter required.
Fig. 9 – the Pipeline Specification screen
Using the keys adjacent to the appropriate Wall box (Wall Up or Wall Down), scroll to the wall thickness required. Note that wall thickness may not be known; in which case select the “???” option. Calculation of conductance will then change slightly as an average will be taken. The resulting error will not be significant. When complete, press the key (bottom RH corner) to continue.
OPERATOR’S MANUAL
14 Issue 4-04 – US 1207
Leaders in Pipeline Survey Systems
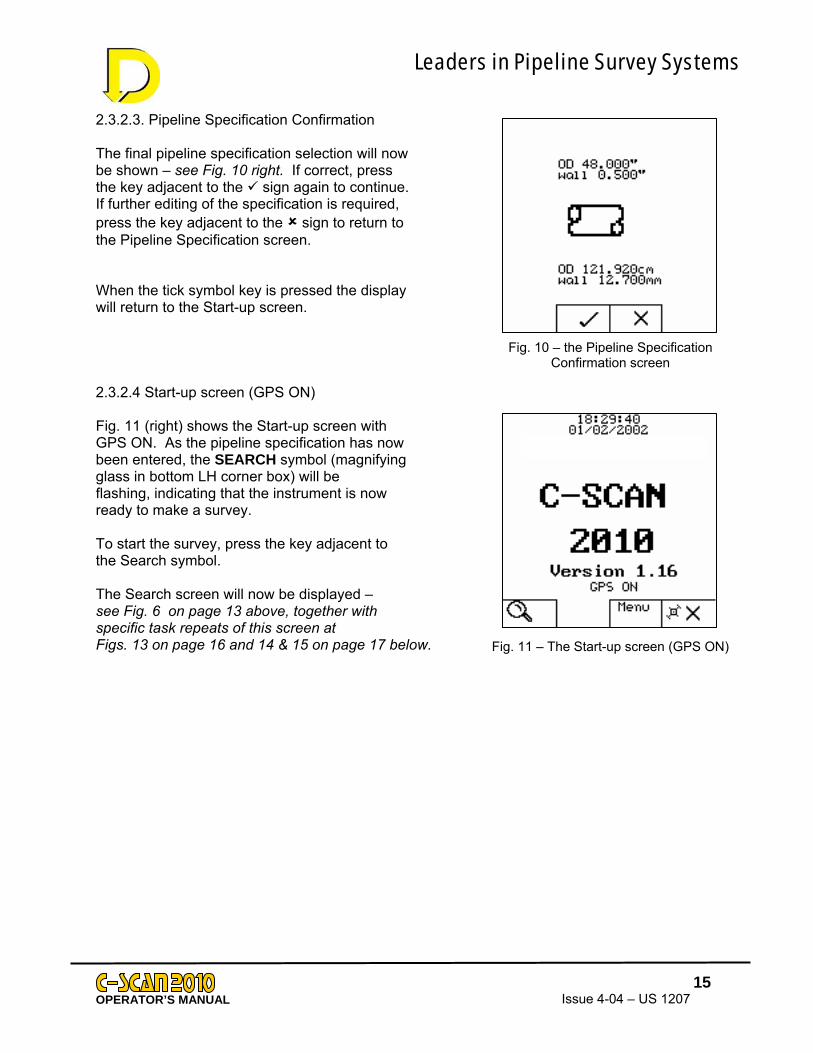
2.3.2.3. Pipeline Specification Confirmation The final pipeline specification selection will now be shown – see Fig. 10 right. If correct, press the key adjacent to the sign again to continue. If further editing of the specification is required, press the key adjacent to the sign to return to the Pipeline Specification screen. When the tick symbol key is pressed the display will return to the Start-up screen. Fig. 10 – the Pipeline Specification
Confirmation screen 2.3.2.4 Start-up screen (GPS ON) Fig. 11 (right) shows the Start-up screen with GPS ON. As the pipeline specification has now been entered, the SEARCH symbol (magnifying glass in bottom LH corner box) will be flashing, indicating that the instrument is now ready to make a survey. To start the survey, press the key adjacent to the Search symbol. The Search screen will now be displayed – see Fig. 6 on page 13 above, together with specific task repeats of this screen at Figs. 13 on page 16 and 14 & 15 on page 17 below. Fig. 11 – The Start-up screen (GPS ON)
OPERATOR’S MANUAL
15 Issue 4-04 – US 1207
Leaders in Pipeline Survey Systems
2.3.3. Search
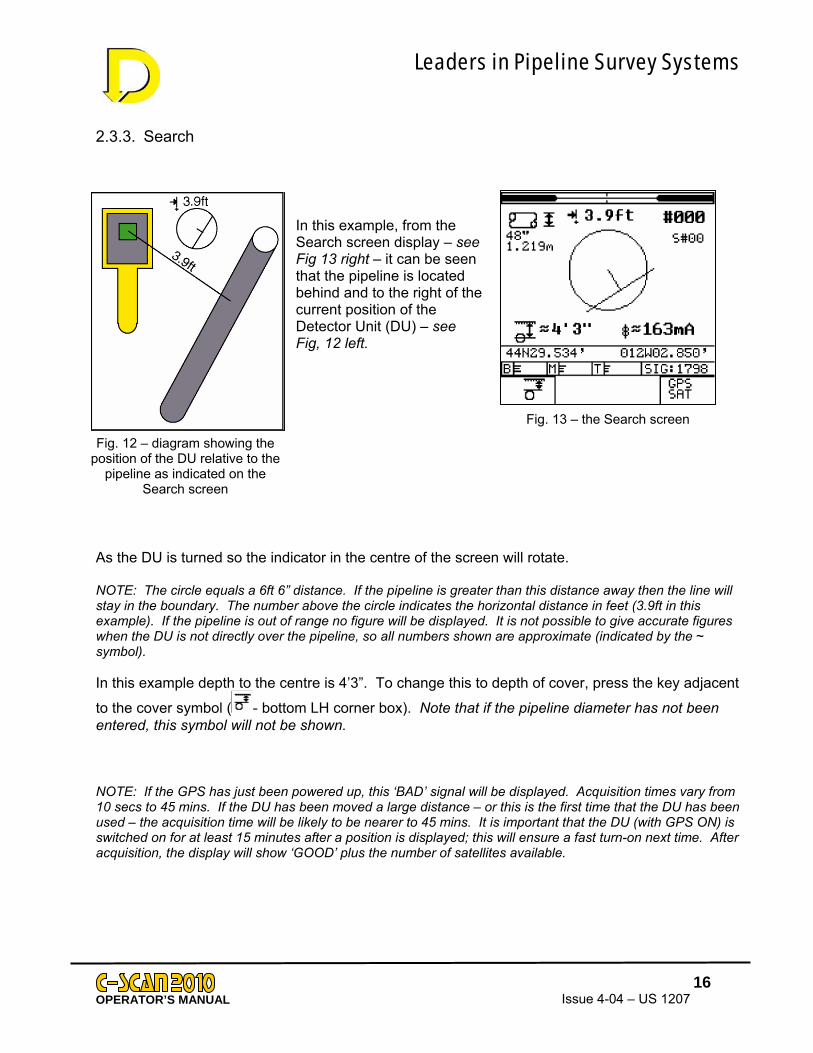
In this example, from the Search screen display – see Fig 13 right – it can be seen that the pipeline is located behind and to the right of the current position of the Detector Unit (DU) – see Fig, 12 left.
Fig. 13 – the Search screen
Fig. 12 – diagram showing the position of the DU relative to the
pipeline as indicated on the Search screen
As the DU is turned so the indicator in the centre of the screen will rotate. NOTE: The circle equals a 6ft 6” distance. If the pipeline is greater than this distance away then the line will stay in the boundary. The number above the circle indicates the horizontal distance in feet (3.9ft in this example). If the pipeline is out of range no figure will be displayed. It is not possible to give accurate figures when the DU is not directly over the pipeline, so all numbers shown are approximate (indicated by the ~ ymbol). s
In this example depth to the centre is 4’3”. To change this to depth of cover, press the key adjacent
to the cover symbol ( - bottom LH corner box). Note that if the pipeline diameter has not been ntered, this symbol will not be shown. e
NOTE: If the GPS has just been powered up, this ‘BAD’ signal will be displayed. Acquisition times vary from 10 secs to 45 mins. If the DU has been moved a large distance – or this is the first time that the DU has been used – the acquisition time will be likely to be nearer to 45 mins. It is important that the DU (with GPS ON) is switched on for at least 15 minutes after a position is displayed; this will ensure a fast turn-on next time. After
cquisition, the display will show ‘GOOD’ plus the number of satellites available. a
OPERATOR’S MANUAL
16 Issue 4-04 – US 1207

Leaders in Pipeline Survey Systems
Pressing the key adjacent to the GPS POS box (bottom RH corner) will change the display from the number of satellites to the Latitude & Longitude position of the DU – see Figs. 14 & 15 below.
Fig. 15 – Latitude / Longitude in
this example is for Bristol UK Fig. 14 – GPS signal ‘GOOD’ with number of satellites shown
Move the DU towards the pipeline until the horizontal distance indicator is as close to zero as possible. The right and left-hand black bars at the top of the display screen shown the precise overhead position when they are as close together as possible. Two newly available function keys are now displayed: - the CALCULATION key, below the ≈►= symbol. and - the CLOSE key, below the ‘Close’ box The CALCULATION key takes a large sample and converts the approximate readings into accurate data. NOTE: it is important that the DU is held stationary and perpendicular to the pipeline after the CALCULATION key is pressed. Any movement will upset the readings and result in data errors. The CLOSE key is for CLOSE INTERVAL CURRENT SURVEY. This is discussed in Section 4.8 later in this manual. Keep the instrument still and press the CALCULATION key (≈►=) now. NOTE: if the DU is in DEMO mode the display will be continually changing. Press the CALCULATION key when its symbol (≈►=) appears.
OPERATOR’S MANUAL
17 Issue 4-04 – US 1207
Leaders in Pipeline Survey Systems
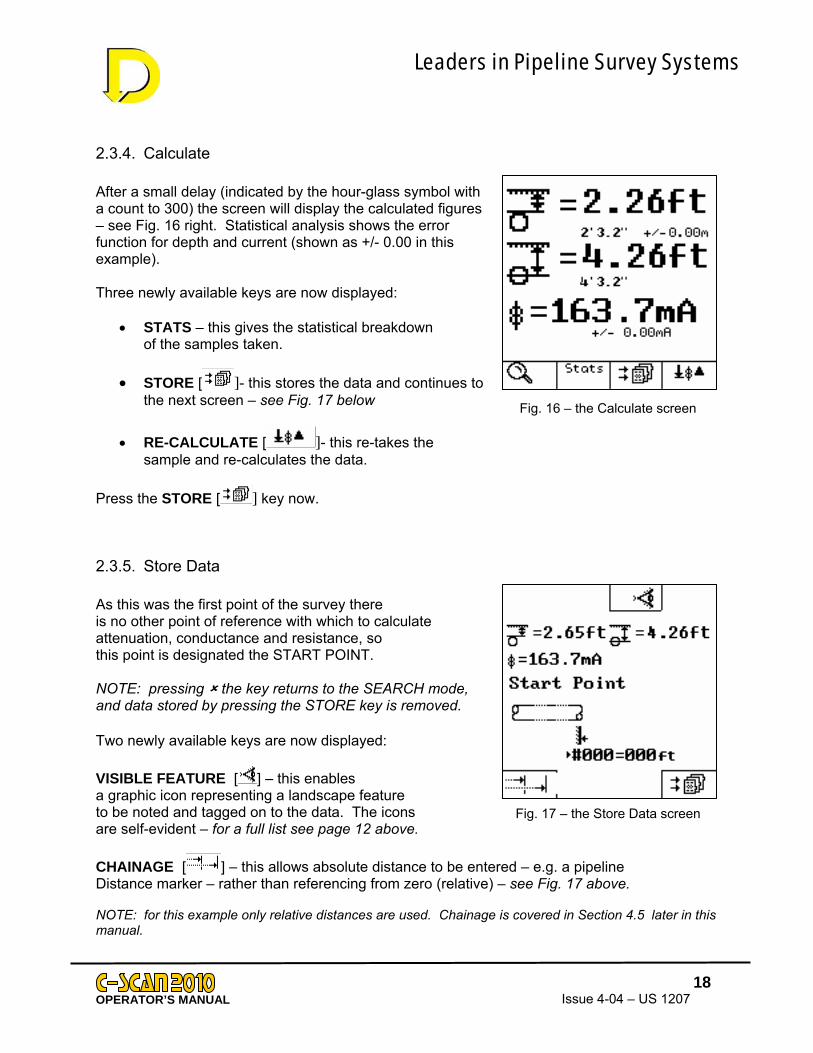
2.3.4. Calculate After a small delay (indicated by the hour-glass symbol with a count to 300) the screen will display the calculated figures – see Fig. 16 right. Statistical analysis shows the error function for depth and current (shown as +/- 0.00 in this example). Three newly available keys are now displayed:
• STATS – this gives the statistical breakdown of the samples taken.
• STORE [ ]- this stores the data and continues to the next screen – see Fig. 17 below Fig. 16 – the Calculate screen
• RE-CALCULATE [ ]- this re-takes the sample and re-calculates the data.
Press the STORE [ ] key now.
2.3.5. Store Data As this was the first point of the survey there is no other point of reference with which to calculate attenuation, conductance and resistance, so this point is designated the START POINT. NOTE: pressing the key returns to the SEARCH mode, and data stored by pressing the STORE key is removed. Two newly available keys are now displayed: VISIBLE FEATURE [ ] – this enables a graphic icon representing a landscape feature to be noted and tagged on to the data. The icons are self-evident – for a full list see page 12 above.
Fig. 17 – the Store Data screen
CHAINAGE [ ] – this allows absolute distance to be entered – e.g. a pipeline Distance marker – rather than referencing from zero (relative) – see Fig. 17 above. NOTE: for this example only relative distances are used. Chainage is covered in Section 4.5 later in this manual.
OPERATOR’S MANUAL
18 Issue 4-04 – US 1207

Leaders in Pipeline Survey Systems
Press the STORE [ ]key now. This is the final screen before data is permanently stored – see Fig. 18 right. Pressing the key below the X box will revert to the previous screen. Pressing the key below the box will return to the Start-up screen. This screen shows:
• depth ( ) (cover ( ) will show ‘?’ if pipeline diameter is not entered)
• current ( ) Fig. 18 – the Start Point screen • Distance between previous location point (│↔│)
n.b. as this is the first point (→#000 = 000ft) is shown • Chainage (→│) (0ft) • and survey number (S#00).
Press the key now. That is the first survey point completed.
2.3.6. Entering Distance Move down the pipeline to the next location (at least 300ft for this test). Go through the above procedures again until the STORE DATA screen is shown – Fig.17 on page 18. If it is set into ‘DEMO MODE’ the DU will automatically call the next data point. This point – i.e. the second point on the survey – will obviously show different data from the start point. Two choices are now possible – see Fig. 19 right.
1. Use the distance calculated by the GPS (shown as GPS:052ft in this example).
2. Enter the distance manually.
To use the GPS press the key above the USE GPS box. To enter the distance manually, just use the numerical keypad. If you have not entered the distance manually, press the USE GPS key now.
Fig. 19 – Distance Screen 1
OPERATOR’S MANUAL
19 Issue 4-04 – US 1207

Leaders in Pipeline Survey Systems
The distance from the start point (#000→#001) is now entered as 52ft – see Fig 20 right. NOTE: you may change your mind at this point and enter the distance manually by pressing they key below the go-back arrow box (←). The +/- box key is used to change direction; POSITIVE (+ve) distances are away from the Signal Generator (SG) – NEGATIVE (-ve) distances are towards the SG. Press the STORE [ ] key now. This is the final screen before the data is permanently stored. Data now on display – see Fig. 21 right – is as before:
• Depth
• Cover
• Current
• Distance │↔│(52ft)
• This Point (#001)
• Last Point (#000)
• Chainage →│(52ft)
CPlus newly displayed data on this screen:
• CONDUCTANCE (µS/m2 – micro-siemens / sq.metre)
• RESISTANCE (kΏ/ m2 – kilohms / sq.metre)
these relate to the coating condition allowing for pipe diameter andversion these values are still in metric to maintain worldwide comp and finally - ATTENUATION The attenuation value (mb/m) is the absolute rate of loss of signal the section #000 - #001. It is independent of the value of the initiagenerator and of the ground conditions. It is solely determined bycoating between the two locations and by the area of pipeline coatper metre (or per foot) of pipeline – or in other words: the pipelinegiven diameter, the attenuation value is an absolute indicator of wfigure, the better. If comparing two pipelines of different diametersthe attenuation values will be proportional to the diameter. Press the key now to continue.
OPERATOR’S MANUAL
Fig. 20 – Distance Screen 2
Fig. 21 – Distance Screen 3
To maintain worldwide compatibility, Attenuation,
onductance and Resistivity, will be displayed in metric values,
per metre or per metre2
wall thickness. For the USA atibility.
current from, the pipeline over l signal set on the signal the average condition of the ing in contact with the ground, diameter. For a pipeline of a rap condition; the lower the but with identical wrap condition,
20Issue 4-04 – US 1207

Leaders in Pipeline Survey Systems
2.3.7. Graphs The next screen allows graphs to be plotted on the screen to provide the operator with a quick method of viewing the data so far acquired, without having to download to a computer. The newly available keys are now:
GPS POSITION PLOT [ ] – this shows a plan view of the pipeline to scale.
ATTENUATION PLOT [ ] – this shows a bar graph of the attenuation on this section of the pipeline
CURRENT PLOT [ ] – this shows the absolute current over the surveyed sections
DEPTH PLOT [ ]- this shows the depth to:
Fig. 22 – the Graphs screen
• the centre-line [ ] of the pipeline
• or cover [ ].
That is the procedure – now just practice by continuing with your survey.
OPERATOR’S MANUAL
21 Issue 4-04 – US 1207
Leaders in Pipeline Survey Systems
3. SUMMARY SPECIFICATION
3.1. Detector Unit (DU)
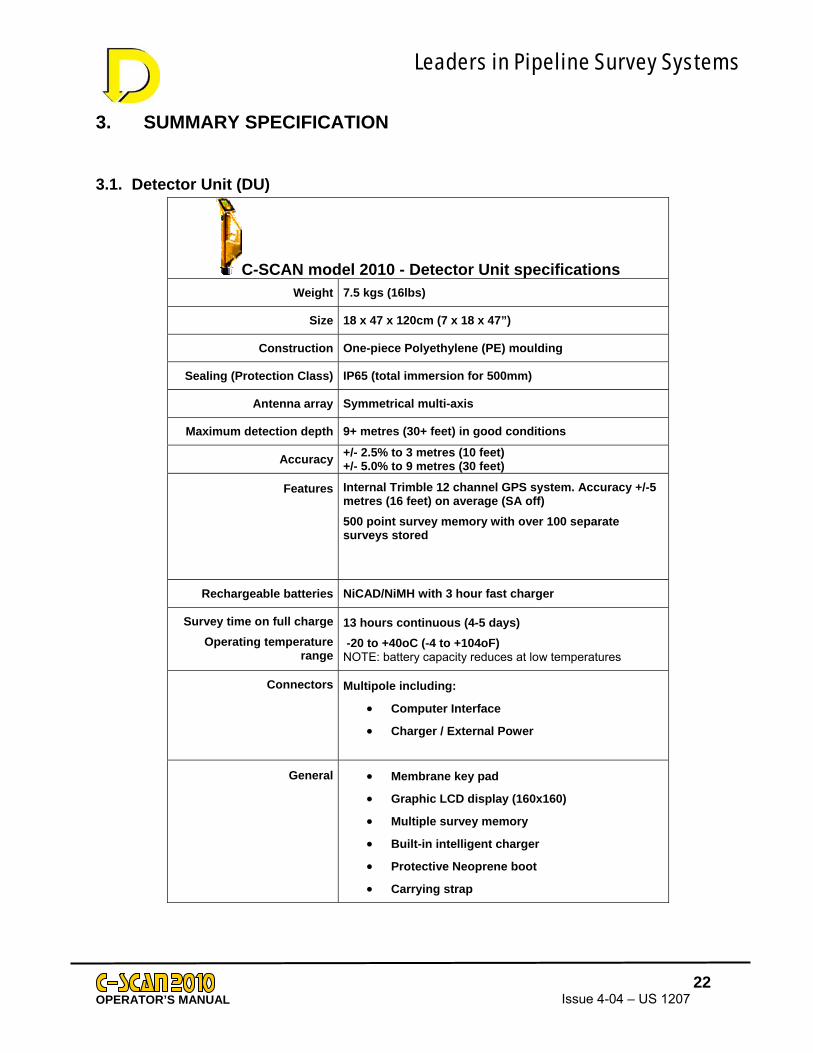
C-SCAN model 2010 - Detector Unit specifications
Weight 7.5 kgs (16lbs)
Size 18 x 47 x 120cm (7 x 18 x 47”)
Construction One-piece Polyethylene (PE) moulding
Sealing (Protection Class) IP65 (total immersion for 500mm)
Antenna array Symmetrical multi-axis
Maximum detection depth 9+ metres (30+ feet) in good conditions
Accuracy +/- 2.5% to 3 metres (10 feet) +/- 5.0% to 9 metres (30 feet)
Features Internal Trimble 12 channel GPS system. Accuracy +/-5 metres (16 feet) on average (SA off) 500 point survey memory with over 100 separate surveys stored
Rechargeable batteries NiCAD/NiMH with 3 hour fast charger
Survey time on full charge Operating temperature
range
13 hours continuous (4-5 days) -20 to +40oC (-4 to +104oF) NOTE: battery capacity reduces at low temperatures
Connectors
Multipole including:
• Computer Interface
• Charger / External Power
General • Membrane key pad
• Graphic LCD display (160x160)
• Multiple survey memory
• Built-in intelligent charger
• Protective Neoprene boot
• Carrying strap
OPERATOR’S MANUAL
22 Issue 4-04 – US 1207

Leaders in Pipeline Survey Systems
3.2. Signal Generator (SG)
Signal Generator specifications
Weight 14.5 kgs (32lbs)
Size 33 x 26 x 23cm (13 x 10 x 9”)
Construction Aluminium drawn case with hinged storage lid
Sealing (Protection Class) IP66 (closed) / IP65 (open)
Rechargeable batteries 3 x 12v – 7Ahr sealed lead/acid
External power 11.5v to 18v DC
Maximum output 750mA (RMS) AC coupled at 937.5Hz on internal batteries
1000mA (RMS) AC coupled at 937.5 Hz with external power
Survey time (on internal batteries)
(on external power)
8 hrs at 600mA Indefinite depending on capacity of power source
Operating temperature range
-20 to +400C (-4 to +1040F) NOTE: battery capacity reduces at low temperatures
Connectors
• 2 x shrouded 4mm output sockets
• 1 x multi-pole charger and external power socket
OPERATOR’S MANUAL
23 Issue 4-04 – US 1207

Leaders in Pipeline Survey Systems
4. OPERATION
4.1. Introduction
This section describes the C-Scan Pipeline Survey System model 2010 in normal operation by using a detailed familiarisation practice session in the System’s built-in DEMO MODE. Please refer to the accompanying SURVEY PROCEDURE manual for more detailed information 4.1.1. Principles of Operation An electrical current applied to a well wrapped buried metal pipeline will decrease gradually with increasing distance from the current injection point, as the current escapes to earth through the wrapping. If the wrap has a uniform thickness and separates the pipe from the surrounding soil at all points, the strength of the signal current on the pipe will decline logarithmically, and the rate of decline will be dependant primarily on the electrical resistivity of the wrap or coating in use, and the area of wrap in contact with the soil per unit length of pipe (i.e. for a given coating, the decline is proportional to the circumference of the pipe).[Note: because of the relative magnitude of the resistances involved, local changes in soil resistance can usually be ignored]. If there is a low resistance electrical path from the pipe direct to the soil at any point, there will be a substantial local increase in the rate of loss of signal current. Such a low resistance path could arise from: incorrectly applied wrapping, mechanical damage to the wrap before, during or after installation, decay of the wrap due to soil conditions, disbonding of the wrap from the pipe (provided that ground water has penetrated into the gap to provide an electrical path to earth), or a leak in the pipe itself causing the wrap to fail at the leak point. Because the resistance of such a path is likely to be several orders of magnitude less than the resistance of the undamaged wrap, the resultant loss of current, even from a single small fault of a few square millimetres, can usually be detected by a significant increase in the apparent rate of current decline over quite a long length of pipe. In practice, the existence of one or two small faults on a section of pipeline several hundred metres in length can usually be tolerated because the Cathodic Protection System can be expected to prevent serious corrosion developing quickly. In this case it may not be necessary to locate the specific faults immediately but the rate of logarithmic decline of current between two specific points can be logged for future reference so that any deterioration of the condition of the pipeline can be monitored. [Note: the logarithmic rate of decline of the current (attenuation) measured in millibels per metre (mB/m), is effectively independent of the applied current and is only marginally affected by seasonal changes in soil resistivity, so that it is virtually an absolute indication of the average condition of the wrap between two given points at the date of the survey].
OPERATOR’S MANUAL
24 Issue 4-04 – US 1207
If the attenuation level over a given section of pipeline is particularly high, serious faults (or a large number of small faults) in the protective wrap are indicated. Intermediate readings of attenuation levels can be taken to identify the worst sections, and the precise location of faults (generally to an accuracy of 3-6 feet) can be determined by recording and plotting the actual current levels at close intervals (6-32 feet) over the suspect section and noting those places where the rate of current decline is steepest. The most serious faults can then be excavated and repaired.

Leaders in Pipeline Survey Systems
4.2. Demo Mode Demo Mode enables all functions within the C-Scan model 2010 to be simulated. Four ‘standard’ surveys have been stored in the unit’s memory. The tables below show the data for these surveys: Survey 1 Current Depth Latitude Longitude Distance 163.4 4' 2" 44N29.534' 012W02.850' 0’ 156.6 4' 0" 44N29.485' 012W03.050' 213’ 88.52 4' 4" 44N29.467' 012W03.150' 72’ 85.91 4' 0" 44N29.44' 012W03.300' 229’ 85.38 3' 5" 44N29.43' 012W03.384' 82’ 55.91 4' 1" 44N29.424' 012W03.539' 65’ 52.64 3' 8" 44N29.424' 012W03.700'' 190’ Survey 2 Current Depth Latitude Longitude Distance 415.5 6' 3" 44N29.534' 012W02.850' 0’ 21.44 5' 3" 44N29.485' 012W03.050' 1049’ 13.64 5' 10" 44N29.467' 012W03.150' 492’ 10.44 5' 2" 44N29.440' 012W03.300' 656’ 9.97 6' 5" 44N29.430' 012W03.384' 426’ 5.79 5' 7" 44N29.424' 012W03.539' 656’ Survey 3 Current Depth Latitude Longitude Distance 30.00 3' 0" 44N29.534' 012W02.850' 0’ 21.44 5' 3" 44N29.485' 012W03.050' 1049’ 13.64 5' 10" 44N29.467' 012W03.150' 492’ 10.44 5' 2" 44N29.44' 012W03.300' 656’ 9.97 6' 5" 44N29.43' 012W03.384' 426’ 5.79 5' 7" 44N29.424' 012W03.539' 656’ Survey 4 Current Depth Latitude Longitude Distance 400 3' 3" Choose 380 3' 11" Choose 360 9' 10" Choose 300 11' 6" Choose 290 9' 10" Choose Each survey has different characteristics. Survey 1 to Survey 3 has GPS co-ordinates; Survey 4 does not have GPS co-ordinates and requires manual entry. Note: Demo Mode data may differ from that shown, but not significantly.
OPERATOR’S MANUAL
25 Issue 4-04 – US 1207

Leaders in Pipeline Survey Systems
4.2.1 Starting DEMO MODE Switch on the C-SCAN: Press
Press Menu
Press SETUP
Press Demo Screen will show DEMO ON Press X to return to main screen. NOTE: since we are in DEMO mode GPS cannot be used. The main screen will now show “Demonstration ON” above the C-SCAN 2010 message.
OPERATOR’S MANUAL
26 Issue 4-04 – US 1207

Leaders in Pipeline Survey Systems
Now the detector is in Demo Mode, go back to QUICK START in Section 2.3.2 on page 14 and follow the instructions. (It may help to have a photocopy of the survey lists) When you have gone through the Survey 1 data and have just completed the last point (Current 52.64, depth1.11) and are happy with the controls, come back to this point for more details. We have now completed the first ‘virtual’ survey. In a real situation, a surveyor may do a number of surveys before downloading the data. As the first survey is complete, we now need to know how to create a ‘new’ survey. The start screen should be shown and still be in Demo Mode: if it isn’t, re-select Demo Mode as explained above.
4.3. Creating a new survey As before, wait until the detector is overhead and press the CALCULATE key. When the calculation is done and stored, the following display is shown.
This is the point at which a new survey is created. The START POINT key ( ) defines the new survey. Press it now.
The display will jump straight to the START POINT screen. You will see that the pipeline key has re-appeared. This is because a new survey has been started. Once the new pipeline details have been entered (along with any visual references ) press the store key [ ].
OPERATOR’S MANUAL
27 Issue 4-04 – US 1207

Leaders in Pipeline Survey Systems
Final confirmation is required before a new survey is started. Pressing the tick will start the new survey and store the new point. You will automatically revert to the main startup screen.
Continue the survey. NOTE: on the next SEARCH screen the survey number has been incremented to S#01 (the first survey is survey S#00). The point counter increments and does not reset to zero. Referring to the survey list, continue through to Survey 4. Note that on Survey 4 there is no GPS data. You can choose your own distances to see how the effect of distance changes the readings (try negative distances – this indicates a change of direction in surveying. If you need to go over this again, go to the CLEAR MEMORY menu and start again. Continue doing this until you are happy with the controls and procedure. NOTE: Switching off disables Demo Mode. The readings made during Demo are still retained in memory.
4.4. Notes on entering distances The distance that is entered is crucial to calculating the correct attenuation, hence It is very important that this value is correct. Remember that the distance entered relates to pipeline distance, not the direct distance between two points. If two successive points are taken around a bend in a pipe and GPS is being used, it is important to enter the pipeline distance and NOT use the GPS distance, as this will cause an error.
OPERATOR’S MANUAL
28 Issue 4-04 – US 1207

Leaders in Pipeline Survey Systems
Due to magnetic field distortion (the operating design of C-Scan relies on magnetic field) at bends of more than 300, reliable readings cannot be taken at sharp bends - see the Survey Procedure manual. The table below shows the error for two readings taken 100ft either side of a bend with different angles if a direct line is taken. Bend angle Pipeline Distance Direct distance % error
0 100 100 010 100 100 020 100 98 230 101 97 340 102 94 750 103 91 1160 104 87 1670 105 82 2180 106 77 2790 107 71 33
To produce a positive (+ve) attenuation, the reading taken must be less than (<) the last reading AND the distance must be positive (+ve). If the distance is negative (-ve), the attenuation will be negative. A negative attenuation is hard to visualise in relation to positive attenuations, but the main rule of thumb is: Going away from the generator distances are positive (+ve). Going towards the generator distances are negative (-ve)
There are three ways of entering distance. The first two we already know – GPS and direct distance i.e. the distance between points. The third way is chainage.
4.5. Chainage Chainage is the term given to incremental distance from the survey start point. As an example, a survey has 4 points taken 100 apart. The chainage would be: Point Distance Chainage #00 0 0 #01 100 100 #02 100 200 #03 100 300
This can make it easier to reference if CP points have distance values. To use Chainage rather than distance, use the chainage key as shown below.
OPERATOR’S MANUAL
29 Issue 4-04 – US 1207

Leaders in Pipeline Survey Systems
Screen 1: Distance Screen 2: Chainage
Chainage start point
Select distance button to enter distance screen (screen 1 – opposite)
Start Point
Select Chainage button to enter chainage screen (screen 2 – opposite)
OPERATOR’S MANUAL
30 Issue 4-04 – US 1207

Leaders in Pipeline Survey Systems
NOTE: We may freely switch between CHAINAGE and DISTANCE. When we enter a distance, the chainage is automatically stored (it is displayed on the attenuation display). The chainage start point is used to start a new survey. This point does not have to be zero. As an example, consider a survey of four points. The first point is at CP marker 10 which has a distance marker of 3678 and the last point is at CP marker 11 which has a distance marker of 3978. The two intermediate points are 100 apart. Point CP number Line distance distance chainage #00 10 3678 3678 #01 - - 100 3778 #02 - - 100 3878 #03 11 3978 - 3978
Point #00 is entered as a chainage start point with a value of 3678 Points #01 and #02 are entered as distance from previous point as 100 Point #03 is entered as chainage 3978. Select CHAINAGE Press this key to go to Select DISTANCE Press this key to go to START POINT CHAINAGE start point.
4.6. Direction change within a survey There are occasions where a survey is proceeding and every point surveyed is producing good results i.e. attenuations less than 1 mB/m. But then a section is encountered that has a high attenuation (say 10 mB/m). If the gap between each point has been 300’ we do not know where the fault that has caused the high attenuation is within the last 300’. So we need to go back to a point half way. Remember that going towards the generator is a negative distance. The diagram below explains the method. As the attenuation reading between points #03 and #04 is back to a normal level (0.73mb/m) we know that the fault must lie between points #02 and #04 If GPS is being used, remember to enter a minus for the distance (GPS has no concept of direction). If chainage is being used, just enter the chainage (no sign). Chainage inherently works out the position correctly.
OPERATOR’S MANUAL
31 Issue 4-04 – US 1207

Leaders in Pipeline Survey Systems
But what is the attenuation value between #02 and #04? To see this we need to look at the graphs in more detail. Choose the attenuation graph. The graph on the left shows attenuation as the points were gathered (sequenced in time). The graph on the right shows the points sequenced for chainage. To switch between the two, press
300ft 150ft
Use the ‘◄# and #►’ arrow keys to choose a section of the survey. As we can see the attenuation between #02 and #04 is 19.25 mB/m. Clear the memory and run the demo again. This time do not use GPS and enter distances manually using negative distances and see how the graphs change.
4.7. Notes on Graphs It is inconvenient to have to store a point to view the graphs of a survey. There is another way, however, using the BROWSE mode. From the start screen press MENU. If a survey is in progress or a previous survey has been started (i.e. there is data in the memory), the menu screen will display the BROWSE key:
OPERATOR’S M AL
32 Issue 4-04 – US 1207
ANU

Leaders in Pipeline Survey Systems
NOTE: The BROWSE key only appears as available if the memory is not empty.
Press the BROWSE key and the following screen appears:
Use the ◄# and #►arrow keys to select which survey to display, then press the tick key. The survey number is shown (S#000) and the survey points are also shown (#000 -#006) Once you have selected your chosen survey, you can view the stored information as you would during a survey – GPS plot (if used), attenuation plot, current plot and depth plot.
OPERATOR’S MANUAL
33 Issue 4-04 – US 1207

Leaders in Pipeline Survey Systems
4.8. Close Interval Survey When a normal survey is proceeding, it is desirable to find the position of a fault. Close interval mode is used to pin-point a fault to within +/-3ft (or better depending on conditions). NOTE: Normal attenuation readings have no meaning when the distance interval is less than 40ft. This is because small distances create large attenuations on small current changes – this effectively makes the attenuation values difficult to interpret. The Close Interval mode uses current only to map a section of pipeline. To start a close interval survey enter the search screen as normal ( ) and locate the pipeline as normal, but rather than press the calculate key ( ), press the key marked ‘close’. This will reveal the following screen:
The close interval mode takes readings at set intervals. These intervals are chosen by the user by selecting the appropriate distance (in this case 15’). It is important that the readings are taken at the chosen intervals, otherwise errors will occur.
After selecting the interval, the following screen is shown. This displays the calculated current in real-time for each point. As the reading is taken, a dot is displayed on the graph. Check the unit is overhead (use circle and overhead bars as before). Press the calculate key( ) and after taking 300 samples, the graph changes to a vertical bar showing the maximum, minimum and average current readings taken for this point – this is shown on the following screen (several readings have been taken):
3.9f
OPERATOR’S MANUAL
34 Issue 4-04 – US 1207

Leaders in Pipeline Survey Systems
The UP and DOWN keys allow zooming in on the graph. Press X to ignore the sample and retake the reading. Press the to accept the reading. Move along the pipeline the next interval point (in this case 15’) and use the circle and overhead bars at the top of the screen to ensure you are correctly sited over the pipeline. When you are ready to take the next reading press the calculate key [ ] as before and the survey continues.
3.9f
The survey may continue for as far as necessary. The graph will auto-scale to fit the points. When enough points have been taken and you wish to finish the close interval survey, press STOP. The following screen will be shown.
Press the store key [ ] to finish the close interval survey. Pressing X will not delete any data but will allow you to continue with the close interval survey.
3.9f
Refer to the Survey Procedure Manual on how to interpret the close interval readings.
Note: during close interval surveying, the attenuation values and GPS
positions are not calculated. After pressing the store key, the screen will revert to the search screen.
OPERATOR’S MANUAL
35 Issue 4-04 – US 1207

Leaders in Pipeline Survey Systems
4.9. Notes on GPS GPS is an abbreviation for Global Positioning System. There are 24 satellites in low-earth orbit. The GPS receiver in C-Scan receives data from a number of these (maximum 12) depending on which satellites are ‘in-view’. When the GPS unit is first turned on, the GPS unit attempts to acquire the satellites ‘in-view’. Acquisition times vary from 10 seconds to 45 minutes. If the detector has been moved a large distance or it is the first time the detector has been used it is more likely that the acquisition time will be nearer to 45 minutes. It is important that the detector (with GPS ON) be switched on for at least 15 minutes after a position is displayed. This will ensure a fast turn-on next time.
The minimum number of satellites needed to calculate a position is 3. The more satellites that are acquired, the more accurate the displayed data will be.
It is very important to check whether the position displayed is the current position. This can be checked by pressing GPS SAT key in the search screen. This will show the GPS status and the number of satellites acquired. In the example (above right) the status is GPS:GOOD SAT:#6. If GPS: BAD is shown it means that the current position is incorrect, or that the satellites have not been acquired or have lost acquisition. If GPS: OLD is shown it means that the data is more than 10 seconds out of date. As the data is normally updated every 1 second, this could mean that acquisition is about to be lost. If a point is stored with a BAD or OLD GPS position, the position displayed is likely to be that of the previous point. This would create a distance of zero. C-Scan picks up on this and will not allow the operator to use the GPS position; however, it will be recorded. The operator must then enter the distance manually, or go back to the SEARCH screen and wait for acquisition.
OPERATOR’S MANUAL
36 Issue 4-04 – US 1207
Loss of GPS acquisition is usually caused by the antennae being temporarily obscured; either by buildings or being inside a vehicle. If the GPS has been on since a good position indication, the re-acquisition time is a few seconds.

Leaders in Pipeline Survey Systems
When a survey is conducted in the open where the operator walks between survey points, it would make sense not to turn off the unit; however, this reduces battery life. A power saving mode has been introduced that enables the GPS unit to remain on whilst all other devices are switched off. To enter this mode press the ON-Off key, If the GPS is on when this is done, a message will be shown enabling the unit to be switched to Power-Save mode. This occurs only if the GPS has been on prior to switching off. The unit will switch off completely after 30 minutes in standby. A Red LED indicates that the GPS is still active, it does not indicate valid data! (Version 2 or higher only).
4.10. Battery Life/Power modes The power consumption of the C-SCAN 2010 varies depending on use. This can be split into a number of categories. The tables below show the categories plus power consumption. Switching the main switch to OFF will disconnect the batteries. It is recommended that the main switch be set to OFF during storage or shipping. Supplied Nickel Cadmium (Ni-Cd or NiMH) rechargeable batteries (fully charged 4.5Ahr) Mode System GPS Antennae Consumption Time Survey (GPS) ON ON ON 650mA 5 hours Survey (no GPS) ON OFF ON 450mA 8 hours Standby OFF ON OFF 150mA 23 hours Non-survey ON OFF OFF 60mA 4 days Off OFF OFF OFF <3mA 4 months Alkaline type batteries. Mode System GPS Antennae Consumption Time Survey (GPS) ON ON ON 650mA 12 hours Survey (no GPS) ON OFF ON 450mA 17 hours Standby OFF ON OFF 150mA 2 days Non-survey ON OFF OFF 60mA 11 weeks Off OFF OFF OFF <3mA 1 year These times are continuous. In a real survey, the times will not be continuous. Realistically the maximum survey time is 50 hours on one charge (more if using Duracells) for non-GPS surveys, and 30 hours for GPS survey. At a maximum of 6 hours per day survey this will give 8 days and 5 days respectively.
OPERATOR’S MANUAL
37 Issue 4-04 – US 1207

Leaders in Pipeline Survey Systems
There are messages that are displayed to tell the user which part of C-Scan is active. This can be summarised at the start screen
Antennae OFF
Antennae ON
All menu functions switch off the Antennae. Similarly, if the unit has been idle on the START screen for more than 3 minutes, the antennae is switched off. (On initial switch on, the antennae is off until the search key is pressed). The whole unit switches off after 5 minutes. If the GPS is on and the unit is at the START screen, the unit will switch off 5 minutes after acquisition. If the unit is left ON in the SEARCH screen, it will remain on until the batteries are exhausted.
Battery level is indicated by the 93% symbol. Values can range from 0% to 110%. 0% indicates the batteries are exhausted and the unit will automatically switch off. The batteries should be charged at this point. Low battery will be indicated at 5%. This is sufficient to do one short survey!
OPERATOR’S MANUAL
38 Issue 4-04 – US 1207

Leaders in Pipeline Survey Systems
4.11. PRINTING OUT A SURVEY
After a survey has been completed it is probable that a printed report is required. There are two methods for doing this: 1. Use any PC based terminal program (e.g. Hyperterminal with windows). 2. Use DCAPP for Excel, provided with the system. 3. Use DCAPP 2010
The C-SCAN 2010 provides serial output in a text-based format. Using a terminal program just gives a table of survey results. However if DCAPP is used, this will convert the table data into a full report with graphs of, depth, attenuation, current and where used, GPS position. To download using DCAPP first ensure DCAPP is installed on your computer (see DCAPP reference manual). Once installed start DCAPP and connect the external connector (black socket below battery compartment) to the PC COM port with the cable supplied. From the start screen, press the Download key
The screen will show the ‘compatibility’ screen.
Three keys are displayed. These enable download to a PC running various packages. C-SCAN 2000 – This is used for download to DCAPP for Excel. DCAPP for Excel is designed to be backwards compatible with C-SCAN 2000 systems. C-SCAN 2000 compatibility should only be used if DCAPP for Excel is being used Start DCAPP for Excel and on the download prompt, press C-SCAN 2000 key. After download, the screen will revert to the startup screen. This key may also be used if Microsoft Hyperteminal is being used or any terminal software.
OPERATOR’S MANUAL
39 Issue 4-04 – US 1207

Leaders in Pipeline Survey Systems
Print Cnvrt The key ‘Print cnvrt’ allows data to be paced correctly for a Patton electronics (www.patton.com) model 2029 serial-to-parallel converter, for direct connection to a parallel printer. Use this key when using the converter. DO NOT use the other keys. As a printer expects line-feeds, using the other keys will print out on ONE line. NOTE: This interface is not guaranteed to work with all printers, it is recommended to use DCAPP instead. After download, the screen will revert to the startup screen. C-SCAN 2010 The key C-SCAN 2010 allows data to be downloaded to DCAPP 2010. Note that DCAPP 2010 will accept any of the downloads selected. Start DCAPP 2010, connect C-SCAN and click the DL button on DCAPP 2010, then press C-SCAN 2010 on the keypad. After download, the screen will revert to the startup screen. NOTE: DCAPP 2010 may not be supplied with your system. If this is the case, use DCAPP for Excel. NOTE: If after download, DCAPP reports ‘no data’ check your regional settings on your PC. The decimal separator should be ‘.’ or ‘,’. Any other character will report ‘no data’. See Survey Procedure Manual for more details on DCAPP. Unlike C-SCAN 2000 systems, the data remains in memory and a new survey will continue from the last survey point stored. The 2010 can store 500 survey points split over 100 surveys, so it is unlikely that a surveyor will run out of memory. However, it is recommended that the memory is cleared after successful download (unless a survey is continuing). Note that pipeline details, diameter etc., will also be cleared.
OPERATOR’S MANUAL
40 Issue 4-04 – US 1207

Leaders in Pipeline Survey Systems
4.12. Clearing Memory To clear all memory locations (erase data) press menu from the start up screen, then press clear. (‘Browse’ key may appear if a survey is in memory)
Press YES ( ) to erase all data, Pressing NO (X) will abort and all data will remain in memory.
OPERATOR’S MANUAL
41 Issue 4-04 – US 1207