lead assignment analysis report - home | university of ... · lead assignment analysis report 2016...
TRANSCRIPT

Lead Assignment Analysis
Report
2016
UT SYSTEM INTERNSHIP PROJECT SALLY SUN
M. D. ANDERSON CANCER CENTER | DEVELOPMENT OFFICE

Lead Assignment Analysis Sally Sun
P a g e 1 | 17
Table of Contents Abstract ......................................................................................................................................................... 2
1. Introduction .......................................................................................................................................... 2
2. Identify Unassigned Leads .................................................................................................................... 3
3. Pyramid Distribution ............................................................................................................................. 4
4. Tabulation Analysis ............................................................................................................................... 5
4.1 Tabulation 1 ........................................................................................................................................ 6
4.2 Tabulation 2 ........................................................................................................................................ 7
4.3 Tabulation 3 and Tabulation 4 ............................................................................................................ 8
4.4 Tabulation 5 ........................................................................................................................................ 9
5. Conclusions ........................................................................................................................................... 9
Appendix ..................................................................................................................................................... 10
Lead Assignment Analysis Sally Sun
P a g e 2 | 17
Lead Assignment Analysis
Abstract This report presents a new approach of perceiving lead assignment selection criteria, offering possibilities
to capture maximum qualified constituents for lead assignment. The whole analysis starts with identifying
the pool of donors not assigned as lead in Fiscal Year 2016 in Development Activity Report, followed by
dividing the pool into nine subsets based on their FY 2016 giving amount and giving capacity. In each
subset, the deeper analysis is performed by searching into possible data indicators that could claim
responsibility for the ignorance of being placed into lead pipeline. Finding such parameter threshold is
beneficial for future reference in twofold:
to ascertain the capture of all qualified constituents for lead assignment
to acquire the missing constituents for further research with a system modification in SAP
Business Objects XI
1. Introduction Performing data mining in Monroe, the database of Development Office in MD Anderson Cancer Center,
enables the finding of differences in the Tracking Row in each record. Such differences indicate certain
group of constituents in the data set are assigned as lead rather than other group, the lead assignment is
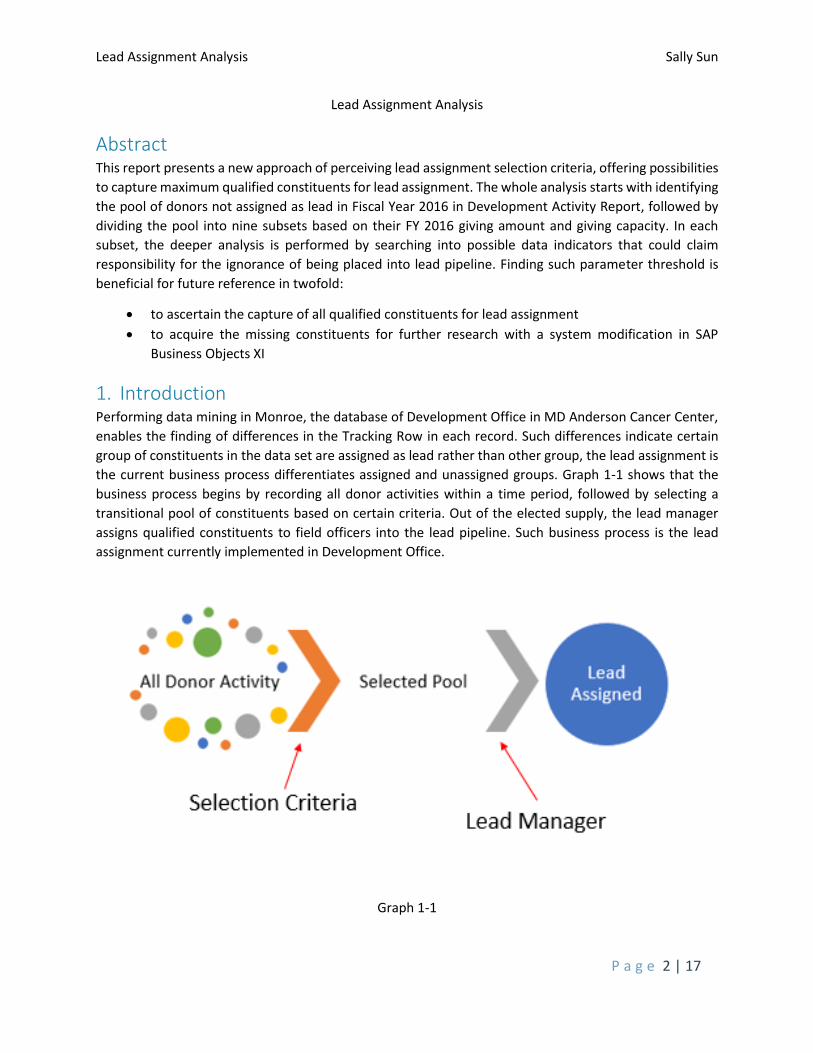
the current business process differentiates assigned and unassigned groups. Graph 1-1 shows that the
business process begins by recording all donor activities within a time period, followed by selecting a
transitional pool of constituents based on certain criteria. Out of the elected supply, the lead manager
assigns qualified constituents to field officers into the lead pipeline. Such business process is the lead
assignment currently implemented in Development Office.
Graph 1-1

Lead Assignment Analysis Sally Sun
P a g e 3 | 17
The current selection criteria for MG lead assignment states as:
• $100K-$999K capacity and MG Likelihood Score Top 5% or better
• $1M+ capacity regardless of MG Likelihood Score
It demonstrates lead assignment is primarily grounded on two variables—Giving Capacity and MG
Likelihood. Giving capacity is computed as a percentage of constituents’ wealth, provided by screening
vendor. The vendor screens public records databases every week, such as real estate property records,
financial investments records, as well as compensation records depending on the position in the company
they work for, then calculates the giving capacity with the profile listing all the available records; The other
variable, MG likelihood is the outcome of MG Logistic Model1, a binary logistic regression model where
59 dependent variables input and the outcome being a probability score, range from 0% to 100%. It was
populated in Feb. 2016 in SPSS, top 5% of the MG Likelihood Score in the selection criteria signifies
constituents with a very strong giving probability.
Having these two dimensional criteria, it is possible that lead manager would ignore fairly decent leads
with screened giving capacity not satisfying the minimum of $100K, or constituents with high giving
capacity but low intention for making a gift. If development office keeps missing leads, it is essentially
necessary to explore the reasons, and more specifically, detect possible data indicators through the
navigation of missing population so that improvement with parameter modification of business process
can be accomplished.
2. Identify Unassigned Leads To acquire a comprehensive understanding of other possible methods for lead recognition, it is crucial to
identify constituents being excluded from lead assignment in FY 20162 in the first stage. In BOXI,
Development Activity Report lists 170,182 donor activity records in FY 2016, Graph 2-1 maps out the
exclusion of irrelevant groups of constituents.
Anonymous donors
Gifts-In-Kind donors
Tribute
Zipped constituents
Constituents with an existing prospect and lead relationship in Tracking Row
Other CAE types than individual
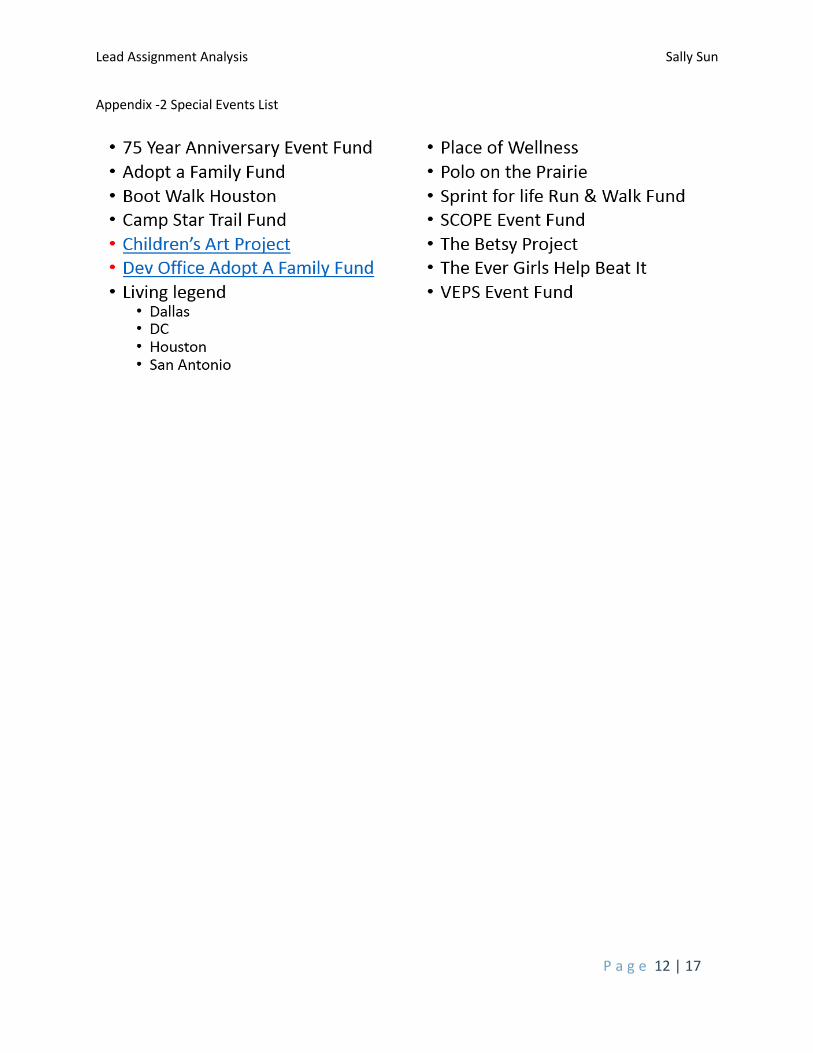
Special event donors3
1 See Appendix-4 for details of MG Logistic Model establishment; 2 Being aware of the fact that Monroe is an open access database recording on-going transactions every day, the time period is extracted from Sep. 1st, 2015 to Jun. 23rd, 2016 as FY 2016 for analysis purpose of this project; 3 See Appendix-2 Table A-2 for the special event list;

Lead Assignment Analysis Sally Sun
P a g e 4 | 17
With overall 170,182 records in Development Activity Report in FY 2016, these exclusions4 narrow the size
of population down to 102,439. It contains all the unassigned leads in FY 2016, designating the target
dataset this analysis report is mainly conducted on.
Graph 2-1
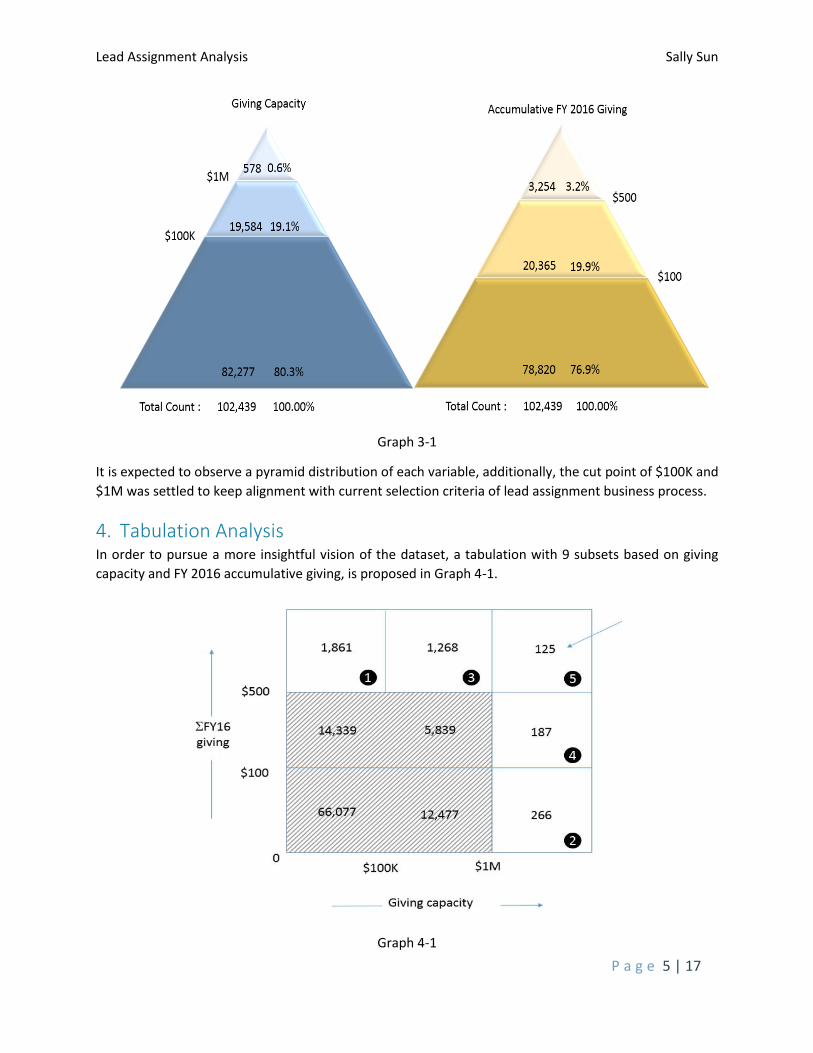
3. Pyramid Distribution To start the analysis, understanding major reasons of 102,439 constituents being neglected entails a
thorough insight of frequency distribution of related variables, Graph 3-1 reveals the distribution of such
variables as giving capacity and accumulative FY 2016 giving.
4 See Appendix -1 Table A-1 for filter exclusion details;
Lead Assignment Analysis Sally Sun
P a g e 5 | 17
Graph 3-1
It is expected to observe a pyramid distribution of each variable, additionally, the cut point of $100K and
$1M was settled to keep alignment with current selection criteria of lead assignment business process.
4. Tabulation Analysis In order to pursue a more insightful vision of the dataset, a tabulation with 9 subsets based on giving
capacity and FY 2016 accumulative giving, is proposed in Graph 4-1.
Graph 4-1
Lead Assignment Analysis Sally Sun
P a g e 6 | 17
It is convincing to acclaim the ignorance of constituents in shaded tabulations in Graph 4-1 from lead
pipeline, because of the size and feasibility constraint, key analysis should be focused on other tabulations.
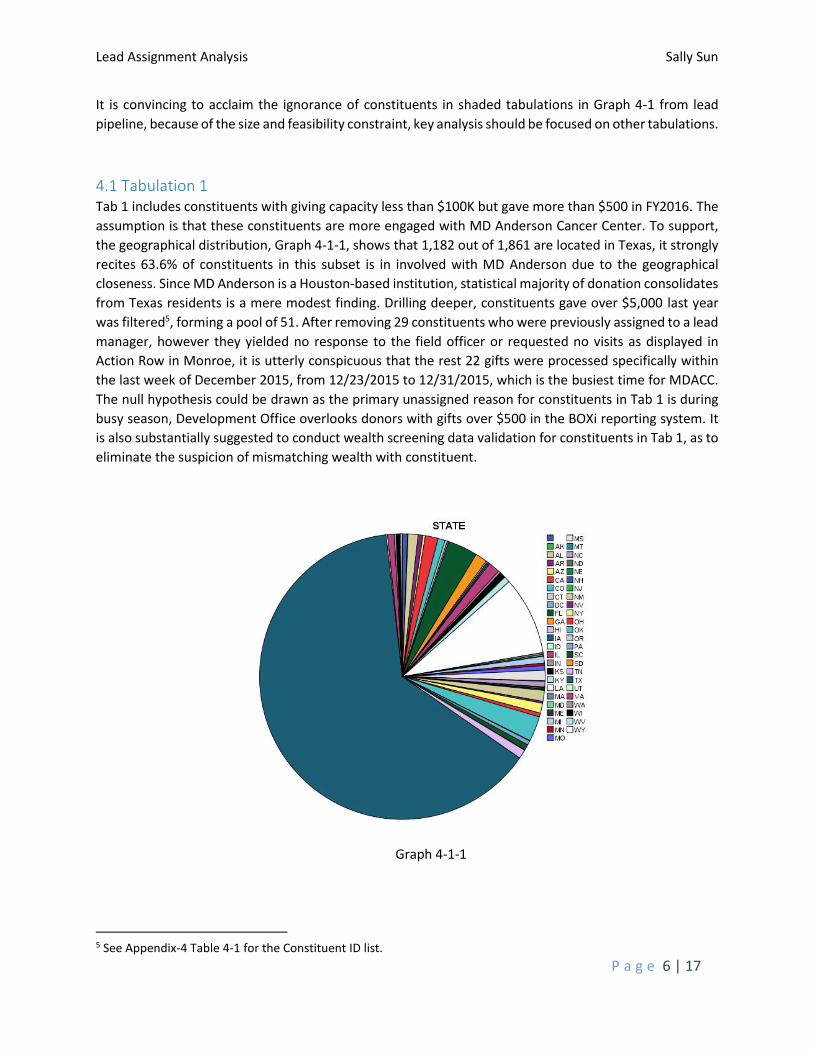
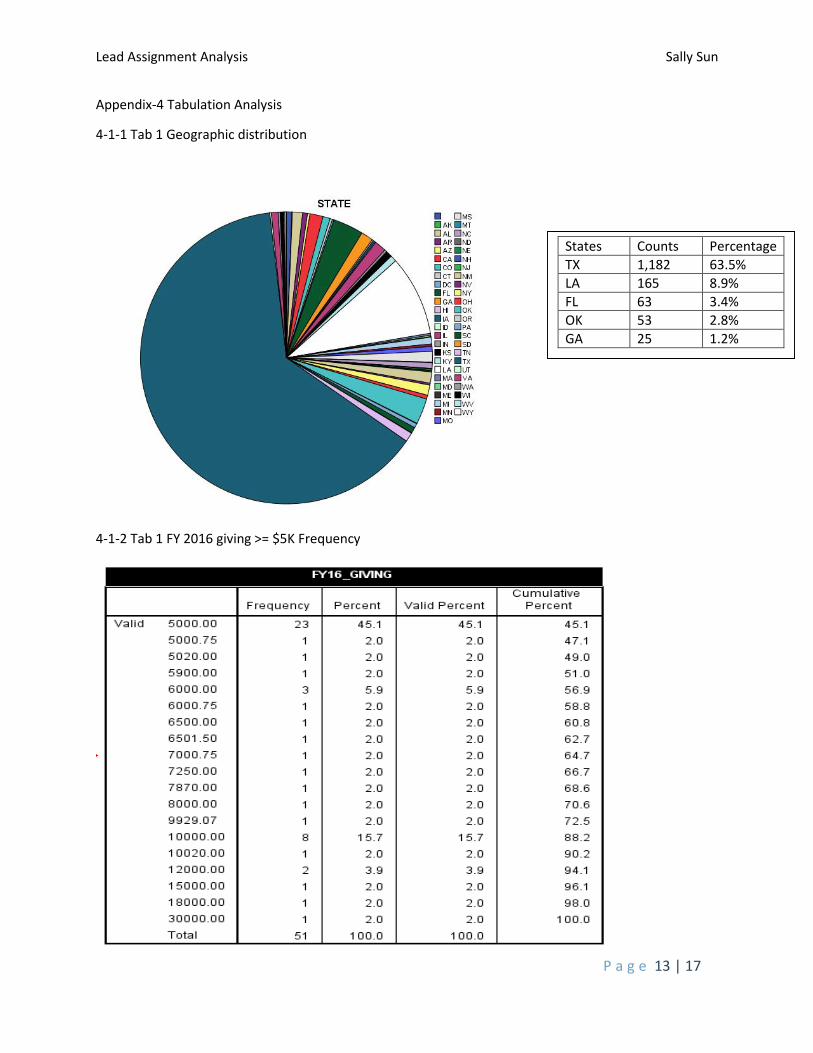
4.1 Tabulation 1 Tab 1 includes constituents with giving capacity less than $100K but gave more than $500 in FY2016. The
assumption is that these constituents are more engaged with MD Anderson Cancer Center. To support,
the geographical distribution, Graph 4-1-1, shows that 1,182 out of 1,861 are located in Texas, it strongly
recites 63.6% of constituents in this subset is in involved with MD Anderson due to the geographical
closeness. Since MD Anderson is a Houston-based institution, statistical majority of donation consolidates
from Texas residents is a mere modest finding. Drilling deeper, constituents gave over $5,000 last year
was filtered5, forming a pool of 51. After removing 29 constituents who were previously assigned to a lead
manager, however they yielded no response to the field officer or requested no visits as displayed in
Action Row in Monroe, it is utterly conspicuous that the rest 22 gifts were processed specifically within
the last week of December 2015, from 12/23/2015 to 12/31/2015, which is the busiest time for MDACC.
The null hypothesis could be drawn as the primary unassigned reason for constituents in Tab 1 is during
busy season, Development Office overlooks donors with gifts over $500 in the BOXi reporting system. It
is also substantially suggested to conduct wealth screening data validation for constituents in Tab 1, as to
eliminate the suspicion of mismatching wealth with constituent.
Graph 4-1-1
5 See Appendix-4 Table 4-1 for the Constituent ID list.

Lead Assignment Analysis Sally Sun
P a g e 7 | 17
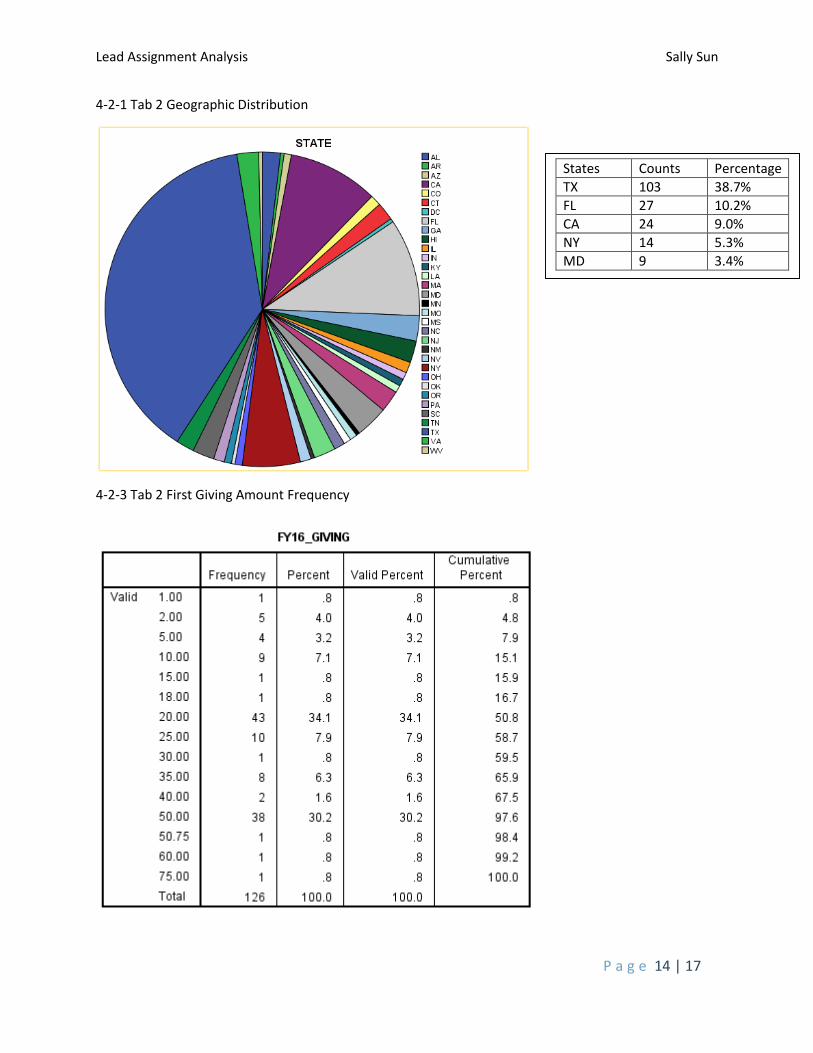
4.2 Tabulation 2 Tab 2 comprises rather qualifying constituents with high giving capacity but gave less than $100 in FY
2016. As current lead assignment selection criteria, all constituents with giving capacity over $1M should
be incorporated as lead, the assumption of exclusion for 266 constituents in this subset is they random
donation to MDACC without hearing of the institution and their residency shares a lower closeness with
Texas or neighboring states. To examine, 103 out of 266 in the subset are geographically associated with
a Texas home address6, and out of those 29 are located in Houston. A comparatively lower percentage of
38.7% certainly describes the contributing factor of geographic closeness as in having a Texas address.
Rather interestingly, 152 out of 269 in the population donated in the last two fiscal year, denotes the gift
made in FY 2015 or FY 2016 is their first interaction with MDACC. Following the time stamp, Graph 4-2-1
introduces the frequency of their first gift amount, all spanning under $75. Therefore, it is not hard to
formulate the hypothesis for Tab 2, the two primary reasons for unassigned lead recognition:
Being first time donor in FY2016
Insufficient Donation amount
As first time interaction with any institution, psychological human nature explains the limited giving
amount due to uncertainty of future involvement. However, failure of capturing lead recognition
continuously in this subset would result in a considerable loss for field officers.
Graph 4-2-1
6 See Appendix 4-2-1 Geographic Distribution

Lead Assignment Analysis Sally Sun
P a g e 8 | 17
4.3 Tabulation 3 and Tabulation 4 These two tabulations contain a mixed population with a moderately better condition than other subsets,
among all the variables, the MG Probability Range frequency in Graph 4-3-1 powerfully conveys the core
assumption of this report, current lead assignment process is continuously losing decent constituents. To
be more specific, Tab 3 consists of constituents whose giving capacity is more than $100K but lower than
$1M, yet who gave more than $500 in FY 2016. It is appalling to observe 845 out of 1,268 constituents,
counting for 68.9% of the subset, falls into the population of Top 5% of MG Likelihood Score. Graph 4-3-2
yields the similar distribution of MG Likelihood Score for constituents in Tab 4, constituents manifesting a
high likelihood of giving in above subsets are being ignored from the pipeline ultimately because of their
last giving amount7is lower than $500. It is rather an obvious finding of last giving amount constraints
qualified lead from being listed in pipeline with the current selection criteria.
Graph 4-3-1
7 See Appendix 4-3-3 for frequency of last giving amount.

Lead Assignment Analysis Sally Sun
P a g e 9 | 17
Graph 4-3-2
4.4 Tabulation 5 Tab 5 covers constituents with giving capacity over $1M and FY 2016 giving over $500, they should
definitely be arranged into lead pipeline. Fortunately, by checking the records back in Monroe, the
majority witnesses a new table in the Tracking Row with lead manager assignment beginning the first
week of July.
5. Conclusions This report provides a new methodology for lead assignment recognition. Instead of two variables forming
the dimensions to filter leads on giving capacity and likelihood of giving, it establishes a matrix with nine
tabulations referred to giving capacity and accumulative giving of Fiscal Year 2016. In each subset, specific
analysis is conducted and tailored strategies are elaborated. By testifying variables in differentiated
subset, possible data indicators disturbing the lead assignment business process are located:
• First Time Giving Amount
• Year of First Gift
• Busy Season
• Last gift amount
Discovering above parameter threshold would undeniably contribute to ascertain the seizure of potential
constituents for lead assignment and prospect management, as well as consolidating incentives for future
research in SAP Business Objects XI system modification.

Lead Assignment Analysis Sally Sun
P a g e 10 | 17
Appendix
Appendix-1 Data Preprocessing parameter index
Variable name/Tab name
size comments source
DAR_FY16 170,182 All donor activity from Sep.1st ,2015 to Jun. 23rd ,2016
BOXI [As effective of Jun. 23rd, 2016]
CAE-I 163,506 Filtering out only Individual in FY16 DAR_FY2016.xlsx
GIK removed 163,389 Taking out Gift-In-Kind donors DAR_FY2016.xlsx
Event 4,484 Identifying all the special events—14 kinds
DAR_FY2016.xlsx
Event removed 158,905 Special events of above 14 kinds taken out
DAR_FY2016.xlsx
FY16_IG 158,905 During FY16, IDs of individual donors qualifying for lead recognition
DAR_FY2016.xlsx
FY16_IG 158,905 Merged into spss
2016-0624.sav
Giv_Veh_LeadIDs 24 Leads who are associated with giving vehicles
Giv_Veh_LeadIDs.txt
LeadIDs_FY16 2,019 Individuals who are assigned as leads in FY 2016
LeadIDs_FY16.txt
Spouse_LeadIDs 940 Individuals whose spouse are assigned as leads in FY2016
Spouse_LeadIDs.txt
LEAD_SUM 2,973 Constituents assigned as lead in FY2016 from above three qualification standard
2016-0624.sav [As effect of Jun 17th 2016]
AD 30 Anonymous Donors being taken out AD.txt
Tribute_INDI 9285 Constituents with a tribute relation in Monroe
Tribute_donors.txt
Prosp_GivVeh_IDs 785 Constituents who are associated with a giving vehicle whose in a relationship with a prospect manager
Prosp_GivVeh_IDs.txt
Prosp_Spouse_IDs 1,647 Constituents whose spouse is in a relationship with a prospect manager
Prosp_Spouse_IDs.txt
Prospect_IDs 4,383 Constituents in a relationship with a prospect manager
Prospect_IDs.txt
Prosp_SUM 6,043 Constituents assigned to prospect manager in FY2016 from above three qualification standard
2016-0624.sav
ZIP_IDs 4,419 Constituents whose rating relation is zipped in Monroe
Zip_IDs.txt
ZIP_gvIDs 157 Constituents who are associated with zipped giving vehicle
Zip_gvIDs.txt
Lead Assignment Analysis Sally Sun
P a g e 11 | 17
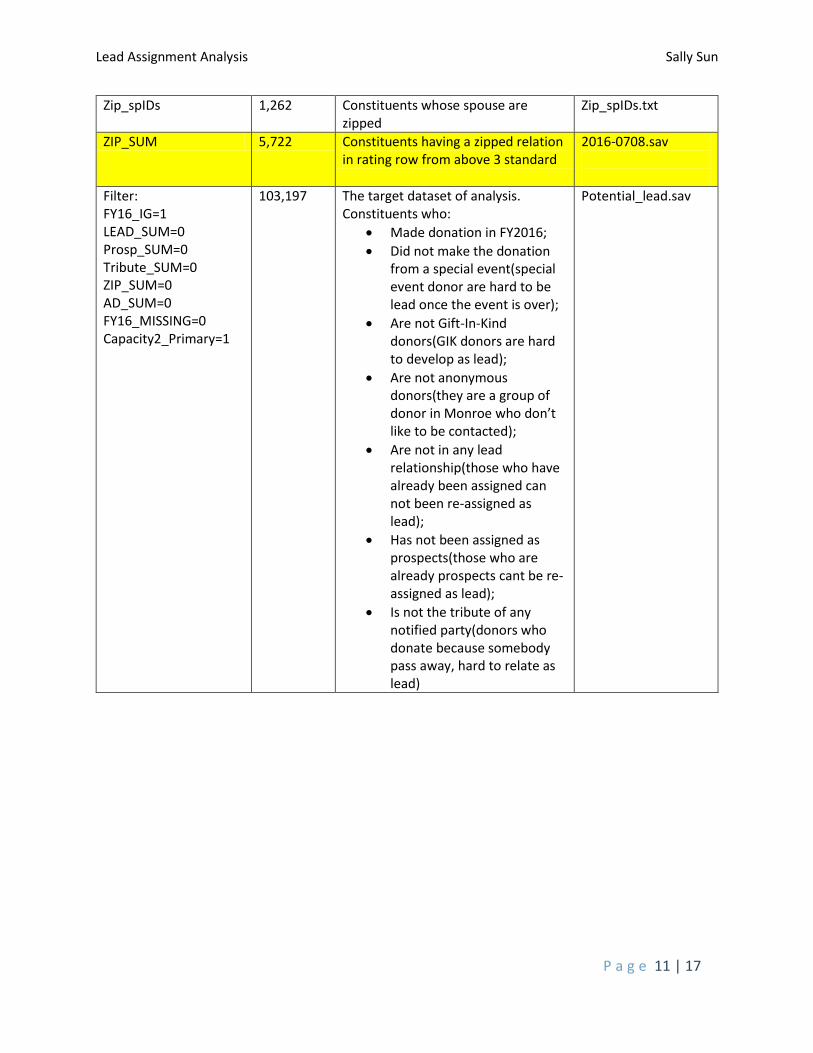
Zip_spIDs 1,262 Constituents whose spouse are zipped
Zip_spIDs.txt
ZIP_SUM 5,722 Constituents having a zipped relation in rating row from above 3 standard
2016-0708.sav
Filter: FY16_IG=1 LEAD_SUM=0 Prosp_SUM=0 Tribute_SUM=0 ZIP_SUM=0 AD_SUM=0 FY16_MISSING=0 Capacity2_Primary=1
103,197 The target dataset of analysis. Constituents who:
Made donation in FY2016;
Did not make the donation from a special event(special event donor are hard to be lead once the event is over);
Are not Gift-In-Kind donors(GIK donors are hard to develop as lead);
Are not anonymous donors(they are a group of donor in Monroe who don’t like to be contacted);
Are not in any lead relationship(those who have already been assigned can not been re-assigned as lead);
Has not been assigned as prospects(those who are already prospects cant be re-assigned as lead);
Is not the tribute of any notified party(donors who donate because somebody pass away, hard to relate as lead)
Potential_lead.sav
Lead Assignment Analysis Sally Sun
P a g e 12 | 17
Appendix -2 Special Events List
Lead Assignment Analysis Sally Sun
P a g e 13 | 17
Appendix-4 Tabulation Analysis
4-1-1 Tab 1 Geographic distribution
4-1-2 Tab 1 FY 2016 giving >= $5K Frequency
States Counts Percentage
TX 1,182 63.5%
LA 165 8.9%
FL 63 3.4%
OK 53 2.8%
GA 25 1.2%
Lead Assignment Analysis Sally Sun
P a g e 14 | 17
4-2-1 Tab 2 Geographic Distribution
4-2-3 Tab 2 First Giving Amount Frequency
States Counts Percentage
TX 103 38.7%
FL 27 10.2%
CA 24 9.0%
NY 14 5.3%
MD 9 3.4%

Lead Assignment Analysis Sally Sun
P a g e 15 | 17
4-2-2 Tab 2 First Year Giving Frequency

Lead Assignment Analysis Sally Sun
P a g e 16 | 17
4-3-1 Tab 3 MG Probability Range Frequency
4-3-2 Tab 4 MG Probability Range Frequency
MG Likelihood Score Top 5%:
845 68.9%
MG Likelihood Score lower 95%:
382 31.1%
MG Likelihood Score lower 95%:
69 38.5%
MG Likelihood Score Top 5%:
110 61.5%

Lead Assignment Analysis Sally Sun
P a g e 17 | 17
4-3-3 Tab 4 Frequency of last giving amount of constituents with MG_Prob_Range [4,9]