leaching of lead and other heavy metals from brass ...939003/fulltext01.pdfÖrebro university school...
TRANSCRIPT

Örebro University School of Science and Technology Chemistry C Degree Project, 15 ECTS Jan 2016
Leaching of Lead and Other Heavy Metals from Brass Couplings
under Different Hydrochemical Conditions
Author: Torgny Jernberg
Supervisor: Viktor Sjöberg
Department of Science and Technology
Örebro University
Örebro, Sweden

i
Abstract Brass couplings are used in most piping systems for tap water. The alloy contain a variety of metal
composition, amongst these metals lead is included. Lead is a toxic metal that can leach from brass
when it is in contact with aqueous solutions. There are several physical and chemical conditions that
affect the leaching of lead. Stagnation time, material composition and water quality are some of
these conditions.
The aim of this project is to generate a dataset that can be used for evaluation of the leaching of
heavy metals from brass couplings during different hydrochemical conditions. By exposing brass
couplings to synthetic waters various properties, analyse the results and comparing these to limits
set by approval procedures it is possible to obtain a prediction on how the brass couplings might
leach lead when installed in tap water systems. Results shows that at least one of the brass couplings
included in this test could be unfit for usage in drinking water system installations.

ii
Table of content Abstract ............................................................................................................................................................ i
1. Introduction ................................................................................................................................................. 1
1.1 The composition of brass ...................................................................................................................... 1
1.2 Lead ....................................................................................................................................................... 1
1.3 Some factors that affect leaching ......................................................................................................... 2
1.4 Nordic Building Regulations Committee 13 and 12/18 ......................................................................... 2
1.5 Limit of Lead leakage in tap water installation products ...................................................................... 3
1.6 The assignment ..................................................................................................................................... 3
1.7 Aim ........................................................................................................................................................ 3
2. Method ........................................................................................................................................................ 4
2.1 Couplings and valves ............................................................................................................................. 4
2.2 Instrumentation .................................................................................................................................... 4
2.3 Preparation ........................................................................................................................................... 5
2.4 Part one – Hydrochemical effects on leaching ...................................................................................... 6
2.5 Part two – Quantity of dissolved heavy metals .................................................................................... 6
3. Results ......................................................................................................................................................... 8
3.1 The first test– Hydrochemical effects on leaching of lead .................................................................... 8
3.2 The second test– Quantity of dissolved lead ...................................................................................... 11
3.3 Leaching of other heavy metals from brass couplings ........................................................................ 16
4. Discussion .................................................................................................................................................. 19
4.1 Hydrochemical effects on leaching of lead from brass couplings ....................................................... 19
4.2 Quantity of dissolved lead from brass couplings ................................................................................ 19
4.3 Leaching of other heavy metals .......................................................................................................... 20
5. Conclusion ................................................................................................................................................. 21
6. References ................................................................................................................................................. 22

1
1. Introduction In most piping systems for tap water there are couplings made out of brass. When water comes in
contact with these brass materials they may deteriorate and leach heavy metals into the drinking
water. Depending on the composition of the brass, the leaching of metals will correlate to it (Lytle
and Schock 1996). As a result, couplings from different manufacturers will show different leaching
patterns of unfavourable metals in the passing water. This is because manufacturers, most likely,
have different mixtures of brass both between themselves and between their batches. However, not
only does the composition of the brass coupling determine the leaching of metals, other essential
factors are e.g. contact time, temperature and pH (Lytle and Schock 1996)
1.1 The composition of brass
Brass is an alloy made from copper mixed with zinc (Lytle and Schock 1996). Other elements such as
iron, aluminium, lead, tin, and nickel can also be included. Zinc is soluble in copper and is added to
increase the tensile strength of the alloy, making it harder to break. However, brass can deteriorate
and undergo dezincification, leaching of zinc, if too much zinc is added to the alloy (Dudi, A. et al.
2005). Elemental lead is added to improve the machinability of brass during casting. Since higher
quantities of lead globules are located towards the surface area, even if a low percentage of lead is
added in the mixture it could result in a high leakage when in contact with media such as water. Tin is
added to increase the corrosion resistance of the brass by hardening it. In other words, it is
protecting the brass from acidic media. Other elements such as thallium, cadmium and chromium
might also be present as a result of contamination or impure raw materials. It is important to be
aware of these kinds of contamination because even small amounts of heavy metal trace elements
could be toxic to humans (Thambavani and Uma 2013). Some of the heavy metals that are found in
drinking water and are often linked to poisoning are e.g. Cu, Zn, Pb, Cd and Cr
1.2 Lead
Lead is an unfavourable metal that may leach from low quality brass couplings (Dudi, A.et al 2005).
Low quality brass couplings are such that have a high tendency to contaminate water due to the
material being weak or soft. Due to the toxicity of lead, the National Food Agency, Sweden
(Livsmedelsverket) has set the limit of lead in drinking water from the tap to 10µg/litre (SLVFS
2001:30). This limit is based on the average weekly intake of drinking water. Assuming that the
average daily intake of water is 3 litres, the daily intake of lead from drinking water is equal to the
concentration of lead in the drinking water multiplied by 3 (the volume of water consumed. If the
concentration of lead in the drinking water is equal to the limit of 10µg/litre, the maximum daily
intake of lead from drinking water would be 30µg. There are also regulations for how materials and
charles that are used for food processing, are allowed to leach lead. Ceramic materials are allowed to
leach up to 4mg/litre lead (IVSFS 2011:7).
The daily intake of lead is predicted to 0.2-0.8µg/kg/day according to the National Food Agency,
Sweden and Efsa(SLVFS 2001:30, Efsa, 2010). Amongst other effects to the human body, severe
kidney failure can be caused by high doses of lead. The awareness of lead toxicity has increased
during the last two decades. A study showed that as a result the blood lead levels in children have
decreased from (in 1987) 60µg/l to (in 2007) below 13µg/l (Strömberg, U et al. 2008). Another study
states that If the levels of lead blood lead concentration reaches 800µg/l in children (1000µg/l for
adults) acute encephalopathy, brain damage, can occur (Gidlow, D.A. 2015). This study also mentions

2
other effects that lead can have on the human body, such as reproductive toxicology, renal
dysfunction and suppressed immunology.
A correlation between lead concentrations in drinking water and blood lead concentrations has been
confirmed (Edwards, M et al. 2009). By increasing the concentration of lead in the drinking water,
blood lead concentrations will also increase. This is the reason why it is important to prevent lead
from reaching drinking water.
1.3 Some factors that affect leaching
Depending on chemical and physical conditions during leaching, different concentrations of metals
will be released from the couplings. These conditions are e.g.
- Contact time when the water is not flushed through the coupling. If water is flowing through the
coupling the equilibrium of metals between the solid phase and the liquid phase will have less time
to stabilize and vice versa.
- Time of usage is described as the period in which the coupling is used in a water system and is
exposed.
- Material composition is what the alloy is composed of and material processing is how the
components are processed during production. Consequently, if the alloy has a larger quantity of an
unwanted element it would be more likely for it to leach (Lytle and Schock 1996). Impact of
processing could be e.g. the time of cooling after casting of the coupling which can affect the
element structure in the alloy.
- The geometry affects the leaching since a rougher coupling has a larger area in contact with the
water and will leach more metals.
- The water quality might be the most important factor besides the composition and the processing
of the coupling. By changing the water properties the leaching of the metals could vary. With
different pH in the water a corrosion might affect the leaching of metals from the couplings and
fluctuations in the concentrations of leaching metals occur (Lytle and Schock 1996). High ion strength
in the water could result in saturation of ions in the solution and thus prevent leaching.
1.4 Nordic Building Regulations Committee 13 and 12/18
Nordic Building Regulations Committee (NKB) 12, 13 and 18 are approval procedures and test
protocols for metal compression fittings and stop valves for copper tubes in water supply
installations that are implemented by the four Nordic countries Sweden, Norway, Denmark and
Finland since 1989 and 1990. These tests are also referred to as “Nordtest” (Lytle and Schock 1996).
The guidelines contain several tests that the fittings or stop valves must pass in order to be approved
according to the NKB. Some of these tests include stress corrosion, leakproofness of water under
internal hydraulic pressure, dezincification resistance as well as quantities of dissolved heavy metals
(cadmium and lead).
Regarding the quantities of dissolved heavy metals the test procedure that is used is as follows:
Appropriate plugs that suit the fittings/valves were selected. The products were then washed with
methanol to remove fatty acids then water was passed through the product for 1 hour with a flow of
0.3 – 0.4 litres/second to clean it. The product was then half filled with synthetic tap water and
plugged and then shaken for approximately 30 seconds and the water was removed. After
immediately refilling the product with synthetic tap water it was plugged and made sure not to

3
contain any air. The water was left in the product for 24 hours and then replaced with new synthetic
tap water. Partial replacement of the water was then carried out once every 24 hours making sure
that the volume replaced was constant during every extraction (±10%). The samples taken from day
9 and 10 were then analysed for Cd and Pb (NKB 18).
1.5 Limit of Lead leakage in tap water installation products
There are limits for how much lead valves and couplings in tap water systems are allowed to release.
The limits are set with a reference to the dimensions of the different products and are calculated
from the maximum leaching limit of lead, which is 5 µg/litre, with correlation to the inner diameter
of the coupling (DN) (BFS 2014:3 BBR 21).
Valves are tested according to NKB 13. The formula for calculating the limit of lead leakage for valves
is: 5/25 × valve inner diameter. This gives the following limits:
DN 10 = 2.0 µg
DN 15 = 3.0 µg
DN 20 = 4.0 µg
DN 25 = 5.0 µg
Couplings are tested according to NKB 12/18. The formula for calculating the limit of lead leakage for
couplings is: 5/28 × coupling inner diameter. This gives the following limits:
DN 15 = 2.7 µg
DN 18 = 3.2 µg
DN 22 = 3.9 µg
DN 28 = 5.0 µg
1.6 The assignment
This project was designed in cooperation with Ahlsell Sverige AB who wanted to know if some of
their products, designed for water installation, are leaching metals into the water systems and if so,
how much. They also requested comparative data that could be used as a risk assessment for
prediction of the leaching of metals from their products and therefore would be more or less
favourable for installation in water systems.
Several types of brass couplings were analysed and the results were compared with regulations set
by the “Nordic Committee on Building regulations” (NKB). Depending on the type of coupling and
their expected future use, data from NKB 13 or NKB 12/18 was used.
1.7 Aim
This project was mainly focused on comparing how different hydrochemical conditions affect the
leaching of metals in different but similar types of couplings. Additionally, tests were made to
determine if the leaching was within the limits for lead release when in contact with these
conditions. It was also the intention of measure the quantity of eventual other leaching heavy
metals.
4
2. Method The laboratory tests in this project were divided into two parts. In the first part the leaching of
unfavourable metals over time was examined. In the second part, the metal release from different
brass couplings was compared. The metals analysed were: Pb, Cd, Tl, Cr, Al, V, Cu, Zn, Ni and U.
2.1 Couplings and valves
The products that were acquired from Ahlsell Sverige AB are shown in table 1.
Table 1. The evaluated products to be analysed with article number, description, number of items available and their given code name.
Art.nr Code name Type of product Dimension Number of products
“1111112” KB Valve DN 32 10
“1111113” kb Valve DN 25 9
4510234 kg Valve DN 25 12
4510273 KG Valve DN 32 12
2436038 T t-coupling DN 25 16
1984236 t t-coupling DN 15 16
1926103 n coupling DN 15 4
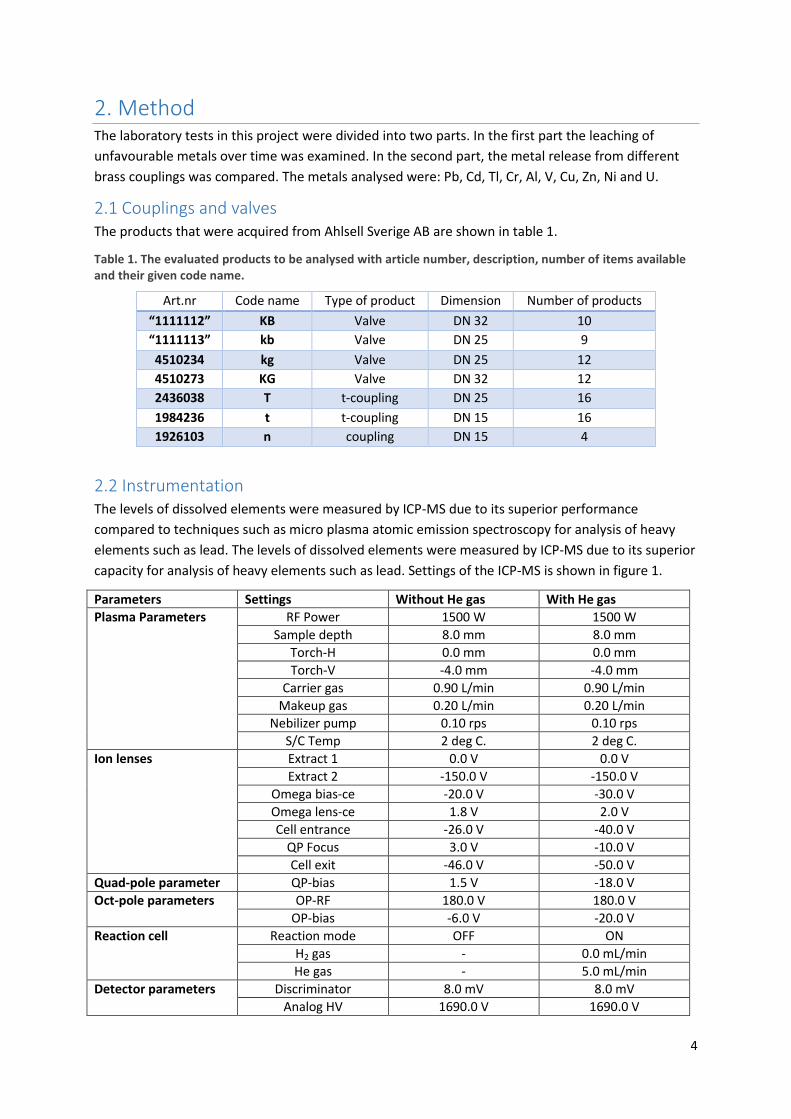
2.2 Instrumentation The levels of dissolved elements were measured by ICP-MS due to its superior performance
compared to techniques such as micro plasma atomic emission spectroscopy for analysis of heavy
elements such as lead. The levels of dissolved elements were measured by ICP-MS due to its superior
capacity for analysis of heavy elements such as lead. Settings of the ICP-MS is shown in figure 1.
Parameters Settings Without He gas With He gas
Plasma Parameters RF Power 1500 W 1500 W
Sample depth 8.0 mm 8.0 mm
Torch-H 0.0 mm 0.0 mm
Torch-V -4.0 mm -4.0 mm
Carrier gas 0.90 L/min 0.90 L/min
Makeup gas 0.20 L/min 0.20 L/min Nebilizer pump 0.10 rps 0.10 rps
S/C Temp 2 deg C. 2 deg C.
Ion lenses Extract 1 0.0 V 0.0 V
Extract 2 -150.0 V -150.0 V
Omega bias-ce -20.0 V -30.0 V
Omega lens-ce 1.8 V 2.0 V
Cell entrance -26.0 V -40.0 V
QP Focus 3.0 V -10.0 V
Cell exit -46.0 V -50.0 V
Quad-pole parameter QP-bias 1.5 V -18.0 V
Oct-pole parameters OP-RF 180.0 V 180.0 V
OP-bias -6.0 V -20.0 V
Reaction cell Reaction mode OFF ON
H2 gas - 0.0 mL/min
He gas - 5.0 mL/min
Detector parameters Discriminator 8.0 mV 8.0 mV
Analog HV 1690.0 V 1690.0 V

5
Pulse HV 1130.0 V 1130.0 V
To measure pH a Metrohm (6.0257.000) probe with temperature correction was used. Before use it
was calibrated against standard solution of pH 7.00 and 4.00.
2.3 Preparation
The focus of this project is to determine how unfavourable metals tend to leach from brass couplings
during different hydrochemical conditions. The idea was to get an overview on how different types of
water would affect the leaching properties of the brass couplings. Four types of tap water were
prepared using regular tap water as a base. Acidic, alkaline, water with high ion strength and regular
tap water were prepared and used for testing.
Regular tap water: Tap water was taken from a tap at Örebro University in Örebro, Sweden. The
producer of this water is Skråmsta vattenverk. The water was collected after the water had flowed
for a few hours. The water was stored in plastic containers made of polypropylene and its pH was
measured.
Acidic tap water: The acidic tap water that was prepared from tap water with an addition of
hydrogen chloride. The acid was chosen since chloride is a week complexing agent for some metal
cations. Since many private well owners have a varying pH in their wells from pH 5-9 (JRVsystem
2016) the pH of the synthetic tap water was set to 5.5(±0.01).
Alkaline tap water: The alkaline water was prepared as the acidic water but with the addition of
sodium carbonate to increase the pH. The selection of base was made to keep the components of the
water as natural as possible. The highest limit for pH in drinking water is 9 (SLVFS 2001:30.),
therefore the pH of the synthetic alkaline water was set to 8.99(±0.01).
Tap water with high ion strength: The aqueous solution was prepared by adding sodium perchlorate
to the tap water, making the resulting concentration, 1mM. Sodium perchlorate was chosen since it
is an even weaker complexing agent, compared to HCl. The pH changed slightly with the addition of
ions and was measured to 8.24(±0.01).

6
2.4 Part one – Hydrochemical effects on leaching The first test included four types of couplings (1111113(kb), 1926103(n), 2436038(T) and 1984236(t).
See table and figure 1. The aim of this test was to test how much metals the couplings leach over
time. Water was added to the couplings and a subvolume was withdrawn after different times.
Figure 1. The couplings selected for the first test. Product from left to right are: 1111113(kb), 2436038(T), 1984236(t), and 1926103(n).
Four couplings of each type were washed with acetone to dissolve possible organic compound in the
couplings and the couplings (1111113(kb), 2436038(T) and 1984236(t) were sealed with fitting plugs
of stainless steel, apart from the top part of the coupling (so that sampling was made possible).
These couplings were sealed with plumber´s hemp and paste (a common fitting technique used by
plumbers) A paste is applied to the thread of the couplings along with hemp to prevent leakage from
the openings of the couplings. Couplings with article number 1926103(n) did not have proper fitting
plugs and therefore did not go through this part. The four types of synthetic water, with known
volume, were added and filled the couplings except for those 1926103(n) that were put in test tubes
and submerged in the different water types. The first sampling was made after 3 hours. A volume of
100µl of the water from within each coupling were extracted and put into separate Sarstedt tubes.
The samples were diluted 20 times and acidified with nitric acid (1% of total volume). Rhodium was
added as an internal standard to the samples (1% of total volume). The couplings were left to leach
until the 6th hour, when the second sampling was made, with the same procedure as for the 3rd hour.
Samplings were also made for the 9th, 12th, after 26.5 hours, 30.5 hours, 33.5 hours and the 106th
hour. The levels of leached metals from the couplings were then measured with ICP-MS. Control of
the pH was made after the samplings. No replicates were made in this test due to the lack of number
of couplings at the time. Additional couplings were acquired for the second test.
2.5 Part two – Quantity of dissolved heavy metals
From the results of the first test a strategy was developed to determine the quantity of metals that
leach from the couplings after six hours of exposure to the synthetic tap water.
The second test involved six types of couplings (art. 1111113(kb), 1111112(KB), 4510234(kg),
4510273(KG), 2436038(T) and 1984236(t). See table 1.). Replicates for each type were made and the
couplings which had an odd number of quantity, were randomized (table 3).

7
Table 2. Number of replicates for the different couplings in the second test
Article numbers of the selected couplings, dimension
1111112(KB), DN 32
1111113(kb), DN 25
4510234(kg), DN 25
4510273(KG) DN 32
2436038(T), DN 25
1984236(t), DN 15
Water type Number of replicates
Regular 2 1 3 3 3 3
Acidic 3 2 3 3 3 3
Alkaline 3 1 3 3 3 3
High ion strength
2 1 3 3 3 3
The couplings where washed with acetone and sealed with fitting plugs of stainless steel with
plumbers hemp and paste. The synthetic water types were added in known volumes to fill the
different couplings. The first sampling was made after six hours. Two ml of water was pipetted from
each coupling and put into separate Sarstedt tubes. The remaining water in the couplings was
removed, new synthetic water was added and the couplings were left to leach until next coming
extraction. Replicates for the six hour sampling were made. Additionally, one sampling was made
after 17 hours and another one after 18 hours. Pipetted water was filtered if needed (criteria was
visible particles in the sample) and acidified with nitric acid (1% of the total volume). Rhodium was
added as an internal standard to the samples (1% of total volume). The levels of leached metals from
the couplings were then measured with ICP-MS.

8
3. Results The data obtained from the measurements was processed and is shown in the following figures and
table. Table 3 shows the initial concentrations of measured cations in the four types of tap water,
before they were added to the couplings. The cations are ordered according to concentration, with
the highest concentrations at the top. The concentration lowers downwards in the table.
Table 3. Measured initial concentrations (µg/l) of cations in the different water types
Elements Regular tap water
Acidic tap water
Alkaline tap water
Tap water with high ion strength
43 Ca 982.223 1000.444 597.730 993.615
23 Na 272.405 272.149 964.833 1483.986
24 Mg 97.695 97.851 96.124 97.736
39 K 64.919 73.938 66.565 63.657
88 Sr 1.628 1.622 1.420 1.638
63 Cu 0.812 1.320 0.409 0.736
66 Zn 0.189 0.350 0.058 0.118
60 Ni 0.058 0.314 0.095 0.228
208 Pb 0.009 0.008 0.009 0.008
53 Cr <0.039 <0.039 <0.039 <0.039
111 Cd <0.006 <0.006 <0.006 <0.006
205 Tl <0,001 <0.001 <0.001 0.001
3.1 The first test– Hydrochemical effects on leaching of lead In figure 2 concentrations of lead in µg/l over time are shown for the different types of water in
contact with article 2436038(T). A high concentration of lead can be seen for the acidic tap water
during the first hours with a maximum of approximately 250 µg/l. The concentration lowers towards
the end. The other water types contain lower concentrations in the beginning, starting at about 50
µg/l but increase towards the end. All water types have peaks or have rising concentration at the 6th
hour.

9
Figure 2. Results of leaching of lead in article 2436038(T) over time for the four types of tap water
In figure 3 the concentration of lead over time is shown for article 1984236(t). The acidic tap water
contain higher levels of lead in the first hours in comparison to the other water types, but towards
the end regular tap water contains the highest concentration at over 300 µg/l. All water types have
increasing lead concentration at the 6th hour.
Figure 3. Results of leaching of lead in article 1984236(t) over time for the four types of tap water
Figure 4 includes the concentrations of lead in the water types that has been in contact with article
1111113(kb). Acidic tap water has the highest concentration in all extractions with a maximum of
0
50
100
150
200
250
300
0 20 40 60 80 100 120
Co
nc.
(µ
g/l)
Time (h)
art. 2436038(T) Pb µg/l
Regular tapwater
Acidic tapwater
Alkaline tapwater
Tap waterwith highion strength
0
50
100
150
200
250
300
350
0 20 40 60 80 100 120
Co
nc.
(µ
g/l)
Time (h)
art. 1984236(t) Pb µg/l
Regular tapwater
Acidic tapwater
Alkaline tapwater
Tap waterwith highion strength

10
160µg/l. Towards the end the concentration lowers for acidic and regular tap water but increases for
alkaline and tap water with high ion strength. At the 6th hour the concentration increases for all
water types except for the acidic tap water which dales.
Figure 4. Results of leaching of lead in article 1111113(kb) over time for the four types of tap water
Regarding the concentrations of lead in extractions for article 1926103(n), they all increase at the 6th
hour and the acidic tap water has the highest concentration of over 800 µg/l at the 9th hour(table 5).
The concentration lowers at the end in all the waters except for the alkaline tap water.
Figure 5. Results of leaching of lead for article 1926103(n) over time for the four types of tap water
0
20
40
60
80
100
120
140
160
180
0 20 40 60 80 100 120
Co
nc.
(µ
g/l)
Time (h)
art. 1111113(kb) Pb µg/l
Regular tapwater
Acidic tapwater
Alkaline tapwater
Tap waterwith highion strength
0
100
200
300
400
500
600
700
800
900
0 20 40 60 80 100 120
Co
nc.
(µ
g/l)
Time (h)
art. 1926103(n) Pb µg/l
Regular tapwater
Acidic tapwater
Alkaline tapwater
Tap waterwith highion strength

11
Table 4 contains pH measurements that were made after the last extraction in the first test. It also
includes the initial pH of the tap water before it was added into the different couplings
Table 4. Change of pH for the water in contact with the couplings after the first test was completed.
Measurement site 1926103(n) 1111113(kb) 1984236(t) 2436038(T) Initial pH
pH of Regular tap water
7.47 7.89 7.34 7.42 8.18 (±0.01)
pH of acidic tap water
7.22 7.50 7.08 7.25 5.50(±0.01)
pH of alkaline tap water
7.94 7.65 7.52 7.48 8.99(±0.01)
pH of tap water with high ion strength
7.62 7.70 7.42 7.41 8.24(±0.01)
3.2 The second test– Quantity of dissolved lead
Processed data from the measurements in the second test can be seen in the following figures and
tables.
Figure 6, 7, 8 and 9 show comparable data of leached lead per area for each coupling in contact with
regular tap water, acidic tap water, alkaline tap water and tap water with high ion strength
respectively. This data can be used to compare the leaching of lead from the couplings with focus in
the brass composition.
Figure 6. Comparable data of leached lead over area of the different couplings (Pb/mm2), after six hours of
leaching in regular tap water. Data points presented are average value of the replicates made in the second test. Additionally a t-test is included with 95% confidence interval.
0
0.0002
0.0004
0.0006
0.0008
0.001
0.0012
0.0014
0.0016
0.0018
KG KB kb kg T t
Pb
/mm
2
Regular tap water

12
Figure 7. Comparable data of leached lead over area of the different couplings (Pb/mm2), after six hours of
leaching in acidic tap water. Data points presented are average value of the replicates made in the second test. Additionally a t-test is included with 95% confidence interval.
Figure 8. Comparable data of leached lead over area of the different couplings (Pb/mm2), after six hours of
leaching in alkaline tap water. Data points presented are average value of the replicates made in the second test. Additionally a t-test is included with 95% confidence interval.
0
0.001
0.002
0.003
0.004
0.005
0.006
KG KB kb kg T t
Pb
/mm
2
Acidic tap water
0
0.0002
0.0004
0.0006
0.0008
0.001
0.0012
0.0014
KG KB kb kg T t
Pb
/mm
2
Alkaline tap water

13
Figure 9. Comparable data of leached lead over area of the different couplings (Pb/mm2), after six hours of
leaching in tap water with high ion strength. Data points presented are average value of the replicates made in the second test. Additionally a t-test is included with 95% confidence interval.
Figure 10, 11, 12 and 13 Include the processed data from the second test and shows if the couplings
keep within the limit of allowed leached lead according to NKB regulations, after six hours of contact
with the different types of tap water. The products are given the number 1 to 6 in the following
order: 4510273(KG), 1111112(KB), 1111113(kb), 4510234(kg), 2436038(T) and 1984236(t). Table 5
summarizes the data from figure 7-10.
0
0.0002
0.0004
0.0006
0.0008
0.001
0.0012
0.0014
0.0016
0.0018
KG KB kb kg T t
Pb
/mm
2
Tap water with high ion strength

14
Figure 10. Data regarding the leached lead after 6 hours with regular tap water in the different couplings compared to the limit set by NKB (shown as red horizontal lines). Figure also includes data of t-test with a 95% confidence interval (shown as black data-points).
Figure 11. Data regarding the leached lead after 6 hours with acidic tap water in the different couplings compared to the limit set by NKB (shown as red horizontal lines). Figure also includes data of t-test with a 95% confidence interval (shown as black data-points).

15
Figure 12. Data regarding the leached lead after 6 hours with alkaline tap water in the different couplings compared to the limit set by NKB (shown as red horizontal lines). Figure also includes data of t-test with a 95% confidence interval (shown as black data-points).
Figure 13. Data regarding the leached lead after 6 hours with tap water with high ion strength in the different couplings compared to the limit set by NKB (shown as red horizontal lines). Figure also includes data of t-test with a 95% confidence interval (shown as black data-points).

16
Table 5. Summarized result regarding if the products exceed the leaching levels of lead in the different couplings after 6 hours, according to NKB standards, after 6 hours. Green markings indicate that the coupling do not exceed the limit. Red marking indicates that the couplings exceed the limit. Orange indicates that the product is somewhere in between or approximately the same as the limit value.
Type of water Products
Art. 1111112(KB)
Art. 1111113(kb)
Art. 4510234(kg)
Art. 1984236(t)
Art. 2436038(T)
Art. 4510273(KG)
Regular tap water Alkaline tap water Tap water with high ion strength Acidic tap water
3.3 Leaching of other heavy metals from brass couplings Table 6 includes concentrations of Cd, Tl, Cr, Al, V, Ni, Cu, Zn and U (heavy metals, other than lead
measured during analysis).
Table 6. Data regarding the total concentrations of the other heavy metals measured in the different couplings (µg/l) during analysis. The table includes concentrations from the first test as well as the second.
Element coupling Average value Mean value Max. value Min. value
Cadmium Product test 1
kb 0,026 0,023 0,275 <0.006
T 0,021 0,020 0,054 <0.006
t 0,021 0,021 0,054 <0.006
n 0,024 0,025 0,083 0,007
Product test 2
KG 0,098 0,080 0,324 0,014
KB 0,082 0,056 0,654 0,009
kb 0,093 0,070 0,264 0,008
kg 0,046 0,036 0,137 0,006
T 0,137 0,078 0,570 0,012
t 0,105 0,083 0,304 0,018
Thallium Product test 1
kb 0,102 0,084 0,685 0,011
T 0,289 0,280 0,708 0,096
t 0,454 0,460 1,044 0,065
n 1,626 1,655 2,388 0,597
Product test 2
KG 0,888 0,634 2,851 0,230
KB 0,097 0,076 0,366 0,037
kb 0,098 0,080 0,275 0,038
kg 0,070 0,055 0,190 0,031
T 0,464 0,360 1,695 0,118
t 0,826 0,647 2,489 0,180
Chromium Product test 1
kb 0,047 0,048 0,305 <0,039
T 0,051 0,049 0,184 <0,039
t 0,048 0,048 0,131 <0,039

17
n 0,085 0,088 0,139 <0,039
Product test 2
KG 0,600 0,475 2,667 0,228
KB 0,547 0,441 1,171 0,211
kb 0,627 0,355 2,236 0,199
kg 0,955 0,687 9,051 0,334
T 0,456 0,361 1,073 0,215
t 0,765 0,630 2,562 0,286
Aluminium Product test 1
kb 7,368 3,677 55,193 0,000
T 8,188 7,825 45,542 0,000
t - - - -
n - - - -
Product test 2
KG 34,298 21,381 212,585 9,019
KB 61,142 33,649 231,367 10,780
kb 71,402 30,608 655,067 5,118
kg 32,985 28,435 98,303 9,059
T 39,685 23,174 199,308 7,085
t 62,559 46,032 278,905 12,770
Vanadium Product test 1
kb - - - -
T - - - -
t - - - -
n - - - -
Product test 2
KG 0,101 0,092 0,209 0,002
KB 0,172 0,130 0,432 0,066
kb 0,204 0,134 0,724 0,070
kg 0,156 0,133 0,385 0,101
T 0,137 0,116 0,324 0,062
t 0,196 0,143 0,651 0,085
Nickel Product test 1
kb 2,228 2,006 27,339 0,571
T 2,192 1,899 19,021 0,429
t 1,331 0,608 5,856 0,000
n 1,807 1,409 9,864 0,000
Product test 2
KG 7,481 5,164 19,713 1,010
KB 6,009 4,905 16,794 0,786
kb 8,316 4,578 54,294 0,750
kg 8,342 6,291 35,120 1,671
T 6,614 5,060 17,173 0,814
t 3,589 7,352 16,372 0,000
Copper Product test 1
kb 285,202 182,982 1030,589 64,688
T 130,910 131,168 383,410 54,400
t 238,898 242,863 622,218 70,835
n 101,848 105,177 354,045 41,280
Product test 2

18
KG 144,231 94,356 364,343 24,697
KB 121,319 93,456 390,189 25,832
kb 184,321 111,258 720,855 38,831
kg 236,350 155,361 1070,060 33,038
T 377,724 293,123 1983,253 52,551
t 917,741 699,825 2921,911 129,505
Zinc Product test 1
kb 372,913 413,724 4233,659 97,427
T 334,397 186,560 4051,057 42,166
t 477,076 236,844 2023,220 36,464
n 579,845 668,754 7820,240 86,575
Product test 2
KG 226,913 141,433 1381,788 12,718
KB 1216,140 420,180 6086,987 22,889
Kb 1754,315 639,758 5240,033 37,709
Kg 284,822 170,358 930,394 22,610
T 911,036 359,974 4428,312 35,366
t 738,620 585,873 2082,013 79,553
Uranium Product test 1
kb - - - -
T - - - -
t - - - -
n - - - -
Product test 2
KG 0,381 0,392 0,501 0,160
KB 0,427 0,424 0,641 0,211
kb 0,428 0,417 0,876 0,230
kg 0,401 0,436 0,583 0,091
T 0,399 0,425 0,586 0,120
t 0,443 0,455 0,974 0,127

19
4. Discussion 4.1 Hydrochemical effects on leaching of lead from brass couplings The trend of leaching lead concentrations over time in the first test is fluctuating (which can be seen
in figure 2, 3, 4 and 5).
The pH of all the water types changed throughout the sampling time. The result of the change in pH
can be seen in table 3. The results show that the couplings either have a buffering effect on the
water it is in contact with or that the air in contact with the water neutralizes the water by formation
of carbonic acid. Therefore, it is not possible to present data on how much lead that leaked into the
water depending on the pH in this test. The change in pH would be the most probable cause of the
fluctuation in concentration and is a reliable theory and is also stated in (Lytle and Schock 1996).
It is also clear that the acidic tap water had a great impact on the leaching in the first hours but that
towards the middle and end part different types of water affected the leaching of lead in separate
ways for the different couplings. However, it is difficult to determine the outcome of results from the
first test due to the lack of replicates but it can clearly be seen that the concentrations of lead
significantly increase in some of the samples from the 106th hour. Fluctuations of concentrations of
lead in similar tests decreased and levelled out over time (after 60-70 days at pH 8.5, but still
decreasing slightly corrosive conditions after 155 days)(Lytle and Schock 1996). It seems that the
coupling that leaches the most lead over all is the coupling with article number 1926103(n) as it has
the highest leakage of lead after 6 hours, some 800 µg/l. However, this might be due to the fact that
it was not prepared as the other couplings in the method. Since it was put in a test tube and the tube
was filled with water, the result in this case does not give data for how much the coupling leak lead
in its purposed use. In reality, only a minimal part of the inside of the coupling would be in contact
with water instead of the water being in contact with the entire area of the coupling itself. This gives
a fairly good example of a worst case scenario. Overall, it is difficult to determine the exact
concentration of lead in this data, as no replicates were made in this test. Hydrochemical conditions
of the leaching water has great impact on the levels of metals diffusing from the couplings. In contact
with acidic water, the couplings leach increased levels of heavy metals.
4.2 Quantity of dissolved lead from brass couplings
In the first test all of the couplings seemed to have a concentration peak at 6 hours, (except for
coupling 1111113(kb)) and it was from this result that the extraction time for the second test was
set. After six hours it was assumed that there would not be a significant change in the pH and a
determination of leakage of lead for different types of water could be made.
In figure 6, 7, 8 and 9 there is comparable data on how much lead the different couplings leach per
area when in contact with the different types of water. It can be seen that the water type that causes
a higher concentration of leakage is, as expected, the synthetic acidic tap water. The same results
have also been shown in other tests (Lytle and Schock 1996). The water type that had least effect on
the leaching was the alkaline tap water. The water with high ion strength and regular tap water had
similar effect on the leaching. This indicates that ion strength does not affect leaching properties of
lead in this case.
Figure 10, 11, 12 and 13 shows more detailed results of the leaching for the second test and is
compared to the limits set by NKB for how much lead that is allowed to leach from the products. The
limit is included as a horizontal red line. In addition to the visible number of replicates a t-test is
shown with a 95% confidence interval.

20
After 6 hours of contact with the water product 4510273(KG), had concentrations of lead that
exceeded the limit in all four cases. Products 1111112(KB), 1111113(kb) and 4510234(kg) all had
concentrations of lead that were below the limit. Product 2436038(T) had concentration with an
average value almost exceeding the limit in all water types except for the acidic water, where it did
exceed the limit. Product 1984236(t) had concentrations of lead below the limit for all the water
types except for the acidic water where the amount of lead was approximately the same as the limit
value. A summary of this test can be seen in the results as well (table 5).
It is important to note in this test that the leaching time was 6 hours and the limit set by NKB was
after leaching for 9-10 days. By leaching for 9-10 days, a higher quantity of lead would be able to
leach from the couplings. So, for the couplings that had concentration below the NKB limit after 6
hours, there is a possibility that they would not pass a test with leaching after 9-10 days. For
determining specifically if the couplings pass the NKB standard, additional testing would need to be
made. The results obtained could be used for a background to further testing on the different
products.
4.3 Leaching of other heavy metals Other than lead, other heavy metals leached from the couplings during the tests. These heavy metals
were also measured during analysis. Some of the metals measured to low concentrations and below
the limits set by the National Food Agency, Sweden. The most interesting metals that leached are
included in table 6, these are cadmium and thallium. Cadmium is one of the metals that is listed and
has a limit value of 5 µg/l, set by the National Food Agency, Sweden. However, none of the
measurements showed concentration of cadmium that exceeded that limit. Thallium has no set limit
of concentration in food products or drinking water, this could be questionable due to its toxicity.
The toxicity is in fact similar to mercury (Karlsson, U. 2006) which has a limit of concentration in
drinking water of 1µg/l (SLVFS 2001:30). Assuming that the limit of thallium could be set
approximately to the same level as mercury, the measurements in table 5 does not exceed the limit
other than the maximum values for KG, T and t. An exception of this is the coupling n which had
measured concentration that exceeded the limit for average value as well as the maximum level. This
could be due to, as stated in 4.1 that the preparation and leaching of this product differed from the
other couplings.

21
5. Conclusion Hydrochemical conditions effect the leaching of lead and other heavy metals from brass couplings.
Acidic water, in comparison to regular water, increase the leaching of metals. The results from
measurements in this project show that at least one of the brass couplings included in the tests could
be unsuitable for usage in drinking water system installations. All couplings used in the tests leached
heavy metals into the water they were in contact with.

22
6. References
BFS 2014:3 BBR 21. Boverkets föreskrifter om ändring i verkets byggregler (2011:6) - föreskrifter och
allmänna råd.
Dudi, A., Schock, M., Murray, N., & Edwards, M. (2005). Lead leaching from inline brass devices: A critical
evaluation of the existing standard. American Water Works Association.Journal, 97(8), 66-78,12.
Edwards, M., Triantafyllidou, S. & Best, D. 2009, "Elevated blood lead in young children due to lead-
contaminated drinking water: Washington, DC, 2001-2004",Environmental science & technology, vol. 43,
no. 5, pp. 1618-1623.
Efsa, 2010. EFSA panel on contaminants in the food chain (CONTAM); scientific opinion on lead in food.
EFSA J. 8(4),1570
Gidlow, D.A. 2015, "Lead toxicity",Occupational medicine (Oxford, England), vol. 65, no. 5, pp. 348-356.
JRVsystem. Vattenanalys, vad betyder den?. http://www.jrvsystem.se/vattenanalys-
f%C3%B6rklaring.html (Hämtad 2016-01-06).
Karlsson, U., Örebro universitet & Institutionen för naturvetenskap 2006, Environmental levels of
thallium: Influence of redox properties and anthropogenic sources, Örebro universitetsbibliotek.
LIVSFS 2011:7. Livsmedelsverkets föreskrifter om material och produkter avsedda att komma i kontakt
med livsmedel
Lytle, D.A and Schock, M.R. 1996, Stagnation time, composition, pH, and orthophosphate effects on metal
leaching from brass.
SLVFS 2001:30. Livsmedelsverkets föreskrifter om dricksvatten
Strömberg, U., Lundh,T., Skerfving, S., 2008. Yearly measurements of blood lead in Swedish children since
1978: The declining trend continues in the petrol-lead-free period 1995-2007. Environ. Res. 107, 332-335
Thambavani, S.D. & Uma T S R Mageswari 2013, "A Comprehensive Geochemical Evaluation of Heavy
Metals in Drinking Water", Journal of Chemical, Biological and Physical Sciences (JCBPS), vol. 3, no. 4, pp.
2942.